MFE 658 Lecture 2a /Winter Storms MFE 658 Lecture 2a ...
27
MFE 658 Lecture 2a Midlatitude Cyclones/Winter Storms 1 MFE 658 Lecture 2a Midlatitude Cyclones, Fronts, and Related Hazards • Source of energy • Formation of Fronts • Jet Streaks/Short Waves • Interaction with Planetary Waves • Hazards associated with Winter Storms 2 Energy Source for Midlatitude Cyclones • Potential energy of the mean state is converted to kinetic energy as cold air sinks and warm air rises. • Winter storms derive their energy from temperature gradients in the form of baroclinic instability, an instability of the sheared zonal wind. • The energy source for baroclinic instability is the potential energy in the environmental flow. As the instability grows, the center of mass of the fluid is lowered. • In growing waves in the atmosphere, cold air moving downwards and equatorwards displaces the warmer air moving polewards and upwards. 3 The Definition of Energy Energy – the ability to do work Two familiar types 1. Kinetic energy – the energy of motion: K = 1/2mV 2 2. Potential energy – stored energy: P = mgh KE = 1/2 x mass x velocity 2 4
Transcript of MFE 658 Lecture 2a /Winter Storms MFE 658 Lecture 2a ...
MFE 658 Lecture 2aMidlatitude Cyclones/Winter Storms
1
MFE 658 Lecture 2aMidlatitude Cyclones, Fronts, and Related Hazards
• Source of energy
• Formation of Fronts
• Jet Streaks/Short Waves
• Interaction with Planetary Waves
• Hazards associated with Winter Storms
2
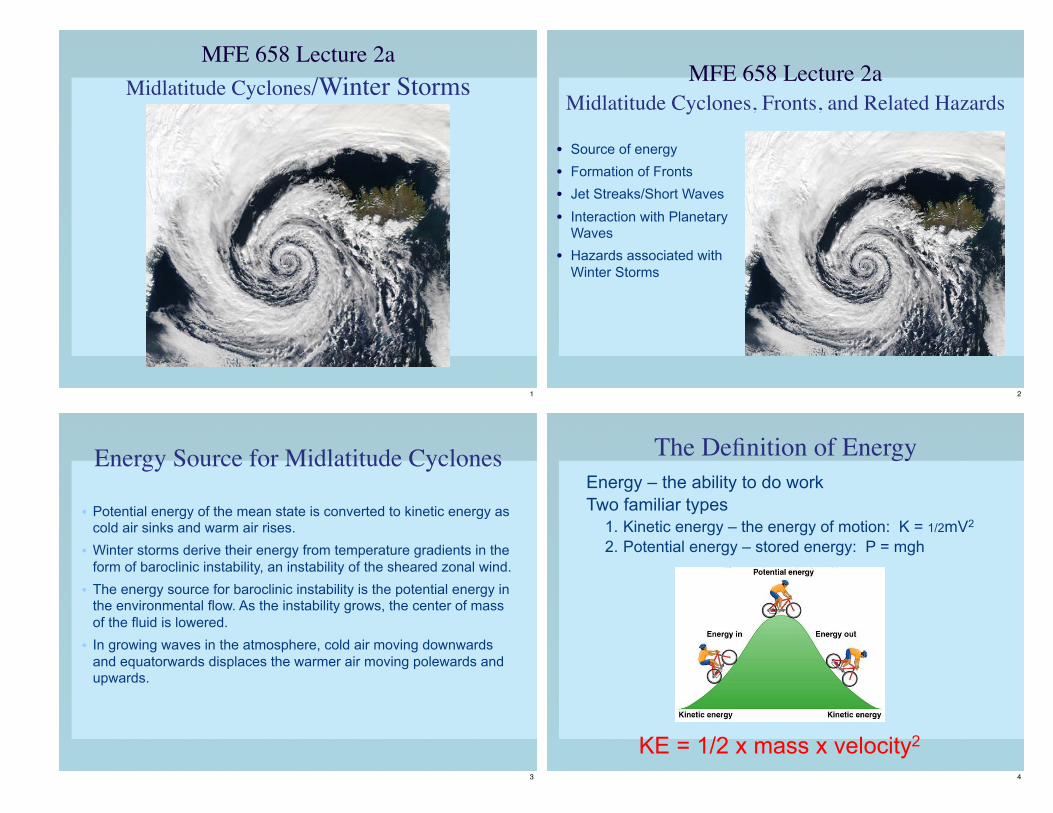
Energy Source for Midlatitude Cyclones
• Potential energy of the mean state is converted to kinetic energy as cold air sinks and warm air rises.
• Winter storms derive their energy from temperature gradients in the form of baroclinic instability, an instability of the sheared zonal wind.
• The energy source for baroclinic instability is the potential energy in the environmental flow. As the instability grows, the center of mass of the fluid is lowered.
• In growing waves in the atmosphere, cold air moving downwards and equatorwards displaces the warmer air moving polewards and upwards.
3
The Definition of EnergyEnergy – the ability to do workTwo familiar types
1. Kinetic energy – the energy of motion: K = 1/2mV2
2. Potential energy – stored energy: P = mgh
KE = 1/2 x mass x velocity2 4

Baroclinic Instability
Distribution of geopotential height (solid) and temperature (dashed) on a constant pressure surface in a developing baroclinic wave in the Northern Hemisphere. The pressure surface is located near the level where the speed of the wave is the same as the speed of the mean zonal flow.
5
Baroclinic Instability
Cross section through a developing storm (baroclinic) wave showing slope of typical air parcel trajectories (arrows) in relation to the slopes of the temperature contours. Note: warm air rises and cold air sinks.
6
Midlatitude Storm Winds
Surface winds show confluence of cold and warm air, causing a front to form.
7
Norwegian Cyclone Model
The Norwegian cyclone model describes how fronts evolve and interact in a winter storm.
8
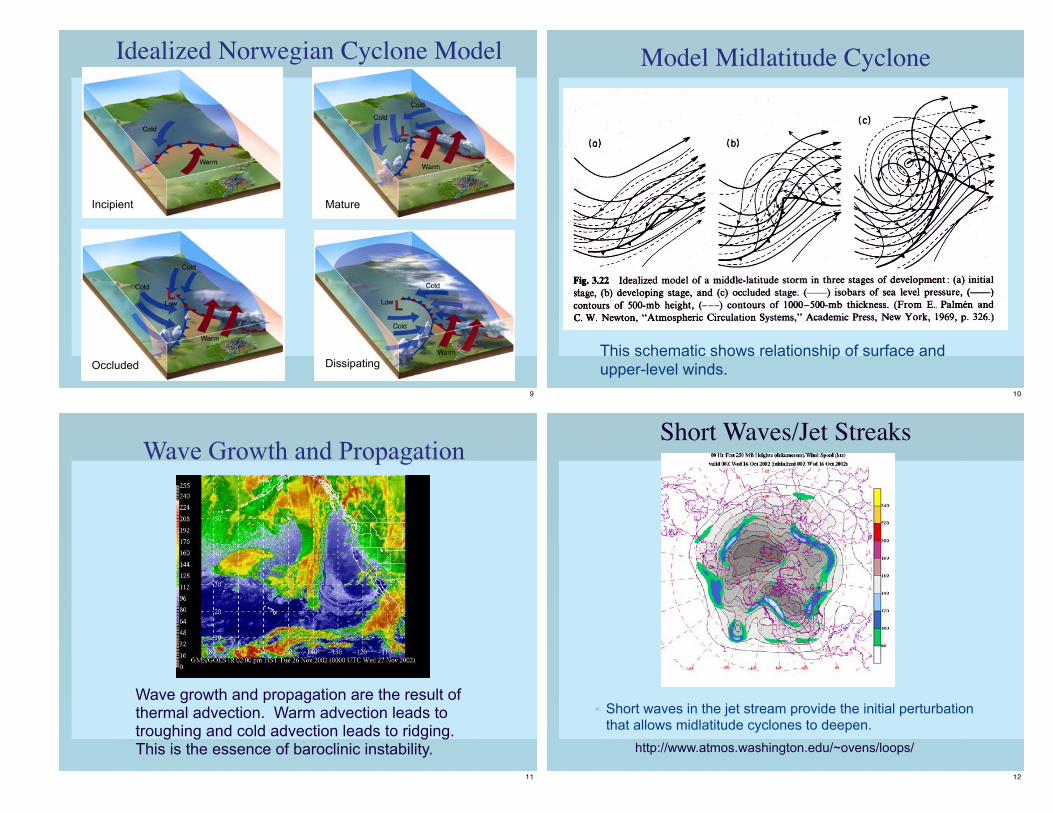
Idealized Norwegian Cyclone Model
Incipient Mature
Occluded Dissipating
9
Model Midlatitude Cyclone
This schematic shows relationship of surface and upper-level winds.
10
Wave Growth and Propagation
Wave growth and propagation are the result of thermal advection. Warm advection leads to troughing and cold advection leads to ridging. This is the essence of baroclinic instability.
11
http://www.atmos.washington.edu/~ovens/loops/
Short Waves/Jet Streaks
• Short waves in the jet stream provide the initial perturbation that allows midlatitude cyclones to deepen.
12

Schematic depiction of the propagation of a mid-tropospheric jet streak through a Rossby wave over 72 h. Solid lines: height lines, Thick dashed lines: isotachs, Thin dashed lines: isentropes
Time = t0
J
Conceptual Model of Jet Streak – Planetary Wave Interaction
JJ
JTime = t0 + 24 h
Time = t0 + 48 h
Time = t0 + 72 h
13
Short Waves: Alberta Clipper
Short wave troughs aloft form over and downwind of major mountain ranges.
14
Surface Cyclone Development
15
Short-rangestorm/jet streakon order of days
Medium-range Rossby Wave Train downstream wave-energy transferon order of week(s)
Sub-seasonal - Rossby Wave Propagation slow retrogression of wave axison order of weeks to a month+
Jet Streak – Planetary Wave InteractionThree Interacting Time Scales
Planetary WaveWave TrainWinter Storm
16
UK Japan UKCal.
9-27Nov.
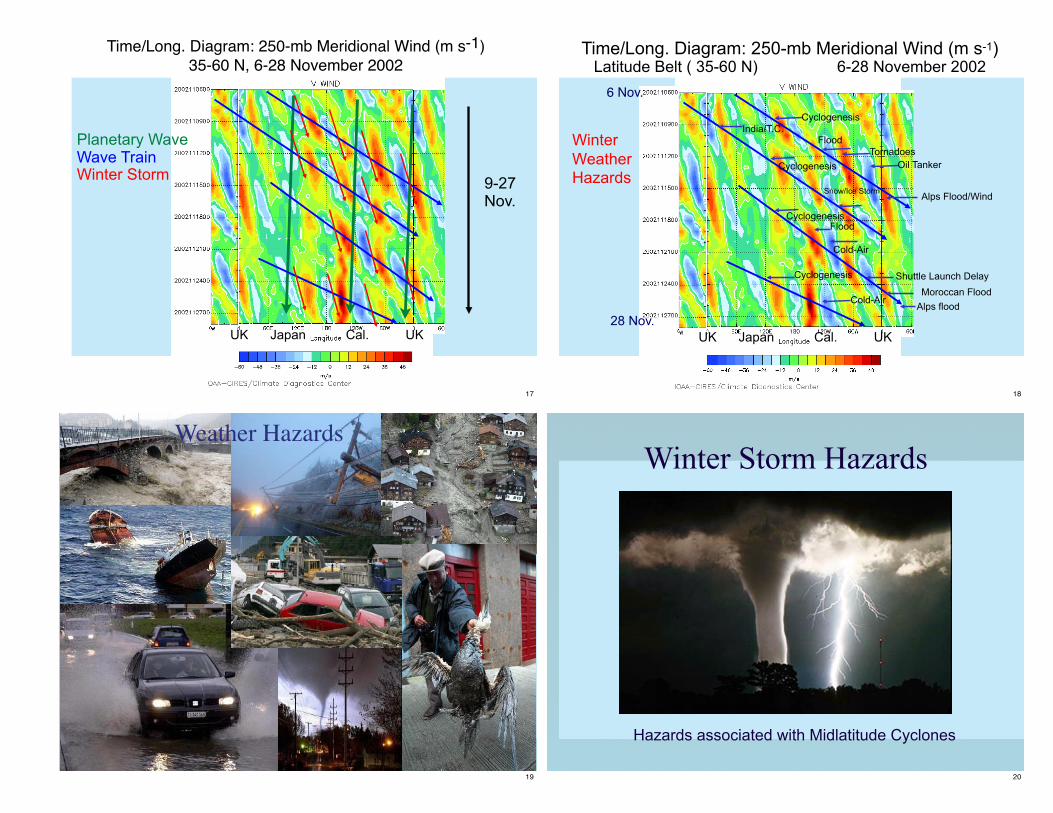
Time/Long. Diagram: 250-mb Meridional Wind (m s-1) 35-60 N, 6-28 November 2002
Planetary WaveWave TrainWinter Storm
17
Time/Long. Diagram: 250-mb Meridional Wind (m s-1)Latitude Belt ( 35-60 N) 6-28 November 2002
UK Japan UKCal.
Cyclogenesis
TornadoesOil Tanker
Alps Flood/Wind
Cyclogenesis
Snow/Ice Storm
Shuttle Launch DelayMoroccan Flood
Alps flood
Cyclogenesis
India/T.C.
Cyclogenesis
Cold-Air
Cold-Air
6 Nov.
28 Nov.
Flood
Flood
Winter Weather Hazards
18
Weather Hazards
19
Hazards associated with Midlatitude Cyclones
Winter Storm Hazards
20
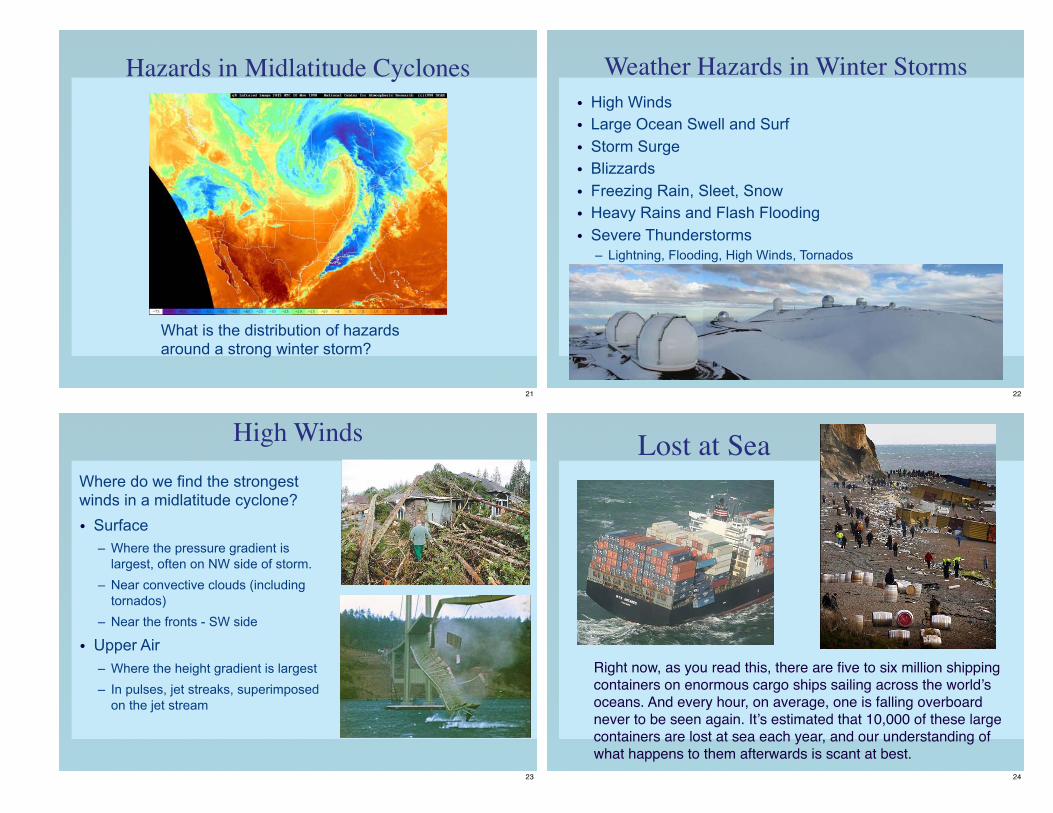
Hazards in Midlatitude Cyclones
What is the distribution of hazards around a strong winter storm?
21
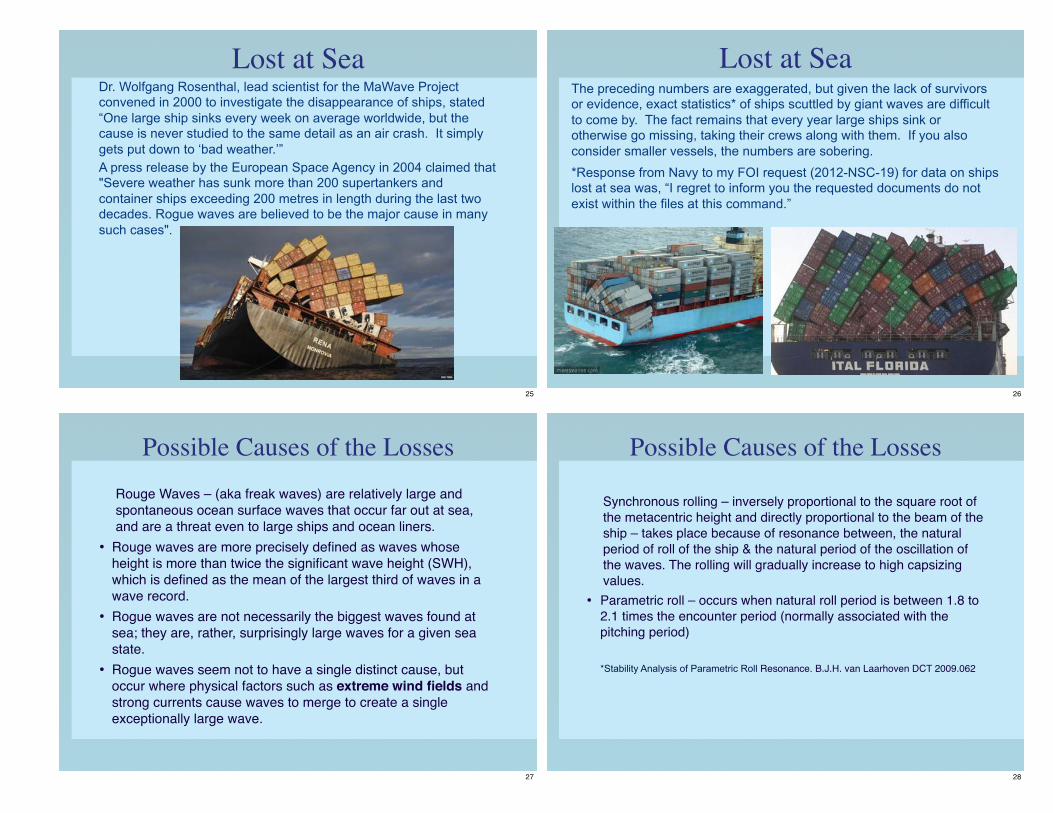
Weather Hazards in Winter Storms• High Winds• Large Ocean Swell and Surf• Storm Surge• Blizzards• Freezing Rain, Sleet, Snow• Heavy Rains and Flash Flooding• Severe Thunderstorms
– Lightning, Flooding, High Winds, Tornados
22
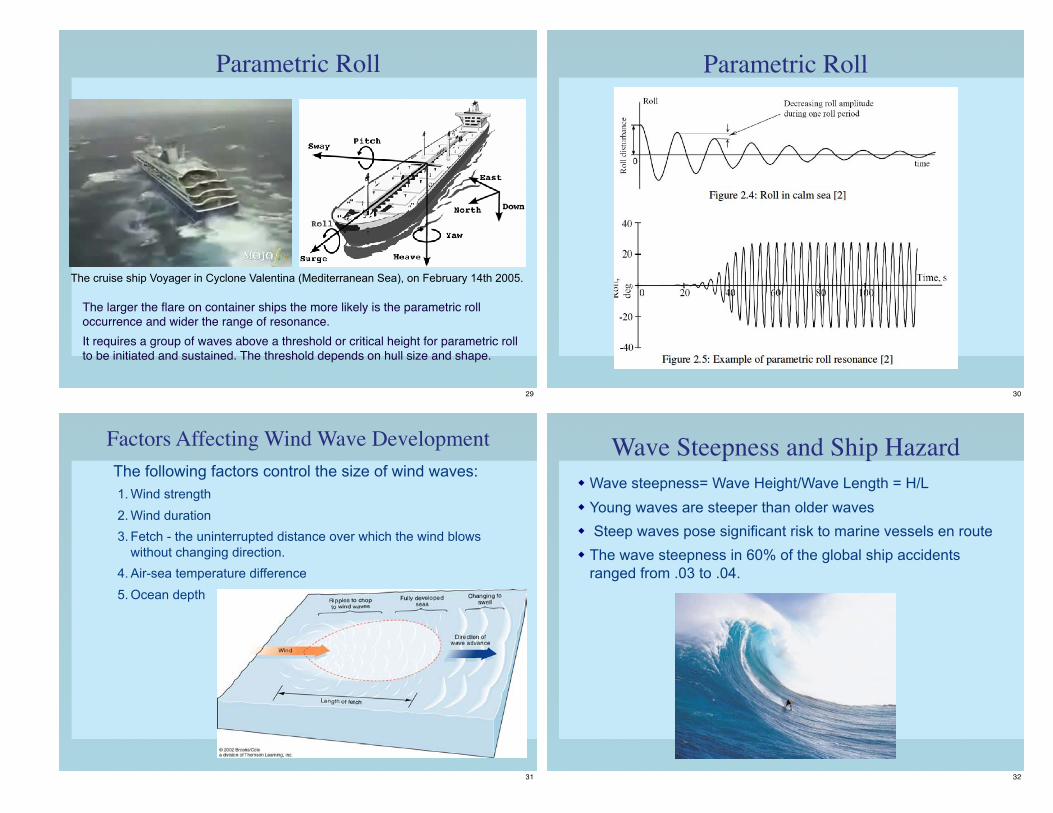
High WindsWhere do we find the strongest winds in a midlatitude cyclone?• Surface
– Where the pressure gradient is largest, often on NW side of storm.
– Near convective clouds (including tornados)
– Near the fronts - SW side
• Upper Air– Where the height gradient is largest– In pulses, jet streaks, superimposed
on the jet stream
23
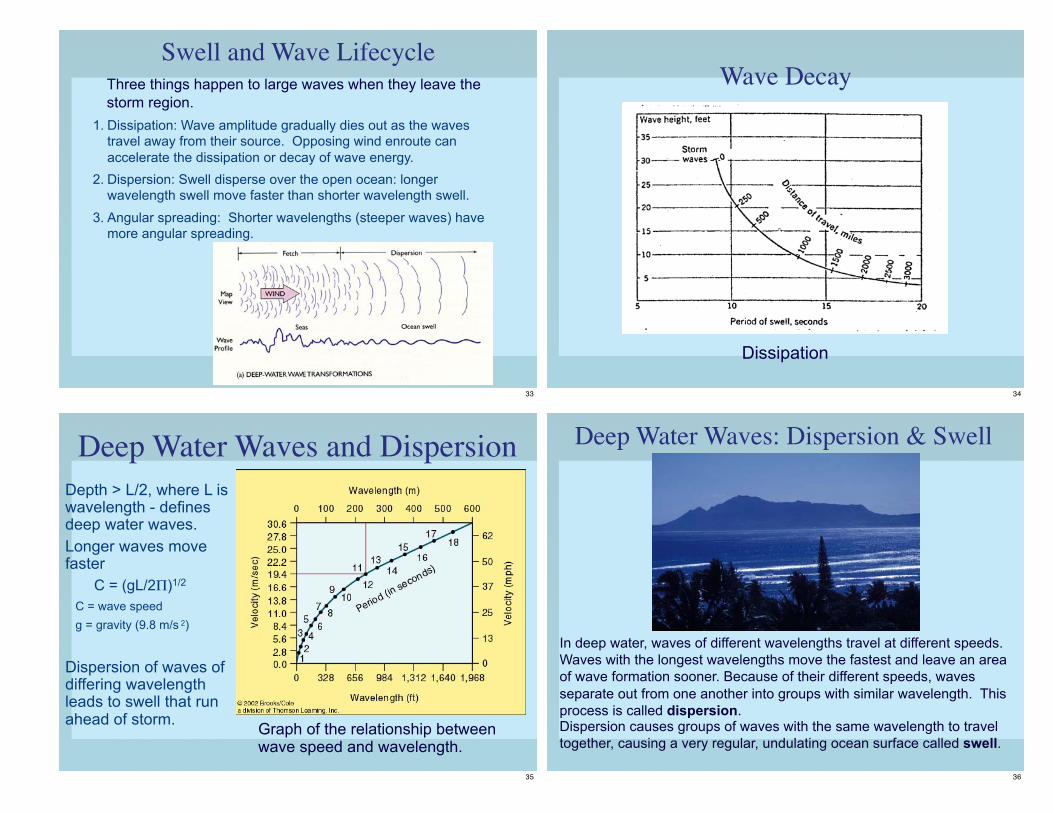
Lost at Sea
Right now, as you read this, there are five to six million shipping containers on enormous cargo ships sailing across the world’s oceans. And every hour, on average, one is falling overboard never to be seen again. It’s estimated that 10,000 of these large containers are lost at sea each year, and our understanding of what happens to them afterwards is scant at best.
24
Dr. Wolfgang Rosenthal, lead scientist for the MaWave Project convened in 2000 to investigate the disappearance of ships, stated “One large ship sinks every week on average worldwide, but the cause is never studied to the same detail as an air crash. It simply gets put down to ‘bad weather.’” A press release by the European Space Agency in 2004 claimed that "Severe weather has sunk more than 200 supertankers and container ships exceeding 200 metres in length during the last two decades. Rogue waves are believed to be the major cause in many such cases".
Lost at Sea
25
The preceding numbers are exaggerated, but given the lack of survivors or evidence, exact statistics* of ships scuttled by giant waves are difficult to come by. The fact remains that every year large ships sink or otherwise go missing, taking their crews along with them. If you also consider smaller vessels, the numbers are sobering. *Response from Navy to my FOI request (2012-NSC-19) for data on ships lost at sea was, “I regret to inform you the requested documents do not exist within the files at this command.”
Lost at Sea
26
Possible Causes of the LossesRouge Waves – (aka freak waves) are relatively large and spontaneous ocean surface waves that occur far out at sea, and are a threat even to large ships and ocean liners.
• Rouge waves are more precisely defined as waves whose height is more than twice the significant wave height (SWH), which is defined as the mean of the largest third of waves in a wave record.
• Rogue waves are not necessarily the biggest waves found at sea; they are, rather, surprisingly large waves for a given sea state.
• Rogue waves seem not to have a single distinct cause, but occur where physical factors such as extreme wind fields and strong currents cause waves to merge to create a single exceptionally large wave.
27
Possible Causes of the Losses
Synchronous rolling – inversely proportional to the square root of the metacentric height and directly proportional to the beam of the ship – takes place because of resonance between, the natural period of roll of the ship & the natural period of the oscillation of the waves. The rolling will gradually increase to high capsizing values.
• Parametric roll – occurs when natural roll period is between 1.8 to 2.1 times the encounter period (normally associated with the pitching period)
*Stability Analysis of Parametric Roll Resonance. B.J.H. van Laarhoven DCT 2009.062
28
Parametric Roll
The larger the flare on container ships the more likely is the parametric roll occurrence and wider the range of resonance. It requires a group of waves above a threshold or critical height for parametric roll to be initiated and sustained. The threshold depends on hull size and shape.
The cruise ship Voyager in Cyclone Valentina (Mediterranean Sea), on February 14th 2005.
29
Parametric Roll
30
Factors Affecting Wind Wave DevelopmentThe following factors control the size of wind waves: 1. Wind strength2. Wind duration3. Fetch - the uninterrupted distance over which the wind blows
without changing direction.4. Air-sea temperature difference5. Ocean depth
31
Wave Steepness and Ship Hazard! Wave steepness= Wave Height/Wave Length = H/L! Young waves are steeper than older waves! Steep waves pose significant risk to marine vessels en route ! The wave steepness in 60% of the global ship accidents
ranged from .03 to .04.
32
Swell and Wave LifecycleThree things happen to large waves when they leave the storm region.
1. Dissipation: Wave amplitude gradually dies out as the waves travel away from their source. Opposing wind enroute can accelerate the dissipation or decay of wave energy.
2. Dispersion: Swell disperse over the open ocean: longer wavelength swell move faster than shorter wavelength swell.
3. Angular spreading: Shorter wavelengths (steeper waves) have more angular spreading.
33
Wave Decay
Dissipation
34
Deep Water Waves and Dispersion
Graph of the relationship between wave speed and wavelength.
Depth > L/2, where L is wavelength - defines deep water waves.Longer waves move faster
C = (gL/2Π)1/2
C = wave speedg = gravity (9.8 m/s 2)
Dispersion of waves of differing wavelength leads to swell that run ahead of storm.
35
Deep Water Waves: Dispersion & Swell
In deep water, waves of different wavelengths travel at different speeds. Waves with the longest wavelengths move the fastest and leave an area of wave formation sooner. Because of their different speeds, waves separate out from one another into groups with similar wavelength. This process is called dispersion. Dispersion causes groups of waves with the same wavelength to travel together, causing a very regular, undulating ocean surface called swell.
36
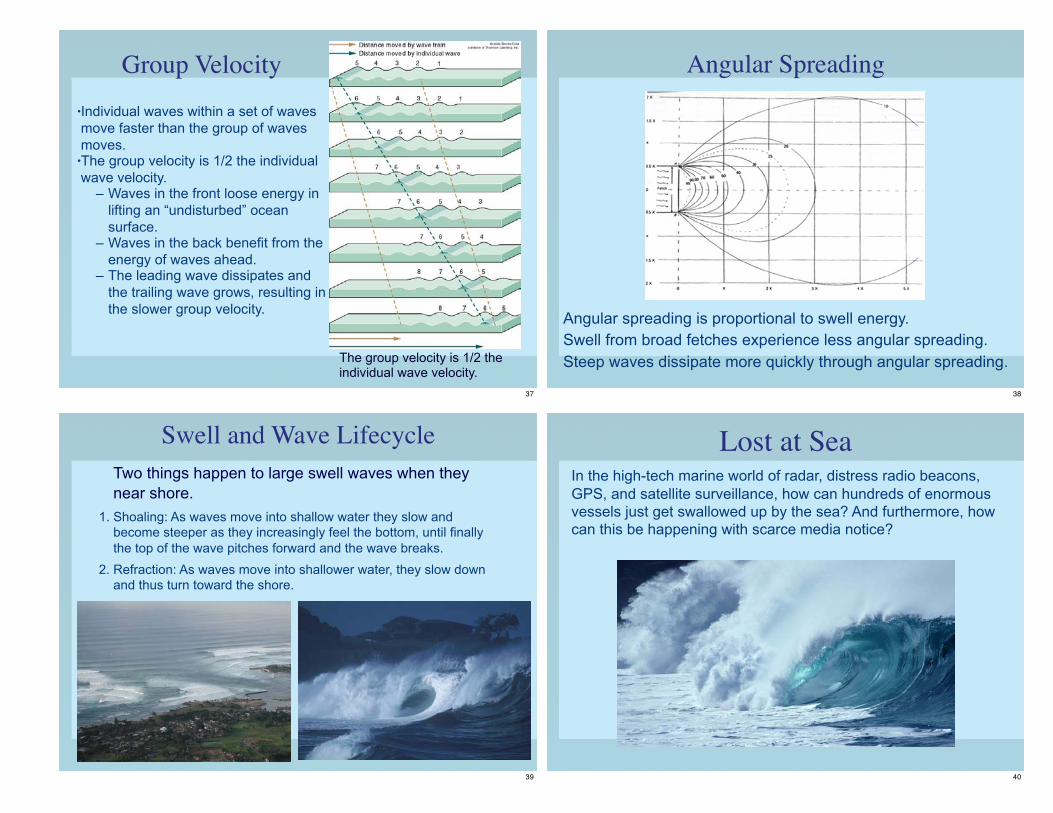
Group Velocity
The group velocity is 1/2 the individual wave velocity.
•Individual waves within a set of waves move faster than the group of waves moves.
•The group velocity is 1/2 the individual wave velocity.
– Waves in the front loose energy in lifting an “undisturbed” ocean surface.
– Waves in the back benefit from the energy of waves ahead.
– The leading wave dissipates and the trailing wave grows, resulting in the slower group velocity.
37
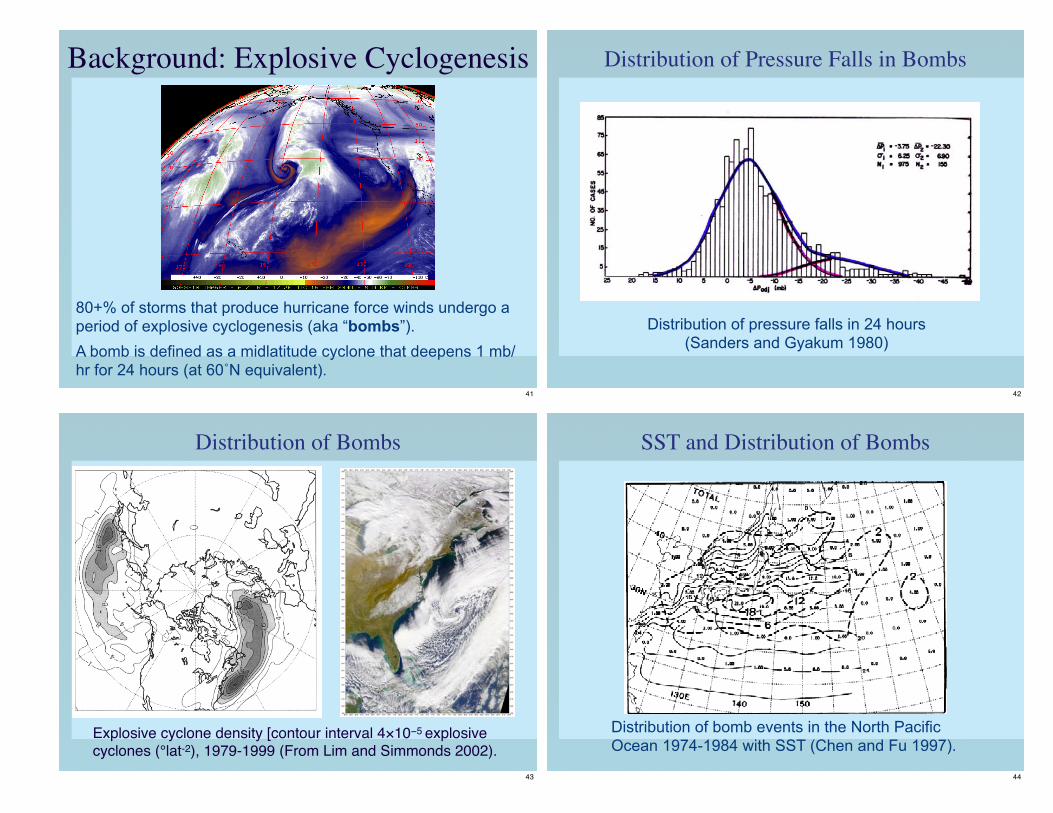
Angular Spreading
Angular spreading is proportional to swell energy.Swell from broad fetches experience less angular spreading.Steep waves dissipate more quickly through angular spreading.
38
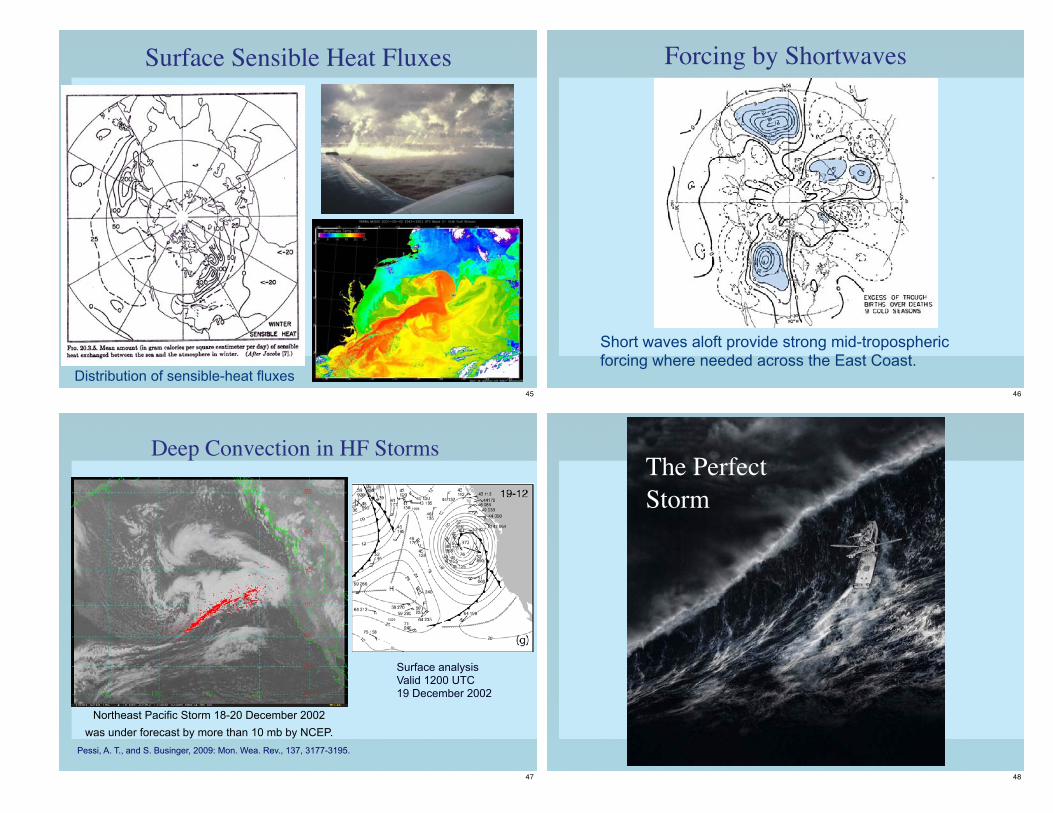
Swell and Wave LifecycleTwo things happen to large swell waves when they near shore.
1. Shoaling: As waves move into shallow water they slow and become steeper as they increasingly feel the bottom, until finally the top of the wave pitches forward and the wave breaks.
2. Refraction: As waves move into shallower water, they slow down and thus turn toward the shore.
39
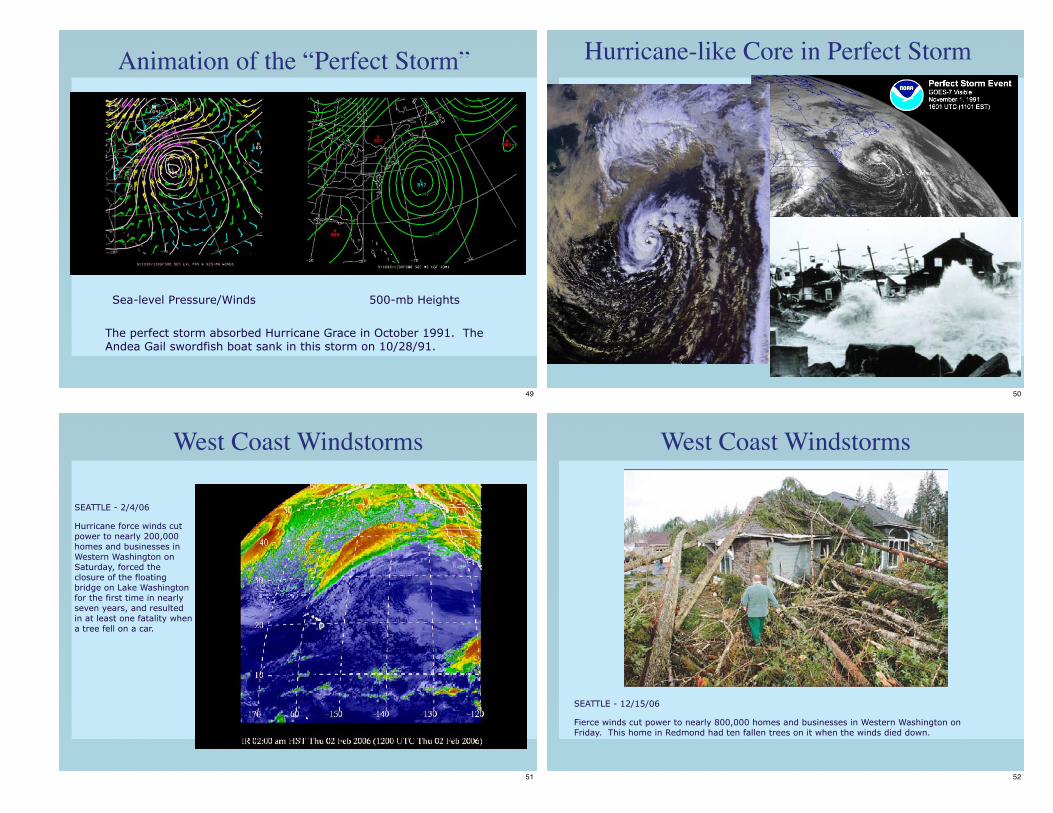
In the high-tech marine world of radar, distress radio beacons, GPS, and satellite surveillance, how can hundreds of enormous vessels just get swallowed up by the sea? And furthermore, how can this be happening with scarce media notice?
Lost at Sea
40
80+% of storms that produce hurricane force winds undergo a period of explosive cyclogenesis (aka “bombs”). A bomb is defined as a midlatitude cyclone that deepens 1 mb/hr for 24 hours (at 60˚N equivalent).
Background: Explosive Cyclogenesis
41
Distribution of pressure falls in 24 hours (Sanders and Gyakum 1980)
Distribution of Pressure Falls in Bombs
42
Explosive cyclone density [contour interval 4×10⁻⁵ explosive cyclones (°lat-2), 1979-1999 (From Lim and Simmonds 2002).
Distribution of Bombs
43
Distribution of bomb events in the North Pacific Ocean 1974-1984 with SST (Chen and Fu 1997).
SST and Distribution of Bombs
44
Surface Sensible Heat Fluxes
Distribution of sensible-heat fluxes45
Forcing by Shortwaves
Short waves aloft provide strong mid-tropospheric forcing where needed across the East Coast.
46
Deep Convection in HF Storms
Northeast Pacific Storm 18-20 December 2002was under forecast by more than 10 mb by NCEP.
Pessi, A. T., and S. Businger, 2009: Mon. Wea. Rev., 137, 3177-3195.
Surface analysisValid 1200 UTC19 December 2002
47
The Perfect Storm
48
Animation of the “Perfect Storm”
The perfect storm absorbed Hurricane Grace in October 1991. The Andea Gail swordfish boat sank in this storm on 10/28/91.
Sea-level Pressure/Winds 500-mb Heights
49
Hurricane-like Core in Perfect Storm
50
SEATTLE - 2/4/06
Hurricane force winds cut power to nearly 200,000 homes and businesses in Western Washington on Saturday, forced the closure of the floating bridge on Lake Washington for the first time in nearly seven years, and resulted in at least one fatality when a tree fell on a car.
West Coast Windstorms
51
SEATTLE - 12/15/06
Fierce winds cut power to nearly 800,000 homes and businesses in Western Washington on Friday. This home in Redmond had ten fallen trees on it when the winds died down.
West Coast Windstorms
52
Mother of all NW WindstormsColumbus Day Storm of 1962
53
Mother of all NW Windstorms
Columbus Day Storm of 1962
54
NW Windstorms and Bridges
Hood Canal Bridge sinks on 13 Feb. 1979
55
NW Windstorms and Bridges
Tacoma Narrows Bridge 7 November 1940
56
Hawaii: Two Epic Wave Events
57
Hazards – Large Waves
• Peggotty Beach, Massachusetts February 9, 1978
Oahu, North Shore January 1998.
58
December 1969 HF Storm
59
1969 Wave Damage on Oahu
60
HF Storm of December 1969
NCAR/NCEP Reanalysis Data for 8 AM 30 November 1969
61
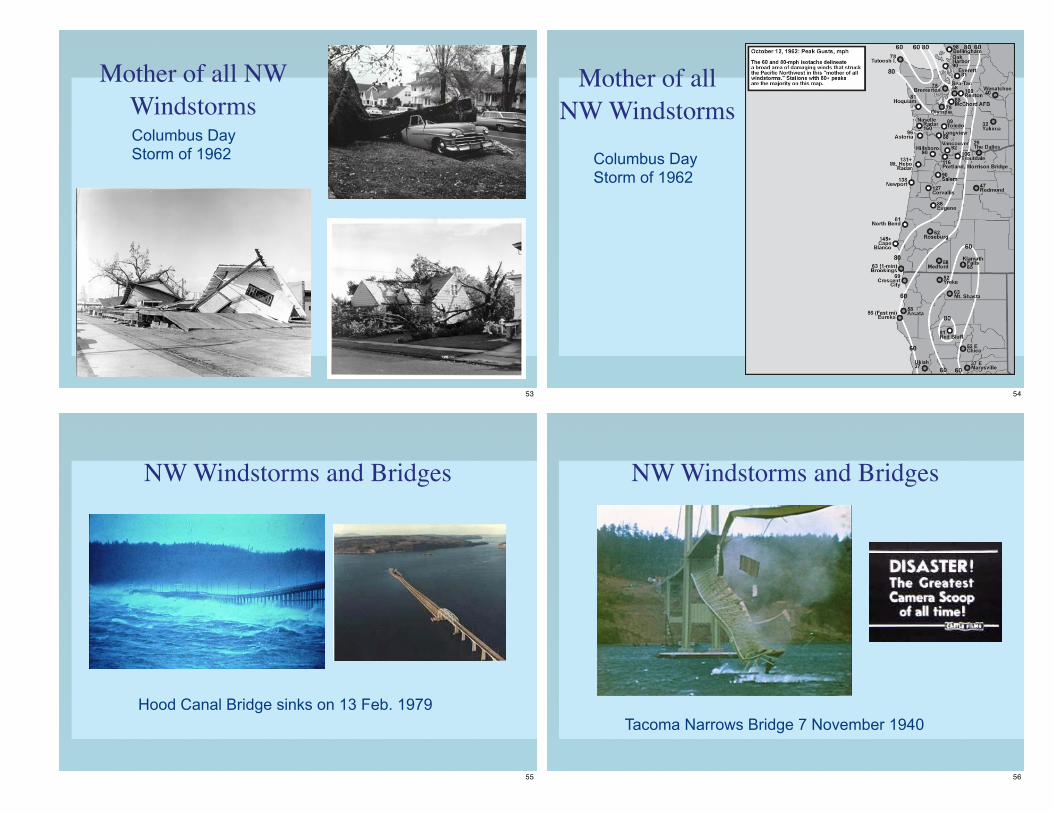
Animation of SLP Analyses Dec. 1969
A captured fetch occurs when the swell travel at the same speed as the storm, so that high winds remain over the swell region.
62
HF StormJan. 1998
Photos by S. Businger
63
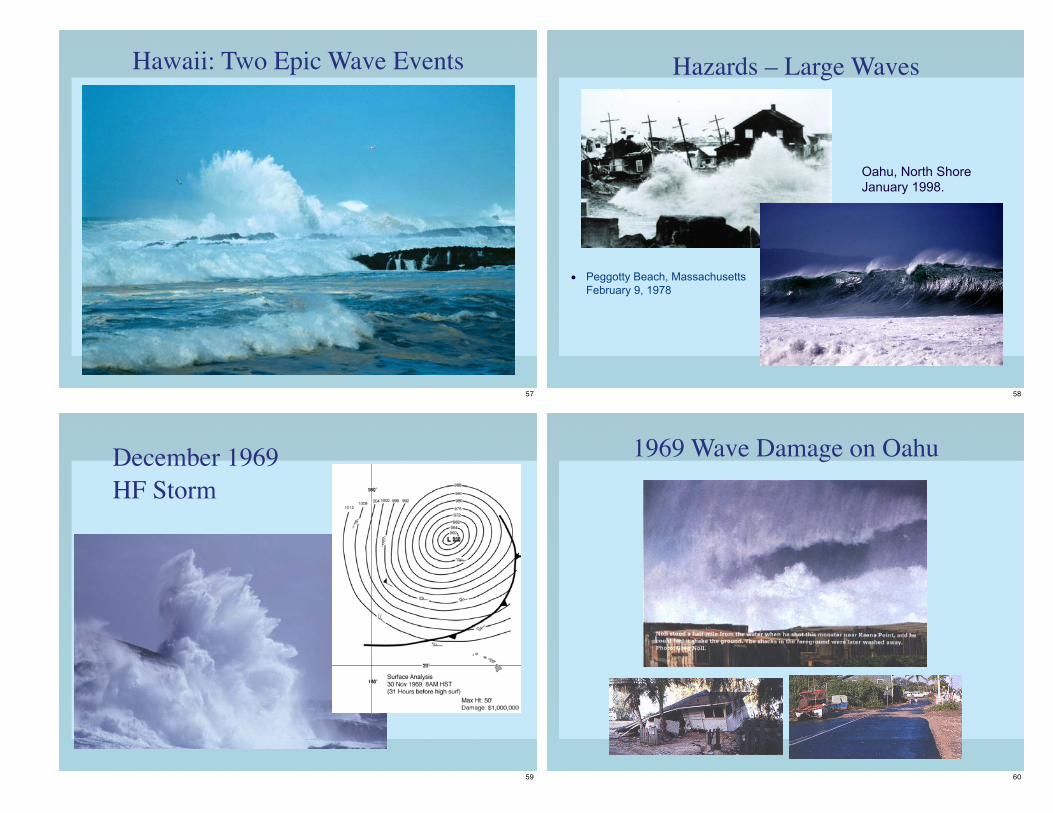
HF Surface Winds on 26 January 1998
NCAR/NCEP Reanalysis Data for 8 PM 25 January 1998
64
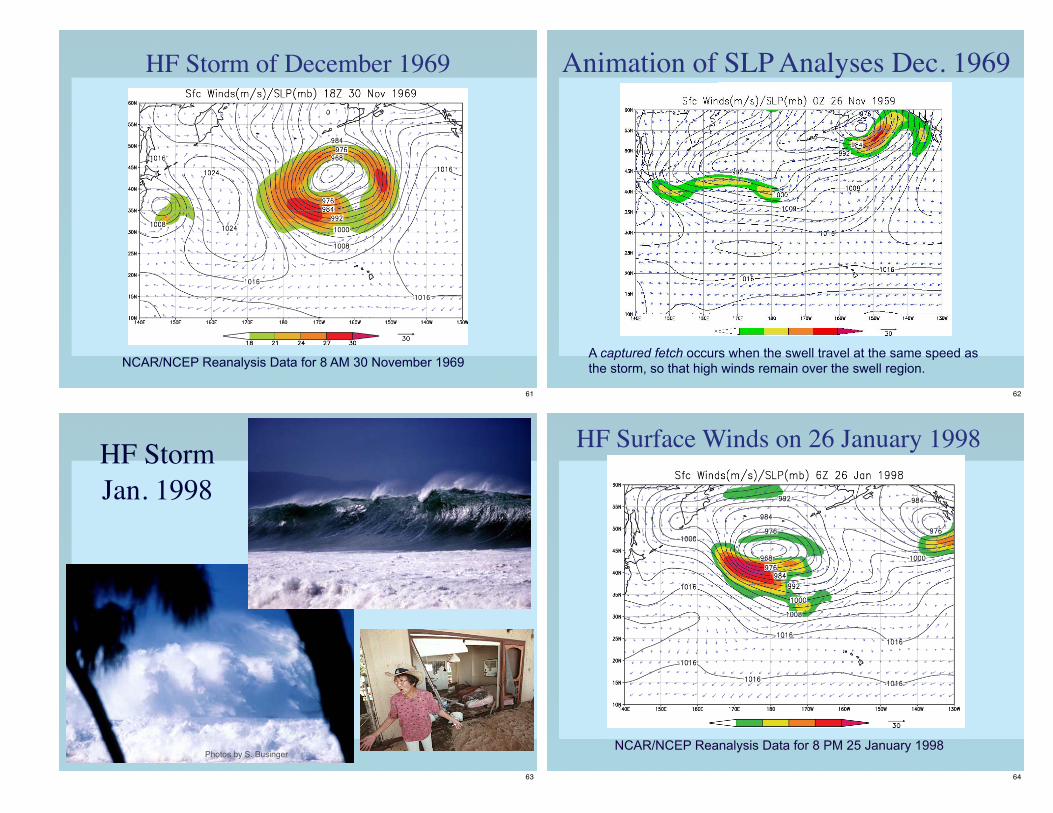
Animation of SLP Analyses Jan. 1998
Note the captured fetch that again occurred in this case.
65
Waves are Scale Invariant
Breaking waves are scale invariant; its difficult to tell how large they are without a surfer for scale.
66
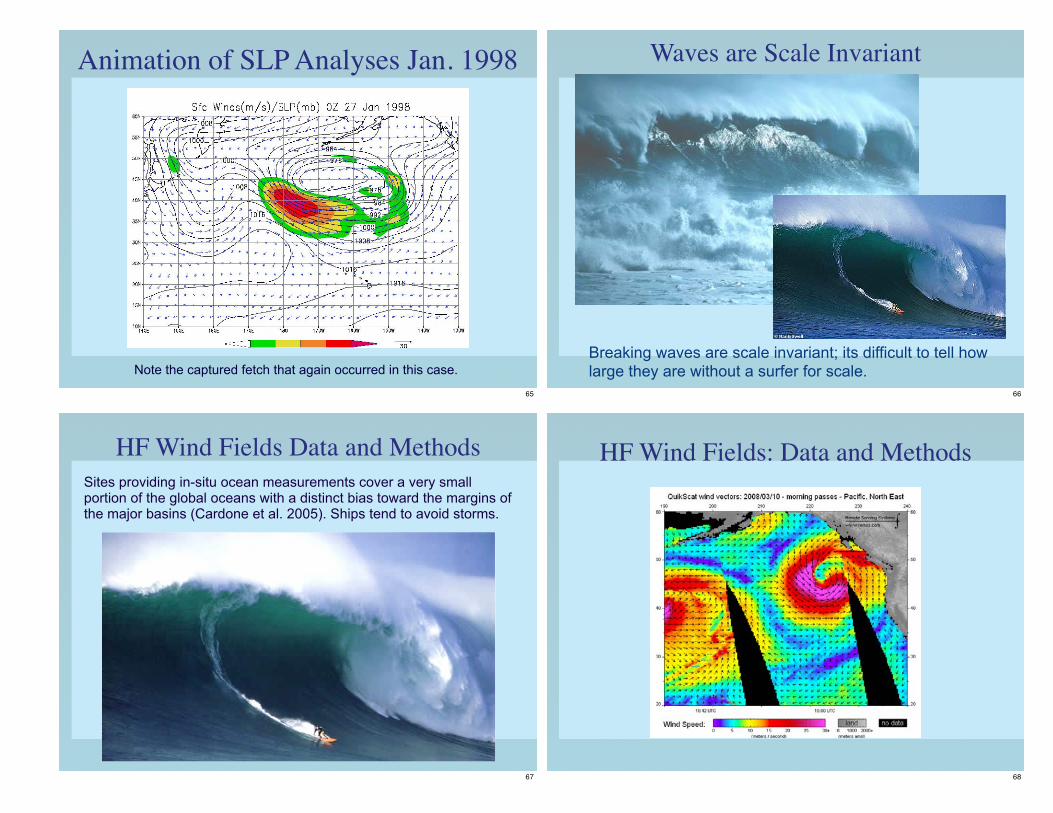
Sites providing in-situ ocean measurements cover a very small portion of the global oceans with a distinct bias toward the margins of the major basins (Cardone et al. 2005). Ships tend to avoid storms.
HF Wind Fields Data and Methods
67
HF Wind Fields: Data and Methods
68
Jan 2003 through May 2008
Hurricane Force Fetch Climatology
69
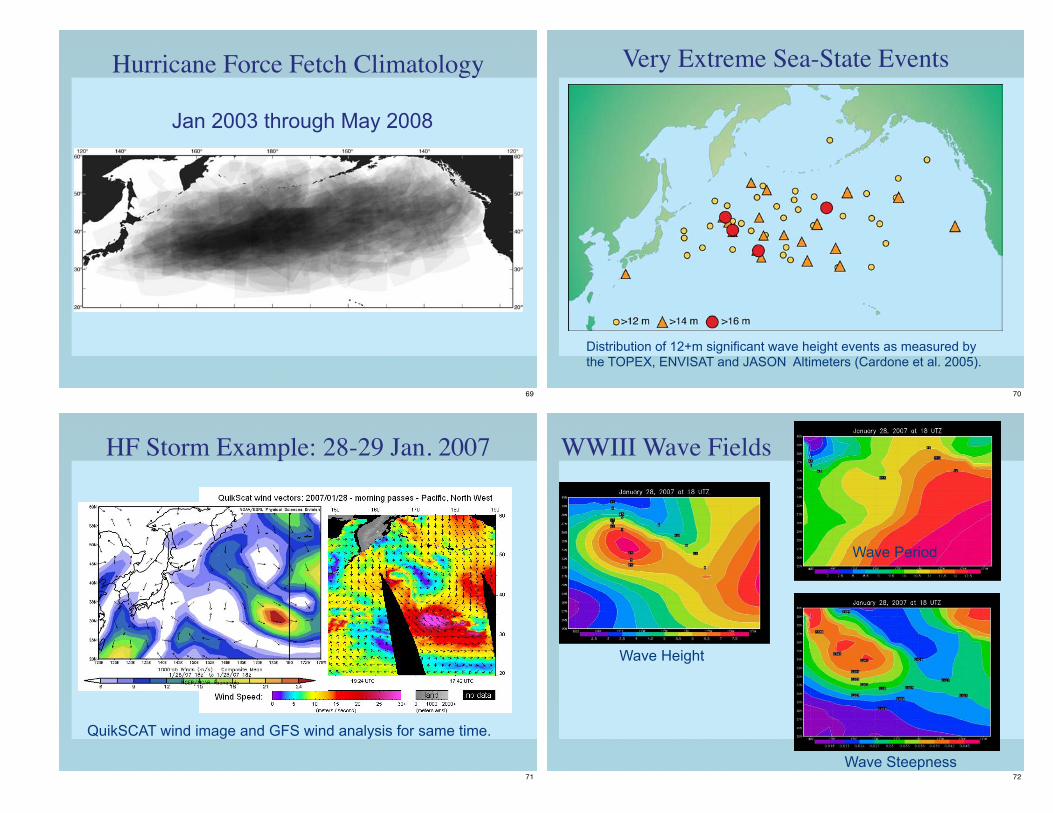
Very Extreme Sea-State Events
Distribution of 12+m significant wave height events as measured by the TOPEX, ENVISAT and JASON Altimeters (Cardone et al. 2005).
70
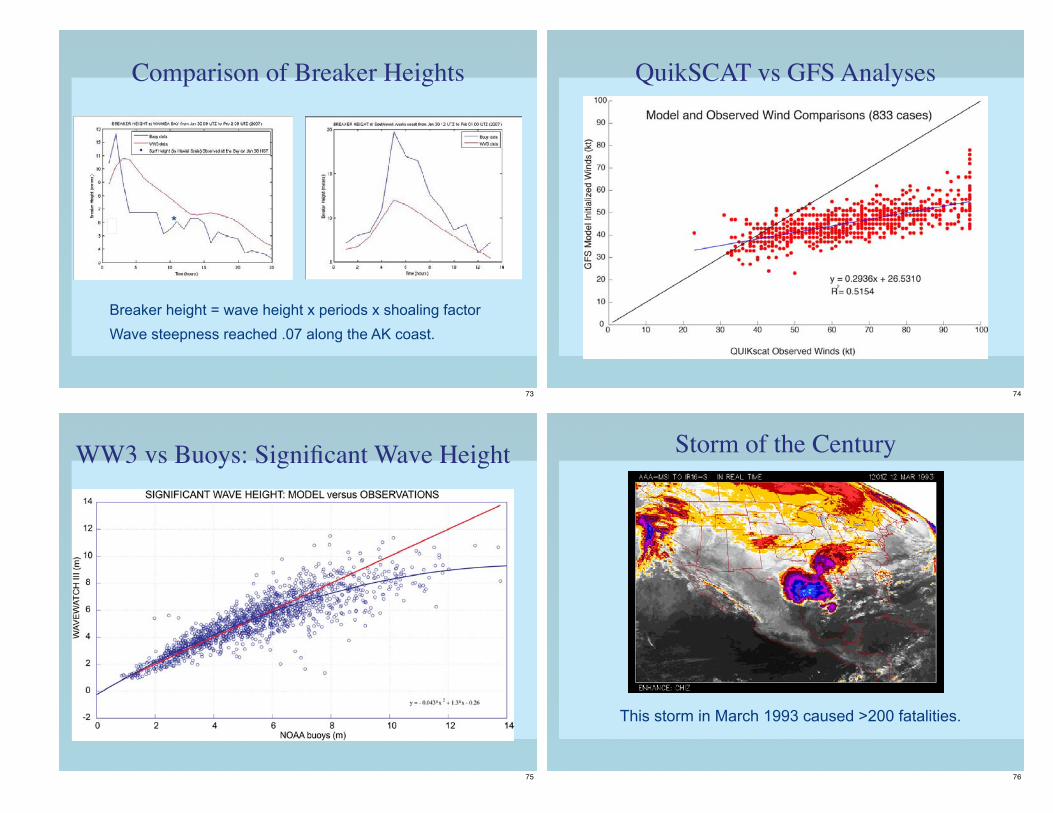
HF Storm Example: 28-29 Jan. 2007
QuikSCAT wind image and GFS wind analysis for same time.
71
WWIII Wave Fields
Wave Height
Wave Period
Wave Steepness72
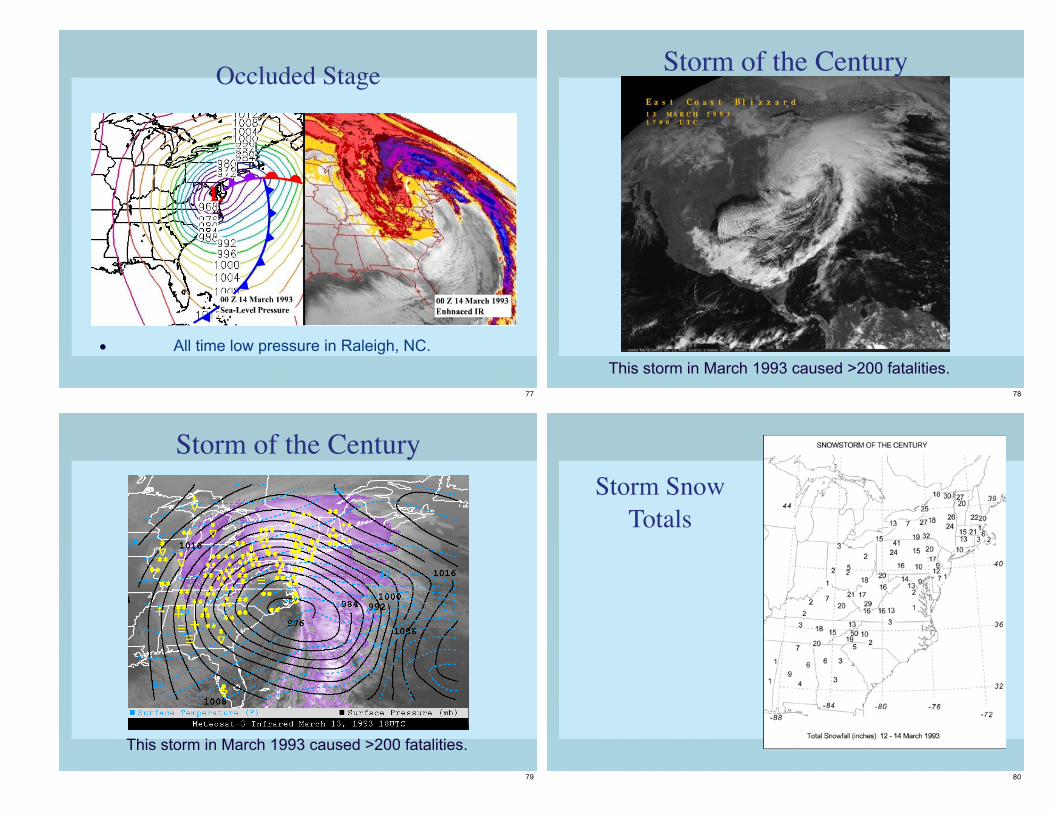
Comparison of Breaker Heights
Breaker height = wave height x periods x shoaling factorWave steepness reached .07 along the AK coast.
*
73
QuikSCAT vs GFS Analyses
74
WW3 vs Buoys: Significant Wave Height
75
Storm of the Century
This storm in March 1993 caused >200 fatalities.
76
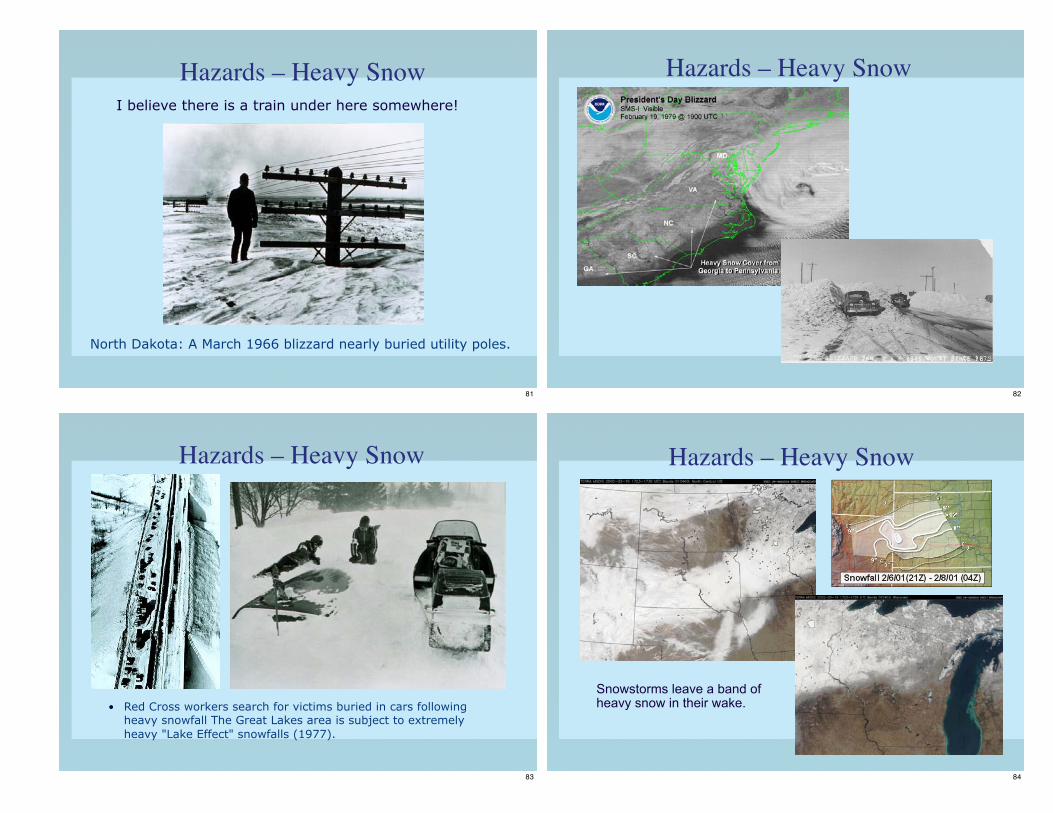
Occluded Stage
• All time low pressure in Raleigh, NC.
77
Storm of the Century
This storm in March 1993 caused >200 fatalities.78
Storm of the Century
This storm in March 1993 caused >200 fatalities.
79
Storm Snow Totals
80
Hazards – Heavy Snow
North Dakota: A March 1966 blizzard nearly buried utility poles.
I believe there is a train under here somewhere!
81
Hazards – Heavy Snow
82
Hazards – Heavy Snow
• Red Cross workers search for victims buried in cars following heavy snowfall The Great Lakes area is subject to extremely heavy "Lake Effect" snowfalls (1977).
83
Hazards – Heavy Snow
Snowstorms leave a band of heavy snow in their wake.
84
Hazards – Heavy Snow
Snowstorms leave a band of heavy snow in their wake.
Blizzard conditions occur N and NW of surface-low center.
85
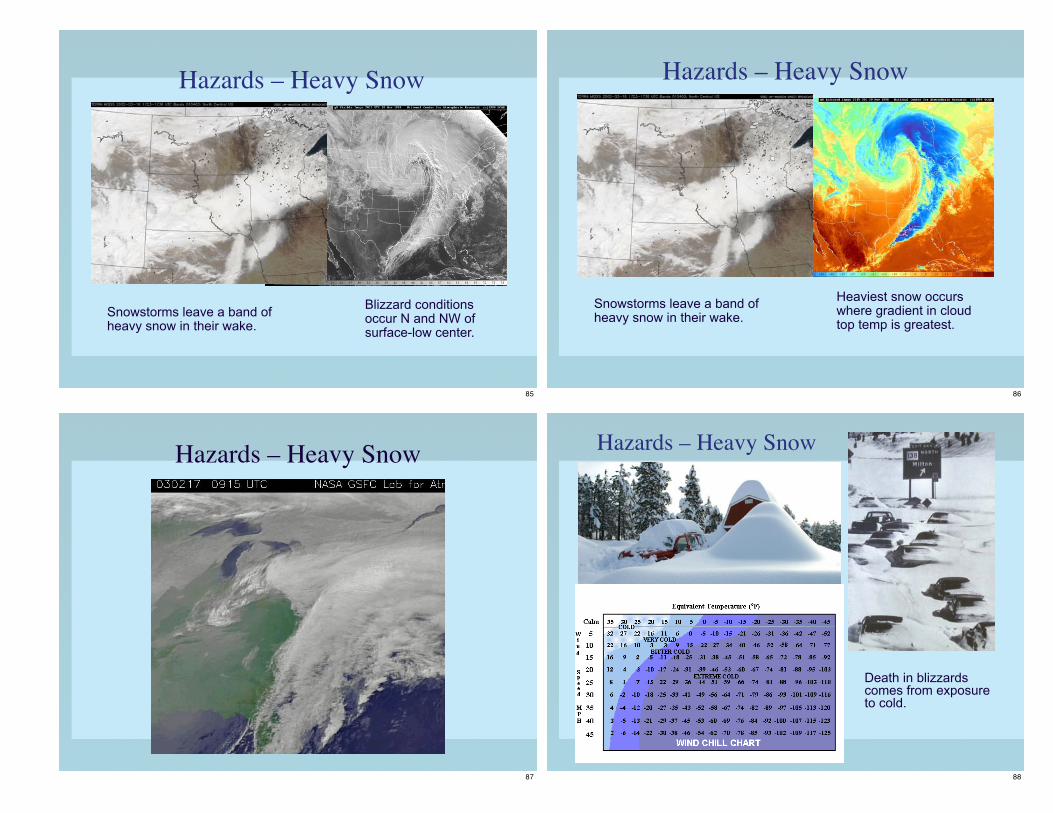
Hazards – Heavy Snow
Snowstorms leave a band of heavy snow in their wake.
Heaviest snow occurs where gradient in cloud top temp is greatest.
86
Hazards – Heavy Snow
87
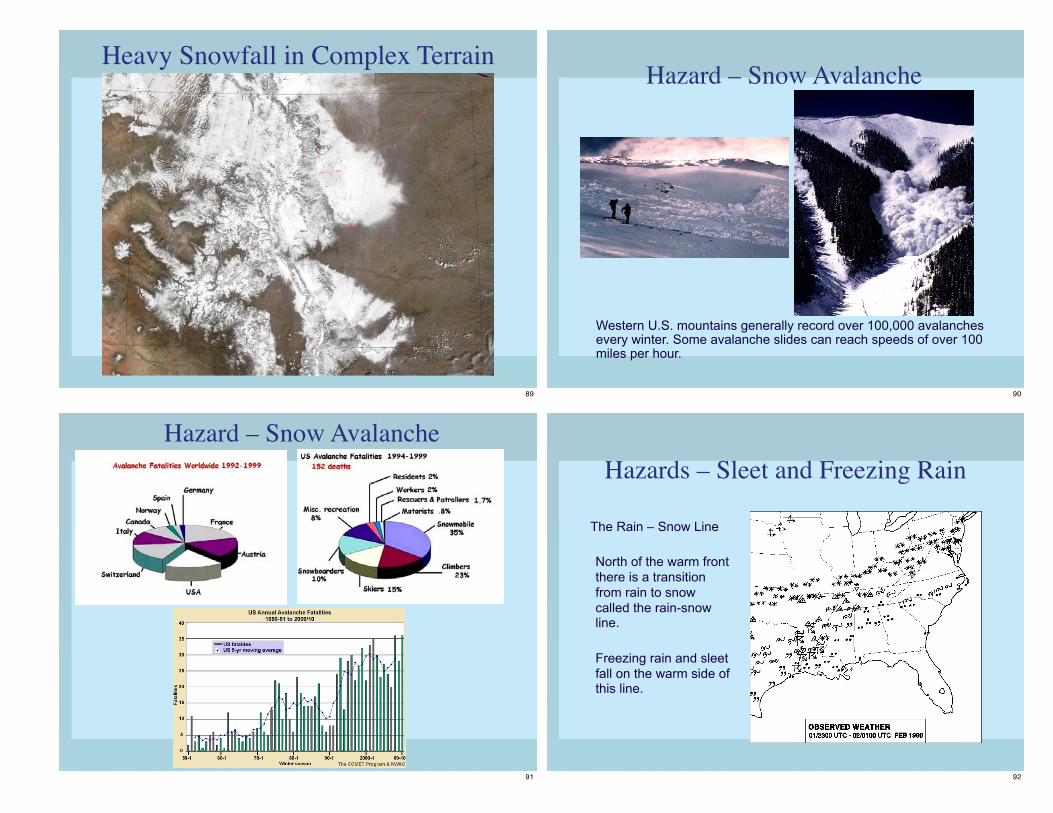
Hazards – Heavy Snow
Death in blizzards comes from exposure to cold.
88
Heavy Snowfall in Complex Terrain
89
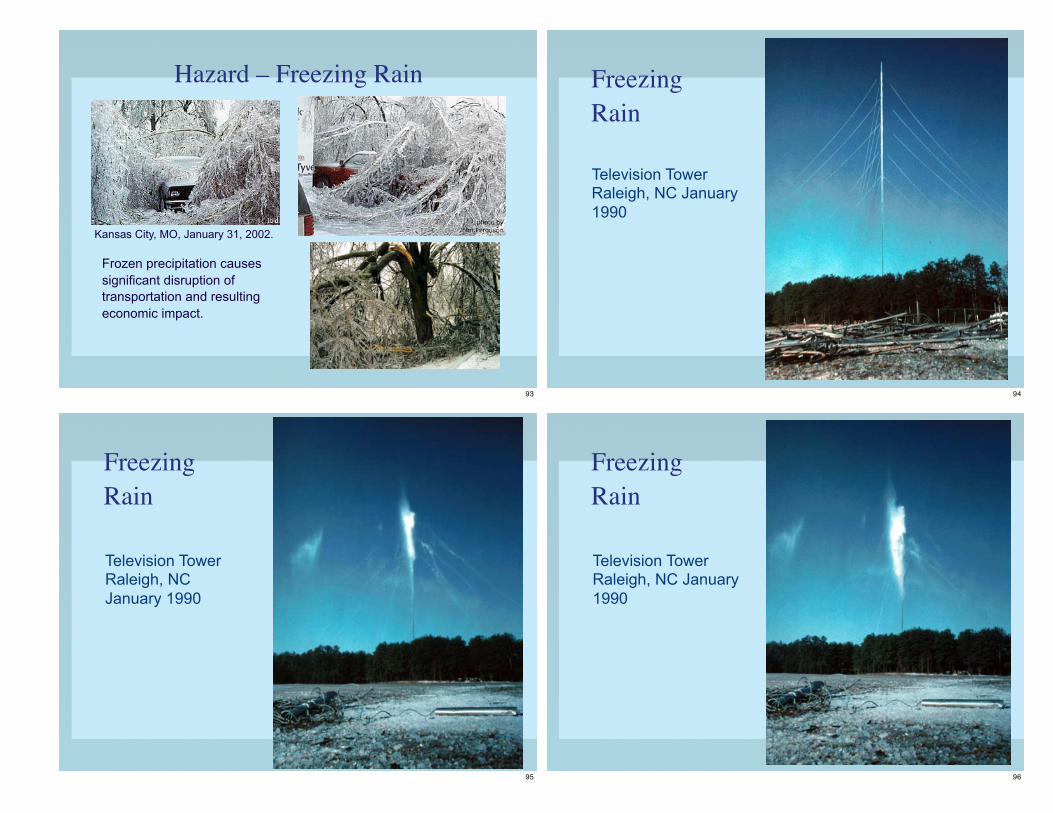
Hazard – Snow Avalanche
Western U.S. mountains generally record over 100,000 avalanches every winter. Some avalanche slides can reach speeds of over 100 miles per hour.
90
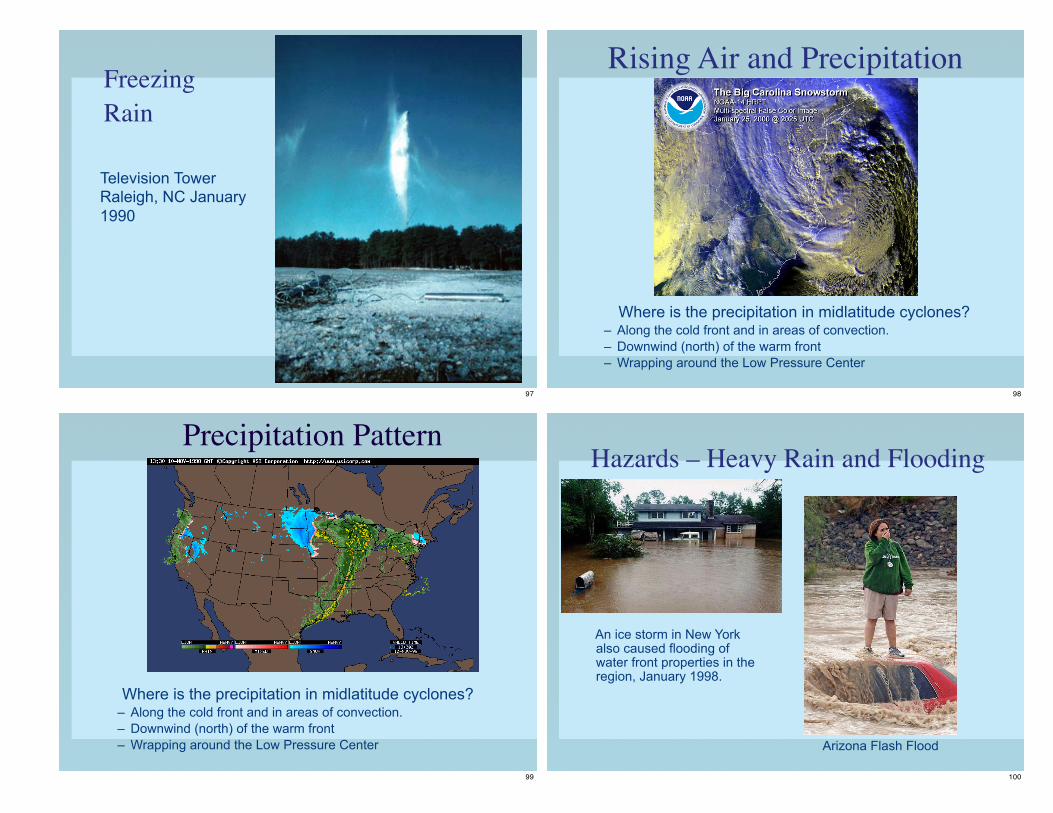
Hazard – Snow Avalanche
91
Hazards – Sleet and Freezing Rain
The Rain – Snow Line
North of the warm front there is a transition from rain to snow called the rain-snow line.
Freezing rain and sleet fall on the warm side of this line.
92
Hazard – Freezing Rain
Kansas City, MO, January 31, 2002.
Frozen precipitation causes significant disruption of transportation and resulting economic impact.
93
Freezing Rain
Television Tower Raleigh, NC January 1990
94
Freezing Rain
Television Tower Raleigh, NC January 1990
95
Freezing Rain
Television Tower Raleigh, NC January 1990
96
Freezing Rain
Television Tower Raleigh, NC January 1990
97
Rising Air and Precipitation
Where is the precipitation in midlatitude cyclones?– Along the cold front and in areas of convection.– Downwind (north) of the warm front– Wrapping around the Low Pressure Center
98
Precipitation Pattern
Where is the precipitation in midlatitude cyclones?– Along the cold front and in areas of convection.– Downwind (north) of the warm front– Wrapping around the Low Pressure Center
99
An ice storm in New York also caused flooding of water front properties in the region, January 1998.
Hazards – Heavy Rain and Flooding
Arizona Flash Flood
100
The greatest hazard is from flood waters crossing roads.
Hazards – Heavy Rain and Flooding
101
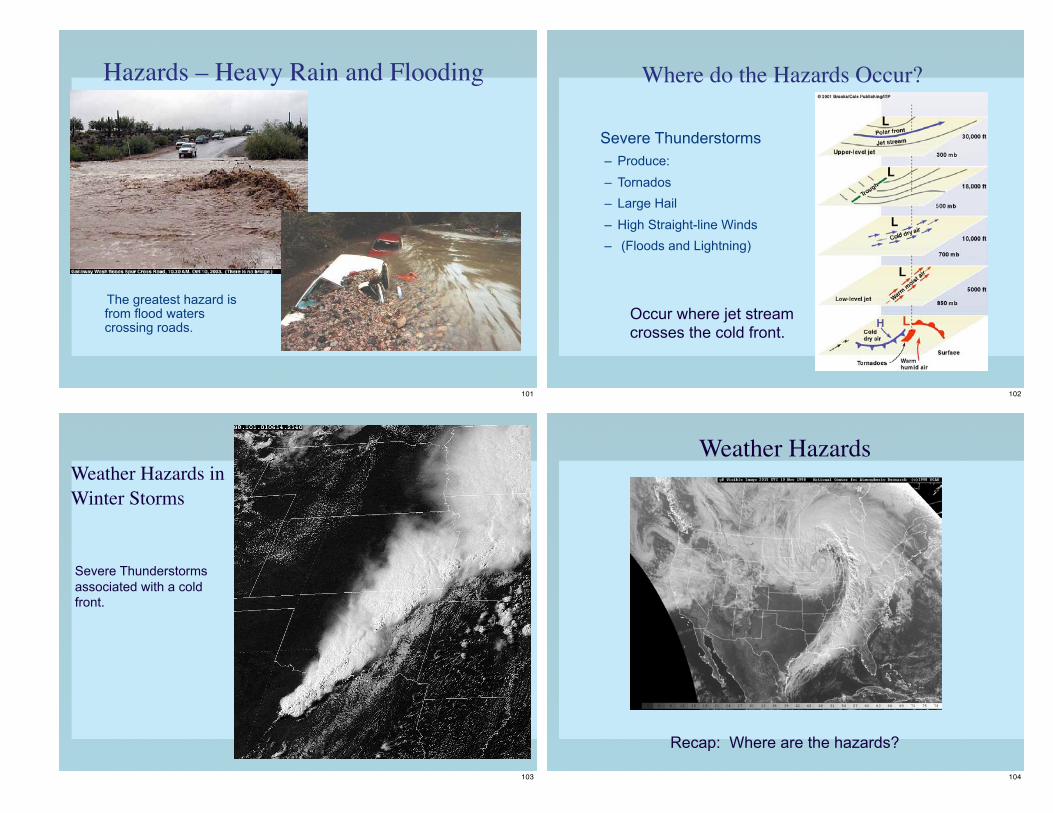
Where do the Hazards Occur?
Severe Thunderstorms– Produce:– Tornados– Large Hail– High Straight-line Winds– (Floods and Lightning)
Occur where jet stream crosses the cold front.
102
Severe Thunderstorms associated with a cold front.
Weather Hazards in Winter Storms
103
Recap: Where are the hazards?
Weather Hazards
104
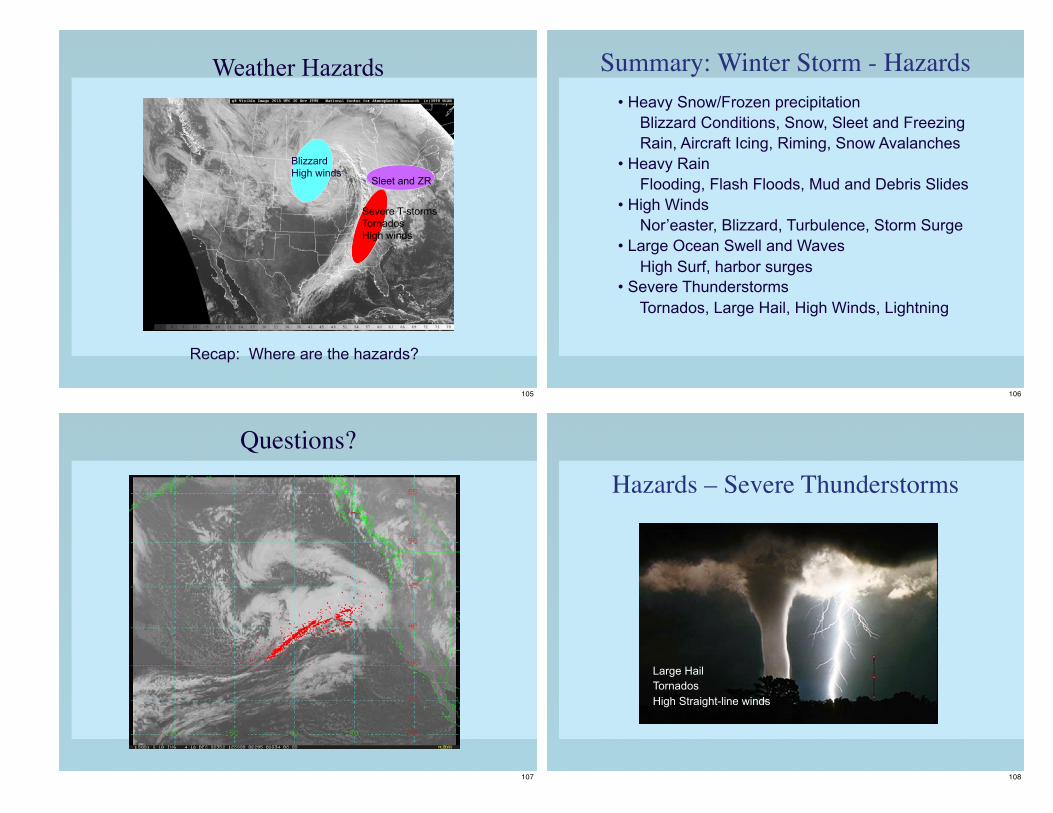
Severe T-stormsTornadosHigh winds
Sleet and ZR
BlizzardHigh winds
Recap: Where are the hazards?
Weather Hazards
105
Summary: Winter Storm - Hazards• Heavy Snow/Frozen precipitation Blizzard Conditions, Snow, Sleet and Freezing Rain, Aircraft Icing, Riming, Snow Avalanches• Heavy Rain Flooding, Flash Floods, Mud and Debris Slides• High Winds Nor’easter, Blizzard, Turbulence, Storm Surge• Large Ocean Swell and Waves High Surf, harbor surges• Severe Thunderstorms Tornados, Large Hail, High Winds, Lightning
106
Questions?
107
Hazards – Severe Thunderstorms
Large HailTornadosHigh Straight-line winds
108