Electromagnetic testing emt chapter 17 infrastructure applications
204
Electromagnetic Testing Chapter 17- Electromagnetic Techniques for Infrastructure Application 2015 March 22nd My ASNT Level III Pre-Exam Preparatory Self Study Notes Charlie Chong/ Fion Zhang
-
Upload
charlie-chong -
Category
Documents
-
view
231 -
download
1
description
Electromagnetic Testing-EMT Chapter 17 - Infrastructure Applications
Transcript of Electromagnetic testing emt chapter 17 infrastructure applications

Electromagnetic TestingChapter 17- Electromagnetic Techniques for Infrastructure Application2015 March 22nd My ASNT Level III Pre-Exam Preparatory Self Study Notes
Charlie Chong/ Fion Zhang

Charlie Chong/ Fion Zhang
Infrastructure Application

Charlie Chong/ Fion Zhang
Infrastructure Application

Charlie Chong/ Fion Zhang
Infrastructure Application

Charlie Chong/ Fion Zhang
Infrastructure Application

Charlie Chong/ Fion Zhang
Infrastructure Application

Charlie Chong/ Fion Zhang
Infrastructure Application

Charlie Chong/ Fion Zhang
Infrastructure Application

Charlie Chong/ Fion Zhang
Infrastructure Application

Charlie Chong/ Fion Zhang
Infrastructure Application

Charlie Chong/ Fion Zhang
Infrastructure Application

Charlie Chong/ Fion Zhang
Infrastructure Application

Charlie Chong/ Fion Zhang
Infrastructure Application

Charlie Chong/ Fion Zhang
Infrastructure Application

Charlie Chong/ Fion Zhang
Infrastructure Application

Charlie Chong/ Fion Zhang
Infrastructure Application

Charlie Chong/ Fion Zhang
Infrastructure Application

Charlie Chong/ Fion Zhang

Fion Zhang at ShanghaiMarch 2015
Charlie Chong/ Fion Zhang Shanghai 上海

Charlie Chong/ Fion Zhang
Greek letter

Charlie Chong/ Fion Zhang
Chapter Seventeen:Infrastructure Applications of Electromagnetic Testing

Charlie Chong/ Fion Zhang
17.1 PART 1. Eddy Current Detection of Cracks in SteelBridges
17.1.1 BackgroundThere are almost 590 000 bridges, tunnels and culverts in the United States. Steel superstructures are in more than 185000 bridges, more than any other superstructure material. Fatigue cracking in steel bridges can result from cyclical loading caused by traffic. Many fatigue cracks under field conditions develop at welds, which commonly have both complex geometry and complex metallurgy.
Fabrication discontinuities in welds, such as inclusions or lack of fusion, can provide stress risers that act as initiation sites for fatigue crack growth. The geometry of a particular weld, intersecting welds and high residual stress levels can also provide initiation sites. Hydrogen embrittlement and hydrogen assisted cracking can result in cracks in welds that may initially be small but can propagate under the cyclical loading conditions of a bridge.

Charlie Chong/ Fion Zhang
The propagation of fatigue cracks in bridges can lead to structural collapse if the cracks are not detected. Because many cracks begin in welds, crack detection near them must be effective so that cracks can be detected before they grow significantly.
This requirement has been an impediment to the application of eddy current testing on highway bridges: the welding geometry and varying magnetic properties caused by the complex metallurgy result in a low signal-to-noise ratio for some traditional eddy current technologies.
Historically, the eddy current technique has been used to test nonferrous structural items in the aerospace, chemical and processing industries. Since about 1990, the technology has been extended to include ferromagnetic materials and even ferromagnetic welds. Sensor designs address the variations in magnetic properties that have led to difficulties in the past. The discussion below reports on the effectiveness of eddy current testing for detecting cracks in weldments typical of highway bridge construction.

Charlie Chong/ Fion Zhang
17.1.2 Test Equipment
a) ProbeThe probe used in this application was a differential probe with bidirectional sensitivity. This probe can detect surface breaking cracks in both base and weld metal of steel bridge members. The probe consists of two circular coils with axes parallel to the surface and perpendicular to one another. A sketch of the probe configuration is shown in Fig. 1. Probes of similar design are available from several manufacturers. The probe operates in a differential configuration in which the impedance of one coil is compared with the impedance of the other, a common technique in eddy current testing. For this probe, each coil is very near the specimen surface, so both coils are simultaneously affected by the test specimen. The eddy currents generated in the surface of the specimen are an image of the coils in the probe, so each coil generates current with a significant current density aligned with its winding.

Charlie Chong/ Fion Zhang
FIGURE 1. Bidirectional probe arrangement: (a) oblique view; (b) side view.

Charlie Chong/ Fion Zhang
Under this geometry, orthogonal currents in the surface of the specimen are generated. In the differential mode, assuming negligible magnetic anisotropy of the material, each coil can have impedance consistent with that of the other as the probe is scanned along the specimen. The presence of a crack aligned with one coil and orthogonal 正交 with the other results in a change in relative impedance of the coils and consequently creates a detectable signal. In fact, any electromagnetic condition not common to each coil will be detected. Because the coils are located very near each other, gradual changes caused by conductivity or permeability variation are limited. Liftoff effects are also minimized but not suppressed, as both coils are simultaneously affected when distance from the test surface to the probe changes.
The maximum probe response is observed when the crack is perpendicular to the direction of either coil winding. Under this scenario, the crack interrupts the currents generated by the coil oriented orthogonal to the crack and has minimum influence on currents oriented parallel to the crack. Minimal responses occur when the crack is at 45 degrees from the direction of the coil winding because each coil experiences similar impedance changes and hence no relative change.

Charlie Chong/ Fion Zhang
Keywords:Minimal responses occur when the crack is at 45 degrees from the direction of the coil winding because each coil experiences similar impedance changes and hence no relative change.

Charlie C
hong/ Fion Zhang
Orthogonal

Charlie Chong/ Fion Zhang
The presence of a crack aligned with one coil and orthogonal 正交 with the other results in a change in relative impedance of the coils and consequently creates a detectable signal. In fact, any electromagnetic condition not common to each coil will be detected. Because the coils are located very near each other, gradual changes caused by conductivity or permeability variation are limited.
Coil#1
Coil#2

Charlie Chong/ Fion Zhang
b) InstrumentThe research was performed using a commercially available instrument that displays and stores eddy current test data collected by a probe. The manner in which the test signal is processed and displayed depends on the instrument settings. The values of drive levels (voltage peak) as well as frequencies can be selected independently. The instrument voltage ranges from 0 to 9 V peak and the frequency ranges from 5 Hz to 10 MHz.Instruments with similar characteristics are available from several manufacturers. Impedance plane mode and voltage plane mode were used during the testing. In both modes, the drive signal is applied across an alternating current bridge. One arm of the bridge consists of a resistor connected in series with one of the two coils of the probe. The second arm consists of a second resistor connected in series with the second coil in the probe.

Charlie Chong/ Fion Zhang
The voltage difference across the center of the bridge between the two coils is amplified and passed through a demodulator, which detects the in-phase and out-of-phase signal. The signal is then digitized to 16 bits and made available to the computer bus. In the impedance plane mode, the eddy current signal is displayed as a calibrated percent of change in impedance. In the voltage plane mode, the signal is also generated from an impedance bridge but the data are displayed as detected in-phase and out-of-phase voltages.

Charlie Chong/ Fion Zhang
c) Reference Standard Calibration Blocks and Crack SpecimensReference standard calibration blocks were produced from ASTM A 588 and ASTM A 36 structural steels, materials commonly used in bridge construction. Each block had three electric discharge machined (EDM) notches with depths of 0.2, 0.5 and 1.0 mm (0.008, 0.02 and 0.04 in.). The specimens were measured with no attempt to anneal or demagnetize them and the surface of the material was in its as rolled condition with mill scale removed.
To study the effects of typical bridge coatings, both an inorganic zinc based coating and a lead based coating were applied to the surface of an ASTM A 588 calibration block.
Three ASTM A 588 steel specimens with surface breaking cracks were tested. These specimens had weld details typical of steel bridge construction with implanted cracks. Two specimens had T joints that represent web-to-stiffener or web-to-flange connections.
Note: ASTM A588-Standard Specification for High-Strength Low-Alloy Structural Steel, up to 50 ksi [345 MPa] Minimum Yield Point, with Atmospheric Corrosion Resistance

Charlie Chong/ Fion Zhang
One specimen contained a butt joint, typically used for flange or web splices. The butt joint specimen and one of the T specimens had complete penetration groove welds. The other T joint was connected with a fillet weld. These specimens were subjected to corrosive environmental conditions such that the surface was pitted and covered with iron oxide. Testing was conducted without changing the surface conditions of the specimens.
A single specimen of ASTM A 36 steel with a groove weld containing a c The implanted crack had a depth of 0.90 mm (0.035 in.).

Charlie Chong/ Fion Zhang
Weld Crack

Charlie Chong/ Fion Zhang
17.1.3 Experimental Testing, Results and Discussion
a) Frequency Response
Tests were conducted to determine the frequency response of the eddy current probe and supporting instrumentation. Calibration blocks of ASTM A 588 and ASTM A 36 steel were used for the measurements. No significant differences in the results were found between the two materials, which are similar in chemistry and manufacturing process. The data points in Figs. 2 and 3 represent the maximum signal magnitude generated by scanning the probe along a path perpendicular to the long axis of an electric discharge machined notch or crack. A separate scan was required for each frequency datum shown in the figures.
The voltage plane mode scan of the reference standard ASTM A 588 steel specimen is shown in Fig. 2a. This figure indicates the variation in probe coil voltage versus frequency for 0.2, 0.5 and 1.0 mm (0.008, 0.02 and 0.04 in.) deep electric discharge machined notches. Maximum signal magnitudes for a given discontinuity depth are observed for frequencies ranging from 200 to 250 kHz.

Charlie Chong/ Fion Zhang
FIGURE 2. Fatigue crack signal frequency responses from electric dischargemachined notches: (a) with change in probe coil voltage for ASTM A 588 structural steel; (b) with change in probe coil inductive reactance for ASTM A 36 structural steel.
(a)

Charlie Chong/ Fion Zhang
FIGURE 2. Fatigue crack signal frequency responses from electric dischargemachined notches: (a) with change in probe coil voltage for ASTM A 588 structural steel; (b) with change in probe coil inductive reactance for ASTM A 36 structural steel.
(b)

Charlie Chong/ Fion Zhang
The general shape of these curves is a characteristic of the bridge output sensitivity. The voltage amplitude varied as a function of electric discharge machined notch depth as shown in Fig. 2a. The impedance plane mode probe response of two electric discharge machined notches, 0.5 and 1.0 mm (0.02 and 0.04 in.) deep, and a 0.9 mm (0.035 in.) deep implanted crack specimen are shown in Fig. 2b. The figure indicates that the probe response from a 0.5 mm (0.02 in.) deep electric discharge machined notch is higher than the response from the 0.9 mm (0.035 in.) deep implanted fatigue crack, regardless of the test frequency.
This verifies that the crack indication signal depends not only on discontinuity depth but also on discontinuity length and crack tightness.

Charlie Chong/ Fion Zhang
Electrical contact between crack faces because of crack geometry or oxides can cause a short circuit of the flow of the eddy currents around the crack opening and can change the response drastically. Additionally, some flow of current can circumvent the crack because of the semielliptical geometry of the crack. Consequently, smaller signals are expected from cracks than from open electric discharge machined notches. The effect of typical coatings are illustrated in Fig. 3.
The figures show the variation in the inductive reactance component versus frequency for a 1.0 mm (0.04 in.) electric discharge machined notch covered by either zinc (Fig. 3a) or red lead based coating (Fig. 3b). In these figures, the inductive reactance amplitude is observed to attenuate progressively because of the liftoff effect and distribution of the eddy currents in the coating layer. This attenuation is proportional to the coating thickness.

Charlie Chong/ Fion Zhang
The low electrical conductivity of the coating layer ensures the penetration of the eddy currents into the base metal. In fact, no significant variations are observed between signals affected by 0.4 mm (0.016 in.) red lead base coating and 0.4 mm (0.016 in.) liftoff (Fig. 3b). Similar results were found on the zinc based system as shown in Fig. 3a.
These data indicate that these coating systems can be penetrated by the magnetic field of the coils and that the effect of the coatings can be represented effectively by probe liftoff.

Charlie Chong/ Fion Zhang
FIGURE 3. Effects of paint on eddy current signal on electric discharge machined block of ASTM A 588 structural steel: (a) zinc based paint; (b) lead based paint.
(a)

Charlie Chong/ Fion Zhang
FIGURE 3. Effects of paint on eddy current signal on electric discharge machined block of ASTM A 588 structural steel: (a) zinc based paint; (b) lead based paint.
(b)

Charlie Chong/ Fion Zhang
b) Eddy Current Response to Cracks and Machined NotchesThis section illustrates the response of the eddy current probe to electric discharge machined notches and implanted cracks. The frequency and drive level used during scanning was 240 kHz and 3V, respectively. The probe response is illustrated primarily as a reactance component, with only small changes in the resistive component of the impedance. The abscissa of these figures plots successive data points, that is, as dimensionless time. This abscissa can be interpreted as distance, given a constant scanning velocity. Data were collected by manually scanning the probe along a linear path that traversed the feature of interest, either a crack or a notch. Scanning was conducted at constant rate of about 25 mm·s–1 (5 ft·min–1).
Figure 4 illustrates the eddy current response to scanning over electric discharge machined notches in the ASTM A 588 steel specimen. Scanning was performed from left to right along the surface of the specimen shown schematically in Fig. 4a.

Charlie Chong/ Fion Zhang
FIGURE 4. Reactive and resistive component of signal response for electricdischarge machined notches in ASTM A 588 structural steel: (a) cross section; (b) data.

Charlie Chong/ Fion Zhang
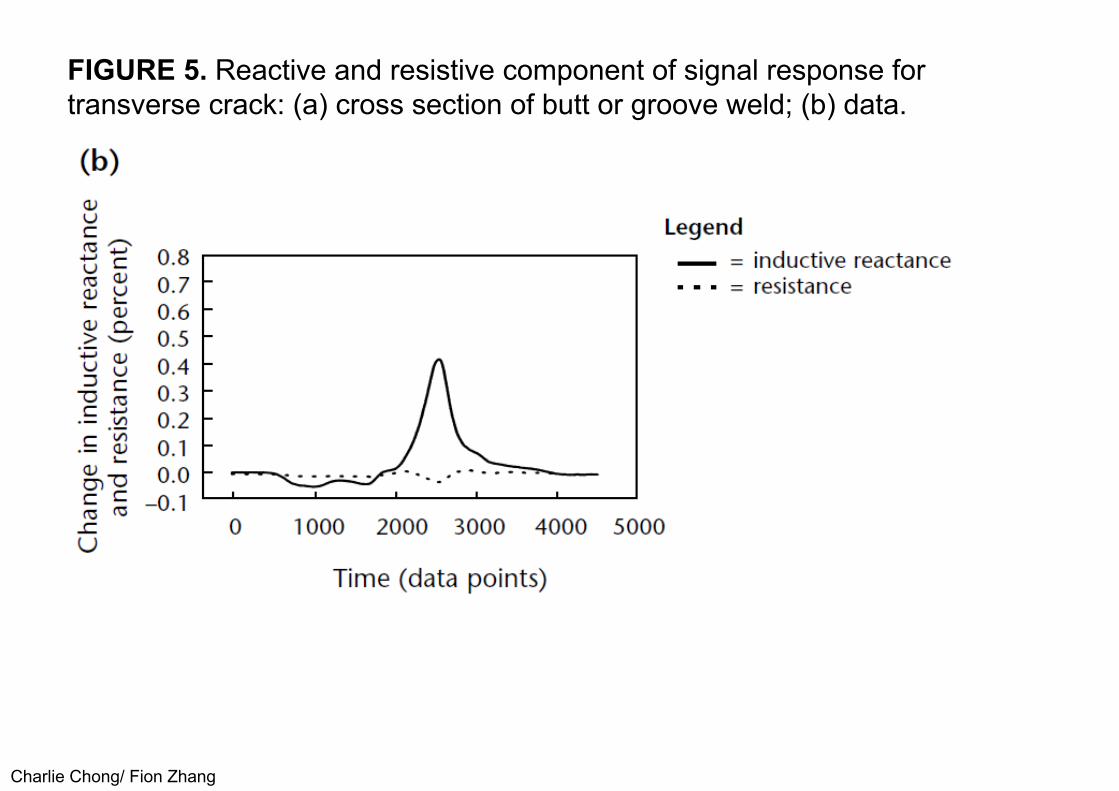
As expected, the magnitude of response increases with increasing notch depth. However, the ability of the eddy current techniques to accurately define the actual depth of a discontinuity is limited, as discussed in the next section. Figures 5 to 7 illustrate the eddy current response to cracks in different geometric conditions. In each case, scanning direction was coincident with the weld axis. Therefore, a transverse crack in a weld, as shown in Fig. 5, is oriented orthogonal to the scanning direction.
Figure 5b shows the response of the eddy current probe to a transverse crack. Of note in this figure is the low noise in areas adjacent to the discontinuity and the increasing magnitude of response as the probe approaches the crack and decreasing magnitude as the probe is scanned away from the crack. The maximum response corresponds to the probe positioned directly over the discontinuity.

Charlie Chong/ Fion Zhang
FIGURE 5. Reactive and resistive component of signal response for transverse crack: (a) cross section of butt or groove weld; (b) data.

Charlie Chong/ Fion Zhang
Figure 6 indicates the eddy current response to a longitudinal crack in the weld crown. Figure 7 indicates the responses to a toe crack (Fig. 7b) and root crack (Fig. 7c). Of note in these figures is the characteristic eddy current response of a longitudinal crack, increasing in magnitude as the probe approaches the crack, maintaining a magnitude displacement as the probe is scanned directly over the crack and diminishing in magnitude as the probe is scanned beyond the crack. Compared qualitatively to the response to a transverse crack, eddy current response shows crack orientation and can be easily interpreted.
Additionally, the bidirectional sensitivity of the probe enables it to detect both longitudinal and transverse cracking as it is scanned along a weld.
As mentioned previously, the probe is least sensitive to a discontinuity oriented at 45 deg to the probe coil axes.
Charlie Chong/ Fion Zhang
FIGURE 5. Reactive and resistive component of signal response for transverse crack: (a) cross section of butt or groove weld; (b) data.

Charlie Chong/ Fion Zhang
FIGURE 6. Impedance components of signal response for longitudinal crack: (a) T or fillet weld; (b) data from probe as probe is passed along length of crack.

Charlie Chong/ Fion Zhang
FIGURE 6. Impedance components of signal response for longitudinal crack: (a) T or fillet weld; (b) data from probe as probe is passed along length of crack.

Charlie Chong/ Fion Zhang
FIGURE 7. Impedance components of signal response for longitudinal crack: (a) cross section of T or groove weld; (b) data for crack in toe; (c) data for crack in root.

Charlie Chong/ Fion Zhang
FIGURE 7. Impedance components of signal response for longitudinal crack: (a) cross section of T or groove weld; (b) data for crack in toe; (c) data for crack in root.

Charlie Chong/ Fion Zhang
FIGURE 7. Impedance components of signal response for longitudinal crack: (a) cross section of T or groove weld; (b) data for crack in toe; (c) data for crack in root.

Charlie Chong/ Fion Zhang
c) Case Study: Steel Box GirderThe eddy current technique previously described was field tested on a welded steel box girder. The fracture critical member supported the south span of a double-swing bridge. The pivot girder supporting the north span of the bridge had time delayed cracking following production and shipping to the bridge site.
Magnetic particle testing had revealed more than 150 cracks in this member during tests at the fabrication plant, following shipment to the bridge site and following placement. The magnetic particle testing procedure required the removal of a zinc based coating to facilitate contact between the prods and the member - a procedure undesirable to the bridge owner.
The eddy current technique was used to eliminate the need for paint removal during testing of the south girder. At the time of the test, both pivot girders were in place on the structure. The member tested was constructed of ASTM A 709 grade 70W steel, with multi-pass fillet welds at the intersection of each corner of the box and along the stiffeners.

Charlie Chong/ Fion Zhang
Steel Box Girder

Charlie Chong/ Fion Zhang
Steel Box Girder

Charlie Chong/ Fion Zhang
Plate thickness ranged from 32 to 76 mm (1.25 to 3.0 in.). The zinc based coating on the structure had a thickness of about 0.2 mm (0.01 in.), based on measurements taken on the north girder. The coating system included both an intermediate and finish layer, for a total coating thickness of about 0.4 to 0.5 mm (about 0.02 in.). Surface scanning of about 250 m (820 ft) of fillet weld included all flange-to-web and web-to-stiffener welds.
The testing of the weld bead required between three and five passes of the probe for complete coverage of the weld surface and the heat affected zone. Known fatigue cracks located on the north girder by magnetic particle testing were used as test specimens to determine frequency and drive levels for the probe.
A calibration specimen was made from a piece of ASTM A 709 steelcontaining electric discharge machined notches with depths of 0.5, 1.0 and 2.0 mm (0.02, 0.04 and 0.08 in.).

Charlie Chong/ Fion Zhang
Liftoff due to coating was assumed to reduce signal amplitudes about 40 percent, which compensated for variations in the calibration procedure. Indications were determined by a simple, reactance threshold equivalent to about 20 percent full screen height.
All signals exceeding this threshold were marked as indications. Tests of the south girder revealed the following: three cracks, seven slag inclusions, seven undercuts and one rollover. Indications were excavated with a mechanical grinder to confirm the source of the indication.
Of the 18 indications noted during the test, three correlated with cracks. It was found that the balance of the indications could be differentiated from cracks by visual testing in the case of geometric indications and by signal response in the case of slag inclusions. Because of the time dependent nature of the cracking in the north girder, periodic tests of the girder at three-month intervals were scheduled.

Charlie Chong/ Fion Zhang
Based on the speed and simplicity of eddy current testing and the success on the south girder in detecting cracks without removal of coating, the eddy current technique was included in these tests. The instrument was a hand held battery operated eddy current instrument with a 4 MHz absolute probe having a probe footprint much smaller than the bidirectional probe of Fig. 1. This small footprint had the advantage of reducing the sensitivity to geometric indications. The hand held battery operated instrument displayed indications as normalized impedance and was self- balancing.

Charlie Chong/ Fion Zhang
17.1.4 ConclusionThe discussion above reports on the effectiveness of eddy current testing for detecting cracks in weldments typical of highway bridge construction. The laboratory tests showed that the bidirectional probe configuration can be used to detect cracks in weld metal. The probe coil design suppresses the effects of spatially varying magnetic properties typically associated with the weld area in ferromagnetic steel. When the weld bead is scanned, irregular surface geometry is the main cause of noise.
The technique is effective for detecting cracks under paint. The laboratory tests showed that the eddy currents could penetrate both conductive and nonconductive coatings typically used on bridges. The effects of these coatings were proportional to the coating thickness and similar to liftoff effects. The attenuation caused by these effects can result in increased sensitivity to geometric indications that may mask smaller discontinuities; however, the cracks could generally be distinguished from welding discontinuities such as rollover or undercut.

Charlie Chong/ Fion Zhang
The bidirectional probe responded well to field variables such as conductive coating thickness, irregular weld surfaces and weld joint geometry.
The eddy current technique used has several advantages over magnetic particle testing.
First, removal of coating to ensure good electrical contact is not required. Second, the bidirectional probe is sensitive to both longitudinal and
transverse cracks simultaneously in weld metal. Probes of this type are available from several manufacturers.
It is recommended that the probe be calibrated for optimal frequency before performing any test. Interpretation of the eddy current signals can be accomplished with a moderate amount of training and experience and inspectors should have the appropriate qualifications.

Charlie C
hong/ Fion Zhang
17.2 PAR
T 2. Applications of G
round PenetratingR
adar to Bridge D
ecks17.2.1 B
ackgroundR
adar (radio detection and ranging) is a technique that has been applied traditionally to problem
s related to object detection in air. Since the 1960s, the technology has developed to detect and locate objects below
the surface of the ground as w
ell.
Ground penetrating radar system
s typically transmit m
icrowave pulses into
the ground and measure reflected energy through a receiving antenna.
Boundaries between m
aterials with different dielectric properties (such as
concrete and air) produce reflections when a radar pulse encounters them
. In the 1970s, the resolution of ground penetrating radar system
s was suitable
only for geophysical applications. Since then, ground penetrating radar system
s with significantly higher resolution have been developed
that can detect features of interest in civil infrastructure m
aterials and components.

Charlie Chong/ Fion Zhang
Civil infrastructure applications to roads, bridges, dams and a variety of other infrastructure facilities have produced useful ground penetrating radar results. Ground penetrating radar applications to bridges are challenging and interesting because they typically require systems with high resolution to detect features of interest.
Among bridge applications, testing of bridge decks has potential because of the large, accessible surface area and a high level of maintenance interest focused on them. Bridge decks deteriorate significantly faster than most other bridge components and the dominant deterioration mechanism, corrosion induced delamination, is well understood.
Ground penetrating radar is currently a useful tool for investigating many bridge deck conditions that include concrete cover depth, poorly consolidated concrete, voids and several other features of interest. As technology advances, test results indicate that ground penetrating radar may also allow delamination to be directly addressed, as well.

Charlie Chong/ Fion Zhang
17.2.2 EquipmentGround penetrating radar systems typically include a radar pulse generator, transmitter, receiver, antenna and equipment for data acquisition and storage. Depending on the application, systems described as either ground coupled or air coupled may be used. Air coupled systems use antennas positioned at or above a height related to the center frequency the antenna transmits, a height clearance above the ground equivalent to a minimum of the wavelength at the radar center frequency. Most ground coupled antennas are positioned such that the antenna housing is directly in contact with the ground. Typically, air coupled antennas are mounted in a vehicle to collect data from a moving platform in traffic. Conversely, ground coupled antennas are typically hand held (Fig. 8) where the antenna is manually positioned during data collection. For bridge deck applications, both of these ground penetrating radar systems may be used, depending on the survey needs.

Charlie Chong/ Fion Zhang
FIGURE 8. Hand held ground penetrating radar instrument in use on bridge deck.

Charlie Chong/ Fion Zhang
FIGURE 8. Hand held ground penetrating radar instrument in use on bridge deck.

Charlie Chong/ Fion Zhang
FIGURE 8. Hand held ground penetrating radar instrument in use on bridge deck.

Charlie Chong/ Fion Zhang
The ground penetrating radar system functions by transmitting a radar pulse from the transmitting antenna into the ground and uses the receiving antenna to collect the reflected radar response from the ground. This process occurs very quickly, allowing the radar pulse to be transmitted and the waveform to be acquired with negligible distortion from movement, even at traffic speeds.
Data collection is usually triggered by a mechanism connected to a survey wheel. As the survey wheel turns, it initiates data acquisition at consistent intervals. The series of individual waveforms collected along the path of the radar antenna can be viewed collectively as a synthetic aperture. Raw data collected using a ground coupled ground penetrating radar are presented over a two-dimensional synthetic aperture (Fig. 9). In this format, the radar response is presented in color maps that indicate high positive amplitude responses as light gray to white and low negative amplitude responses as dark gray to black.

Charlie Chong/ Fion Zhang
FIGURE 9. Bridge deck: (a) data locations indicated by horizontal lines on deck surface; (b) numbered station locations with color or grayscale coded bar indicating confirmed delamination locations along data collection line [solid = delaminated, white = without delaminations]; (c) raw synthetic aperture radar data collected from bridge deck using commercial ground coupled radar system.

Charlie Chong/ Fion Zhang
Basic features observed in these data include an example of a parabolic shaped response to reinforcing steel (identified with a circle) and a local area where reflection amplitudes are low, encircled by a horizontally oriented oval. Details of Fig. 9 are interpreted below. The center frequency of a system is another important consideration when ground penetrating radar equipment is selected for a given application. A ground penetrating radar that operates at high frequencies can resolve smaller features than ground penetrating radar operating at lower frequencies. This resolution issue must be carefully considered when ground penetrating radar equipment is selected for an application like bridge deck evaluation.

Charlie Chong/ Fion Zhang
Ground-penetrating radar (GPR) is a geophysical method that uses radar pulses to image the subsurface. This nondestructive method uses electromagnetic radiation in the microwave band (UHF/VHF frequencies) of the radio spectrum, and detects the reflected signals from subsurface structures. GPR can have applications in a variety of media, including rock, soil, ice, fresh water, pavements and structures. In the right conditions, practitioners can use GPR to detect subsurface objects, changes in material properties, and voids and cracks.
GPR uses high-frequency (usually polarized) radio waves, usually in the range 10 MHz to 1 GHz. A GPR transmitter emits electromagnetic energy into the ground. When the energy encounters a buried object or a boundary between materials having different dielectric constants, it may be reflected or refracted or scattered back to the surface. A receiving antenna can then record the variations in the return signal. The principles involved are similar to seismology, except that electromagnetic energy is used instead of acoustic energy, and energy may be reflected at boundaries where subsurface electrical properties change rather than subsurface mechanical properties as is the case with seismic energy.
http://en.wikipedia.org/wiki/Ground-penetrating_radar

Charlie Chong/ Fion Zhang
The electrical conductivity of the ground, the transmitted center frequency, and the radiated power all may limit the effective depth range of GPR investigation. Increases in electrical conductivity attenuate the introduced electromagnetic wave, and thus the penetration depth decreases. Because of frequency-dependent attenuation mechanisms, higher frequencies do not penetrate as far as lower frequencies. However, higher frequencies may provide improved resolution. Thus operating frequency is always a trade-off between resolution and penetration. Optimal depth of subsurface penetration is achieved in ice where the depth of penetration can achieve several thousand meters (to bedrock in Greenland) at low GPR frequencies. Dry sandy soils or massive dry materials such as granite, limestone, and concrete tend to be resistive rather than conductive, and the depth of penetration could be up to 15-metre (49 ft). In moist and/or clay-laden soils and materials with high electrical conductivity, penetration may be as little as a few centimeters.
Ground-penetrating radar antennas are generally in contact with the ground for the strongest signal strength; however, GPR air-launched antennas can be used above the ground.
Cross borehole GPR has developed within the field of hydrogeophysics to be a valuable means of assessing the presence and amount of soil water.
http://en.wikipedia.org/wiki/Ground-penetrating_radar

Charlie C
hong/ Fion Zhang
Radar Survey http://en.wikipedia.org/wiki/Ground-penetrating_radar

Charlie Chong/ Fion Zhang
A ground-penetrating radargram collected on a historic cemetery in Alabama, USA. Hyperbolic arrivals (arrows) indicate the presence of diffractors buried beneath the surface, possibly associated with human burials. Reflections from soil layering are also present (dashed lines).
http://en.wikipedia.org/wiki/Ground-penetrating_radar
Charlie Chong/ Fion Zhang
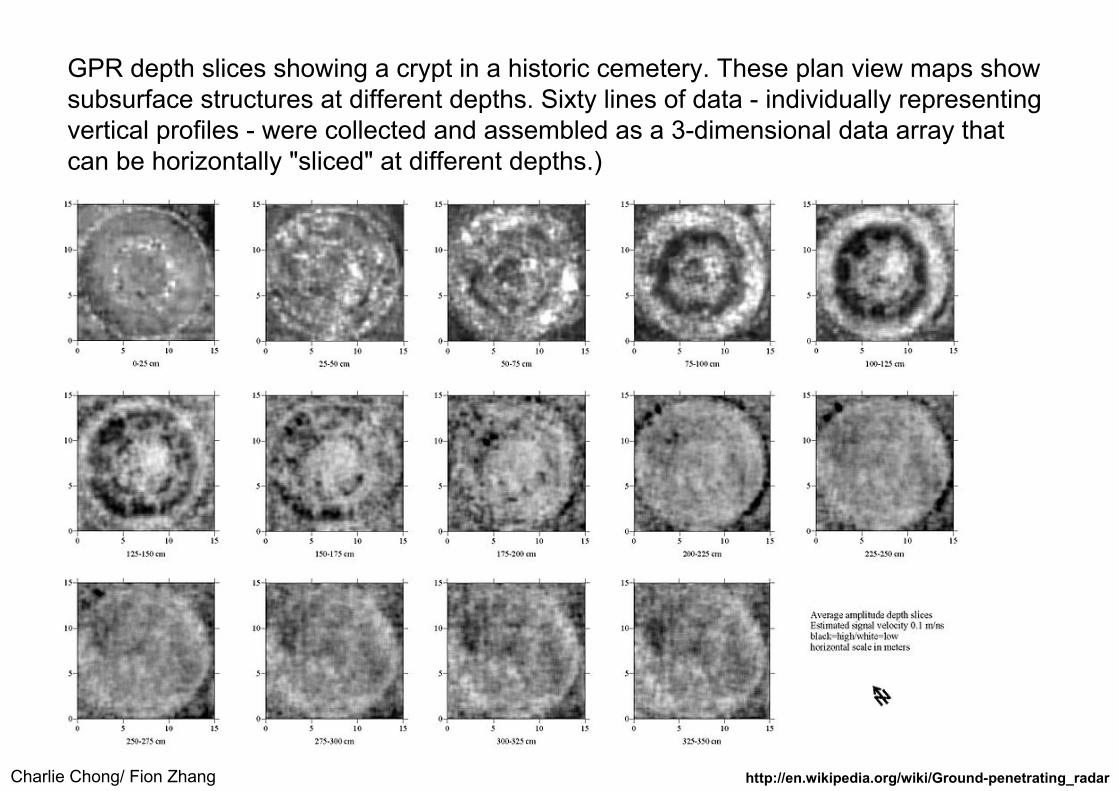
GPR depth slices showing a crypt in a historic cemetery. These plan view maps show subsurface structures at different depths. Sixty lines of data - individually representing vertical profiles - were collected and assembled as a 3-dimensional data array that can be horizontally "sliced" at different depths.)
http://en.wikipedia.org/wiki/Ground-penetrating_radar

Charlie Chong/ Fion Zhang
17.2.3 Detection and Measurement of Deck ConditionsSeveral parameters that bridge engineers use can be measured with ground penetrating radar. In addition, there are distress modes that can be detected using this technology. The available measurements include concrete cover depth, bridge deck thickness and reinforcing steel location. Frequently detected discontinuity or distress modes include voids, poorly consolidated concrete and material property differences. Measured parameters, such as concrete cover depth, must be determined using a calibration core or equivalent calibration data. The core or calibration data allow the propagation velocity and some dielectric properties of bridge deck materials to be determined for electromagnetic waves. After reference values have been determined at known locations, material properties of homogeneous areas around them can be inferred.

Charlie Chong/ Fion Zhang
Once these material property reference values are known, cover depth and bridge deck thickness can be calculated directly. In addition, migration algorithms and other data reconstruction techniques can be applied to raw data to produce radar images, given that dielectric material properties can be inferred from core data or equivalent test information. These radar images are often useful for locating of reinforcing steel.
Discontinuity or distress modes such as voids, poorly consolidated concrete and material property differences are all features that ground penetrating radar is generally useful in detecting. Air voids that can result from inadequacies in physical mixing are detected using ground penetrating radar because of the dielectric property contrast between concrete and the air in the void. In a similar way, poorly consolidated concrete produces a response where a portion of the concrete volume within the bridge deck scatters radar energy more than adjacent, properly placed concrete.
Finally, material property differences in the concrete, caused by the presence of chlorides, water, deteriorated concrete or contaminants can affect both velocity and dispersion properties of concrete.

Charlie Chong/ Fion Zhang
Two areas of ground penetrating radar research for bridge deck applications are imaging delaminations and penetrating asphalt overlays, although many systems already produce useful results through asphalt overlays.Delamination imaging is an important goal for bridge engineers but the resolution of commercial ground penetrating radar systems has made direct imaging of these discontinuities difficult. Research indicates that high frequency ground penetrating radar systems can image a significant proportion of delamination in laboratory and field bridge decks. As this technology develops, the capability of many ground penetrating radar systems to penetrate asphalt overlays may also improve, making it more useful for locating bridge deck problems without removing the asphalt layer. The additional thickness of the asphalt layer has contributed to dispersion and attenuation of the ground penetrating radar response - something that has needed to be compensated for.

Charlie Chong/ Fion Zhang
17.2.4 Ground Truth DataThe term ground truth testing generally refers to examination of features on the ground to confirm satellite telemetry. In the present discussion, ground truth testing refers to coring and acoustic tests for comparison with ground penetrating radar results. Ground truth data from several different techniques can be used to enhance the reliability of ground penetrating radar data. Implementation of these techniques through comprehensive testing of a bridge deck or local testing in areas of interest on a bridge deck can provide useful confirmation for ground penetrating radar data interpretation. Among ground truth techniques, ASTM D 4580 describes chain dragging, aqualitative acoustic method commonly applied to bare concrete bridge decks. The technician drags a chain across the surface of the bridge deck and listens for hollow sounds. Other techniques that can be used for confirmation include hammer sounding, infrared imaging and coring.

Charlie Chong/ Fion Zhang
The wide range of conditions in field bridge decks in terms of materials, property variations and design configurations has a role in determining the amount and type of additional testing that should accompany ground penetrating radar testing. Bridge decks with wide reinforcing steel spacing that exhibit material property homogeneity and generous clearances at boundaries, among other design features, are most conducive to ground penetrating radar testing and require minimal verification testing through ground truth techniques. However, bridge decks with material property or designs that impede ground penetrating radar testing require additional verification testing.

Charlie Chong/ Fion Zhang
17.2.5 Example ApplicationsTwo applications of bridge deck ground penetrating radar are presented to illustrate routine measurements and results obtained from emerging ground penetrating radar technology. The first example presents data collected from the Van Buren Road Bridge deck, Dumfries, Virginia. The second example presents data collected from a bridge over Lake Anna, near Fredericksburg, Virginia. Tests on the Van Buren Road Bridge provide a broad range of corroborating test data that accompany the ground penetrating radar data. The Lake Anna tests provide data for a more basic comparison between ground penetrating radar technology and typical acoustic13 and coring tests.

Charlie Chong/ Fion Zhang
a) Van Buren Road Bridge DeckFigure 9 presents results obtained from a ground penetrating radar scan along the 18 m (59 ft) center span of the Van Buren Road Bridge deck. The path of the scan is indicated by a sequence of numbers on a plan view drawing of this deck (Fig. 9). Subsurface delamination cracking was identified in the bare concrete deck by using an acoustic chain drag method before ground penetrating radar testing and is indicated by rectilinear outlines in the plan view diagram (Fig. 9a). In addition, a corresponding color coded bar identifies acoustically detected delamination locations along the path of the collected data (Fig. 9).

Charlie Chong/ Fion Zhang
The ground penetrating radar scan along the designated path in Fig. 9 was conducted using a multichannel data acquisition system in a hand held configuration (Fig. 8). The results of the Fig. 9 scan illustrate one of the many ground penetrating radar responses to reinforcing steel at an individual circled location. The circled response is a characteristic parabolic shaped feature, typical of a point reflector in two-dimensional ground penetrating radar data. In this case, the reinforcing steel appears to be a point reflector because the steel orientation is orthogonal to the path of the ground penetrating radar. As the radar approaches this steel feature along a linear path, the travel time for the radar response to the steel changes from a relatively long duration down to a minimum travel time, when the antenna is directly above the steel.

Charlie Chong/ Fion Zhang
As the antenna continues along its linear path beyond the steel feature, the travel time of the radar pulse begins to increase again. If the concrete’s radar velocity and loss properties (numerically defined by dielectric properties) are known, then calculations can be performed to focus these parabola shaped features to point images. These images therefore represent the originally detected feature. There are several approaches to accomplishing this imaging task, depending on assumptions about the problem at hand.
One of these approaches, known as wave field backpropagation, has been implemented in Fig. 10 and is discussed below. In addition to the commonly observed response to reinforcing steel, the ground penetrating radar scan presented in Fig. 9 illustrates an anomaly that has two possibleinterpretations. The anomaly is encircled by a horizontally oriented oval, which identifies several low amplitude reinforcing steel responses. This collection of responses identifies an area where the steel is either physically deeper below the deck surface than adjacent steel or the dielectric properties of the concrete are exhibiting variations. This type of anomaly may indicate deteriorating concrete.
Charlie Chong/ Fion Zhang
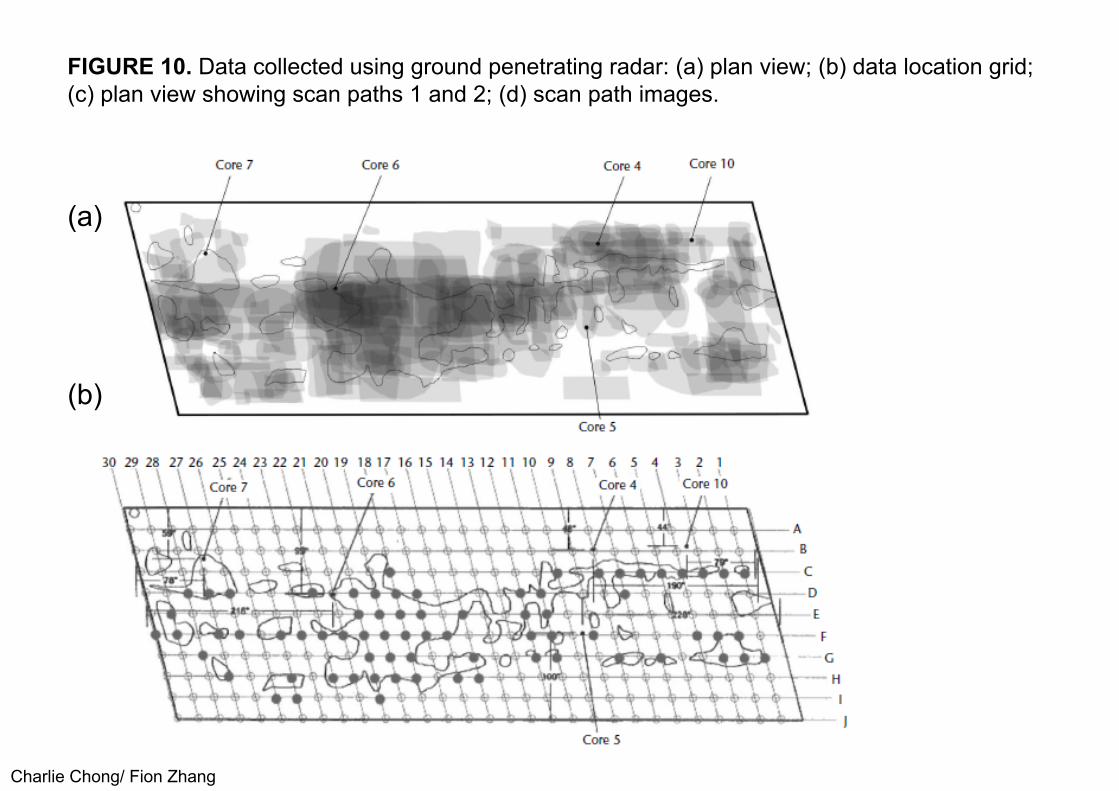
FIGURE 10. Data collected using ground penetrating radar: (a) plan view; (b) data location grid; (c) plan view showing scan paths 1 and 2; (d) scan path images.
(a)
(b)

Charlie Chong/ Fion Zhang
FIGURE 10. Data collected using ground penetrating radar: (a) plan view; (b) data location grid; (c) plan view showing scan paths 1 and 2; (d) scan path images.
(c)
(d)

Charlie Chong/ Fion Zhang
In this particular bridge deck, the ground penetrating radar results and the acoustic sounding results presented in the plan view drawing (Fig. 9a) identify different problem areas. Comparing the locations of delaminations identified by acoustic testing of the entire bridge deck with anomalies in the ground penetrating radar data shows that the two test methods identify different phenomena. In this particular test, thin concrete delamination cracks were the feature of interest for an engineering research project.
An analysis of the data that included concrete coring indicates that the acoustic testing was more effective than ground penetrating radar for identifying delamination in this bridge deck. Figure 10 illustrates a range of different bridge deck tests conducted on the same span of the Van Buren Road Bridge deck presented in Fig. 9. Figures 10a to 10c each present results from the same span, overlaid on a separate diagram for clarity. This testing is described in detail elsewhere. In brief, these additional test data indicate many of the advantages and limitations of the ground penetrating radar test.

Charlie Chong/ Fion Zhang
Figure 10a shows the test results obtained by 21 different inspection teams using the acoustic chain drag test. In this figure, light gray areas indicate delamination locations identified by fewer inspection teams while dark areas indicate locations where more inspection teams identified delaminations. A reference chain drag survey result, obtained using unusual attention to detail, is indicated in Fig. 10a to Fig. 10c by line enclosed areas. Significant differences between inspection team results are observed. In Fig. 10b, results from the acoustic impact echo test are presented. Here, delaminated areas are indicated with closed circles while solid concrete is indicated with open circles. Agreement between the reference chain drag survey and the impact echo testing is evident.

Charlie Chong/ Fion Zhang
Figure 10c presents test results from two ground penetrating radar systems. A Federal Highway Administration ground penetrating radar system was used to collect data in the plan view presentation. Here, images from the reinforcing steel level of the bridge deck indicate features such as the reinforcing steel itself and local variations in the response magnitude. The ground penetrating radar images were derived from raw data processed with wave field backpropagation14 and were collected by traversing the bridge deck twice with an array of radar antennas at 8 km·h–1 (5 mi·h–1). This imaging indicates few areas of agreement between acoustic chain drag test results and ground penetrating radar system test results for delamination detection. Raw radar data from a ground penetrating radar antenna along scan path 1 in Fig. 10c are shown with raw data collected along scan path 2. These raw data illustrate typical radar responses from both systems; corresponding color bars indicate delamination detection results for both tests. Figure 10c radar results are consistent with the Fig. 9 results.

Charlie Chong/ Fion Zhang
b) Lake Anna Bridge DeckFigure 11 presents results from a Federal Highway Administration ground penetrating radar system.10 These results were obtained from the Lake Anna Bridge deck. A diagram in Fig. 11a illustrates a portion of the bridge deck in plan view on a 0.6 × 0.6 m (24 × 24 in.) grid. An area is highlighted to indicate the delaminated areas detected using an acoustic chain drag technique and cored locations are indicated with black circular symbols. Figures 11b to 11d illustrate images derived from system data by using wave field backpropagation. These results are all presented to scale in a plan view (Fig. 11a). Figure 11b illustrates data from the deck surface, Fig. 11b shows data from the top reinforcing steel layer and Fig. 11c shows data from the bottom reinforcing steel layer. These images indicate strong radar reflections in light colors up to white and lower magnitude responses in dark colors down to black.

Charlie Chong/ Fion Zhang
FIGURE 11. Ground penetrating radar results from Lake Anna Bridge deck: (a) plan view of part of bridge deck; (b) backpropagation image from surface of bridge deck; (c) backpropagation image from top steel layer; (d) backpropagation image from bottom steel layer.

Charlie Chong/ Fion Zhang
An area of interest in Fig. 11b is the bright response, to the right and below the middle of the image. This location corresponds to surface patch material that was used to repair the bridge deck. Figure 11c illustrates a response to a delaminated area indicated by an undulating boundary traversing the width of the image. On one side of the boundary, reinforcing steel is imaged clearly and sound concrete areas produce low magnitude radar reflections. On the other side of the boundary, reinforcing steel imaging is degraded and delaminated areas produce a significant radar reflection between reinforcing steel locations. The boundary between these areas has a geometry similar to that of the boundary identified in the chain drag testing but is shifted. Core testing indicates that shift can be accounted for by inaccuracies in data registration along the curved bridge section from which the data were acquired. Figure 11d illustrates the response at the bottom mat of the reinforcing steel, where the reflection from the delamination in the top mat of reinforcing steel has occluded features that would have otherwise been imaged in the bottom reinforcing steel mat.

Charlie Chong/ Fion Zhang
Based on the ground penetrating radar data presented in Figs. 9 to 11, additional information can be derived, such as concrete cover depth and bridge deck thickness. These engineering measurements are subject to measurement errors caused by heterogeneities in concrete properties but their information is still useful, particularly when the measurements are made over an entire bridge deck. Delaminations, voids and other discontinuities and distress in bridge decks can be detected by ground penetrating radar when the resolution limits of a system are high enough. The results indicate that test methods that complement ground penetrating radar can be used to confirm the types of features a specific ground penetrating radar system can detect in a particular bridge deck.
Charlie Chong/ Fion Zhang
17.2.6 Recommended PracticesGround penetrating radar references that provide useful guidance to bridge engineers and ground penetrating radar practitioners include the following: AASHTO TP36, Standard Test Method for Evaluating Asphalt Covered Concrete Bridge Decks Using Pulsed Radar;16 NCHRP Synthesis 255, Ground Penetrating Radar for Evaluating Subsurface Conditions for Transportation Facilities;17 ASTM D 4748-87, Test Method for Determining the Thickness of Bound Pavement Layers Using Short-Pulse Radar;18 and ASTM D 6432-99, Standard Guide for Using the Surface Ground Penetrating Radar Method for Subsurface Investigation.19

Charlie Chong/ Fion Zhang
17.2.7 ConclusionsModern ground penetrating radar technology provides a tool to evaluate distress and to measure subsurface engineering parameters of bridge decks. Example results have been presented for ground penetrating radarapplications to specific bridge decks. These test results illustrate an approach to extracting engineering information from ground penetrating radar data. Bridge engineers and managers can subsequently use these data to make informed decisions. Although this technology has matured significantly, engineering judgment is required to select appropriate equipment, calibration techniques and corroborating test methods. Bridge decks are a demanding application of ground penetrating radar. The rigor of the application requires refined ground penetrating radar technology.

Charlie Chong/ Fion Zhang
17.3 PART 3. Magnetic Flux Leakage Testing of Wire Rope17.3.1 BackgroundBecause the reliability of wire ropes is crucial for the safety of many mining, oil industry, crane and ski lift operations, concern with their integrity is a constant preoccupation of users and safety authorities. In spite of these concerns, a frequent reluctance to apply appropriate wire rope test techniques and retirement criteria compromise safety in many cases although dependable test techniques and instrumentation are available.
Effective procedures, combined with a good understanding of degradation mechanisms and discard criteria, can notably increase wire rope safety. For example, advanced electromagnetic wire rope test equipment of the magnetic flux leakage type has been developed since the 1960s. These instruments provide an important and in many cases indispensable element of wire rope testing.

Charlie Chong/ Fion Zhang
Wire Rope

Charlie C
hong/ Fion Zhang
Wire Rope

Charlie Chong/ Fion Zhang Offshore Mooring Wire Rope

Charlie Chong/ Fion Zhang
Standard for Electromagnetic Tests of Wire Rope
ASTM E 1571, Standard Practice for Electromagnetic Examination of Ferromagnetic Steel Wire Rope, describes several electromagnetic techniques to detect discontinuities and changes in metallic cross sectional area in ferromagnetic wire rope products.
ASTM E 1571 is for rope diameters up to 64 mm (2.5 in.); larger diameters may be included, subject to agreement by the users of this practice. The standard practice also covers reference standards for wire rope testing. Of the techniques described in ASTM E 1571, one type of magnetic flux leakage testing has been applied widely for wire rope testing and is the subject of the present discussion.
Note:ASTM E1571 - 11Standard Practice for Electromagnetic Examination of Ferromagnetic Steel Wire Rope.

Charlie Chong/ Fion Zhang
ApproachesTwo different and distinct magnetic techniques have evolved for the detection
and measurement of rope discontinuities.
1. Testing for loss of metallic cross sectional area quantitatively measures external or internal loss of metal because of corrosion (due to environmental conditions or poor lubrication) and wear (caused by rubbing along floors, by nicking, by high pressures and by poor lubrication).
2. Localized discontinuity testing qualitatively detects a wide variety of external and internal discontinuities such as broken wires and corrosion pitting. Broken wires are usually caused by fatigue, interstrand nicking and martensitic embrittlement. Modern dual-function electromagnetic rope testers (Fig. 12) allow simultaneous tests for loss of metallic cross sectional area and localized discontinuities.

Charlie Chong/ Fion Zhang
FIGURE 12. Electromagnetic testing of mooring rope.

Charlie Chong/ Fion Zhang
17.3.2 Underlying PrinciplesFor dual-function instruments, strong permanent magnets induce a magneticflux at the saturation level in the rope in the axial (longitudinal) direction. Various types of sensors close to the rope — such as coils, hall sensors or flux gate sensors — sense and measure the magnetic flux. Any discontinuity — such as a broken wire or corrosion pitting — distorts the magnetic flux in the rope and causes it to leak from the rope. For localized discontinuity tests, the radial component of the leakage flux is measured by sensors called radial sensors. Note that these sensors are also called differential sensors because they sense only changes of the magnetic flux in the rope and not the flux itself. Therefore, discontinuity detection depends on a rapid change of the magnetic flux, typically caused by broken wires and corrosion pitting.
Keywords:Radial sensors/ differential sensors

Charlie Chong/ Fion Zhang
Differential sensors cannot detect more gradual changes of the rope flux, changes typically caused by wear and corrosion. The axial component of the leakage flux can be measured by axial sensors. This axial leakage flux signal is frequently offered as a substitute for the loss of metallic cross sectional area signal. However, while the axial signal can be useful for qualitative discontinuity characterization, it is very complex and cannot be used directly to determine the loss of metallic cross sectional area of a rope. Therefore, instruments that use this approach are not of the dual-function type as defined above. Techniques for the quantitative measurement of the loss of metallic cross sectional area of a rope are discussed below.

Charlie Chong/ Fion Zhang
When a rope is magnetically saturated, the axial magnetic flux in the rope is proportional to its cross sectional area. Therefore, any loss of metallic cross sectional area can be determined by measuring this magnetic flux.
Two types of sensors can be used to measure magnetic flux: hall sensors (or flux gate sensors) and coils in combination with electronic integrator circuits. To measure flux density, hall sensors (and flux gate sensors) must be physically inserted directly into the magnetic flux path. Thus, the flux to be measured must intersect the sensors. This is not possible when measuring the magnetic flux inside the rope. Therefore, instruments that use hall sensors or flux gate sensors must always resort to an indirect technique for determining the axial rope flux. They measure some flux density outside the rope and determine or estimate the longitudinal rope flux from the external flux measurement.

Charlie Chong/ Fion Zhang
Alternatively coils with integrators can be used. Because coils must encircle the magnetic flux to be measured, they can directly measure the magnetic flux inside the rope. In general, two techniques are used for the determination of loss of metallic cross sectional area: the main flux technique and the return flux technique (Fig. 13).

Charlie Chong/ Fion Zhang
FIGURE 13. Cross sectional area measurement techniques: (a) main flux technique; (b) modified main flux technique; (c) return flux technique with hall sensors; (d) return flux technique with flux gate sensors.

Charlie Chong/ Fion Zhang
FIGURE 13. Cross sectional area measurement techniques: (a) main flux technique; (b) modified main flux technique; (c) return flux technique with hall sensors; (d) return flux technique with flux gate sensors.

Charlie Chong/ Fion Zhang
FIGURE 13. Cross sectional area measurement techniques: (a) main flux technique; (b) modified main flux technique; (c) return flux technique with hall sensors; (d) return flux technique with flux gate sensors.

Charlie Chong/ Fion Zhang
FIGURE 13. Cross sectional area measurement techniques: (a) main flux technique; (b) modified main flux technique; (c) return flux technique with hall sensors; (d) return flux technique with flux gate sensors.

Charlie Chong/ Fion Zhang
Main Flux TechniqueThe main flux technique uses an annular coil together with an electronic integrator circuit to determine the local magnetic flux inside the rope (Fig. 13a). Note that the coil must encircle the rope. Originally patented in the United Kingdom in the 1960s, this approach has been discussed in the literature. Because it measures the magnetic flux inside the rope locally, the annular coil approach offers uncommon resolving power, signal fidelity and therefore test accuracy. The performance of this arrangement is unsurpassed and sets a standard by which all other techniques are measured. Unfortunately, it is topologically impossible to implement a hinged annular coil with a large number of turns that can be opened and conveniently attached to the rope.

Charlie Chong/ Fion Zhang
Consequently, the practical implementation of this technique for inservicewire rope tests is seriously hampered by an inherent and insurmountable problem: an annular coil encircling the rope must be wound onto the rope in the field for each test. This cumbersome procedure allows only very few turns (say, 100) and hence only very small induced coil voltages. The coil voltages are of the same order of magnitude as the always present inherent offset voltages at the input of operational amplifiers used for the design of electronic integrator circuits. These inherent offset voltages make the long term, low drift integration of the coil voltages impossible. Hence, the annular coil approach is not feasible for inservice tests where loss of metallic cross sectional area measurements over longer time periods — say, over more than a few minutes — are required.

Charlie Chong/ Fion Zhang
To illustrate the annular coil approach, Fig. 14 shows the loss of metallic cross sectional area and localized discontinuity traces of a laboratory test rope. The loss of metallic cross sectional area and localized discontinuity signals were acquired with an annular coil. Short pieces of wire, attached to the rope, simulate anomalies. The attached wires have different lengths as indicated. They typically represent a one percent increase of metallic cross sectional area. (The loss of metallic cross sectional area caused by the internal wire is unknown.) The two ends of the rope are welded together to form an infinite loop. The weld is also indicated in the chart. Figure 14 shows the excellent results that could be obtained with annular coils. The increases of metallic cross sectional area caused by the attached wires are clearly indicated with their full magnitude for wires longer than about 50 mm (2 in.). The cross section changes caused by shorter wires are also indicated, albeit not to their full extent.

Charlie Chong/ Fion Zhang
FIGURE 14. Test results from main flux technique.

Charlie Chong/ Fion Zhang
The cross section changes caused by shorter wires are also indicated, albeit not to their full extent. To illustrate the annular coil approach, Fig. 14 shows the loss of metallic cross sectional area and localized discontinuity traces of a laboratory test rope. The loss of metallic cross sectional area and localized discontinuity signals were acquired with an annular coil. Short pieces of wire, attached to the rope, simulate anomalies. The attached wires have different lengths as indicated. They typically represent a one percent increase of metallic cross sectional area. (The loss of metallic cross sectional area caused by the internal wire is unknown.) The two ends of the rope are welded together to form an infinite loop. The weld is also indicated in the chart. Figure 14 shows the excellent results that could be obtained with annular coils. The increases of metallic cross sectional area caused by the attached wires are clearly indicated with their full magnitude for wires longer than about 50 mm (2 in.). The cross section changes caused by shorter wires are also indicated, albeit not to their full extent.

Charlie Chong/ Fion Zhang
Modified Main Flux TechniqueThe modified main flux technique (Fig. 13b) tries to retain the superior performance of the main flux technique while allowing the use of hinged sensor heads shaped like a clamshell. This design makes it easy to attach the sensor head to the rope, even under adverse field conditions. The test signals of this modified main flux technique are a combination of two signal components: the main flux signal (Fig. 14) and a signal component caused by the outside stray flux, that part of the magnetic flux that flows along some external stray flux path outside the sensor head (Fig. 13). Unfortunately, this outside signal component is significant. It compromises the quality of the test results and must be considered parasitic. Although this parasitic effect can be minimized, a true signal of the main flux type cannot be restored. Nevertheless, the modified main flux technique retains many features of the annular coil approach.

Charlie Chong/ Fion Zhang
Return Flux TechniqueThe return flux technique uses hall sensors (or more complex, flux gate sensors) to measure the magnetic flux in the magnetic return path of the instrument. Illustrated by Figs. 13c and 13d, the return flux is equal to the average value of the axial rope flux inside the sensor head plus the outside stray flux. Therefore, the return flux provides an estimate of the average cross sectional area of that section of the rope inside the sensor head. Flux sensors can either be inserted into the air gap between the permanent magnet poles and the rope or into the yoke of the magnetizer assembly. In contrast to the main flux approach, the return flux technique allows the sensor heads to be hinged like a clamshell. This shape makes it easy to attach the sensor head to the rope even in adverse field conditions.

Charlie Chong/ Fion Zhang
17.3.3 Signal Generation and EvaluationFor the interpretation of test results and for a correlation of test data with the actual rope condition, the rope inspector must understand the capabilities and limitations of the electromagnetic rope testing equipment. A proper appreciation of the signal generation process, together with an understanding of rope degradation mechanisms and discard criteria, is essential for making rational rope retirement decisions.
The functional block diagram of Fig. 15 illustrates the signal generation process. This figure shows the rope’s cross sectional area — including variations caused by broken wires, corrosion, abrasion and other effects — as the input to an electromagnetic wire rope test system. From this input, the sensor head produces one or several electrical signals. These signals are electronically processed to produce the localized discontinuity and cross sectional signals, which are then recorded by a chart recorder or stored by a data acquisition system.

Charlie Chong/ Fion Zhang
FIGURE 15. Functional block diagram of signal generationprocess.

Charlie Chong/ Fion Zhang
For the following discussion, step changes of metallic cross sectional area —caused by missing or added wires, for example — have particular significance.
Because of its simple geometry, a step change can be called a fundamental discontinuity. Accordingly, the corresponding loss of metallic cross sectional area and localized discontinuity signals, caused by a fundamental discontinuity, can be called a fundamental loss of metallic cross sectional area or localized discontinuity signals, respectively.
The fundamental signals can also be called an instrument’s step response. Any discontinuity can be represented as the sum of appropriately scaled and spaced fundamental discontinuities.

Charlie Chong/ Fion Zhang
Moreover, the process of signal generation is linear or almost linear. Hence linear superposition applies: if a discontinuity can be represented as the sum of several fundamental discontinuities, then the corresponding discontinuity signals are the sum of the corresponding fundamental loss of metallic crosssectional area and localized discontinuity signals.
The concepts of fundamental discontinuities and signals, step response and linear superposition are discussed in the literature. Determining and evaluating its step response is an excellent technique for characterizing the performance of an electromagnetic wire rope tester.

Charlie Chong/ Fion Zhang
FilteringThe concept of filtering can be understood very loosely. For example, the sensor head of an electromagnetic rope tester, together with the signal electronics, may be viewed as a linear or nonlinear data filter. Figure 16 depicts the rope cross section as the input signal and the idealized corresponding loss of metallic cross sectional area and localized discontinuity output signals. Note that, for many rope testers, the localized discontinuity signal approximates the first derivative of the rope cross section signal.For other instruments, the localized discontinuity signal is the second derivative of the rope cross section, shown as the alternative localized discontinuity signal in Fig. 16. Note that the signals generated with the main flux technique in Fig. 14 closely resemble the idealized results of Fig. 16.

Charlie Chong/ Fion Zhang
FIGURE 16. Input and output signals of idealized rope test instrument.

Charlie Chong/ Fion Zhang
Recognizing differentiation as the quintessential high pass filter operation, the localized discontinuity signal can be considered as the rope cross section input signal that has been high pass filtered. High pass filtering accentuates fast changes of signals and typically broken wires and corrosion pitting cause rapid variations of the rope cross section. Therefore, the high pass filtering feature makes the localized discontinuity signal useful for the detection of broken wires and corrosion pitting. Any test equipment should present data in a form that facilitates interpretation by the human operator. Figure 16 shows that a perfect loss of cross sectional area signal could serve as an accurate and conceptually simple map of a rope’s loss of metallic cross section — a map easy to interpret by the inspector.

Charlie Chong/ Fion Zhang
Unfortunately, actual loss of metallic cross sectional area signals are far from this ideal. Although most rope testers can produce localized discontinuity signals with wave shapes very similar to those of Fig. 16, producing a loss of metallic cross sectional area signal that comes close to the idealized signal in Fig. 16 poses considerable problems. To illustrate, some electromagnetic rope testers produce cross sectional step responses with considerable overshoot in both directions.
The overshoot makes loss of metallic cross sectional area measurements complex, ambiguous and operator dependent. Chart interpretation for these instruments becomes especially problematic under actual field conditions. Because this type of performance is not amenable to analysis, it will not be discussed further.

Charlie Chong/ Fion Zhang
Resolution and Averaging LengthResolution refers to the fineness of detail that can be distinguished in animage. For electromagnetic wire rope tests, resolution is always the foremost performance measure. In nondestructive testing, the terms resolution and test accuracy are often used synonymously. In the discipline of electromagnetic wire rope testing, quantitative resolution or averaging length (sometimes also called scanning length) is defined as the minimum length of a uniform anomaly for which the sensor provides an accurate measurement of a rope’s loss of metallic cross sectional area.
To visualize the concept of averaging length, assume that, instead of measuring metallic cross sectional area directly, the rope tester continuously measures the metallic volume of consecutive rope sections with lengths that are equal to its averaging length. Figure 17 illustrates this concept.

Charlie Chong/ Fion Zhang
FIGURE 17. Length of 10 percent loss of metallic cross sectional area versus averaging length of test system: (a) long loss, short averaging; (b) long loss, long averaging; (c) short loss, short averaging; (d) short loss, long averaging.
LegendA = averaging lengthL = length of loss of metallic cross sectional area

Charlie Chong/ Fion Zhang
Figure 17a shows a hypothetical rope with a uniform 10 percent loss of metallic cross sectional area extending over a length of 300 mm (12 in.). An instrument with a 50 mm (2 in.) averaging length will correctly measure this loss of metallic cross sectional area. As illustrated by Fig. 17b, a rope tester with an averaging length of 300 mm (12 in.) will also give a true indication of this anomaly. Now consider a hypothetical rope with a 10 percent uniform loss of metallic cross sectional area extending over a length of 50 mm (2 in.).
Figure 17c shows that an instrument with an averaging length of 50 mm (2 in.) can measure the loss of metallic cross sectional area caused by this anomaly. However, as can be seen from Fig. 17d, an instrument with an averaging length of 300 mm (12 in.) would indicate the same anomaly as a 1.7 percent loss of metallic cross sectional area extending over a length of 300 mm (12 in.) — a very inaccurate indication of the true rope condition.

Charlie Chong/ Fion Zhang
These examples show the importance of a short averaging length. Note that signal averaging is a quintessential type of low pass filtering and that signals lose a significant amount of information (details) by low pass filtering. Figure 18 illustrates this situation. It shows how the quality of loss of metallic cross sectional area signals deteriorates as the loss of metallic cross sectional area averaging length increases.
An analogy can illustrate the problems associated with long loss of metallic cross sectional area averaging lengths: a chain is only as strong as its weakest link. Obviously, the strength of a chain is not determined by the average strength of some of its links. Similarly, the strength of a rope, which has lost metallic cross section by corrosion or wear, is determined by the minimum local metallic cross sectional area along the rope’s length and not by some average value of the rope’s cross sectional area. Experience has shown that serious rope deterioration can occur over very short distances along the length of a rope.

Charlie Chong/ Fion Zhang
Hence, to determine and evaluate a rope’s actual metal loss with acceptable accuracy, a short averaging length — of no more than a few centimeters (an inch or two) — is important. Because all wire rope testers have a quantitativeresolution or averaging length that is greater than zero, an accurate measurement of loss of metallic cross sectional area always requires minimum lengths of anomalies.
As the above discussion shows and as illustrated by Fig. 18, the concept of quantitative resolution or averaging length is important for specifying and comparing the performance of rope testers.

Charlie Chong/ Fion Zhang
FIGURE 18. Loss of metallic cross sectional area signals as function of averaging length.

Charlie Chong/ Fion Zhang
17.3.4 Wire Rope Testing and RetirementTwo different philosophies have been used to retire wire rope.
1. A statutory life policy mandates rope retirement at certain prescribed intervals. (The statutory life policy specifies a maximum time a rope can be in service).
2. Retirement for cause is based on retirement conditions evaluated periodically by nondestructive testing. (The approach requires that the rope must be retired when the deterioration exceeds a certain limit.)
Because a statutory life policy is inherently wasteful, regulators have tended to adopt the retirement for cause approach wherever appropriate. Wire rope deteriorates gradually throughout its service life. To keep abreast of deterioration, wire rope must be periodically tested. Because moderate deterioration is normally present, the mere detection of rope deterioration does not usually justify rope retirement. There are two major nondestructive test methods for evaluation of rope degradation: visual testing and electromagnetic testing.

Charlie Chong/ Fion Zhang
Visual TestingThe rag-and-visual technique is a simple yet useful way to detect a wide variety of external rope deteriorations. Using this approach, the inspector lightly grasps the rope — which moves at test speed — with a rag or cotton waste. External broken wires often become frayed and, as the rope moves, the broken wires snag the rag or cotton waste. The rope is then stopped at that point and the inspector assesses the rope condition by a visual test. If broken wires do not fray, then a different test procedure must be used. The rope is moved 0.5 to 1 m (2 or 3 ft) at a time and visually tested at each stop.
This procedure is tedious and, because the rope is often covered with grease, many external and internal discontinuities elude detection. Another visual testing tool is measurement of the rope diameter. Rope diameter measurements compare the original diameter — when new and subjected to a known load — with the current reading under like circumstances. A change in rope diameter indicates external and internal rope damage. Inevitably, many sorts of damage do not cause a change of rope diameter.
Charlie Chong/ Fion Zhang
Several visible signs can indicate distributed and cross sectional area losses due to corrosion, abrasion and wear. For example, corrosion products, flattening of outer wires and loss or, sometimes, increase of rope diameter frequently reveal external and internal corrosion. However, the extent of corrosion is often difficult to gage and its significance is even more difficult to assess. Visual testing is inherently not well suited for the detection of internal rope deterioration. Therefore, it has limited value as a sole means of wire rope testing. However, visual testing is simple and does not require special instrumentation. When combined with the knowledge of an experienced rope examiner, visual testing can provide a valuable tool for evaluating many forms of rope degradation.

Charlie Chong/ Fion Zhang
Electromagnetic TestsElectromagnetic wire rope testing gives detailed insight into the condition of a rope. Its reliability has made electromagnetic techniques widely accepted for the testing of wire ropes in mining, for ski lifts and many other applications. As discussed, two distinct electromagnetic test techniques have evolved to detect and classify discontinuities as either loss of metallic cross sectional area or localized discontinuity.
1. The localized discontinuity test, like the rag- nd-visual method, is suited only for the detection of localized discontinuities, especially broken wires. Therefore, small hand held localized discontinuity instruments have been called electronic rags.
2. The loss of metallic cross sectional area test detects and measures changes of metallic cross section caused by wear and corrosion. More reliable than visual diameter checks, loss of metallic cross sectional area testing can replace diameter measurements made with a caliper.

Charlie Chong/ Fion Zhang
Therefore, loss of metallic cross sectional area instruments could be called electronic calipers. Electromagnetic and visual wire rope tests complement each other. Both are essential for safe rope operation and both methods should therefore be used for maximum safety.
The thrust of evolving regulations is clearly toward combined periodic electromagnetic and visual testing. A thorough test must consider all aspects of a rope’s condition, including:
(1) the findings of a visual test, (2) the results of an electromagnetic rope test, (3) the rope’s operating conditions and related damage mechanisms and (4) the history of the rope under test and that of its predecessors.
Charlie Chong/ Fion Zhang
Dependable test procedures, using combined visual and electromagnetic testing, can detect rope deterioration at its earliest stages. Wire rope users can use these techniques as an effective tool for preventive maintenance. There are several ways that these nondestructive tests can be used to prevent deterioration of wire ropes.
1. The early detection of corrosion allows immediate corrective action through improved lubrication.
2. Accelerating wear and inter-strand nicking can indicate a need to reline sheaves to stop further degradation.
3. Careful testing can monitor the development of local damage at the crossover points of the rope on a winch drum.

Charlie Chong/ Fion Zhang
This way, the operator can determine the optimum time for repositioning the rope on the drum. A program of periodic testing is especially effective. To establish baseline data for subsequent testing, such a program should commence with an initial test of the installed rope after a break-in period. Subsequent testing should then be performed at scheduled intervals. In particular, periodic electromagnetic testing allows the documentation of a rope’s deterioration over its entire service life. Figure 19 shows the schematic of a mine hoist including sections of mine hoist and balance ropes that are particularly susceptible to rope deterioration.

Charlie C
hong/ Fion Zhang
FIGURE 19. Sections of hoist ropes susceptible to broken wires (A and B) and corrosion (C, D and E).
LegendA. Acceleration section.B. Rope sheave tangent points constitute nodes forall rope oscillations. (Oscillatory energy isabsorbed and dissipated here.) Defective sheavescan cause corkscrew deformations.C. Ropes can become wet at shaft collar.D. Moist and warm air hits ropes in thesepositions.E. Water and debris can accumulate inside loopof balance ropes.

Charlie Chong/ Fion Zhang
17.3.5 Types of Rope Damage Broken Wires In running ropes, broken wires develop primarily in sections that move over sheaves, pulleys and winch drums. Typically, they are caused by bending over — sheave fatigue cycling. (See rope sections A, B and C in Fig. 19.) Usually, breaks develop in segments of the rope surface that come into direct contact with the sheave. Here, various contact phenomena compound the fluctuating bending stresses. Breaks in these areas are external and usually visible. However, internal breaks can also develop, depending on the loading and especially on the rope construction. Once broken wires appear, a good many more are likely to develop soon.

Charlie Chong/ Fion Zhang
Corrosion (Rust) Corrosion is a serious hazard to a wire rope. Corrosion pitting causes stress concentrations. Furthermore, corrosion pitting inhibits the free movement of wires and strands, producing additional stresses in wires. The increased wire stresses combined with the above mentioned stress concentrations can drastically accelerate the development of fatigue breaks. Wires can also corrode uniformly over their entire surface, which may reduce their cross sectional area and cause loose wires. Rust can cause shallow pitting on the working surfaces of a rope where the steady rubbing action of the sheave prevents deep cavities. This mechanism accelerates wear. Furthermore, deep corrosion pitting on the surfaces of internal wires can severely shorten service life. The severity of corrosion often varies along the length of a rope. Frequently, corrosion is localized yet dangerous. A corrosive environment often exists in certain zones along the length of a mine shaft. Corrosion often occurs in rope sections that stay in these corrosive zones over extended periods.

Charlie Chong/ Fion Zhang
Corrosive areas are usually located where large and abrupt changes of temperature or humidity occur. Examples are below points where water or moist air an enter the shaft, humid shaft pits, fog areas in ventilation shafts and locations with increased air velocities (Fig. 19). The extent of corrosion is often difficult to gage and — as shown by experience — usually underestimated. Rust and dirt frequently clog up the rope surface and hide loose wires.

Charlie Chong/ Fion Zhang
WearWear results in loss of cross sectional area of the wires. The problems related to external and internal wear require special attention. External wear usually occurs on the working surface of a rope. Severe external wear can indicate that internal wires are similarly worn. Sometimes, severe wear can cause outer wires, or clusters of outside wires, to break abruptly. Rubbing between wires of a strand can cause internal wear.

Charlie Chong/ Fion Zhang
Deformation and Mechanical DamageCorkscrew type deformations can be caused by sheave grooves that are too tight, through manufacturing errors or as a result of severe wear. Corkscrew deformations can cause rope damage by increased exposure to wear. Furthermore, they increase the pressure between adjacent strands, which will eventually cause broken wires. Kinks are permanent distortions caused by loops drawn too tightly. Loops, often precursors of kinks, are formed when a section of a rope under high torsion is allowed to become slack. Usually, ropes with kinks must be removed from service.
Charlie Chong/ Fion Zhang
A common deterioration mode is peening, also called plastic wear, produced by localized impact or very high bearing pressure. Peening can occur by the slap of the rope at crossover points as the rope slips from layer to layer while winding on multilayer drums at high speeds. Peening sometimes gives the appearance of heavy wear although there is little loss of cross section. Peening can cause a fin on the edge of a worn wire that provides a ready site for the initiation of fatigue cracks.
Mechanical damage can have many causes such as a solid object hitting the rope, improper handling during rope installation, overloading or shock loading. Usually, mechanical damage is clearly visible and easy to detect. However, some mechanisms of mechanical damage, such as wire plucking, can be more difficult to locate. Mechanically equivalent to guitar string plucking, wire plucking is caused by lateral scraping of the rope at crossing points on a winch drum. It can lead to localized damage in the form of one or several broken wires at set intervals along the rope.

Charlie Chong/ Fion Zhang
Martensitic Embrittlement Martensite is a brittle phase of steel formed when the steel is heated above a critical temperature and then rapidly quenched. It occurs in wire rope as a result of frictional surface heating and the ass cooling effect of the cold metal beneath. Martensitic embrittlement can develop at rope crossover points while winding on multilayer drums. Here the rope can be heated by contact with the adjacent turn and then rapidly quenched by the surrounding metal. Martensite cracks easily and such cracks can propagate from the surface through the entire wire.

Charlie Chong/ Fion Zhang
Combined Deterioration ModesIn practice, combined deterioration modes predominate. These include corrosion fatigue and corrosion assisted wear. Typically, one type of rope degradation can initiate and contribute to interactive deterioration mechanisms. Corrosion assisted wear is probably the most common deterioration mode in stranded mine hoist ropes. Although broken wires do occur, most mine hoist ropes are retired because of unacceptable loss of metallic cross sectional area rather than broken wires. Often, metal loss is caused by internal corrosion and abrasion that are invisible from the surface. As the various deterioration mechanisms progress, they will eventually cause broken wires or clusters of broken wires. Electromagnetic tests of mine hoist rope show typical wear and fatigue chart patterns caused by bending over a sheave combined with acceleration and deceleration of the conveyance (Fig. 19).

Charlie Chong/ Fion Zhang
Typically, rope sections directly above the conveyance or counterweight show no deterioration because they never move over sheaves. In contrast, broken wires usually develop in rope sections that move over sheaves during acceleration or deceleration of the conveyance. This typical pattern of rope damage can be explained as follows. When the conveyance starts at the bottom of the shaft, the rope conveyance arrangement develops rather slow longitudinal, lateral and torsional oscillations. When the conveyance reaches the top of the shaft, the initially low frequency oscillations become high frequency vibrations. The stopping and acceleration action of the conveyance at the shaft collar causes additional vibrations. The tangent point of the rope and the sheave constitutes a node for all rope oscillations. These oscillations induce considerable tension, bending and torsional stresses at the tangent point. The oscillatory energy in the rope is dissipated and absorbed at this node. This action induces fatigue and abrasion at the tangent point.

Charlie Chong/ Fion Zhang
Furthermore, as shown in Fig. 19, condensation water can form at the shaft collar. This, together with the fatigue damage, can cause fatigue corrosion and corrosion pitting in this section of the rope. The localized discontinuity trace confirms the indications of the loss of metallic cross sectional area trace. In particular, the localized discontinuity trace indicates considerable corrosion pitting. A common retirement criterion is that a rope must be retired when its loss of metallic cross sectional area exceeds 10 percent. For this reason, the condition of many mine hoist ropes is still considered acceptable although their charts indicate considerable degradation. The above discussion shows that the best and worst sections of a rope are usually next to each other (Fig. 19). This proximity allows an easy comparison of the most degraded rope section with the rope essentially in its new condition. Fortunately, this proximity occurs in many cases and greatly facilitates rope evaluation.

Charlie Chong/ Fion Zhang
17.3.6 Case Histories Winch RopesA locked coil rope was mounted on a mobile winch for about ten years after three months of earlier use on a friction winder installation (Fig. 20). The rope showed clear evidence of external corrosion, variable along the test length. Using retirement criteria appropriate for visual testing, this rope would have been rejected for further use. Because of its service history, the rope was not believed to contain any internal local discontinuities. After dismantling, the rope showed severe corrosion on the outer layer and also significant corrosion on the second layer.
The rope showed less corrosion in the third layer and appeared undamaged from the fourth layer inward because lubricants were still present. No local discontinuities were found. Figure 20 shows an electromagnetic chart of this rope. The maximum measured loss of metallic cross sectional area is 5.1 percent compared to the best section on the rope covered by the chart.

Charlie Chong/ Fion Zhang
FIGURE 20. Chart of locked coil rope.

Charlie Chong/ Fion Zhang
Note that the most convenient calibration technique for electromagnetic testing is to attach a calibration wire with known cross sectional area to the rope. In Fig. 20, a wire bundle that represents about a one percent increase in rope cross section is fastened to the rope and used for calibration. Figure 20 shows variable corrosion, corrosion pitting and possibly broken wires.
As discussed previously, the slap of the rope at the crossover points can cause peening, martensitic embrittlement and wire plucking with the associated rope damage as the rope crosses over from layer to layer on a drum. The deterioration pattern indicated to the left of the chart is typical for ropes that wind on a drum with the worst deterioration occurring at the crossover points as the rope slips from layer to layer while winding on a multilayer drum.

Charlie Chong/ Fion Zhang
Multistrand RopesMany ropes are of the torque balanced multistrand type comprising two or more layers of strands. Figure 21a shows a cutaway section of such a rope. Torque balance is achieved in multistrand ropes by laying outer and inner strands in opposite directions. This type of rope construction limits axial rotation of the freely suspended rope under load. However, although multistrand ropes offer flexibility and a wear resistant surface profile, they have a tendency to deteriorate internally.
When multistrand ropes bend over sheaves or on a drum, they are subject to the combined effect of radial loading, relative motion between wires and bending stresses. This causes fretting wear or fatigue and interwire nicking across the interface between layers. Therefore, multistrand ropes tend to develop internal broken wires. This breakup occurs primarily on the interface between the outer and second layer of strands, usually with no externally visible signs (see Fig. 21b).

Charlie Chong/ Fion Zhang
FIGURE 21. Multistrand rope: (a) construction; (b) cross section.

Charlie Chong/ Fion Zhang
The wires in the second layer of strands typically show interstrand nicking and breaks caused by a combination of fluctuating axial wire stresses, motions between wires and fluctuating radial loads. The broken wires usually show squared off and Z shaped ends typical for fatigue breaks. Many multistrand ropes are subject to corrosive environmental conditions.
For example, offshore ropes are either immersed in the sea or continually wetted by salt water spray. In addition, heavy use in a marine environment can displace and degrade the rope lubricant. The combined effects of fatigue, corrosion and lubricant degradation can cause rapid internal deterioration where there is no effective form of protection.
Charlie Chong/ Fion Zhang
Balance RopesFigure 22 shows an electromagnetic test chart recording of a mine balance rope (see Fig. 19). Note that frequently torque balanced ropes of the multistrand type are used as balance ropes because regular stranded ropes develop internal torques during operation. Because balance ropes are under very little tension, these torques can cause loops, which are often precursors of kinks. Ropes with kinks must be removed from service. The use of multistrand ropes avoids this problem.
Figure 22b shows the typical corrosion chart pattern caused by the accumulation of water and debris inside the loop (see Fig. 19) of a multistrandbalance rope. Water and debris tend to accumulate especially inside this loop while the conveyance is parked at the shaft collar for long periods. A cross sectional diagram of this rope is shown in Fig. 22b.

Charlie Chong/ Fion Zhang
FIGURE 22. Electromagnetic test of mine hoist balance rope: (a) cross section; (b) chart.

Charlie Chong/ Fion Zhang
FIGURE 22. Electromagnetic test of mine hoist balance rope: (a) cross section; (b) chart.

Charlie Chong/ Fion Zhang
Note that, as discussed above, the chart shows the best rope section —essentially with no rope deterioration — right next to the worst section. This feature greatly facilitates rope evaluation. The chart shows a loss of metallic cross sectional area of 19 percent, which clearly calls for rope retirement.
A subsequent destructive break test showed a loss of breaking strength of 48.3 percent for the worst rope section. On the other hand, the cross sectional area of the second layer of strands is about 47 percent of the total rope cross section. This suggests that the second layer of strands has completely lost all load bearing capability.

Charlie Chong/ Fion Zhang
Experimental Multi-strand RopesThis case study illustrates electromagnetic wire rope testing for the detection and quantitative characterization of internal broken wires and clusters of broken wires. The present experiment deals with the testing of a torque balanced multistrand rope with no corrosion and many broken wires. This rope had been used as a mine hoist rope on a trial basis and was known to contain numerous internal broken wires along its entire length. The task at hand was to determine the number of broken wires in 100 mm (4 in.) segments along the length the rope.
The difficulty of this quantitative discontinuity characterization problem was compounded by the fact that an undamaged rope section — usually the segment directly above the conveyance — was not available for comparison. Furthermore, at the time, the correlation of the typical deterioration modes of this and similar ropes with their electromagnetic test results was generally not well understood. A cross sectional diagram of this multistrand rope is shown in Fig. 21b.

Charlie Chong/ Fion Zhang
As indicated in the figure, it is known that broken wires in multistrand ropes usually develop at the interface between the first layer and the second layer of strands. In addition, from this and similar ropes’ service histories, it can be assumed that the rope under test has developed significant interstrand nicking together with numerous fatigue breaks of wires in the second layer of strands. The detailed detection and quantitative characterization of internal broken wires in ropes with many breaks and clusters of breaks pose problems, as in this case.
Difficulties are caused by the fact that, for electromagnetic wire rope testing, the indication of a broken wire is influenced by a number of parameters like broken wire cross sectional area and broken wire gap width. Difficulties are caused by the position of the broken wire within the cross section of the rope. For clusters of broken wires, an additional problem is caused by the fact that the relative position of broken wires with respect to each other along the length of the rope is not known.

Charlie Chong/ Fion Zhang
For example, the gaps of broken wires could be aligned or staggered. Broken wires with zero or tight gap widths do not produce detectable magnetic leakage flux. For these reasons, only an estimate of the number of broken wires is possible. Conventionally, the localized discontinuity trace is used for the detection of broken wires. However, the localized discontinuity signal is not quantitative and cannot be used for estimating the number of broken wires.
On the other hand, the loss of metallic cross sectional area trace of the test chart in Fig. 23 shows rapid, relatively small variations of cross section. These variations are significant and can be used to estimate the number of broken wires per unit of rope length. Note, however, that the averaging length or quantitative resolution of the instrumentation must be sufficient to allow this quantitative discontinuity characterization.

Charlie Chong/ Fion Zhang
FIGURE 23. Test traces and relative number of broken wires (N·N–1max).

Charlie Chong/ Fion Zhang
The estimated number of broken wires per 100 mm (4 in.) of rope length N derived from the loss of metallic cross sectional area trace, is shown at the top of Fig. 23. Here, Nmax denotes the maximum number of broken wires per 100 mm (4 in.) of rope length. Based on the operating history of this and similar ropes, a value of Nmax = 20 can be estimated. The rope was subsequently disassembled to determine the actual number of broken wires per unit of rope length.
Broken wire estimates together with the actual number of broken wires along the length of the rope are shown in Fig. 24. Considering the fact that the loss of metallic cross sectional area trace not only indicates broken wires but also interstrand nicking, internal wear and other disturbances of the rope structure, there is a good correlation between the actual and estimated number of internal broken wires up to a rope distance of about 4.5 m (15 ft). Beyond this distance, there is an offset, which may be due to a distance measurement error during disassembly of the rope.

Charlie Chong/ Fion Zhang
FIGURE 24. Broken wires at 100 mm (4 in.) intervals (smoothed data, three sample average).

Charlie Chong/ Fion Zhang
A subsequent destructive break test of the rope showed a 30.2 percent loss of breaking strength. Significantly, the second layer of strands of the rope (see Fig. 21) represents about 30 percent of the total rope cross sectional area. As with the balance rope test, this leads to the hypothesis that, for this rope, the second layer of strands has lost all load bearing capability.
The lack of sufficient information on the rope’s operating history — and that of its predecessors — made this rope evaluation particularly difficult. Under normal circumstances, these details are known and must be considered when assessing the rope condition. Altogether, this evaluation shows that a quantitative discontinuity characterization for ropes with internal broken wires and clusters of broken wires is possible. The example illustrates the capabilities and limitations of electromagnetic wire rope test techniques for this particular discontinuity characterization problem.

Charlie Chong/ Fion Zhang
Mooring Rope TestThis example deals with the testing of a mooring rope (Fig.12) having an independent wire rope core and having a diameter of 89 mm (3.5 in.). Figure 25 shows a cross sectional diagram of such a rope. For independent wire rope core ropes, the outer wires of the outer strands have a larger diameter than the outer core strand wires.
To minimize interstrand nicking between the outer strands and the independent wire rope core, these ropes are designed such that the wires of the outer strands and the independent wire rope core are almost parallel. (This construction is usually achieved by choosing a lang lay for the independent wire rope core and an ordinary lay for the outer strands. In a lang lay, the strands of a rope are wound in the same direction as their constituent wires; in an ordinary lay, the strands are wound in the opposite direction from their constituent wires.)

Charlie Chong/ Fion Zhang
FIGURE 25. Typical six-strand rope with independent wire rope core.

Charlie Chong/ Fion Zhang
Typically, the wires of the outer strands are well supported by their neighbors whereas the outer wires of the independent wire rope core are relatively unsupported. The result of these geometrical features is that, in response to tensile loads, the outer strands bear against the core and, in the localized contact areas, force the outer independent wire rope core wires into the valleys between the outer strand wires.
Then, under continuing fluctuating tensile loads, this mechanism results in secondary bending stresses in the core wires, leading to large numbers of fatigue breaks. These breaks can be very close together and can form groups of breaks.

Charlie Chong/ Fion Zhang
Test results (not shown) for this mooring rope have indicated a severe breakup of the independent wire rope core; the breakup is strong evidence of heavy fluctuating tensile fatigue loading. The loss of metallic cross sectional area and localized discontinuity traces show the typical patterns of broken and missing wires (compare Fig. 16).
The missing wire patterns even indicate that short pieces of broken independent wire rope core wires might have fallen out of the rope. In addition, together with the findings of a visual test, electromagnetic testing indicates severe corrosion, including corrosion pitting. Corrosion products are clearly visible in Fig. 12.

Charlie Chong/ Fion Zhang
17.4 PART 4. Near Field Microwave Testing of Cement Based Materials and Structures
17.4.1 IntroductionNear field microwave testing has shown great potential for evaluating electrically non-conducting (that is, insulating, dielectric) materials. These techniques have been used to detect and evaluate the presence of voids and porosity, both local and distributed, in dielectric media and mixtures.
They have also been used to measure accurately the thickness of various dielectric composites and ceramics and to evaluate disbonds and delaminations in thick sandwich composite structures. Microwave techniques can also evaluate properties of materials composed of a mixture of several constituents involving both physical mixing (where there is no chemical interaction between constituents) and chemical reactions such as curing.

Charlie Chong/ Fion Zhang
Researchers have evaluated the potential of near field microwave test techniques, using open ended rectangular waveguide and monopole probes, for the purpose of testing and determining various properties of cement based materials and structures. Originally, a simple microwave nondestructive testing technique was used to detect the location of a reinforcing steel bar in a concrete slab. In this preliminary investigation, the presence of a separation in the steel bar was also detected, in addition to demonstrating the sensitivity of microwave signals to aggregate size distribution.
Further investigations showed a strong correlation between the magnitude of reflection coefficient and the hardened paste’s water-to-cement ratio, on one hand, to that paste’s compressive strength on the other hand.. The potential of using monopole antennas for the same purpose has also been demonstrated.

Charlie Chong/ Fion Zhang
The objectives of several investigations were to measure, evaluate, analyze and correlate the near field microwave reflection properties of cement based materials to their sand-to-cement ratio, their coarse aggregate–to-cement ratio, their coarse aggregate size distribution and their compressive strength. Another objective was to detect and evaluate chloride ingress in these materials before and after mixing. The following is the summary of the findings.

Charlie Chong/ Fion Zhang
17.4.2 Constituents of CementCement paste — composed of cement powder, water and air — is the primary (matrix) phase of cement based materials such as concrete. The study of the interaction of microwave signals with cement paste is essential in understanding such aggregates. To this end, extensive study of the characteristics of the reflection coefficient of microwave signals from hardened cement paste blocks, when using an open ended rectangular waveguide probe, showed that the magnitude of reflection coefficient is directly related to the evaporation of free water from cement paste samples during the early days and to the curing process (that is, the water-to-cement ratio) in later days.
The latter correlation was also established with the compressive strength of these samples. A similar investigation was conducted using monopole antenna probes. Similar results were obtained showing strong correlation between the magnitude of reflection coefficient, measured with this probe, and the water-to-cement ratio of hardened cement paste samples.

Charlie Chong/ Fion Zhang
Mortar — composed of cement powder, water, fine aggregate (sand) and porosity (air) — was subsequently investigated, using open ended rectangular waveguides. Mortar is less homogenous than cement paste and its degree of homogeneity is a function of its compressive strength and the operating microwave frequency (that is, more homogenous at lowerfrequencies and less homogenous at higher frequencies). Subsequently, a simple relationship was established between the standard deviation of the magnitude of reflection coefficient at 10 GHz and the compressive strength of hardened mortar block samples.
It was also shown that the average value of this parameter, when measured at lower microwave frequencies such as 3 GHz, is proportional to the water-to-cement ratio of mortar.47 Finally, it was shown that simple dielectric mixing models can be used to estimate porosity of these mortar block samples.

Charlie Chong/ Fion Zhang
Concrete is the most widely used of cement based materials and is composed of cement powder, water, sand (fine aggregate), coarse aggregate (that is, rocks) and air. Therefore, concrete may be considered an heterogenous material at microwave frequencies. Consequently, when studying the reflection properties of concrete, it is necessary to consider the results from a statistical point of view. There are several important parameters of interest when using concrete: cure state (water-to-cement ratio), the directly related parameter of compressive strength, coarse aggregate size distribution and others.
Extensive measurements using open ended rectangular waveguide probes and the magnitude of reflection coefficient show the potential for cure state monitoring of concrete with different constituent make-ups.
Charlie Chong/ Fion Zhang
It has also been shown that the water-to-cement ratio of hardened concrete can be determined for varying compressive strength and coarse aggregate size distributions. The statistical properties (average and standard deviation) of the measured magnitude of reflection coefficient at relatively high frequencies (for example, 10 GHz) is shown to provide information about water-to-cement ratio and coarse aggregate size distribution. In addition, these statistics are correlated to the compressive strength of concrete through a maximum likelihood algorithm.
The extent of aggregate segregation in concrete placement is also evaluated using the statistics of the measured magnitude of reflection coefficient at relatively high microwave frequencies — for example, 10 GHz.

Charlie Chong/ Fion Zhang
17.4.3 ApplicationsIntrusion of chloride ions in concrete is responsible for corrosion of reinforcing steel bars. The presence of chloride ions and oxygen can initiate the process of corrosion. Subsequently, corrosion byproducts occupy a greater volume than concrete and result in the deterioration of the reinforced concrete structure. To this end, a preliminary study was conducted in which salt (that is, sodium chloride) was added to the mixing water of several mortar blocks. The reflection properties of these hardened mortar blocks were shown to be substantially different than those without sodium chloride added to their mixing water.
Moreover, the results indicated a faster setting time for these samples compared to those without sodium chloride. Finally, a correlation between the magnitude of reflection coefficient and the compressive strength of these samples was obtained as a function of sodium chloride content and water-to-cement ratio.

Charlie Chong/ Fion Zhang
In another comprehensive study, many mortar samples were cyclically soaked in water and salt water (with varying salinity), while some of these samples were also loaded to promote microcracking and hence increased moisture permeation during the soaking cycles. The results showed that the properties of the reflection coefficient (magnitude and phase) at different frequencies can be used to distinguish between water soaked and salt water soaked samples.
Additionally, a semi-empirical electromagnetic model has been developed to simulate the reflection coefficient results and hence render the water content distribution in these samples as a function of days in a drying cycle and for several soaking cycles.

Charlie Chong/ Fion Zhang
Evaluation of water-to-cement ratio of early age cement based materials is an important practical issue. Monopole antenna probes are well suited for evaluating this parameter. Such a probe has been designed and optimized to give direct information about the early age water-to-cement ratio of many cement paste and concrete samples. Subsequently, a microwave measurement system (laboratory designed and assembled) incorporating this probe was used and successfully tested for this purpose.
Detection of grout in masonry bricks and blocks is also an important quality control issue in the construction industry. Using a simple reflectometer and an open ended rectangular waveguide probe at 3 GHz, empty cavities can be distinguished from grout filled cavities in masonry blocks.

Charlie Chong/ Fion Zhang
Fiber reinforced polymer composite laminates are used for strengthening concrete structural members. These laminates are epoxy adhered to a structure. When the laminate becomes disbonded from the structure, no effective strengthening is provided. Thus, it is important to develop a nondestructive, quick, robust and portable technique to detect such disbondsand evaluate their spatial extent and their degree of severity. Using open ended rectangular waveguide probes, it has been demonstrated that near field microwave testing can provide the desired results.

Charlie Chong/ Fion Zhang
Concrete Structures

Charlie Chong/ Fion Zhang
Concrete Structures

Charlie Chong/ Fion Zhang
Concrete Structures

Charlie Chong/ Fion Zhang
Concrete Structures

Charlie Chong/ Fion Zhang
Concrete Structures

Charlie Chong/ Fion Zhang
Concrete Structures

Charlie Chong/ Fion Zhang
Concrete Structures

Charlie Chong/ Fion Zhang
Concrete Structures

Charlie Chong/ Fion Zhang
Concrete Structures

Charlie Chong/ Fion Zhang
Concrete Structures

Charlie Chong/ Fion Zhang
Concrete Structures

Charlie Chong/ Fion Zhang
Concrete Structures

Charlie C
hong/ Fion Zhang
Concrete Structures

Charlie Chong/ Fion Zhang
I Love Mangoes

Charlie Chong/ Fion Zhang
Reading Joyshttp://www.filefactory.com/folder/75d751cbe768d192https://www.mediafire.com/folder/9elg8fo4zu28n/ET_Level_III
http://issuu.com/charlieccchonghttps://www.yumpu.com/user/charliechonghttp://www.slideshare.net/charliechong/presentationshttps://independent.academia.edu/CharlieChong1http://www.authorstream.com/charliechong/

Charlie Chong/ Fion Zhang
Good Luck!

Charlie Chong/ Fion Zhang