Electrolytic Capacitor Age Estimation Using PRBS based ...
8
Electrolytic Capacitor Age Estimation Using PRBS-based Techniques David A. Hewitt*, James E. Green, Jonathan N. Davidson, Martin P. Foster, David A. Stone Department of Electronic and Electrical Engineering, University of Sheffield, Mappin Street, Sheffield, S1 3JD, United Kingdom *Corresponding author. Email: [email protected] Abstract Electrolytic capacitors form a major part of most power electronic converters. System failures which can be directly attributed to electrolytic capacitors account for a particularly large proportion. In normal service, rather than failing instantly, capacitors tend to deteriorate through reduced capacitance and increased equivalent series resistance. Early detection of these changes permits mitigating action to be taken prior to failure. In this paper, a method of characterising these parameters using a pseudorandom binary sequence (PRBS) system identification approach is proposed as part of the development of a prognostic system for passive components in power electronic systems. 1. Ageing and failure of capacitors Capacitors are an important component in most power converters and drives and therefore their reliability has a considerable influence on the overall system reliability. The failure of electrolytic capacitors accounts for a greater proportion of total failures than any other component in a power converter [1]. An accurate and easy-to-implement method of determining the state of health of a capacitor is of value as it allows the dynamic loading on a failing capacitor to be reduced, extending its remaining lifetime. Alternatively, preventative maintenance can be performed prior to failure, for example, through replacing aged capacitors. The system we propose requires a method of characterising the real-time capacitance and equivalent series resistance (ESR) of a capacitor, allowing its state of health to be determined. In this paper, we propose a pseudorandom binary sequence (PRBS) based system which can be used to identify the critical ageing parameters of an electrolytic capacitor which could be used to estimate their state of health. An electrolytic capacitor has two failure states: open- or short-circuit. Before reaching one of these states, its performance will deteriorate. This deterioration is manifested as a reduction in capacitance and an increase in ESR. The mechanisms which drive both of these changes are the loss of electrolyte through evaporation [2] and chemical changes within the electrolyte [3]. A standard approach is to assume that that a capacitor should be considered ‘failed’ for practical purposes if the capacitance has fallen by 15 - 20 % from its value when new, or when its ESR has increased by 200 – 300% [3]. To develop an understanding of the ageing process and the trends involved, sample capacitors were placed into an environment chamber and aged at 115 °C. During this time the ESR and capacitance were calculated from an impedance measurement at 1 kHz. The results of this work can be observed in Fig. 1 where the measured data has been extrapolated to determine the likely progression of the capacitor parameters. The results are normalised to the values measured when new and the failure criteria for the capacitance and ESR value are shown. PCIM Europe 2016, 10 – 12 May 2016, Nuremberg, Germany ISBN 978-3-8007-4186-1 © VDE VERLAG GMBH · Berlin · Offenbach 1095
Transcript of Electrolytic Capacitor Age Estimation Using PRBS based ...
Electrolytic Capacitor Age Estimation Using PRBS-based Techniques
David A. Hewitt*, James E. Green, Jonathan N. Davidson, Martin P. Foster, David A. Stone Department of Electronic and Electrical Engineering, University of Sheffield, Mappin Street, Sheffield, S1 3JD, United Kingdom *Corresponding author. Email: [email protected]
Abstract
Electrolytic capacitors form a major part of most power electronic converters. System failures which can be directly attributed to electrolytic capacitors account for a particularly large proportion. In normal service, rather than failing instantly, capacitors tend to deteriorate through reduced capacitance and increased equivalent series resistance. Early detection of these changes permits mitigating action to be taken prior to failure. In this paper, a method of characterising these parameters using a pseudorandom binary sequence (PRBS) system identification approach is proposed as part of the development of a prognostic system for passive components in power electronic systems.
1. Ageing and failure of capacitors
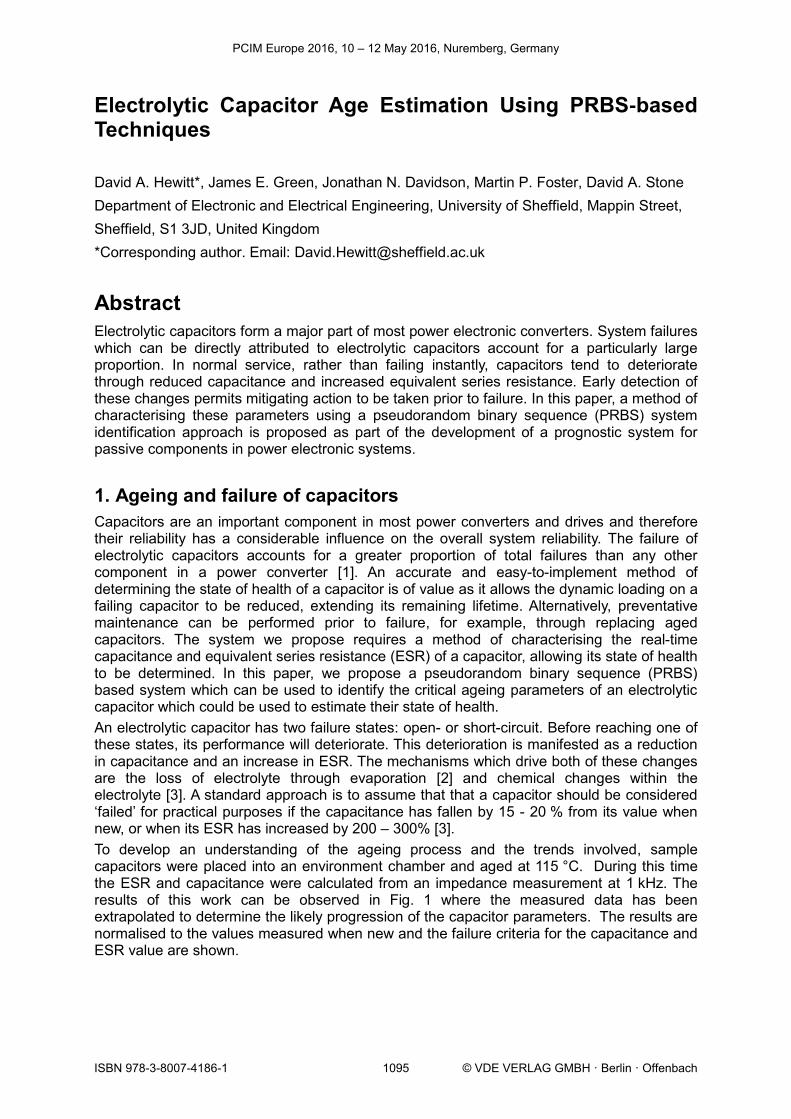
Capacitors are an important component in most power converters and drives and therefore their reliability has a considerable influence on the overall system reliability. The failure of electrolytic capacitors accounts for a greater proportion of total failures than any other component in a power converter [1]. An accurate and easy-to-implement method of determining the state of health of a capacitor is of value as it allows the dynamic loading on a failing capacitor to be reduced, extending its remaining lifetime. Alternatively, preventative maintenance can be performed prior to failure, for example, through replacing aged capacitors. The system we propose requires a method of characterising the real-time capacitance and equivalent series resistance (ESR) of a capacitor, allowing its state of health to be determined. In this paper, we propose a pseudorandom binary sequence (PRBS) based system which can be used to identify the critical ageing parameters of an electrolytic capacitor which could be used to estimate their state of health. An electrolytic capacitor has two failure states: open- or short-circuit. Before reaching one of these states, its performance will deteriorate. This deterioration is manifested as a reduction in capacitance and an increase in ESR. The mechanisms which drive both of these changes are the loss of electrolyte through evaporation [2] and chemical changes within the electrolyte [3]. A standard approach is to assume that that a capacitor should be considered ‘failed’ for practical purposes if the capacitance has fallen by 15 - 20 % from its value when new, or when its ESR has increased by 200 – 300% [3]. To develop an understanding of the ageing process and the trends involved, sample capacitors were placed into an environment chamber and aged at 115 °C. During this time the ESR and capacitance were calculated from an impedance measurement at 1 kHz. The results of this work can be observed in Fig. 1 where the measured data has been extrapolated to determine the likely progression of the capacitor parameters. The results are normalised to the values measured when new and the failure criteria for the capacitance and ESR value are shown.
PCIM Europe 2016, 10 – 12 May 2016, Nuremberg, Germany
ISBN 978-3-8007-4186-1 © VDE VERLAG GMBH · Berlin · Offenbach1095
(a)
(b)
Fig. 1 – Experimental ageing values for capacitor measured at 115 °C and 1 kHz. (a) ESR values; (b) capacitance values
The rate of ageing for a capacitor is proportional to the operating temperature [2] and the heat generation within an electrolytic capacitor is related to the power losses within it. The power loss can be calculated using (1) [4], where P is the power dissipated within the capacitor; IR is the RMS ripple current and ESR is the equivalent series resistance of the capacitor at the ripple frequency.
𝑃 = 𝐼𝑅2𝐸𝑆𝑅 (1)
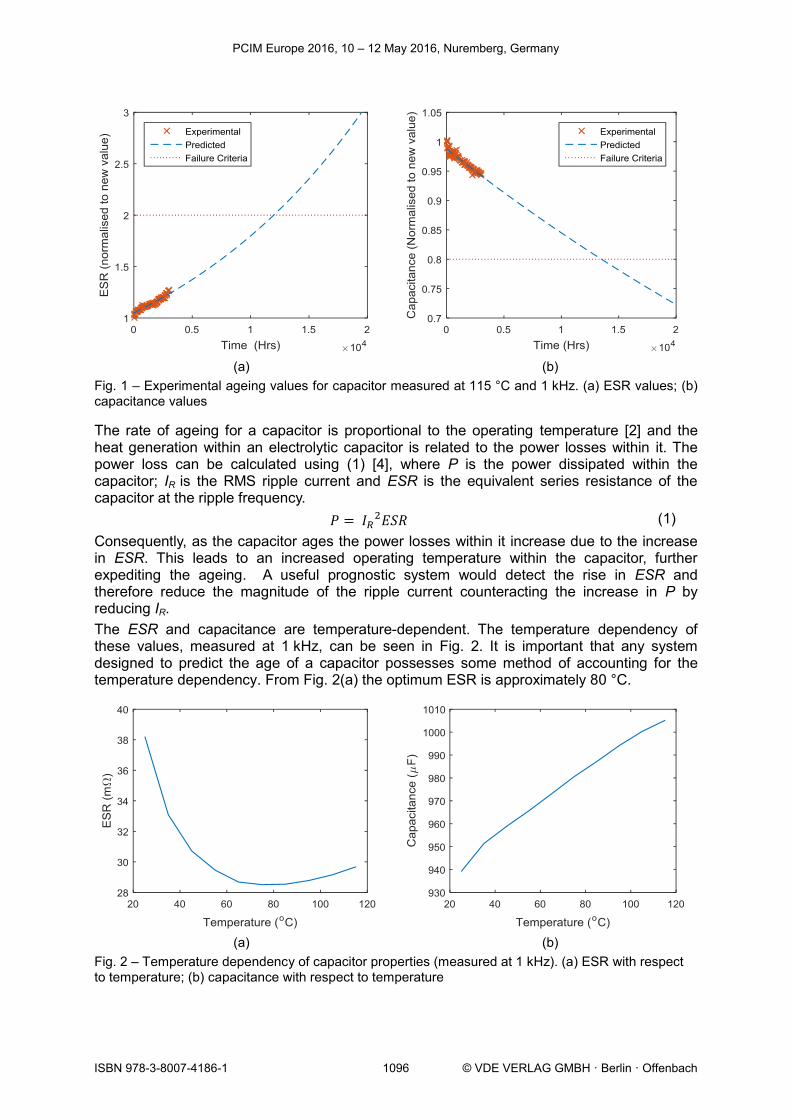
Consequently, as the capacitor ages the power losses within it increase due to the increase in ESR. This leads to an increased operating temperature within the capacitor, further expediting the ageing. A useful prognostic system would detect the rise in ESR and therefore reduce the magnitude of the ripple current counteracting the increase in P by reducing IR. The ESR and capacitance are temperature-dependent. The temperature dependency of these values, measured at 1 kHz, can be seen in Fig. 2. It is important that any system designed to predict the age of a capacitor possesses some method of accounting for the temperature dependency. From Fig. 2(a) the optimum ESR is approximately 80 °C.
(a)
(b)
Fig. 2 – Temperature dependency of capacitor properties (measured at 1 kHz). (a) ESR with respect to temperature; (b) capacitance with respect to temperature
PCIM Europe 2016, 10 – 12 May 2016, Nuremberg, Germany
ISBN 978-3-8007-4186-1 © VDE VERLAG GMBH · Berlin · Offenbach1096
2. Pseudorandom binary sequences (PRBS)
2.1. PRBS-based parameter estimation
PRBS signals can be used to excite a system with band-limited white noise. By measuring the system response, its impedance spectrum can be calculated. Similar approaches have been used for a variety of different applications including the thermal characterisation of systems [5]; parameter estimation in electrical generators [6] and the modelling of batteries [7]. Using this technique it is possible to determine the impedance of a system over a pre-selected range of frequencies using a single test sequence. An advantage of using PRBS techniques is that they are amenable to ‘on-line’ measurements, aiding the implementation of this prognostics into a functional drive system.
2.2. PRBS generation
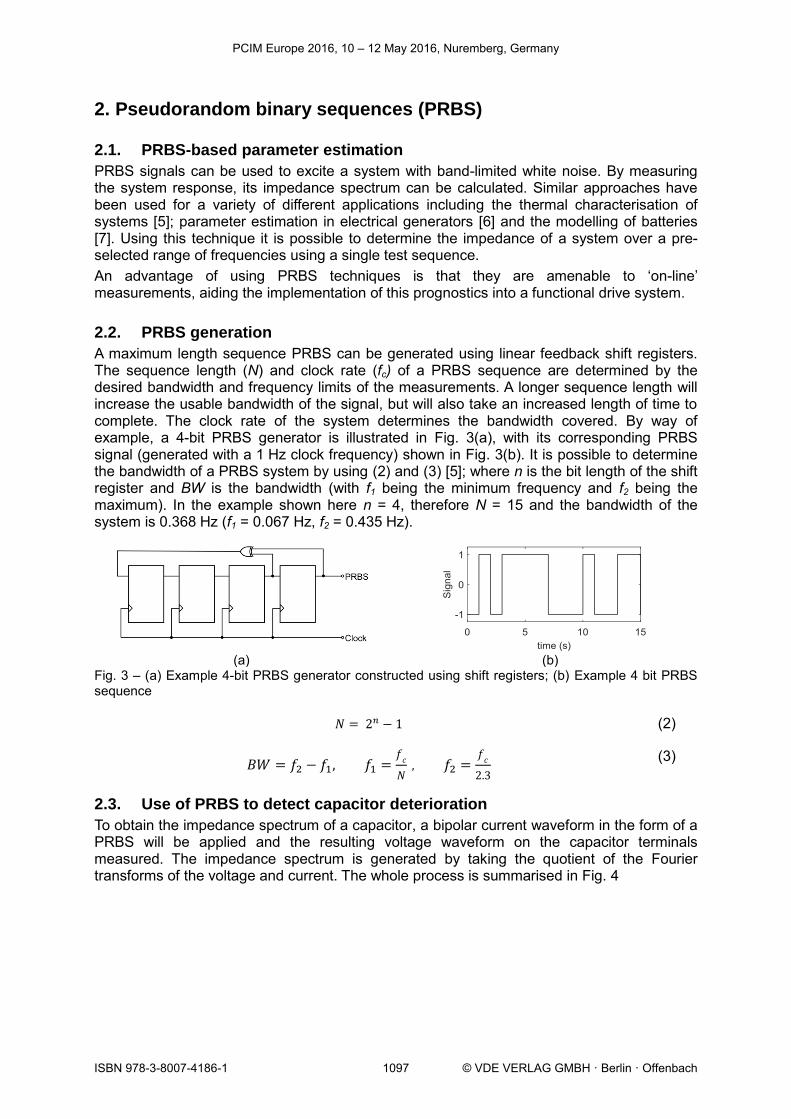
A maximum length sequence PRBS can be generated using linear feedback shift registers. The sequence length (N) and clock rate (fc) of a PRBS sequence are determined by the desired bandwidth and frequency limits of the measurements. A longer sequence length will increase the usable bandwidth of the signal, but will also take an increased length of time to complete. The clock rate of the system determines the bandwidth covered. By way of example, a 4-bit PRBS generator is illustrated in Fig. 3(a), with its corresponding PRBS signal (generated with a 1 Hz clock frequency) shown in Fig. 3(b). It is possible to determine the bandwidth of a PRBS system by using (2) and (3) [5]; where n is the bit length of the shift register and BW is the bandwidth (with f1 being the minimum frequency and f2 being the maximum). In the example shown here n = 4, therefore N = 15 and the bandwidth of the system is 0.368 Hz (f1 = 0.067 Hz, f2 = 0.435 Hz).
(a)
(b)
Fig. 3 – (a) Example 4-bit PRBS generator constructed using shift registers; (b) Example 4 bit PRBS sequence
𝑁 = 2𝑛 − 1 (2)
𝐵𝑊 = 𝑓2 − 𝑓1, 𝑓1 =𝑓
𝑐
𝑁 , 𝑓2 =
𝑓𝑐
2.3 (3)
2.3. Use of PRBS to detect capacitor deterioration
To obtain the impedance spectrum of a capacitor, a bipolar current waveform in the form of a PRBS will be applied and the resulting voltage waveform on the capacitor terminals measured. The impedance spectrum is generated by taking the quotient of the Fourier transforms of the voltage and current. The whole process is summarised in Fig. 4
PCIM Europe 2016, 10 – 12 May 2016, Nuremberg, Germany
ISBN 978-3-8007-4186-1 © VDE VERLAG GMBH · Berlin · Offenbach1097
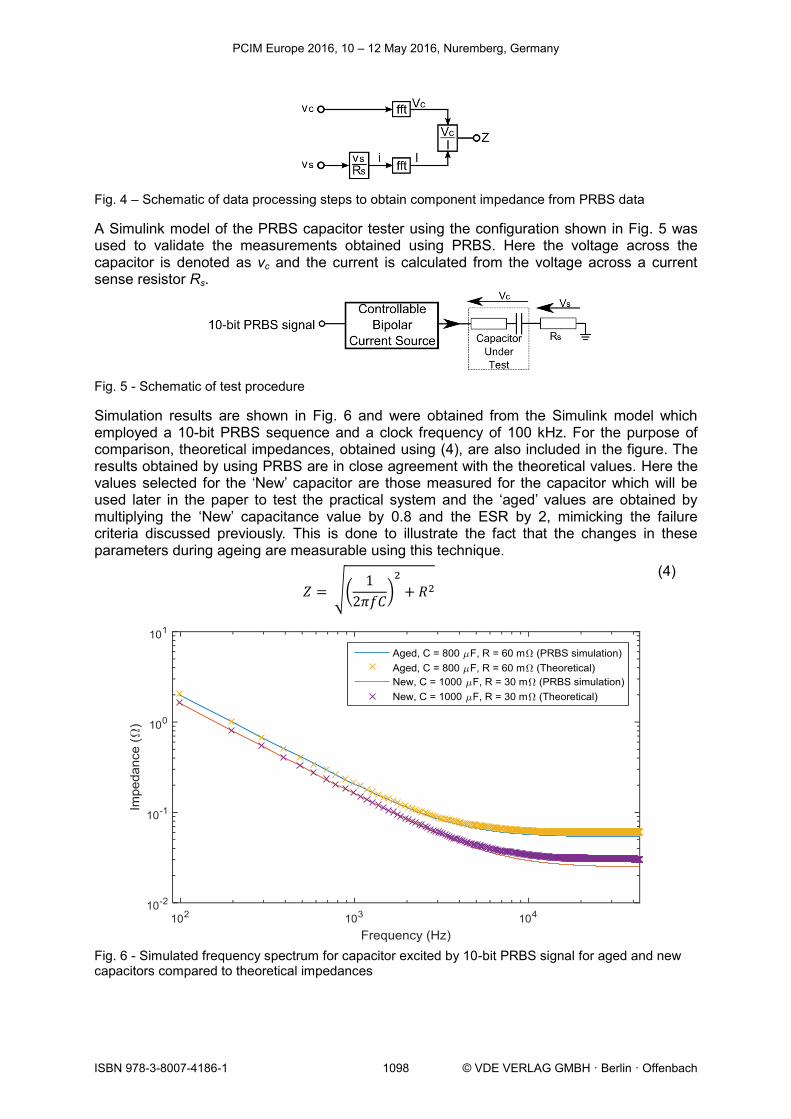
Fig. 4 – Schematic of data processing steps to obtain component impedance from PRBS data
A Simulink model of the PRBS capacitor tester using the configuration shown in Fig. 5 was used to validate the measurements obtained using PRBS. Here the voltage across the capacitor is denoted as vc and the current is calculated from the voltage across a current sense resistor Rs.
Fig. 5 - Schematic of test procedure
Simulation results are shown in Fig. 6 and were obtained from the Simulink model which employed a 10-bit PRBS sequence and a clock frequency of 100 kHz. For the purpose of comparison, theoretical impedances, obtained using (4), are also included in the figure. The results obtained by using PRBS are in close agreement with the theoretical values. Here the values selected for the ‘New’ capacitor are those measured for the capacitor which will be used later in the paper to test the practical system and the ‘aged’ values are obtained by multiplying the ‘New’ capacitance value by 0.8 and the ESR by 2, mimicking the failure criteria discussed previously. This is done to illustrate the fact that the changes in these parameters during ageing are measurable using this technique.
𝑍 = √(1
2𝜋𝑓𝐶)
2
+ 𝑅2 (4)
Fig. 6 - Simulated frequency spectrum for capacitor excited by 10-bit PRBS signal for aged and new capacitors compared to theoretical impedances
PCIM Europe 2016, 10 – 12 May 2016, Nuremberg, Germany
ISBN 978-3-8007-4186-1 © VDE VERLAG GMBH · Berlin · Offenbach1098
Clearly the new and aged capacitors have a significant difference in impedance and so the impedance could be used to identify the failure of a capacitor. The complex impedance is obtained using this technique and therefore it is possible extract the resistive and reactive values and determine the ESR and capacitance values. This this technique will be demonstrated later in this paper, when the experimental results are considered. 3. Practical implementation of system In the development of a practical system in order for a PRBS system to be effective there are three factors which must be considered. These are:
the PRBS clock frequency; the PRBS bit length; the magnitude of the driving current.
These parameters are interconnected and depend on the frequency range of interest. As f2 is determined solely by the clock frequency, the clock frequency should be selected so as to satisfy the upper bandwidth requirements of the system. Once this upper frequency has been set, the number of bits within the PRBS sequence can be selected to determine lower bandwidth frequency of the system. Excitation current level within a practical system is determined by a trade-off between two parameters:
The maximum voltage the current source can provide The minimum voltage the analogue-to-digital converter (ADC) can resolve.
It should also be noted that the capacitor voltage will vary proportionally to the magnitude of the current used, meaning that the signal to noise ratio of the measurements will be smaller for a smaller excitation current.
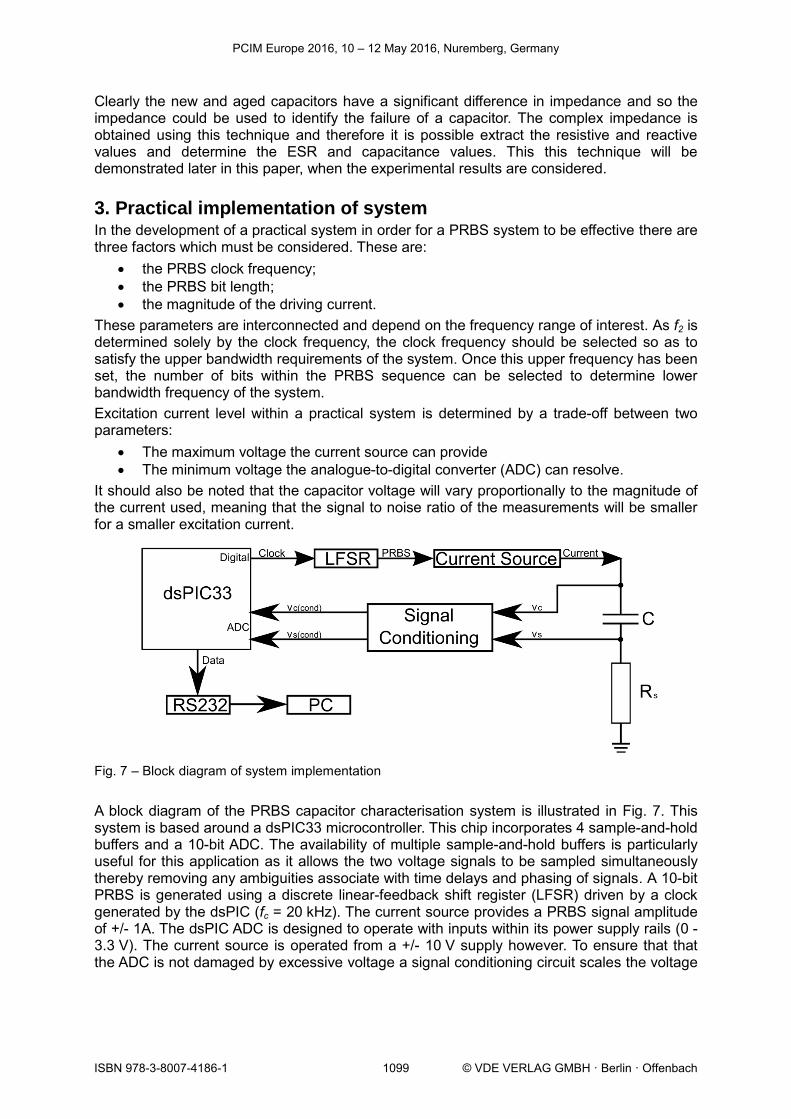
Fig. 7 – Block diagram of system implementation A block diagram of the PRBS capacitor characterisation system is illustrated in Fig. 7. This system is based around a dsPIC33 microcontroller. This chip incorporates 4 sample-and-hold buffers and a 10-bit ADC. The availability of multiple sample-and-hold buffers is particularly useful for this application as it allows the two voltage signals to be sampled simultaneously thereby removing any ambiguities associate with time delays and phasing of signals. A 10-bit PRBS is generated using a discrete linear-feedback shift register (LFSR) driven by a clock generated by the dsPIC (fc = 20 kHz). The current source provides a PRBS signal amplitude of +/- 1A. The dsPIC ADC is designed to operate with inputs within its power supply rails (0 - 3.3 V). The current source is operated from a +/- 10 V supply however. To ensure that that the ADC is not damaged by excessive voltage a signal conditioning circuit scales the voltage
PCIM Europe 2016, 10 – 12 May 2016, Nuremberg, Germany
ISBN 978-3-8007-4186-1 © VDE VERLAG GMBH · Berlin · Offenbach1099
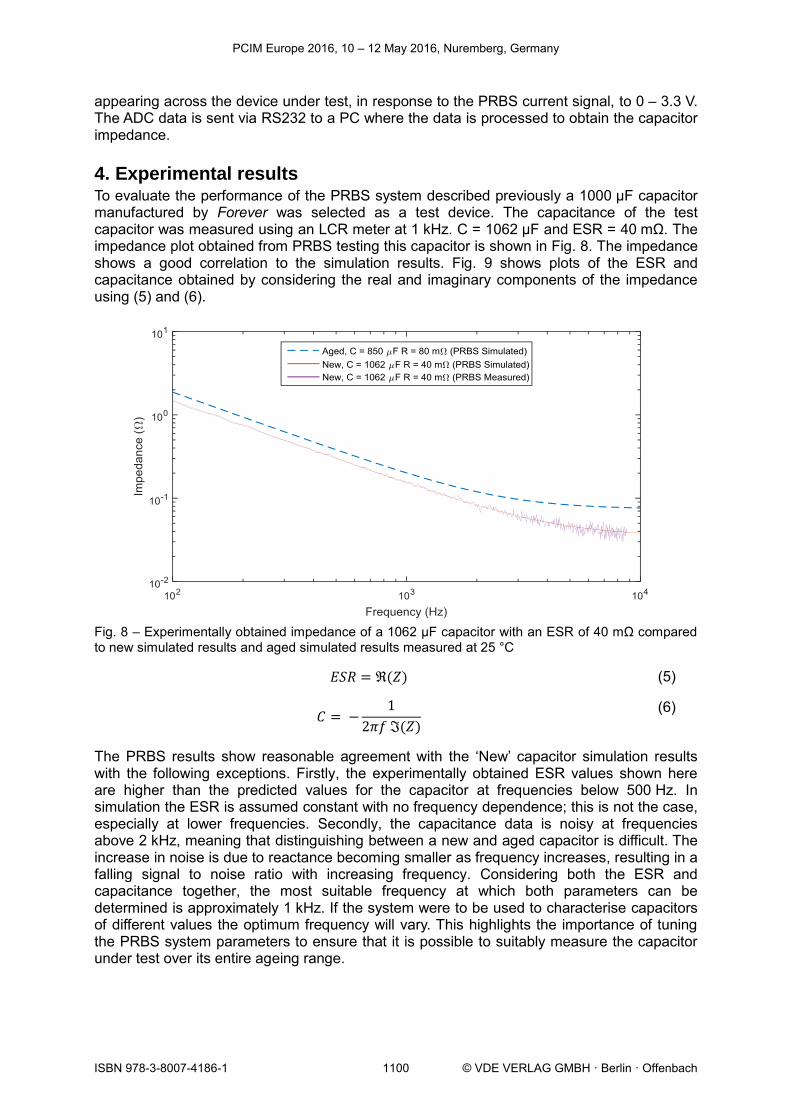
appearing across the device under test, in response to the PRBS current signal, to 0 – 3.3 V. The ADC data is sent via RS232 to a PC where the data is processed to obtain the capacitor impedance. 4. Experimental results To evaluate the performance of the PRBS system described previously a 1000 μF capacitor manufactured by Forever was selected as a test device. The capacitance of the test capacitor was measured using an LCR meter at 1 kHz. C = 1062 μF and ESR = 40 mΩ. The impedance plot obtained from PRBS testing this capacitor is shown in Fig. 8. The impedance shows a good correlation to the simulation results. Fig. 9 shows plots of the ESR and capacitance obtained by considering the real and imaginary components of the impedance using (5) and (6).
Fig. 8 – Experimentally obtained impedance of a 1062 μF capacitor with an ESR of 40 mΩ compared to new simulated results and aged simulated results measured at 25 °C
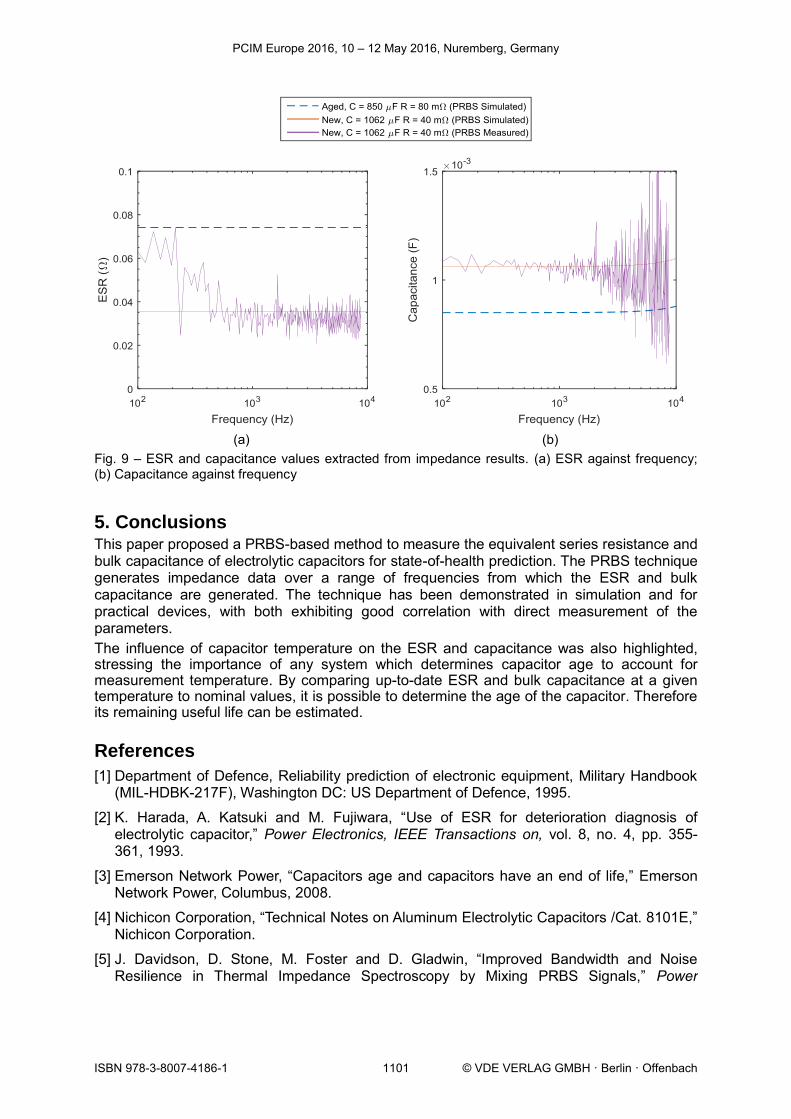
𝐸𝑆𝑅 = ℜ(𝑍) (5)
𝐶 = −1
2𝜋𝑓 ℑ(𝑍) (6)
The PRBS results show reasonable agreement with the ‘New’ capacitor simulation results with the following exceptions. Firstly, the experimentally obtained ESR values shown here are higher than the predicted values for the capacitor at frequencies below 500 Hz. In simulation the ESR is assumed constant with no frequency dependence; this is not the case, especially at lower frequencies. Secondly, the capacitance data is noisy at frequencies above 2 kHz, meaning that distinguishing between a new and aged capacitor is difficult. The increase in noise is due to reactance becoming smaller as frequency increases, resulting in a falling signal to noise ratio with increasing frequency. Considering both the ESR and capacitance together, the most suitable frequency at which both parameters can be determined is approximately 1 kHz. If the system were to be used to characterise capacitors of different values the optimum frequency will vary. This highlights the importance of tuning the PRBS system parameters to ensure that it is possible to suitably measure the capacitor under test over its entire ageing range.
PCIM Europe 2016, 10 – 12 May 2016, Nuremberg, Germany
ISBN 978-3-8007-4186-1 © VDE VERLAG GMBH · Berlin · Offenbach1100
(a)
(b)
Fig. 9 – ESR and capacitance values extracted from impedance results. (a) ESR against frequency; (b) Capacitance against frequency
5. Conclusions This paper proposed a PRBS-based method to measure the equivalent series resistance and bulk capacitance of electrolytic capacitors for state-of-health prediction. The PRBS technique generates impedance data over a range of frequencies from which the ESR and bulk capacitance are generated. The technique has been demonstrated in simulation and for practical devices, with both exhibiting good correlation with direct measurement of the parameters. The influence of capacitor temperature on the ESR and capacitance was also highlighted, stressing the importance of any system which determines capacitor age to account for measurement temperature. By comparing up-to-date ESR and bulk capacitance at a given temperature to nominal values, it is possible to determine the age of the capacitor. Therefore its remaining useful life can be estimated.
References
[1] Department of Defence, Reliability prediction of electronic equipment, Military Handbook (MIL-HDBK-217F), Washington DC: US Department of Defence, 1995.
[2] K. Harada, A. Katsuki and M. Fujiwara, “Use of ESR for deterioration diagnosis of electrolytic capacitor,” Power Electronics, IEEE Transactions on, vol. 8, no. 4, pp. 355-361, 1993.
[3] Emerson Network Power, “Capacitors age and capacitors have an end of life,” Emerson Network Power, Columbus, 2008.
[4] Nichicon Corporation, “Technical Notes on Aluminum Electrolytic Capacitors /Cat. 8101E,” Nichicon Corporation.
[5] J. Davidson, D. Stone, M. Foster and D. Gladwin, “Improved Bandwidth and Noise Resilience in Thermal Impedance Spectroscopy by Mixing PRBS Signals,” Power
PCIM Europe 2016, 10 – 12 May 2016, Nuremberg, Germany
ISBN 978-3-8007-4186-1 © VDE VERLAG GMBH · Berlin · Offenbach1101

Electronics, IEEE Transactions on, vol. 29, no. 9, pp. 4817 - 4828, 2014.
[6] A. Saavedra-Montes and J. Ramirez-Scarpetta, “Identification of excitation systems with the generator online,” Electric Power Systems Research, vol. 87, pp. 1 - 9, 2012.
[7] A. Fairweather, M. Foster and D. Stone, “Modelling of VRLA batteries over operational,” Journal of Power Sources, vol. 207, pp. 56-59, 2012.
PCIM Europe 2016, 10 – 12 May 2016, Nuremberg, Germany
ISBN 978-3-8007-4186-1 © VDE VERLAG GMBH · Berlin · Offenbach1102


![40 MTR 20 WATT QRP LINEAR AMPLIFIER KIT · 1 100 to 220 µf electrolytic capacitor [C1] 1 10 µf electrolytic capacitor [C2] ... 12 volt DC power supply 3 amp rating Proper dummy](https://static.fdocuments.us/doc/165x107/5e740dae5d947e09eb604296/40-mtr-20-watt-qrp-linear-amplifier-1-100-to-220-f-electrolytic-capacitor-c1.jpg)