ELECTROCHEMICAL STUDIE OSF TITANIU IM N … · A specia studl «oyf earlier publication osn the...
302
ELECTROCHEMICAL STUDIES OF TITANIUM IN MOLTEN CHLORIDES AND FLUORIDES by Sylvestre Vire (Docteur Ingenieur) June 1981 A thesis submitted for the degree of Doctor of Philosophy of the University of London and for the Diploma of Membership of the Imperial Colle Department of Metallurgy and Materials Science, Imperial College, » London S.W.7.
Transcript of ELECTROCHEMICAL STUDIE OSF TITANIU IM N … · A specia studl «oyf earlier publication osn the...
ELECTROCHEMICAL STUDIES OF TITANIUM IN MOLTEN CHLORIDES AND FLUORIDES
by
Sylvestre Vire (Docteur Ingenieur) June 1981
A thesis submitted for the degree of Doctor of Philosophy of the University of London and for the Diploma of Membership of the Imperial Colle
Department of Metallurgy and Materials Science, Imperial College, » London S.W.7.
(ii)
ABSTRACT
Potentiostatic cyclic voltammetry, chronopotentiouietry and emf measurements have been used to study the electrochemical behaviour of aluminium and titanium species in molten sodium fluoride at 1300K in order to elucidate the reduction mechanism of the respective ions.
A special study «of earlier publications on the aluminium and titanium systems in different media and at various temperatures is reported. It led to the conclusions that none of these metals had been fully investigated in molten sodium fluoride-based mixtures at high temperatures.
By suitable use of the techniques mentioned above, an investigation of the acidity dependence of the reduction processes of AI(III), Ti(IIl) and Ti(IV) complexes has been carried out. At a platinum electrode it was observed that the final reduction of Al(lll) or Ti(IIl) species was anodically shifted by the addition of oxides. This phenomenon was tentatively explained in terms of the intervention of different overvoltages. Following those results, the study was extended to cryolitic metals in which oxide dissolutions proved to have similar effects.
Electrolysis of Ti^O^-NaF melts produced promising deposits on nickel substrates but on the other hand electrolyses of Ti^O^ cryolitic mixtures resulted in a codeposition of Ti and Al. Scanning electron micrographs of the different deposits on various substrates are also presented.
Some related studies include the choice and design of a suitable reference electrode and the development of an adequate
(iii)
purification method to prepare high purity AlF^.
In addition, an electrochemical investigation of the reaction Ti2+ + 2e~ = Ti in the LiCl-KCl .eutectic at 450°C and 550°C has been carried out. A limit of the solubility of
TiCl^ at 4-50°C has been determined as well as the diffusion 2+ o coefficient of the chloro-complexes of Ti at 550 C. A
2+ value of the potential of the redox couple Ti/Ti (vs Ag/Ag(l)) is also proposed.

(iv)
ACKNOWLEDGEMENTS
I wish to express my sincere gratitude to my supervisor Dr. D. Inman for his guidance, tolerance and understanding throughout this study.
I would also like to thank my colleagues in the Nuffield group for their valuable co-operation and very often invaluable technical assistance.
Lastly but by no means least, the author would like to express his gratitude to the C.N.R.S. and the Royal Society for providing a bursary for my two and a half years research at Imperial College.
(v)
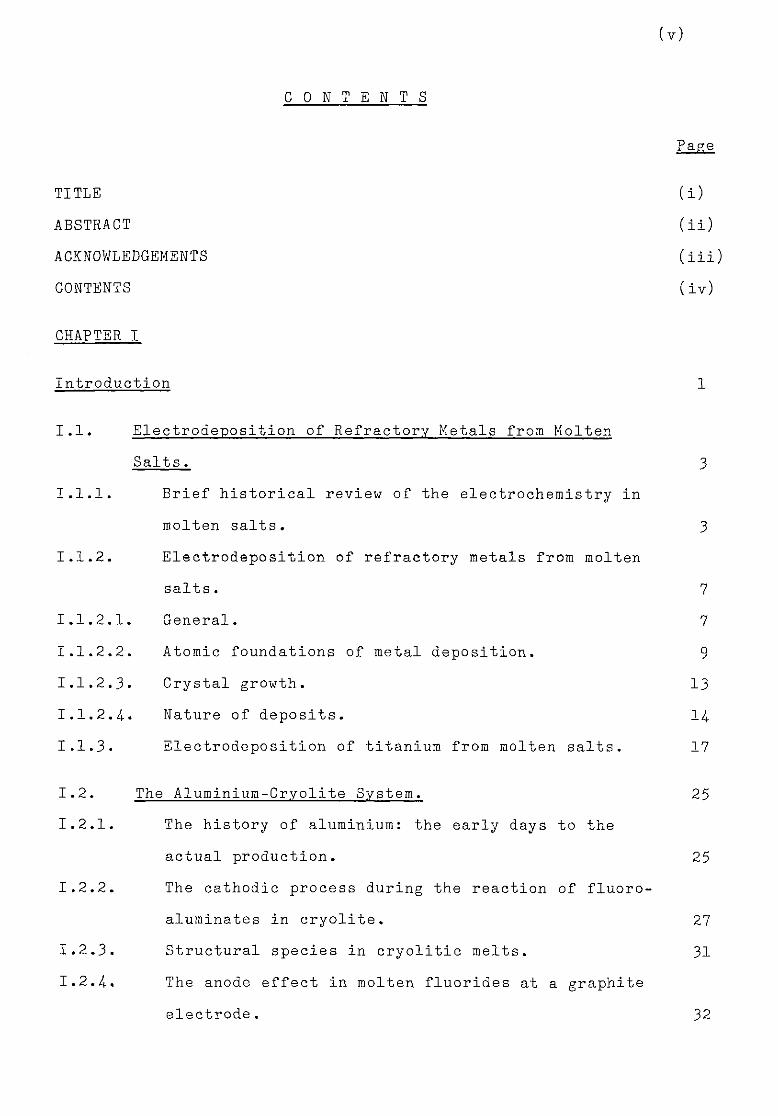
C O N T E N T S
TITLE ABSTRACT ACKNOWLEDGEMENTS CONTENTS
CHAPTER I
Introduction 1
1.1. Electrodeposition of Refractory Metals from Molten Salts. 3
1.1.1. Brief historical review of the electrochemistry in molten salts. 3
1.1.2. Electrodeposition of refractory metals from molten salts. 7
1.1.2.1. General. 7 1.1.2.2. Atomic foundations of metal deposition. 9
1.1.2.3. Crystal growth. 13 1.1.2.4-. Nature of deposits. 14 1.1.3. Electrodeposition of titanium from molten salts. 17
1.2. The Aluminium-Cryolite System. 25 1.2.1. The history of aluminium: the early days to the
actual production. 25 1.2.2. The cathodic process during the reaction of fluoro-
aluminates in cryolite. 27 1.2.3. Structural species in cryolitic melts. 31
1.2.4. The anode effect in molten fluorides at a graphite electrode. 32
Page
(i)
( i n
(iii)
(iv)

(vi)
Page
1.2.5. The concept of the acid base reaction in molten salts. 35
1.2.6. Introduction to the present work. 38
CHAPTER II
Experimental procedure in molten fluorides and
chlorides. 41 II .1. Experiments in molten fluorides. 41 II .1.1. Furnace and controls. 41 II.1.2. Cell. 46
II .1.3. Vacuum and gas supply. 51 II. 1.4. Electronic equipment. 54 II.1.4. 1. Chronopotentiometry. 54 II.1.4. 2. Sweep voltammetry. 54 II.1.4. 3. Electrolysis. 57 II.1.5. Electrode. 57 II.1.5. 1. Choice of a reference electrode. 57 II .1.5. 2. Working and counter electrode. 68 II.1.6. Crucibles. 68
II .1.7. Chemicals and materials. 74 II .1.8. Experimental procedure. 77 II .1.8. 1. Chronopotentiometric measurements. 77 II.1.8. 2. Solute additions. 77 II .2. Experimental procedure in molten chlorides. 78 II.2.1. Furnace and temperature control. 78 II.2.2. Cell 79 II.2.3. Vacuum and gas supply system. 79 II.2.4. Electronic equipment. 81 II.2.5. Electrodes. 81 II .2.5. 1. Platinum electrodes. 81

(vii)
Page 11.2.5.2. Tungsten electrodes. 81
11.2.5.3. Counter electrodes. 86 II.2.5.4-. Reference electrodes. 86 11.2.6. Chemicals. 89 11.2.7. Purification of the eutectic LiCl KC1 89 11.2.8. Experimental proceudre. 94-
11.2.9. Compounds preparation. 96 11.2.9.1. Preparation of TiCl2. 96 11.2.9.2. Preparation of f^TiCl^. 96
CHAPTER III
Results and specific discussion.
III.l. The System A1(III)/A1 in Molten Fluorides at 1300K. 103 III.1.1.1. Estimation of the potential of decomposition of
different fluorides and oxides at 1300K. 103 111.1.1.1. Pure fluoride mixtures. 103 111.1.1.2. Standard decomposition voltages of the aluminium
oxide and sodium oxide. 106 111.1.2. Voltammetric study of the solvent. 106
111.1.3. Aluminium ions in sodium fluoride at 1300K. 108 111.1.3.1. Voltammetric studies. 108 111.1.3.2. Effect of concentration of AlF^ on the main features
of the reduction wave. 118 III.1.4-. Discussion. 121 III .1. 4. .1. Influence of the ohmic distortion. 121 III.1.4,.2. The reaction Al(IIl) + 3e = A1 in sodium fluoride
at 1300K. 122 III.1.5. The influence of oxide additions to the system
Al( III) A1. 124.

(viii)
Page 111.1.5.1. Voltammetric studies of dissolved alumina in
sodium fluoride at 1300K. 124 111.1.5.2. Additions of sodium oxide to fluoroaluminate
solutions. 129
111.1.5.3. Discussion. 134 111.1.6. The special case of cryolitic melts. 139 111.1.6.1. Emf measurements in cryolitic solutions. 139 111.1.6.2. Voltammetric study of cryolitic solution. 142 111.1.7. Conclusions of the present section. 145
III.2. Electrochemical Behaviour of Titanium Species in
Molten Sodium fluoride at 1300K. 146 111.2.1. Estimation of the potentials of decomposition of
some titanium fluoride and oxide at 1300K. 1 4 6
111.2.2. Titanium (IV) species in sodium fluoride at 1300K. 148 111.2.2.1. Voltammetric study of the first reduction process. 148
111.2.2.2. Chronopotentiometric study of the first process. 151
111.2.2.3. Discussion. 152 111.2.3. Study of the second cathodic process. 158 111.2.3.1. Chronopotentiometry and voltammetry. 158 111.2.3.2. Discussion. 161
111.2.4. Effect of addition of oxide to the system Ti(III)/Ti.163
III.2.4.1. Voltammetric studies. 163 111.2.4-2. Discussion. 167 111.2.5- Emf measurements of sodium fluoride Tl^O^ mixtures. 171 111.2.6. General discussion. 174 111.2.7. Electrodeposition of titanium from Ti^O^/NaF
mixtures at 1300K. 176 111.2.7.1. Structure of the different coatings. 177 111.2.7.2. Adhesion. 186 III.2.7.3- Surface finish and purity. 186
(ix) P A G O
III.2.7.4. Large scale electrolysis. 187
111.3. The Cryolite Ti^CU Mixtures. 193 III.3-1- Voltammetric study of the cryolite Ti?0
3 solutions . 194
III.3.2. Discussion. 200 111.3-3. Electrodeposition of titanium from cryolitic
mixtures. 202
111.4. The Cryolite TiO^ Mixtures. 203 111.4-1. Emf measurements of cryolite-aluraina-TiO^
mixtures. 206 III.4.2. Voltammetric study. 208
III.4.3- Electrodeposition of Ti from cryolite TiO^ Al^O^ mixtures. 214
111.5. Electrochemical Studies of Titanium in molten chlorides of 450°C and 550°C. 220
111.5.1. Anodic dissolution of Ti in LiCl KC1 eutectic. 221 111.5.1.1. Anodization of Ti in LiCl KC1 at 550°C. 221 111.5.1.2. Anodic dissolution of Ti in LiCl KC1 at 550°C. 225
111.5.1.3. Discussion. 227 111.5.2. Electrochemical study of TiCl^ in the eutectic
LiCl KC1 at 550°C. 230 III.5.2.1. Voltammetric study. 232 111.5.3. Chronopotentiometric study of Titanium (II)
species. 247 111.5.4. Discussion. 254
CHAPTER IV General Conclusions and future work. 262 IV.1. General conclusions. 262 IV. 2. Future work. ' 263

(x) P A G E
REFERENCES 266
APPENDIX 1 284
APPENDIX 2 287 APPENDIX 3 2 8 9
APPENDIX 4 2 9 Q
APPENDIX 5 2 9 3
1
CHAPTER 1
INTRODUCTION
There is no agreed definition for what constitutes a refractory metal apart obviously from its high melting point. In fact, it is usual to consider metals with a melting point greater than that of iron (1535°C) to be refractory. Apart from the interesting mechanical properties that these metals possess in common, some of them have unique physical and chemical properties which explains the very important position these metals have gained in a great number of basic inorganic treatises.
As these metals tend to be very difficult to obtain in the free state in any good commercial purity, and are sensitive to interstitial impurities such as 0^, H^ C and N^, complex and often expansive processes are needed for their extraction and isolation.
Titanium is no exception to this rule. Titanium was discovered in 1791 by William Gregory, an
English clergyman and amateur chemist. The element was first obtained in its pure state in 1910 by Hunter (following the reaction of reduction of TiCl, by Na). Nevertheless, the titanium industry dates from the publication of the Kroll process in 1940
which involves the reduction of TiCl, by Mg. 4
The two reactions involved are either [TiClJ + 4(Na) = <Ti> + 4<NaCl> (1) AG° = -226.200 + 65.2 10"3T kcal mole"1
or jTiCl^j + 2 (Mg) = <Ti> + 2<MgCl 2> (2) AG° - -129.200 + 4.5 10"3T kcal mole"1
For the Kroll process the reaction (2) has to be considered (appendix 3). As r art of a general concern to improve me
2
recovery processes, the use of molten salts has been envisaged for the eventual electrodeposition of titanium.
Actually quite a number of metals can only be prepared electrolytically in a pure form by the use of molten salts. In addition many ores can only be dissolved in molten salts before electrolysis. It is well documented that in aqueous electrodepositing baths the pH value of the solutions has a strong influence on the micro structure of the deposits (185). It is therefore possible that the acidity of a melt (for the concept of acidity in molten salts see Chapter I), for instance the concentration of oxides, has an effect on the mechanisms of the deposition. It is obvious that economic factors play a part but it is surprising to note that the most successful processes of deposition are liquid. Consequently unless the solid deposit is coherent and massive it is extremely difficult to separate the powdery or dendritic deposits from the occluded melt.
The main problem with refractory metals in general and titanium in particular is that they cannot be electrodeposited from aqueous solutions because either their low oxidation states may reduce H20 or their high oxidation states may oxidise H^O. In addition the stability of their oxocomplexes is often very high and they are generally passivated by oxide films. On the other hand the molten salts exhibit advantages which are mainly: 'a good electrical conductivity (therefore not requiring the addition of a supporting electrolyte), *a rather important decomposition voltage, and 'the capability of dissolving a great number of compounds.
Nevertheless because of the form of the deposits the industrial applications of electrochemical processes in molten
3
salts have until now been very limited. The deposits can indeed be of the three main kinds: powdery, dendritic and coherent. The coherent state is certainly the most desirable as far as commercial interests are concerned.
One will therefore understand why the knowledge and control of the kinetics of the reduction are so critical in obtaining deposits of desirable texture and purity. With regard to the production of titanium, the utilization of molten cryolitic baths is certainly very attractive because all the technology associated with the cryolite-aluminium system is readily available. The objective of the present research was to identify process conditions that would render the eventual titanium deposit easily removable from the electrode and enable it to be processed competitively to the titanium Kroll sponge.
I.1. Electrodeposition of Refractory Metals from Molten Salts
I.1.1.Brief historical review of the electrochemistry in molten salts
Since molten salts and elevated temperatures are synonymous, the majority of electrode processes in these systems are rapid and the determination of their rate constant is beyond the scope of conventional voltammetric studies. Therefore numerous reported studies have been only dealing with characterization of electrode processes, their reversible potentials, the number of electrons involved and the determination of diffusion coefficients of different electroactive species.
However even if the basic mechanisms in molten salts are less complex than in aqueous solution, technically their experimental investigation certainly involves more difficulties.
4
One must admit that among all the problems encountered in molten salts electrochemistry, the containment of highly corrosive melts like fluorides, the choice of a suitable reference electrode, the utilization of a proper working electrode and the preparation of pure melts have been critical in the early days of molten salts studies. It was indeed the failure to reduce the level of impurities which led to irreproducible results, especially in early voltammetric investigations.
The most widely used systems are those containing the alkali halides since they have a large decomposition voltage and are chemically stable up to rather high temperatures. In these systems the primary concern is to develop a suitable reference electrode and appropriate working electrodes. Liquid metals electrodes have been studied extensively (1). Their well defined surfaces lent themselves to measurements of impedance at the metal interface (2), but the utilization of liquid metal electrodes has numerous difficulties and as a consequence attention turned to solid micro-electrodes for voltammetric studies (3).
The fundamental requirements of reference electrodes in molten salts are their reproducability over long intervals of time, reversability and non polarisability. In nitrates the system Ag/AgNo^ was first developed by Flengas et. al. (4)- In a further development of this electrode a separation from the melt was made by containing the electrode in a thin glass diaphragm leading to the widely used system in chloride-based melts of the Ag/AgCl electode (5) (6).
Following these improvements, many investigations have been carried out particularly on the reduction of metal ions. However,
even with improved working and reference electrodes the current voltage curves and voltammograms were still poorly reproducible These irregularities were then explained in terms of uneven deposition of the reduced metal. Acceptable explanations were proposed only after the introduction of fast scan techniques or oscillographic polarography: different equations were then utilized to describe the shape of the current voltage curves.
For instance if the reduced metal is soluble into the electrode material (case of an alloy formation) the current potential relationship is described by the well known Heyrovsky Ilkovic equation
RT E = Ei + — Log
2 nF id - i
(id being the limiting current)
On the other hand, if the deposited metal is insoluble in the substance and if one maintains that the activity of the deposit is unity at all stages of the electrolysis, then the Koltoff Lingane equation may be considered:
RT E = Ex + — Log
2 nF id - i
Therefore an analysis of the polarographic waves in terms of these two equations gave indications of the nature of the deposited metal.
Delimarskii (7) (8) studied the reduction of different metals in molten nitrates on platinum. They explained the curves obtained in terms of diffusion of the deposited metal into platinum to form an alloy.
Laitinen et. al. (9) related a comprehensive work on the deposition of metals below and above their melting points in LiCl-KCl at 450°C. They obtained distorted waves in the deposition of solid zinc which were interpreted in terms of the formation of dendrites. Gaur and Jindal (10) made similar experiments on
6
alloy formation with Gd in MgCl^/KCl on different substrates,
but Mamantov et. al. (11) (12), investigating the reduction
of U(IV) in fluorides and different metal ions in molten nitrates
at platinum electrodes, did not report the formation of alloys
from the analysis of the current voltage curves. Schmit (13) in a study of the reduction of different ions
in molten KCl.LiCl at 450°C at platinum electrodes used oscillographic polarography and observed double waves for the reduction of different ions. He interpreted these double waves as the formation of metallic monolayers at the electrode electrolyte interface or as an energetically favoured intermetallic compound of the deposited metal and platinum.
But of the various voltammetric methods applied to the study of molten salts systems one of the earliest techniques was chronopotentrometry. This technique is particularly useful when making initial investigations on a system since information is readily available as to the potential of the reaction, the reversibility of the process, the number of electrons and hints on the mechanisms by which the reaction takes place. However, the most common application has been the determination of diffusion coefficients.
Laitinen and Ferguson (14) first used this technique in the field of molten salts. Since then it has been widely used and an extensive chronopotentiometric study was published by Inman and Bockris (15) investigating different molten salts systems. Refractory metals and less common metals received much attention and numerous publications are available (l6)-(23).
Nevertheless, cyclis sweep voltammetry was introduced in the field of molten salts only ten or fifteen years ago (24)(25) Because of its relative simplicity, cyclic voltammetry is perhaps one of the most readily applied techniques in studies on the nature
7
of electrochemical reactions. The transition metals have been examined in different salts using this method. Manning et al (26(27) studied iron in molten fluorides.
Nickel was also the object of voltammetric investigations (28). From the latter results the system Ni(ll)/Ni has been the basis of the design of a proper reference electrode in molten fluorides (29). Uranium and thorium were also among the metals which were examined in molten salts using voltammetric methods (30 (31). But one has to turn to recent publications to find a wider use of this modern technique compared with 15 or 20 years ago when chronopotentiometry and polarography were largely preferred and more easily interpreted.
In the present work, the sweep voltammetry and related techniques will be used as a fundamental means of mechanistic investigations.
1.1.2. Flectrodeposition of refractory metals from molten salts.
1.1.2.1. General The reaction mechanisms of electrode processes in
molten salts are, as in the case of aqueous solutions, influenced by the charge of the electrode surface because this determines whether the metal will attract or repel certain ions of the melt. In the systems studied up to now in molten salts the surface charge of the electrode has been found positive, thus acting against the adsorption of positively charged ions. In addition the reduction process can be affected by the nature and the structure of the double layer assuring the interface boundary layer between the melt and the electrode.
8
On the basis of different experiments, the structure of the double layer in molten salt has been found to be of the lattice type (32) (by opposition to a single Helmoltz plane and a diffuse layer in aqueous solutions) alternating positive and negative excess of charges. In molten halides experiments done on a lead electrode at a zero surface charge supported this theory. Indeed in molten LiCl and NaCl at 800°C and in KC1 and CsCl it was observed that the capacitance was less in the KC1 and CsCl melts than in NaCl and LiCl. Ukshe et al (32) interpreted this phenomenon by assuming that the phase boundary layer is a close packed arrangement of anions with cations filling the gap. As the sizes of K+ and Cs+ ions are larger than those of Li+ and Na+ these cations tend to loosen the layers resulting in a decrease of capacitance.
As far as the electrode process itself is concerned, the adsorption of the metal cations on to the electrode certainly plays an important part because this means that positively charged ions will be adsorbed on a positively charged electrode. It has been suggested (33) that the effect of the adsorbed anions is partially to neutralize the positive charges of the surface and promote the attachment of metal cations. Another possible way to overcome this difficulty is to complex the metal cations by which a positive charge can be made negative, but on the other hand this complexation tends to make the removal of the cation from its environmental shell more difficult.
Evidence for complex formation is based mainly on activity coefficients or conductivity measurements and spectroscopic determinations. But the ambiguity of the differentiation between strong interaction of neighbouring particles and true complex
9
formation resulting in the appearance of true kinetic entities remains unclarified.
1.1.2.2. Atomic foundations of metal deposition.
In the early works published on electrode kinetics, it was thought that the atomic mechanism corresponding to the process M + + e = M was that of an electron jump from the metal to the positive ion. Since then, this simplistic approach has been greatly modified.
Depending on how far from the electrode one views the problem, different steps in the electrodeposition process can be envisaged. There are three positions on the cathode, inside the double layer or in the bulk of the solution.
Inside the double layer, the interesting point is to find which step in the electrocrystallization will control the rate of nucleation. Matthews produced two diagrams (34) which emphasized the fundamental conditions for the transfer of an electron from the electrode (Figures 1.1*1 and 1.1.2). The rate of transfer is then determined by the frequency of occurrance of the acceptor state E^ = E . More specifically, the electron tunnelling occurs at the intersection of the two paths on Tig 1.1.2 this situation corresponding to a particle in the solvation sheath which is stretched enough to allow building into the lattice.
Another problem now arises from the transformation which may occur to the solvation shell during the atomic movement (arrival inside the double layer and building into the lattice).
Bockris (35) found it reasonable to conceive that the solvating sheath still remains attached to the particle

10
Curve(a): Potential onergy for removal of an electron from the
metal.
Curve(b): Potential energy for removal of an electron from the
particle to form an ion.
Figure 1.1.1 (34)
Energy. E
E
E ,
E 2
0
— A B
\ 0
on
Distance
Curve A: Potential energy for solvat^d ion.
Curve B: Potential energy for an adsorbed particle on the surface,
after charge transfer.
F i g u r e J . 1 . 2 ( 5 4 )
11
after the charge transfer signifying that the particle still possesses a certain ionic character. The number of solvating anions or molecules will then decrease as the particle replaces those anions by other metal atoms. Consequently, during the charge transfer the ion has to displace part of its solvation sheath, the amount of displacement depending upon the site where the charge transfer occurs (planar site, edge of a growing layer, a kink). Hence, the more the displacement of the sheath for a given site, the greater the energy needed to surmount the barrier for the discharge on a particular type of site. This does not mean that a charge transfer to a site with a most distorted sheath need have greater energy of activation than others with a less distorted sheath. One can indeed conceive a compensation, for instance due to the lower energy of a particle in a particular final stage of the charge transfer process.
As early as 1958, Conway and Bockris (36) showed that the heat of activation required for transfer to a planar site was much less than that for an edge of a growing layer, to a kink or to a vacancy in an edge. Therefore, it is improbable that the transfer of an ion from the solution to the metal surface occurs to a kink site if the heat of activation for transfer to a planar site is lower than that to any others on the metal surface.
At this point, it is interesting to try to determine which of the consecutive steps is associated with the greatest difficulty: charge transfer, surface diffusion or transfer from one site to another.
Damjanovic and Bockris (37) indicated that the concentration of dislocations had an effect on the kinetic laws.
12
They defined a factor ND to characterize the controlling step. P N being the dislocations concentration
intercepting the surface. D diffusion coefficient of adions or
adatoms on the surface. P frequency factor of escape of adions
to the double layer. If the concentration of dislocations is large, this factor will be large and the charge transfer will then be the controlling step since the adions reaching the surface will diffuse quickly to the site. At more perfect surfaces where surface diffusion is rate controlling, the local anodic current (escape of adions) is at a maximum where the adion concentration is highest and at a minimum near the growth. Consequently, the net current will be confined to the growth step. Besides, as the over-potential becomes more cathodic, the rate of the local anodic current decreases, the time a particle spends on the surface after the charge transfer, and the probability of the particle reaching a step and being incorporated, increase. This is equivalent to an increase in the rate constant of the surface diffusion which then ceases to be rate controlling.
The assumption of a path involving surface diffusion was argued by some authors. Fleischman and Thirsk (38) assumed that the charge transfer and the loss of the solvation sheath occur only at sites where the energy gain is the greatest owing to co-ordination with neighbouring atoms forming part of the lattice. There is consequently no surface diffusion of adatoms and charge transfer desolvation and lattice incorporating takes place as a single act. However, in another paper published by
13
Mehl and Bockris (3) the involvement of a surface diffusion step in the functioning of the electrocrystallization seems likely.
1.1.2.3. Crystal growth
Crystal growth from solutions differs in many ways from crystal growth from the vapour phase (solvated ions, presence of the double layer on the metal, adsorbed ions or molecules on the electrode surface).
Inside the double layer the electric field can be of 7 -1
the order of 10 Vcm , strong enough to bring a deformation of the solvation shell. The presence of this shell also changes the situation relative to the growth from the vapour phase because partial or complete desolvation can introduce a kinetic step prior to incorporation into the crystal lattice. The other important factor is the diffusion which is much slower in solutions than in the vapour phase. Thus diffusion in solutions may become rate-controlling in the case of crystal growth.
In addition, adsorbed species can hinder the surface diffusion of adatoms since the latter must involve displacement of those -adsorbed ions contributing to a decrease of their mobility. On the other hand, solvated adsorbed ions or molecules have a weaker bond-energy with the surface, resulting in a decrease of the energy of activation for the surface diffusion.
Although the adsorption of foreign substances (different from the solvent ions or the solute) seems to have little effect
on the kinetics of the electrode process, in practice it exerts
significant influence on the nature of the deposited metal and
may even change the reaction mechanism. As a result of
adsorption, the foreign substances cover various fractions of
the electrode area thus reducing the surface available for the
cathodic process. The desorption process which can then be
induced increases the energy required for the cathodic process
and adsorbed species are regarded as inhibitors. A l s o , it can
introduce a kinetic step in the reduction mechanism and retard
the building into the lattice, interfering with the very nature
of the d e p o s i t .
Thus any alterations in the composition or structure
of the double layer influence the nature of the adsorption and
may increase the energy of activation of the charge transfer
resulting in an increase of the transfer overvoltage.
1.1.2.4. Nature of deposits.
A major work published in 1954 by H. Fischer (40)
provides a classification of metal deposits in five categories:
Base oriented reproduction type (BR), field oriented texture (F.T.),
non oriented dispersion type (W.D.) twinning type (S), and
field oriented isolation type (Fl). The first four categories
relate to compact deposits while only(FI)describe deposits in
which there is no formation of solid layers but where the
electrolyte can be entrapped and occluded.
Nonetheless, non-compact deposits can be of different
textures. For instance, dendrites and needle like deposits
could be considered as belonging to the (Fl)type, but in the
15
case of powdery deposits where there is no field oriented growth of crystals the granular appearance would justify their classification as a granular isolation type (Gl).
Reasons for the formation of dendrites have been suggested (4-1) recently. According to this publication, they appear to be a consequence of interplay between the crystallographic properties of the system and the effect of slow transport of depositing ions from the bulk of the melt.
As far as granular growth is concerned, A.R. Despic et al (4-2) (4-3) have made an exhaustive study of the problems. Their conclusions, drawn from experiments on the granular deposition of zinc, showed that the adsorption of a foreign matter at the surface of the growing granule had a strong effect on its incorporation into the crystal lattice. They concluded that a strong inhibition was necessary to the formation of granules. That is if at a certain stage of growth the rate of crystal lattice building becomes less than the rate of adsorption then full coverage by foreign species can be attained, stopping further growth.
The effect of codeposition of a more electropositive foreign metal can lead to the suppression of the formation of dendrites and the appearance of spongy deposit (4-4-) (4-5). In fact, few cases showed a very fine and regular (GI) type outgrowth under microscopic observation. This was explained by the deposition of electropositive metal under conditions of limiting current in the form of regularly dispersed powder constituting crystallization centers on which the other metal could settle more readily than on the base surface of the substrate.
16
Whether dendrites grow or not depends primarily upon
the ratio between the current density and the concentration
of solute. In addition, for a given dendrite, the growth rate
increases with the potential and the concentration of the metal
cations. The dendritic growth is planar and the tip nearly
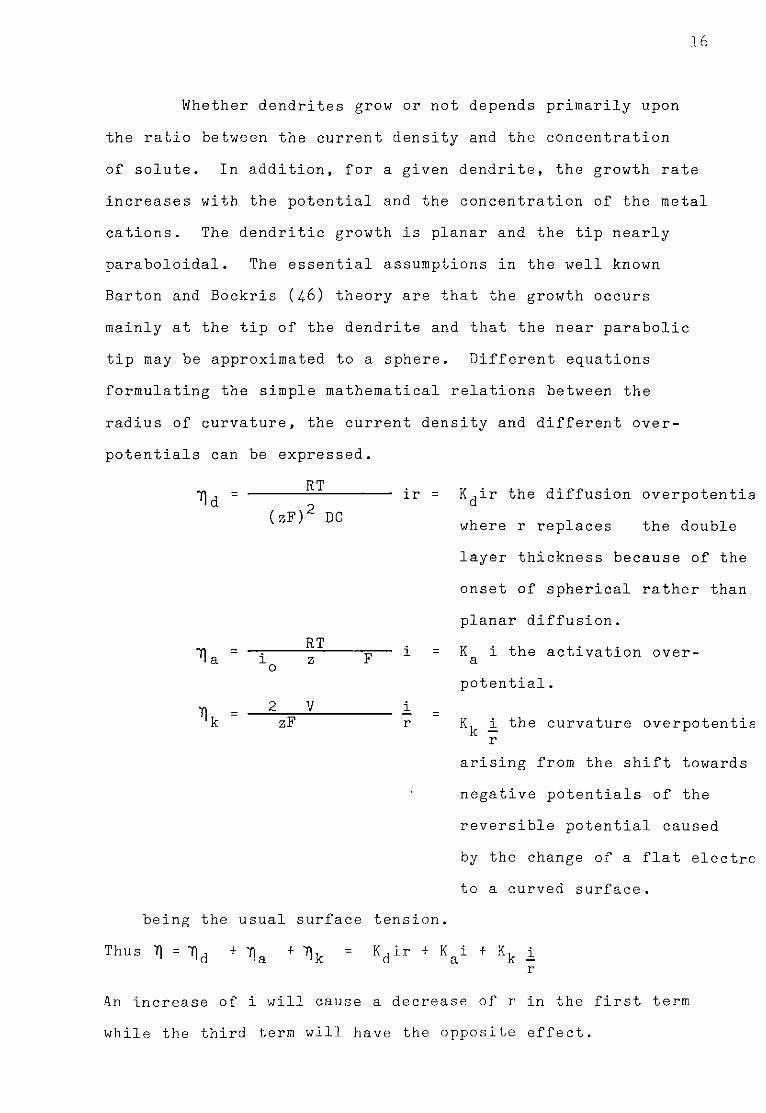
paraboloidal. The essential assumptions in the well known
Barton and Bockris (4-6) theory are that the growth occurs
mainly at the tip of the dendrite and that the near parabolic
tip may be approximated to a sphere. Different equations
formulating the simple mathematical relations between the
radius of curvature, the current density and different over-
potentials can be expressed.
RT 7] = ir = K^ir the diffusion overpotenti
(zF)2 DC , ,, , where r replaces the double
layer thickness because of the
onset of spherical rather than
planar diffusion. RT 71 = —-z s — i = K i the activation over-i a l z r a o potential. V i
zF r K . the curvature overpotenti r
arising from the shift towards
negative potentials of the
reversible potential caused
by the change of a flat electr
to a curved surface.
being the usual surface tension.
Thus T) = T|d + 71a + T]k = K d i r + K a i + i r
An increase of i will cause a decrease of r in the first term
while the third term will have the opposite effect.
17
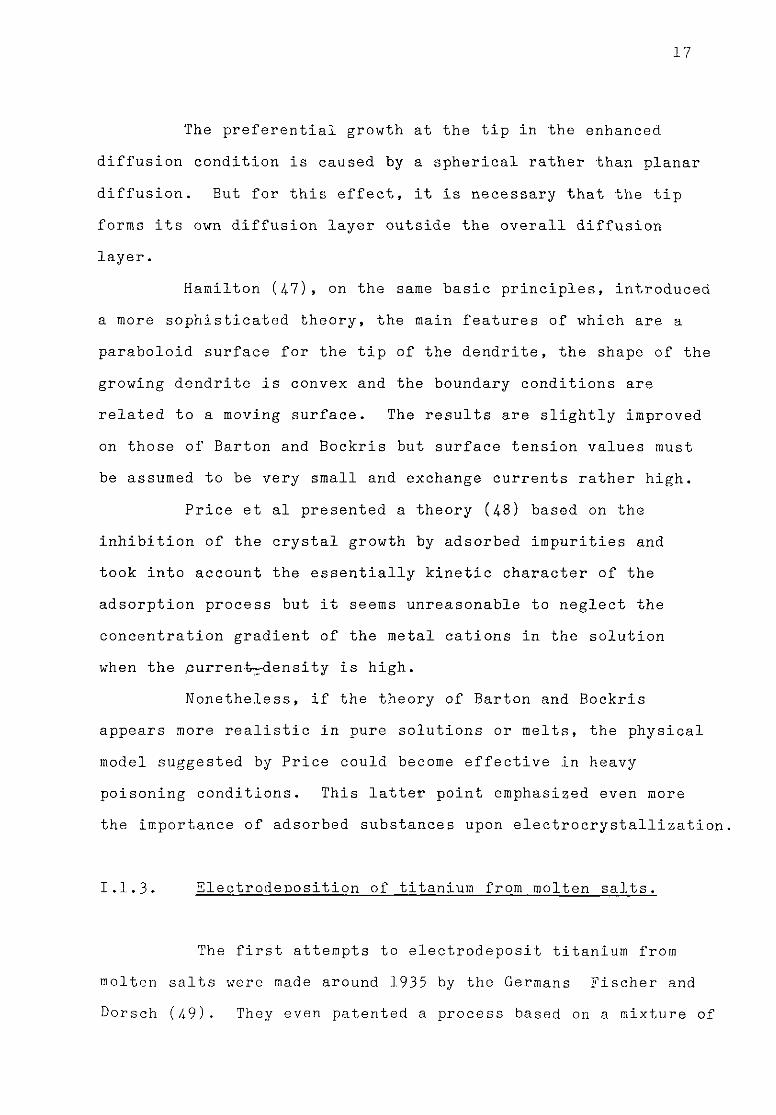
The preferential growth at the tip in the enhanced diffusion condition is caused by a spherical rather than planar diffus ion. But for this effect, it is necessary that the tip forms its own diffusion layer outside the overall diffusion layer.
Hamilton (47), on the same basic principles, introduced a more sophisticated theory, the main features of which are a paraboloid surface for the tip of the dendrite, the shape of the growing dendrite is convex and the boundary conditions are related to a moving surface. The results are slightly improved on those of Barton and Bockris but surface tension values must be assumed to be very small and exchange currents rather high.
Price et al presented a theory (48) based on the inhibition of the crystal growth by adsorbed impurities and took into account the essentially kinetic character of the adsorption process but it seems unreasonable to neglect the concentration gradient of the metal cations in the solution when the curren^Wdensity is high.
Nonetheless, if the theory of Barton and Bockris appears more realistic in pure solutions or melts, the physical model suggested by Price could become effective in heavy poisoning conditions. This latter point emphasized even more the importance of adsorbed substances upon electrocrystallization.
1.1.3. Electrodeposition of titanium from molten salts.
The first attempts to electrodeposit titanium from molten salts were made around 1935 by the Germans Fischer and Dorsch (49). They even patented a process based on a mixture of
18
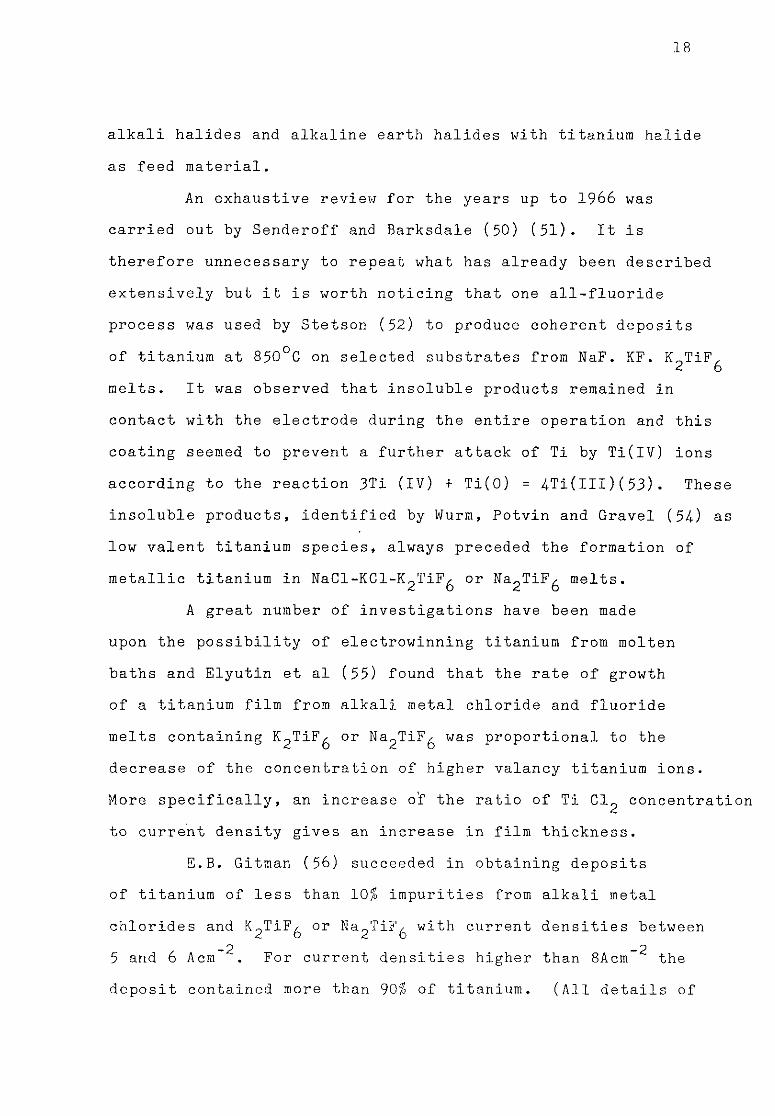
alkali halides and alkaline earth halides with titanium halide
as feed material.
An exhaustive review for the years up to 1966 was
carried out by Senderoff and Barksdale (50) (51). It is
therefore unnecessary to repeat what has already been described
extensively but it is worth noticing that one all-fluoride
process was used by Stetson (52) to produce coherent deposits
of titanium at 850°C on selected substrates from N a F . K F . K 0 T i F . 2 6
melts. It was observed that insoluble products remained in
contact with the electrode during the entire operation and this
coating seemed to prevent a further attack of Ti by Ti(IV) ions
according to the reaction 3Ti (IV) + Ti(0) = 4Ti(lII)(53). These
insoluble products, identified by Wurm, Potvin and Gravel (54) as
low valent titanium species, always preceded the formation of
metallic titanium in NaCl-KCl-K^TiF^ or Na^TiF^ melts.
A great number of investigations have been made
upon the possibility of electrowinning titanium from molten
baths and Elyutin et al (55) found that the rate of growth
of a titanium film from alkali metal chloride and fluoride
melts containing K^TiF^ or Na^TiF^ was proportional to the
decrease of the concentration of higher valancy titanium ions.
More specifically, an increase o'f the ratio of Ti Cl^ concentration
to current density gives an increase in film thickness.
E.B. Gitman (56) succeeded in obtaining deposits
of titanium of less than 10% impurities from alkali metal
chlorides and K^TiF^ or Na^TiF^ with current densities between - 2 - 2
5 and 6 Acm . For current densities higher than 8Acm the deposit contained more than 90% of titanium. (All details of
19
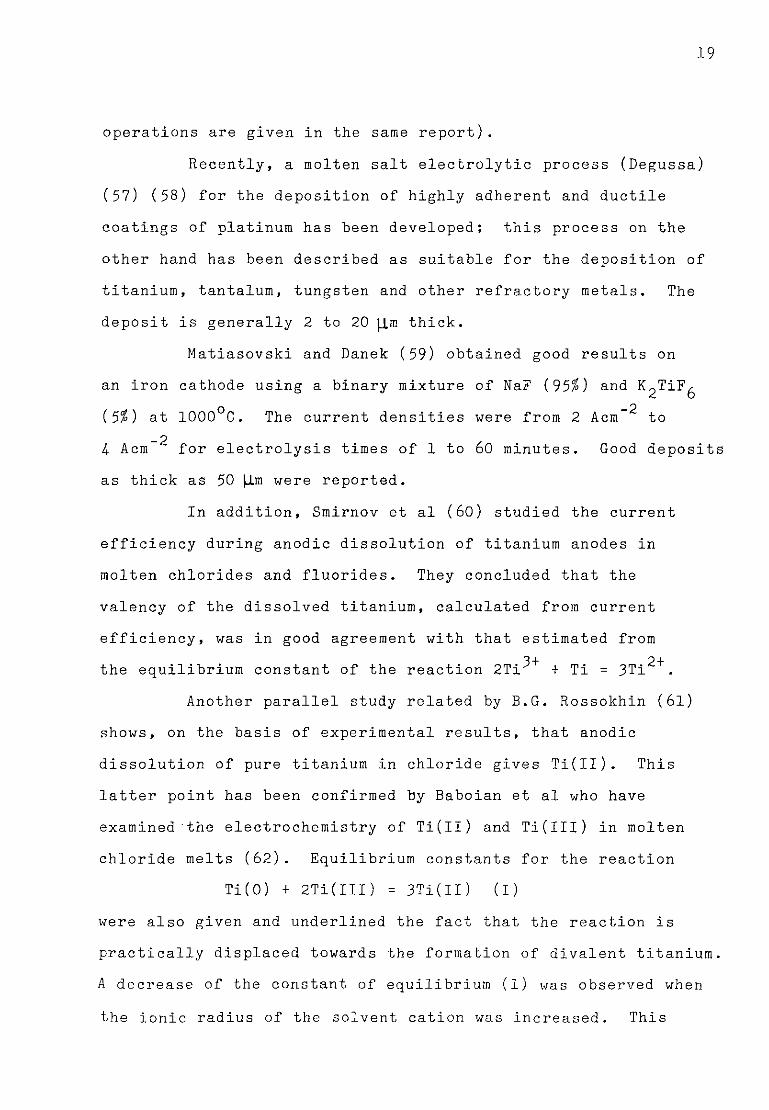
operations are given in the same report).
Recently, a molten salt electrolytic process (Degussa) (57) (58) for the deposition of highly adherent and ductile coatings of platinum has been developed; this process on the other hand has been described as suitable for the deposition of titanium, tantalum, tungsten and other refractory metals. The deposit is generally 2 to 20 jim thick.
Matiasovski and Danek (59) obtained good results on an iron cathode using a binary mixture of NaF {35%) and K^TiF^
o 2 (5%) at 1000 C. The current densities were from 2 Acm" to
_ 2
4 Acm for electrolysis times of 1 to 60 minutes. Good deposits as thick as 50 JJLm were reported.
In addition, Smirnov et al (60) studied the current efficiency during anodic dissolution of titanium anodes in molten chlorides and fluorides. They concluded that the valency of the dissolved titanium, calculated from current efficiency, was in good agreement with that estimated from 3+ 2+ the equilibrium constant of the reaction 2Ti + Ti = 3Ti
Another parallel study related by B.G. Rossokhin (61) shows, on the basis of experimental results, that anodic dissolution of pure titanium in chloride gives Ti(Il). This latter point has been confirmed by Baboian et al who have examined "the electrochemistry of Ti(Il) and Ti(IIl) in molten chloride melts (62). Equilibrium constants for the reaction
Ti(0) + 2Ti(III) = 3Ti(II) (I) were also given and underlined the fact that the reaction is practically displaced towards the formation of divalent titanium. A decrease of the constant of equilibrium (1) was observed when the ionic radius of the solvent cation was increased. This
20
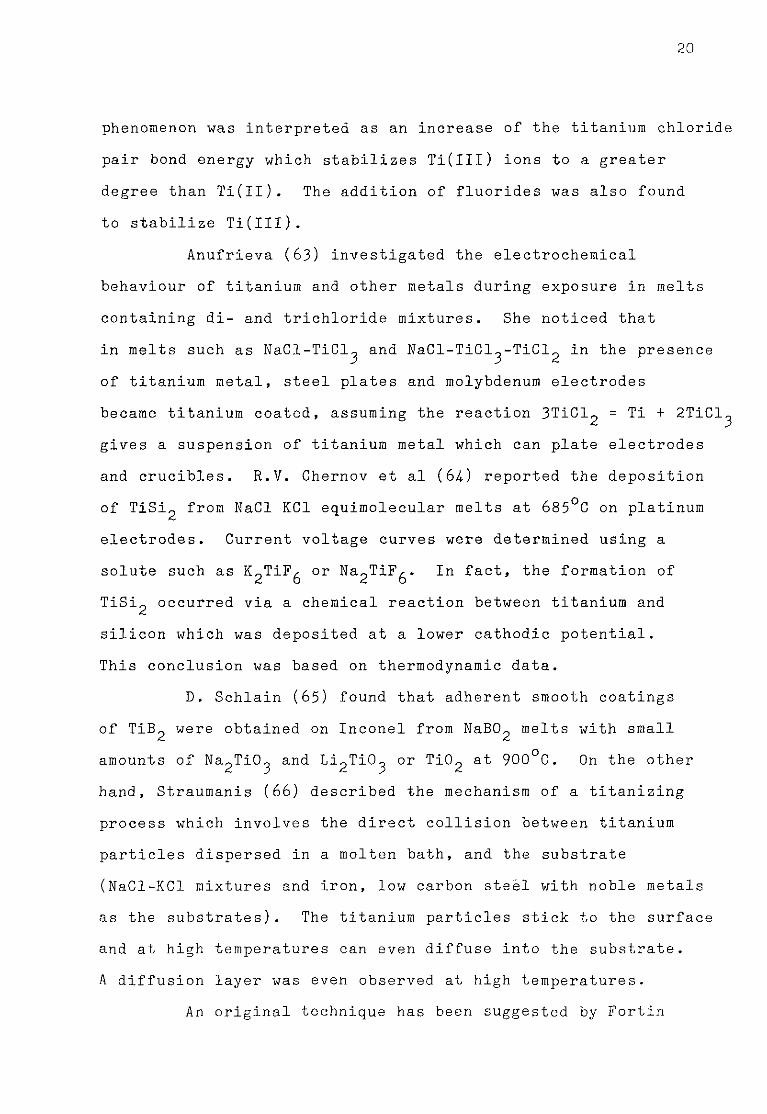
phenomenon was interpreted as an increase of the titanium chloride pair bond energy which stabilizes Ti(IIl) ions to a greater degree than Ti(ll). The addition of fluorides was also found to stabilize Ti(IIl).
Anufrieva (63) investigated the electrochemical behaviour of titanium and other metals during exposure in melts containing di- and trichloride mixtures. She noticed that in melts such as NaCl-TiCl^ and NaCl-TiCl^-TiCl^ in the presence of titanium metal, steel plates and molybdenum electrodes became titanium coated, assuming the reaction 3TiCl2 = Ti + 2TiCl^ gives a suspension of titanium metal which can plate electrodes and crucibles. R.V. Chernov et al (64.) reported the deposition of TiSi^ from NaCl KC1 equimolecular melts at 685°C on platinum electrodes. Current voltage curves were determined using a solute such as K^TiF^ or Na^TiF^. In fact, the formation of TiSi^ occurred via a chemical reaction between titanium and silicon which was deposited at a lower cathodic potential. This conclusion was based on thermodynamic data.
D. Schlain (65) found that adherent smooth coatings of TiB^ were obtained on Inconel from NaBO^ melts with small amounts of Na^iO^ and L^TiO^ or Ti02 at 900°C. On the other hand, Straumanis (66) described the mechanism of a titanizing process which involves the direct collision between titanium particles dispersed in a molten bath, and the substrate (NaCl-KCl mixtures and iron, low carbon steel with noble metals as the substrates). The titanium particles stick to the surface and at high temperatures can even diffuse into the substrate. A diffusion layer was even observed at high temperatures.
An original technique has been suggested by Fortin
21
et al (67). They examined the possibility of refining titanium in non isothermal cathodic conditions. The following conditions gave the best results:
melt KF (19-3 ) - Kl (80.7 W%) . anode titanium temperature of the melt 725°C to 700°C. temperature of the cathode 900°C to 950°C.
_ 2
current density 0.4 to 0.7 ACm applied voltage 2.2 to 2.5 V
The study of non isothermal conditions was theoretically described by A.N. Baraboshkin (68). He estimated the condition necessary to obtain a coherent deposit of titanium. He introduced a quantity he called f~l and showed that only negative values of (~1 led to a stable smooth surface. After a review of the
m
different cases of electrodeposition from molten salts he concluded that the condition [1 could only be attained
m
when the regime of electrolysis was non-isothermal or when an alternating current was used.
More recently, Hashimoto et al (69) (70) have related new electrolytic methods of titanium recovery. They even reported attempts to obtain the metal in its liquid state by electrolysis of various oxides in melts above or near the melting point of titanium (l600°C to 1850°C) . The best results were obtained by using TiO^ as feedstock in the ratio of 10W% in CaF- melts at 1850 C but no adequate purity of the metal has been reported owing to some carbon contamination. The same authors have also examined different melt compositions by electrolysing Ti02 in CaF^,BaF^,MgF2 then in CaF2>MgF2, CaF2,NaF, CaF2 ,MgF2 ,NaF, CaF2 ,MgF2 ,BaF2 and finally CaF2 ,MgF2,SrF^ mixtures

22
at 1300°C and 1450°C. But even in the best case, the purity of the titanium metal obtained was poor compared to commercial Ti sponge. At temperatures between 1020 and 1300°C in equimolecular CaF^.MgF^ the electrolysis of TiO^ produced either crystalline deposits or spongy coatings when the cell current or cell voltage was increased. If CaTiO^ is used, the deposit was found to be only of the sponge type.
Tokumoto et al (71) advanced the possibility of electroplating stainless steel cathodes from chloride melts at temperatures ranging from 4-00 to 500°C. Smooth films of titanium were obtained with a thickness of up to 0.5mm.
A process for a continuous production of titanium has been proposed by Nardin et al (72). They overcome the problem of the existence of different oxidation states of titanium by controlling the amount of TiCl^ and TiGl2 present in the melt using a prereduction of TiCl. and keeping a tight control on the temperature and consequently on the disproportionate reaction of TiCl^. The titanium obtained was a massive, dendritic, very pure metal. The main disadvantage of this process is the need to use a diaphragm to separate the anodic compartment from the rest of the cell. This diaphragm is rapidly rendered ineffective because of the deposition of conductive materials on it.
Several attempts to find a proper parameter in order to quantify the electrodeposition of refractory metal have been reported. In 1965, Mellors and Senderoff (73) in studying this field of interest postulated that the polarizing power of the solvent cation could play an important part in the stability of complexes and therefore could intervene during the reduction

23
mechanisms. They introduced a quantity they called the molar
dissociation coefficient for the solvent
V Z -M = 4- n. — Q 1 l r. 3
I
where: n^ = ionic fraction of metal cation
Z^ = valency
r. = ionic radius L
They defined the parameter used to quantify the overall stability 2 of the complex M —~ (Z and r referring to the solute). An R
increase of the value of M would result in a decrease in the
stability of the solute complex. They examined the reduction
of tantalum and niobium from NaF KF LiF mixtures where the
parameter had a value of 35-9 and 25-4 respectively. They
obtained coherent deposit of Ta and Nb. 2 In the case of zirconium with a value of M = 19.3» R
if the deposit was still coherent the process seemed to be more
difficult. They concluded that 19.3 was the critical value
of the parameter in order to obtain a coherent deposit in
molten fluorides. Applying this conclusion to the deposition
of titanium from a suitable melt leading to the value of 19.5
they could not get very good titanium deposits.
-Two main arguments arise from this theory. Firstly,
they did not take into consideration the fact that the electrode
potentials, in the case of the deposition of zirconium and
titanium, are close to the reduction of alkali metal cations,
and secondly, the value of the parameter in the case of titanium
was calculated on the basis of divalent titanium complexes. The
proximity of the reduction of the solvent may have a very strong

2 4
influence on the type of deposit, as will be emphasized in the following chapters, and recent studies on the electrochemical reduction of titanium complexes in molten fluorides (75) showed no evidence for the existence of divalent titanium species. The
final reduction seems to involve trivalent complexes only, 2 leading to a value of M — m u c h greater than that calculated r
by Mellors and Senderoff. This indicates strongly that this concept of molecular dissociation coefficient cannot be dissociated from kinetic considerations.

25
1.2. The Aluminium-Cryolite System
1.2.1. The history of aluminium: the early days to the actual production. Around 1750 A.L. Lavoisier believed that alumina was an
oxide of an unknown metal and admitted that known reducing agents were not strong enough to overcome "its affinity to oxygen". The first partially successful production of aluminium was made by H. Darcy in 1808. He obtained an iron aluminium alloy by an electrothermic process and called this new alloy aluminium. One has to wait till 1854- to be able to mention the technical production of aluminium when H. Saint Claire Deville obtained significant quantities of the metal by reducing aluminium chloride with liquid sodium. He even produced the first batch of electrolytic aluminium by electrolysing chloroaluminates but the cost of the entire operation was such that at the time his preference went to the sodium route.
The first plant using sodium as a reducing agent was in Javel near Paris and later transferred to Rouen. At the end of 1856 the price of 1kg of metal was 300 gold francs. In the meantime, other methods for the production of aluminium were continuously being sought. The use of bauxite was introduced to prepare the chloroaluminate and in 1859 Percy and Dick in England suggested the utilization of cryolite as a starting material. Processes involving magnesium as reducing agent have even been envisaged.
In 1878 Paul Louis Tousaint Heroult, after reading a book published by Deville, became interested in aluminium. The same book aroused the interest of a young American Charles Martin

26
Hall and their two careers were to run parallel up to their virtually simultaneous discovery of the famous Heroult Hall process. But in the beginning, the discovery of cryolite as a suitable bath for electrolytic preparation of aluminium had been made by Deville; he even suggested that alumina should be used to replenish the electrolyte. An empirical study made by Heroult led him almost by chance to the conclusion that alumina should be added to cryolite in order to achieve a successful electrolysis. On the contrary, Hall's method was more scientific. He was convinced that alumina was the raw material to start with and that the only problem was to find a suitable solvent because of its high melting point. He finally found that Greenland cryolite responded to the require-ments .
Etymologically speaking, one could believe that cryolite gained its name from the fact that it has a rather low melting point compared to that of alumina, but the name of cryolite was attributed to the Greenland ore because of its appearance which is indeed icelike.
In addition the dynamo, which was invented in 1867, was employed in 1880 in numerous industrial processes and was to be of great help in the starting of the aluminium industry. Consequently, on the 23rd April 1886 and the 9th July of the same year, Heroult and Hall respectively applied for the registration of a patent concerning the electrolytic production of aluminium.
Very surprisingly, the production process employed then has remained unchanged for almost a century, disregarding of course improvement of detail and progress in terms of economic

27
aspects. Few attempts to supplant this process have been tried
(direct reduction of alumina by carbon) but the production costs and carbon contamination owing to the high temperature of operation could not compete with the conventional electrolysis.
A hundred years of operation have not been enough to understand fully certain aspects of the process. For instance, the mechanisms and the species involved during the dissolution of alumina are still unknown. Above all, the main doubt still lies in the hypothetical secondary deposition of aluminium. No decisive arguments on the subject have been proposed among the numerous publications. The actual tendency is in favour of a primary deposition of the metal and the following chapters will shed further light on this particular topic. Besides, as the technology associated with the aluminium-cryolite system is rather well established and readily available, the possibility of producing titanium electrolytically from a similar melt sounds very interesting and economical with respect to the Kroll process.
1.2.2. The cathodic process during the reduction of fluoroaluminates in cryolite.
The sodium species, as will be emphasized in the next section, present as free ions and being the main current carrier, (76) have led many authors to assume that sodium was the primary discharged product at the cathode. While all the kinetic aspects of the problem have still not been clarified, it seems that both on thermodynamic and experimental considerations the aluminium is the primary product of the cathodic process.

28
As early as 1938, Yander and Hermann (77) reported
that the reaction 3NaF + Al = 3Na (g) + AlF^ was displaced to
the left except in very NaF rich melts. In potential decay
studies with polarized platinum electrodes, Kubik et al (78)
showed that the difference between the potential steps
attributed to aluminium and sodium was of the order of 220mV.
In later works (79) (80) (81) (82) sodium was found to be even
more electronegative with respect of Al in cryolite. The
activity of sodium was measured in sodium alloys in contact
with the cryolitic mixtures and aluminium. The potential
difference could then be calculated by RT a
A S = Lo Na
Na where
Na represents the activity of
the sodium at 1 atm pressure referred to the liquid sodium as
standard state. Using a lead sodium alloy those authors found
an activity of the sodium ranging from 0.025 to 0.056 at 1000°C
in cryolite giving a potential difference of -250mV to -270mV vis
a vis the aluminium metal.
Yoshida and Dewing (83) studied the emf of the cell
Na^AlF,
Al '3
Al^O^ saturated
AlF^-NaF
Alo0oSat
Al
2 3 junction
by varying "the ^ ^ ratio in the range of 0.5 to 4- similarly
to Sag et al (84).
On the AlF^ rich side, the emfs were largely positive
while at CR = 4- the emf was 120mV expressed by the expression: 3
RT 3F Log
A1F 3 (AIF3) r e f
NaF
(NaF) ref
29
For the NaF rich melts the maximum value of E should
approach the potential difference between the discharge of
aluminium and sodium in cryolite. These latter authors proposed
a value of 250mV which is in good agreement with previous data.
From these considerations, it appears reasonable to assume a
value of roughly 250mV for the potential difference between the
equilibrium deposition of pure sodium and aluminium respectively
in cryolite at 1000°C.
Favouring the primary deposition of aluminium, it seems
relevant now to examine the kinetics of the deposition and its
mechanisms.
Accurate overvoltage measurements in industrial cells
are difficult owing to magnetic convections inside the melt and
the m e t a l . N o n e t h e l e s s , Thonstad (85) published data obtained
from measurements in industrial baths as well as from laboratory
experiments. His conclusions were that, in both cases, the
observed cathodic overvoltage on aluminium in molten cryolite
could be treated as a diffusion overvoltage, the charge transfer
overvoltage playing a very small part. He reported a cathodic 2
overvoltage of -0.2V at lAcm in alumina-saturated cryolite.
Actually, the discharge can involve one step
Al 3 + + 3e =' (Al)
or can occur via different mechanisms, introducing subvalent + 2 +
species like Al , Al (86), and any scheme envisaged then may
be preceded by a dissociation of the complex or may proceed
directly. The electrolyte near the cathode, because of the
migration of the sodium cations, becomes highly enriched in
NaF and if a kinetic step retards the deposition of aluminium
it is then possible that the sodium be primarily deposited.
30
A back reaction of the sodium on the aluminium-containing ions could follow.
Subvalent sodium was also suggested as playing a part in the kinetics of the deposition. ^a^F w a s °t,serve(^ in "the gas phase during evaporation experiments (87).
In 1955 Antipin (88), using a molybdenum electrode and steady state polarization curves, interpreted the cathodic process in terms of 4 steps representing the following reactions:
1) Al3+ + 2e * A l + 3) Al+ + 5 — Al
2) 2Na + + e • Na* 4) Na* + + e — 2Na
Kubik et al (78) studied the reduction of a platinum electrode by the potential decay technique and showed evidence for Na+, Na+2> Al+ and Al^+ species. But Piontelli et al (89) did not observe any plateaux on aluminium cathode decay curves. The same authors found (90) a charge transfer overvoltage of a few mV similarly to Thonstad (85) and considered this fact as an indication of primary deposition of aluminium. They assumed in addition that this residual overvoltage was caused by an accumulation of NaF near the cathode and that codeposition of sodium might occur as a consequent parasitic reaction. The gaseous sodium may then move into' the melt and reduce aluminate ions provoking what is called the aluminium fog.
Revazyan et al (91) confirmed the hypothesis of the over-voltage due to the enrichment of the cathodic double layer by NaF and showed that this overvoltage decreased by increasing the concentration of NaF in the melt. However, in general the exact nature of the reaction steps and the role of sodium or subvalent species are still not very clear and call for deeper investigations.
31
1.2.3. Structural species in cryolitic melts.
The first attempt to discuss the cryolite structure was made in 1924 in Arndt and Kalais (92). They proposed a complete dissociation scheme for the cryolite according to the reaction
Na3AlF6 = A1F^~ + 3Na*
The situation was not clarified before 1960 by Brynestad et al
(93) who described the dissociation mechanism of cryolite as 3-
being AlF^ = AlF^ + 2F which was confirmed by others (94). The constitution of molten cryolite was studied by
Solomons et al (95) by Raman spectroscopy. They confirmed the equilibrium suggested by Brynestad and gave a very high rate of dissociation for AlF^ (as high as 60$). More recently, Gilbert and others (96)(97) investigated the structure of NaF.AlF^ and NaF AlF^ Al^O^ mixtures by Ramaon spectroscopy at 800°C. Their
3_ results reflected an equilibrium between AlF^ , AlF^ and F . There was absolutely no evidence for the existence of AlF^ as such. The dissociation coefficient was estimated to be of the order of 0.25 for a value of 0.24 reported by Radkje in the lithium system (98). But when alumina was dissolved no clear conclusion could be obtained from the spectra. Nevertheless, it seems that for concentrations as low as 2W% species of the form A1-0-A1 are much more likely to exist than others involving only one aluminium particle. The relatively high solubility of alumina in cryolite compared to other molten salts could indicate the existence of a chemical reaction and the fact that the density of the melt decreases with the
32
addition of alumina supports this assumption. Also, the oxygen and the fluoride ions are similar in size and therefore it is reasonable to assume a possible substitution between the two, the oxygen consequently occupying the same type of sites
as the fluorides. Holm (99)» on the basis of calorimetric measurements,
concluded that AlF^ was of minor importance and considered 3-
another scheme AlF^ = AlF^ + 3F , assuming a particular role 3_
for AlF^ as the stable inner part of the complex A1F£ . Therefore, spectroscopic experiments should show a distorted octahedral field, but no evidence of such distortion has been reported in the literature.
1.2.4- The anode effect in molten fluorides at a graphite electrode.
The anode effect which occurs during the electrolysis of cryolite alumina melts is generally described as a blockage of the anode surface that inhibits the current transfer.
During the production of aluminium the cell reaction can be summarised as
- 2/3 A1203 + C = 4/3 Al + C02 (1)
In fact, the exit gas CC>2 undergoes secondary reactions and the final mixture consists mainly of CO and C02. The presence of CF^ in the mixture during an anode effect might indicate an evolution of fluorine.
From figure 1.2.1. it can be observed that the anode effect is characterized by a critical current density which is

Figure 1 . 2 . 1 Cryolite-0.5w% A 1
2° 3 -
Working electrode: Graphite microelectrode.
Reference electrode: Ni rod.
Sween rate lV/s.
34
practically a linear function of the concentration of alumina (100) . Many authors (101) (103) (104) (105) (106) have
determined critical current densities and the current voltage curves showed similar shape to figure II.1. According to Thonstad (100) the first wave at 1.5V could be attributed to the reaction
4/3 Na3AlF6 + C = 4/3 Al + CF^ + 4 NaF (2)
The standard emf for this reaction at 1500K is 2.53V (Standard state being pure liquid cryolite and sodium fluoride). By correcting this value with activity data (102) one obtains a value of approximately 2.4V and the emf for reaction (l) 1.17V.
Before 1.5V no appreciable current is observed, probably because of anodic overvoltage. It seems reasonable to assume that CF^ is formed at the beginning of the increase of the current till IV and then above qy both 00^ and CF^ are formed - the next system at 3.5V could be attributed to the reaction
l/3 Na3AlF6 = l/3 Al + NaF + §F2 (3)
The standard emf for this reaction being 4.2V. It was generally assumed that the anode effect was
initiated by a deterioration of the wetting ability of the anode so_that the anodic gas would stick to the surface insulating the anode from the electrolyte, but the new trend of thought seems to consider this gas layer formation only as a secondary phenomenon. The inititation of the anode effect is probably due to a depletion of oxygen-containing species followed consequently by the discharge of the fluoride cations.

35
1.2.5- The concept of the acid base reaction in molten salts:
The special case of the molten fluorides: for aqueous solutions Bijamsted and Lowry defined acidity and basicity in terms of reactions involving protons but in molten salts this does not hold good any more and the expression of a quantitative scale is less straightforward.
One of the most general approaches is due to Lewis (115) who envisaged the basicity of a solvent as its ability to share its electrons with an acid solute. But its application to molten salts has not been very practical and proved to be entirely qualitative.
Lux (186) and then Flood (187) suggested that acids and bases in molten salts be defined in terms of the exchange of the 0 particles. It is certainly true that the proton-based compounds disappear in molten salts to the advantage of the oxo-compounds. According to this definition an oxide acceptor is an acid and an oxide donor is a base.
The oxoacid-oxobase are defined then by the relation: oxobase = oxoacid + 0
Obviously there is great similarity between the pH measuring the activity of the proton in aqueous solution and pO as defined by p0~" = -log a(0 ~). It is important to note that this definition (like that of Br^nsted-Lowry) does not involve the solvent. On the contrary, the definition introduced by Franklin (188) and Gutmann (189) concerning non protonic solvents couples the concept of acid/base to a particular characteristic of the solvent (for example its self dissociation). More specifically, the nature of the acid-base couple may be defined by the transfer of particles between two molecular species of the solvent.
36
The definition now includes that of Brjzfnsted (i.e. if the particle is the proton) but may also involve the transfer of particles such as F~ or CI . In fluoride based melts the exchange of F defines acids or bases provided the particle is accepted or donated. Nevertheless, it has been customary to apply this concept with some success in certain restricted situations. Consequently, by assuming ideal dilute behaviour and by equating a.Q-- with the molarity of added alkali metal oxide, potential /pO ~ diagrams analogous to E/pH diagrams have been established (116). Such diagrams have been used to predict stability domains but are limited by kinetic considerations.
In 1929 Guggenheim (117) pointed out that single ion activities in molten salts cannot be defined as such. It is possible to equate &Q-- to a^a Q in a simple binary system such as LiCl-KCl but in the NaF AlF^ Al^O^ system it is
difficult to say whether a--- represents a,T n or a„ n + a, - -. J 0 ^ Na^O N a 2 (oxocomple
It has been shown (118) that the dinegative oxide ion is not present as a discrete entity in cryolitic melts. It is therefore necessary to define the meaning of acidity or basicity in a more formal way.
Flood and Forland (119)' wrote "The characteristic process of acid base reactions will then be the transfer of an oxygen ion from one state of polarization to another". Thus an acid base reaction involves the transfer of polarizable oxide ions to the acidic solute with the subsequent formation of oxy-anions species.
The oxide (-II) species only becomes stabilised when it loses a significant part of its negative charge and it achieves
37
it through its bonding interaction with constitutent cations (120). The oxide (-II) species is therefore able to exist in a wide range of states and this has been emphasised by Zambonin et al who have reported redox equilibria involving the formation of species such as super oxides (121).
In view of these arguments, it would seem interesting to investigate whether fluoride can exist in a range of states similar to oxide (-II).
In addition 0 and F are isoelectronic and tend to combine with the elements in similar fashion: they stabilise the highest oxidation numbers of the elements. For this reason, in molten halides as well as molten fluorides, the apparent absence of the solvent in the pO scales which have been published make their interpretations highly unreliable.
Since fluoride and oxide often occur together (in the manufacture of Al for instance) it is much more reasonable to envisage a competitive action of both species which can then be seen as two dependent variables.
Nonetheless, it is true that the ability of oxygen to donate negative charge is at a maximum when it exists as a free 0 uninfluenced by surrounding cations which is almost the case in pure NaF (non polarizing cations), but certainly not in cryolitic mixtures where the anions are polarized by
3 + A1 ions to form -Al-0 or -Al-O-Al- species as proposed by (97) . A way to regard this effect is to consider the oxygen atoms in Al-O-Al and in Al-0 still as 0 but influenced by
3 + A1 . The polarization of 0 results in negative charges being drawn off the ion which are therefore less able to donate negative charges to metal cations (i.e. they are less

38
able to function as Lewis bases).
1.2.6. Introduction to the present work.
Studies of the deposition of metal from molten salts systems have developed from investigations of relatively simple systems to the refractory metals in high temperature melting fused salts. Whilst the number and type of systems being studied continue to increase it would seem justified to say that the overall electrode process involved in the transfer of a metallic ion in solution to its incorporation into the metal lattice of the electrode has not in general been rigorously inve stigated.
It is noticeable on surveying the literature, that the voltammetric studies are not consistent in their description of the nature of the deposited metal. No clear indications have been reported as to whether the deposited metal is soluble or
insoluble in the electrodes. Besides, it seems that the overall reduction process of metal ions is sometimes not fully described by theoretical considerations issued from the voltammetric techniques.
In the past decade a great number of teams developed the study of electrode processes in molten salts and it is now possible to use techniques to follow fast and complex electrode reactions.
Actually, it is not possible to obtain Ti metal by the usual method of reduction of the oxides by carbon because of the formation of very stable carbides. In addition, the reduction of the dioxide (TiO-) by Na, Al, Ca or Mg seldom
39
yields a pure product (contamination by lower oxides of Ti).
Thus the reduction of TiCl^ is basically preferred and the methods including the reduction of TiCl, are based on sodium
4 or magnesium. The Titanium metal industry dates from the publication of the Kroll process in 1940. The Kroll process (magnesium reduction) is expensive because it includes the prior preparation of TiCl^ from ilmenite (FeTiO^) or rutile (TiO^) followed by fractionation of TiCl^ to remove FeCl^. Thus, the importance of a practical electrolytic route for titanium appears reinforced. Besides interest in molten fluorides stem from their importance in nuclear reactor technology and use in production of aluminium, fluorine or electrodeposition of refractory metals.
As electrodeposition from molten salts involves considerable fundamental difficulties as far as commercial practice is concerned, the knowledge of the electrodeposition mechanisms is very important. In addition, no data are available on the electrochemical behaviour of the Al/Al(III) system in molten fluoride melts. The electrochemistry of the oxyanions, particularly the oxofluorocomplexes, has become the subject of much controversy in the recent past. The stability of the oxide ion in fluoride and the very existence of related species in several systems is disputed. On the other hand, the electrochemistry of the Titanium species in molten chloride mixtures still presents unclarified aspects. For instance, the very low solubility of the Ti(ll) species in LiCl-KCl eutectic around 450°C which has been reported in certain publications, but not in others, calls for further investigation.

40
It was against this background that the present research began. Thus it was hoped that by investigating the reduction mechanisms of the aluminium species both in pure fluorides and mixed oxide/fluoride mixtures a better under-standing of the aluminium system in cryolite melts could be attained. A parallel study of the titanium systems in similar melts has been conducted in order to determine whether the production of Titanium from fluoride or cryolitic mixtures was conceivable and to elucidate the process itself.

41
CHAPTER II
Experimental procedure in molten fluorides and chlorides.
The experimental aspects of this work which are summarised below brought a certain number of difficulties arising from the necessity to operate at relatively high temperatures. The three main problems were:
(i) volatilization of solute or solvent; (ii) the need to operate under inert atmospheric
conditions to prevent the oxidation of the solvent, solute or deposited metal;
(iii) difficulties with materials capable of withstanding the operating temperatures without corrosion.
This chapter, therefore, describes general experimental procedures and technology associated with moisture or air-sensitive materials at high temperature, in order to avoid repeated descriptions of the same instrument or technique in different sections.
II.1. Experiments in molten fluorides.
II.1.1. Furnace and Controls
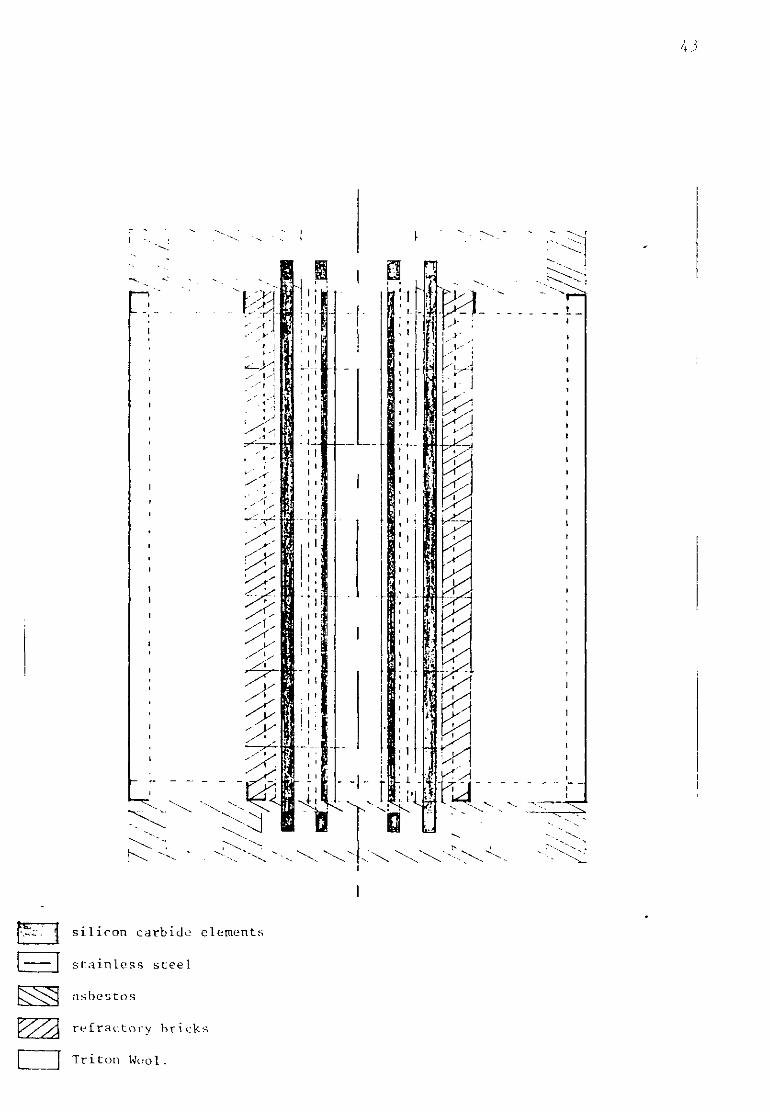
A vertical silicon carbide heated furnace as shown in figure II.1 and II.2 has been used. The furnace tube was made of alumina-based cement able to withstand temperatures of the order of 1800°C. The eight silicon carbide elements were mounted in series and parallel. The temperature was controlled

Figure II-l.
High temperature furnace.Scale 1/4
N -
J silicon carbide elements
stainless steel
asbestos
rcCraetorv bricks
Triton Wool

Figure
1-Electronics.
2-XY recorder.
3-0scilloscope.
4-Vacuum line and gas li
5-Cell.
6-Furnace.
46
by means of a P ID 25 eurotherm controller which is a solid state proportional integral differential controller. The proportional band range was variable. The controlling thermo-couple (platinum/platinum 1355 Rhodium) was sheathed in alumina and situated in the constant temperature zone of the central tube (hot zone). With that arrangement, the temperature of a hot zone of approximately 15 cm could be monitored with an accuracy of + 1°C. at 1300 K.
The furnace itself was located inside a moveable rig and a system of crank and pulleys allowed the cell tube to be raised and lowered inside the central alumina tube.
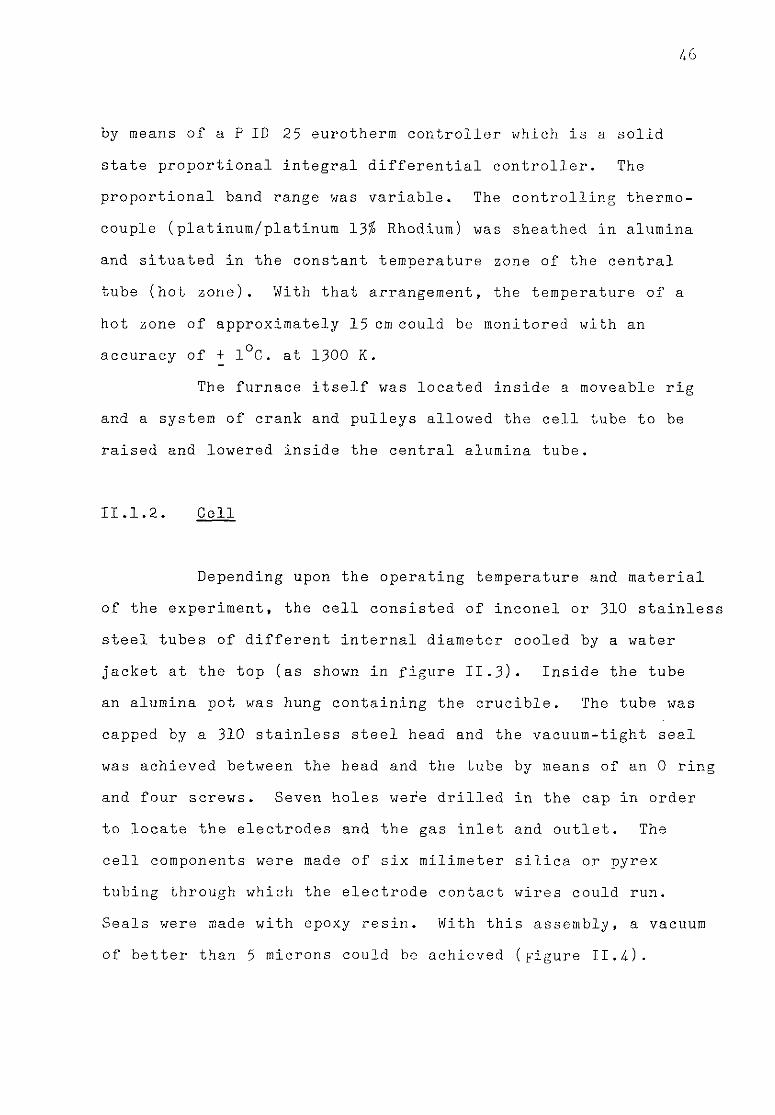
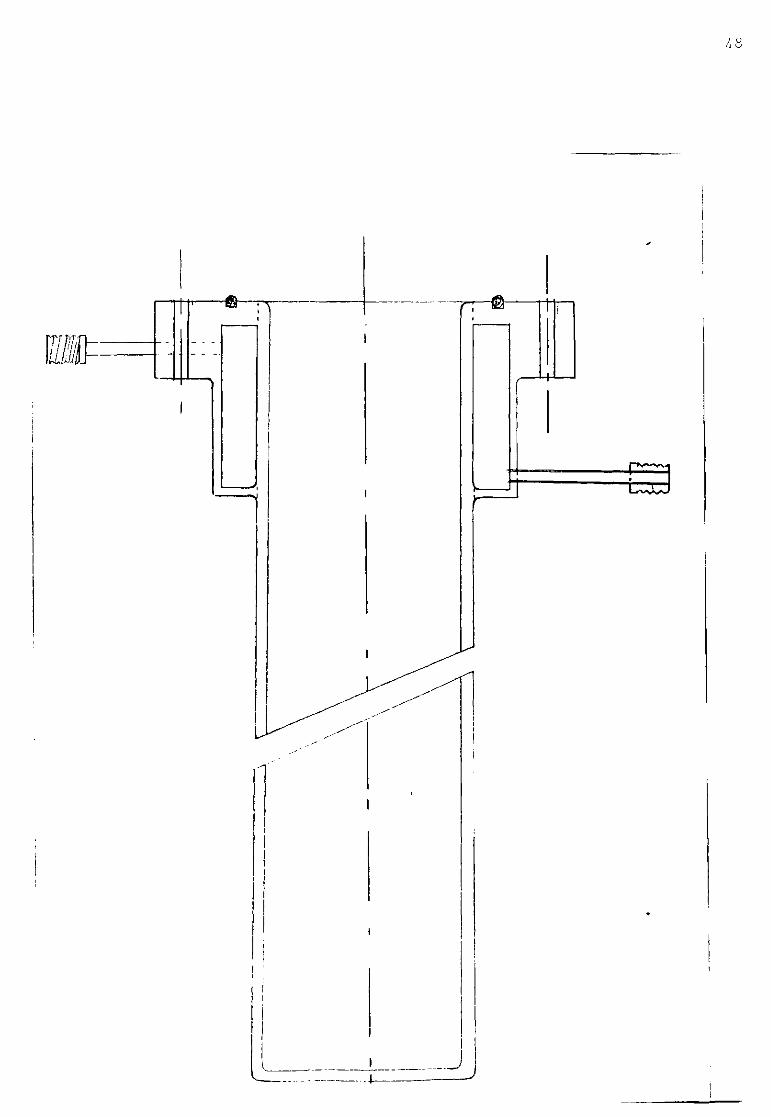
II.1.2. Cell
Depending upon the operating temperature and material of the experiment, the cell consisted of inconel or 310 stainless steel tubes of different internal diameter cooled by a water jacket at the top (as shown in figure II.3). Inside the tube an alumina pot was hung containing the crucible. The tube was capped by a 310 stainless steel head and the vacuum-tight seal was achieved between the head and the tube by means of an 0 ring and four screws. Seven holes wefe drilled in the cap in order to locate the electrodes and the gas inlet and outlet. The cell components were made of six milimeter silica or pyrex tubing through which the electrode contact wires could run. Seals were made with epoxy resin. With this assembly, a vacuum of better than 5 microns could be achieved (pigure II.4).

2 4
Figure II-3.
Cell tube.Scale 3/4.
/ "w a u

Figure II - -1.
1-Electrodes.
2-Gas inlet.
3-Gas outlet.
4-Water cooling inlet.
5-Water jacket.
6-Water cooling outlet.
7-Furnace.
51
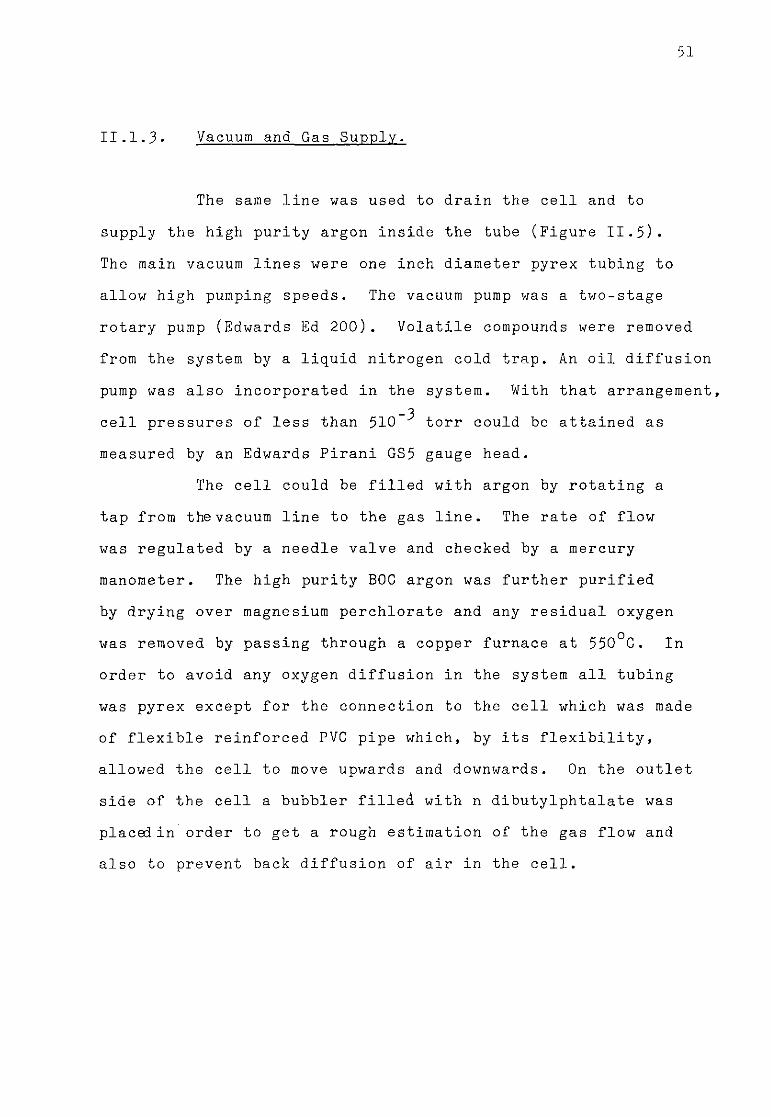
II.1.3. Vacuum and Gas Supply.
The same line was used to drain the cell and to
supply the high purity argon inside the tube (Figure II.5). The main vacuum lines were one inch diameter pyrex tubing to allow high pumping speeds. The vacuum pump was a two-stage rotary pump (Edwards Ed 200) . Volatile compounds were removed from the system by a liquid nitrogen cold trap. An oil diffusion pump was also incorporated in the system. With that arrangement,
_3 cell pressures of less than 510 torr could be attained as measured by an Edwards Pirani GS5 gauge head.
The cell could be filled with argon by rotating a tap from the vacuum line to the gas line. The rate of flow was regulated by a needle valve and checked by a mercury manometer. The high purity BOC argon was further purified by drying over magnesium perchlorate and any residual oxygen was removed by passing through a copper furnace at 550°C. In order to avoid any oxygen diffusion in the system all tubing was pyrex except for the connection to the cell which was made of flexible reinforced PVC pipe which, by its flexibility, allowed the cell to move upwards and downwards. On the outlet side of the cell a bubbler filled with n dibutylphtalate was placed in order to get a rough estimation of the gas flow and also to prevent back diffusion of air in the cell.

Figure II
1-Oil diffusion pump.
2-Vacuum gauge unit.
3-Vacuum gauge head.
4-Liquid nitrogen cold trap.
5-Copper furnace.
6-Molecular sieves column.
7-Mercury manometer.
8-To vacuum pump.

54
II.1.4-. Electronic Equipment
II.1.4-.1. Chronopotentiometry
Either a hand-built chronopotentiometric unit (Figure II.6) was used or the constant current pulse was generated by a box of known resistance at the output of a Wenking PCAL 72L potentiostat coupled to a potential pulse generator PAR model 175. The oscilloscope used to record the signal was a Tektronix 564. storage oscilloscope. The time base type B67 was triggered by the PAR programmer. The curve E(t) was obtained directly on the screen of the oscilloscope by feeding a 3A8 high impedance plug with the response of the signal issuing from the electrolytic cell.
Chronopotentiograms were obtained on polaroid pictures or recorded on an XY recorder by means of a Data-Lab DL 601-DL605 transient recorder.
II.1.4-.2. Sweep Voltammetry
Figure II.6 shows the electronic arrangement for sweep cyclic voltammetry. The potential variation was programmed by the PAR described above which in turn was fed into the potentiostat. Current potential transients were recorded on a Bryans 6000 XY recorder at low sweep rate or by the Tektronix 564 storage oscilloscope at high sweep rate. A 2000 type DVM "Advanced electronics" was used to follow the potential variations.
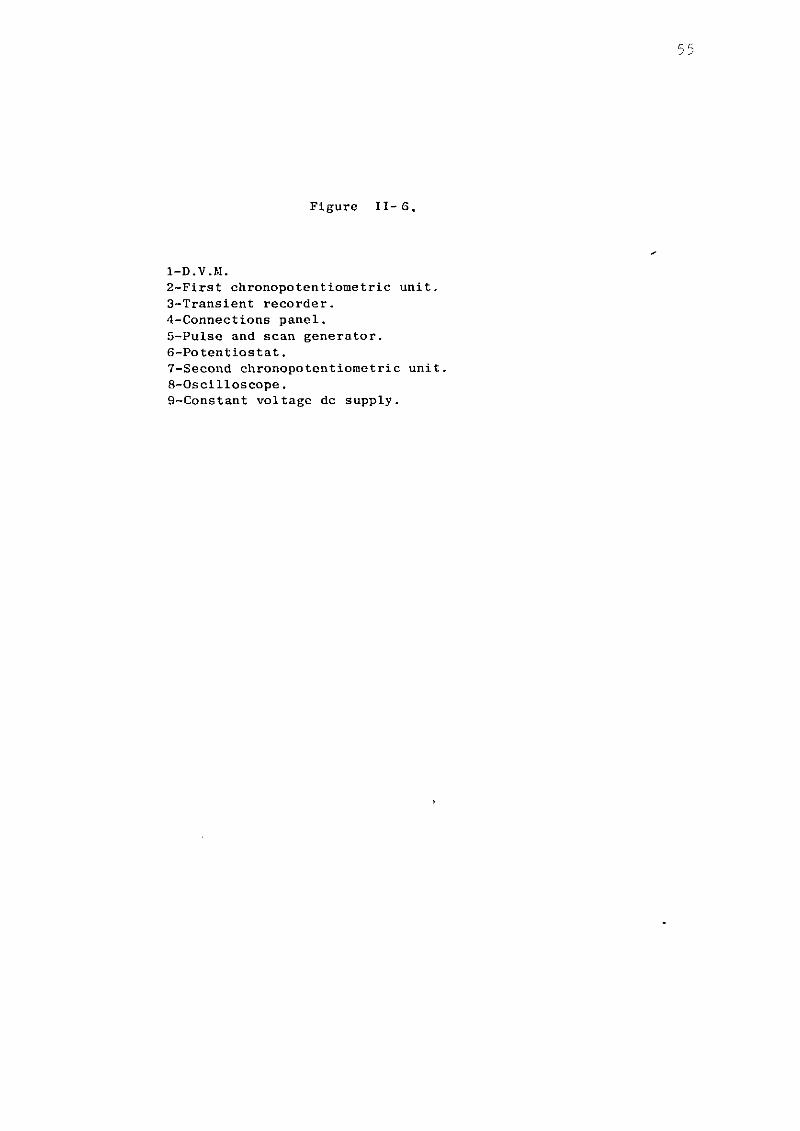
Figure I I - S .
1-D.V.M.
2-First chronopotentiometric unit.
3-Transient recorder.
4-Connections panel.
5-Pulse and scan generator.
6-Potentiostat.
7-Second chronopotentiometric unit.
8-0scilloscope.
9-Constant voltage dc supply.

57
II.1.4-3. Electrolysis
The constant voltage electrolysis was achieved by means of a PP3 twin stabilised DC supply which could cupply up to 30V with a maximum current output of 1A. For higher currents, a Solartron PSU/AS 14.12. (40V/5A) was used. The PP3 DC supply was eventually coupled to the potentiostat and the current evolution during the electrolysis was registered on a servoscribe. This arrangement was possible since the potentiostat maximum current input is 1A and therefore compatible with the DC supply.
II.1.5. Electrode
II.1.5.1. Choice of a Reference Electrode
The use of a simple nickel wire has been suggested in fluorides by Kerouanton et al (74)? the advantage of this electrode is that it avoids any separated compartments. One can also envisage the use of tungsten or platinum in similar quasi reference electrodes. In cases where these metals are noble enough to prevent any reaction with the solvent or solute if immersed in a melt containing both oxidised and reduced forms of a reversible system, they act merely as a conductor for making electrical contact, in fact there is no fundamental difference between such an electrode and a system consisting of a metal and its ions.
In theory, the perfect electrode is one which is

completely reversible and non polarisable since processes involving chemical changes and the transport of matter must keep pace with the flow of electrons and this does not occur in practice and the perfect electrode is obviously unattainable.
Far from a theoretical description used for convenience, a simple platinum (nickel or tungsten) wire dipped into a melt of any composition appeared to be the most convenient reference electrode available and if the magnitude of the reference potential is not important as long as it remains constant, such an electrode is satisfactory.
This electrode exhibits a stable potential when the reaction establishing the mixed potential of the electrodeis so slow that changes occurring in the concentrations of the reacting species, and other processes taking place in the cell do not interfere with the former reaction. In sweep voltammetry, the working electrode is continuously polarised to different potentials by a voltage applied between it and the reference electrode from an outside source. It is for this reason that the stability of the reference electrode is important.
In our case, the suitable electrode must not only be reversible and give reproducible potentials, but in addition must allow the estimation of the potential in the narrowest possible zone in order to avoid any significant uncompensated resistance which can be encountered for high current densities. The use of a simple wire dipping in the melt, if that design were convenient for the above point, does not actually permit calculation "a priori" of the difference of potential of such an electrode with a thermodynamically well defined system.

59
The system Ni(II)/Ni introduced by Senderoff et al (29) in 1965 proved suitable for electrochemical studies in molten fluorides. The utilization of the system Ni/Ni(ll) as a reference system, as introduced by Winand (107) and Bronstein et al (108), gave a further development of such an electrode by introducing a lanthanum trifluoride single crystal as a membrane. A similar electrode was used by Mammantov (75) in Flinak and gave very good results at 500°C although a slight electronic conduction has been observed. The major drawback of such electrodes is the use of boron nitride as an insulating compartment. It has indeed been reported that boron nitride was attacked by molten fluorides, especially if the binder contains boron oxide. Also cryolitic melts are known to have a corrosive action on boron nitride (109) . Evidence for the formation of aluminium nitride has been found, but no conclusive explanations have been suggested regarding the mechanism of corrosion.
A significant attack of the boron nitride has actually been observed in molten cryolitic mixtures at 1300K. The surface of the boron nitride sheath was covered by a film of aluminium nitride as well as sodium boron nitride Na B N ^
>
characterized by X-Ray analysis. The sodium boron nitride is assumed to be an intercalation compound (113) and is a dark grey colour. In order to improve the design of a suitable reference electrode compartment a few other materials were tried.
The difficulty lies not only in the choice of the material for the container but also in the design of a good ionic junction between the melt and the compartment.
60
Porous silicon nitride sheaths (20 mesh) have been tried in order to overcome this problem inherent to conduction, but unfortunately this material is rapidly dissolved by cryolitic melts as well as pure sodium fluoride.
Lime-zirconia containers proved to be satisfactory for up to 4 hours in sodium fluoride but did not last more than 30 minutes in cryolite melts, even saturated with oxides. When used in sodium fluoride the conduction was assured through a sodium fluoride or nickel fluoride doped boron nitride pellet inserted at the bottom of the sheath or in its side. The composition of the hot pressed pellet was 5W$ NaF or 2 to 3W$ NiF2. The best results were obtained with sodium fluoride additions.
The utilization of a graphite container as described by figure II.7 has also been envisaged. It is clear that the essential solid phase (Ni) must be present in adequate amounts and the proper ion constituent (Ni(ll)) must be contained in the compartment at sufficiently high concentrations.
Indeed it would be naive to expect the Nernst equation for the reversible potential of the system Ni/Ni(II), namely
a(Ni(n))
to hold for an indefinitely decreasing activity of the nickel ions. If that concentration tends to zero the electrode will sooner or later become unable to provide a stable potential. Then, under the usual conditions the potential will become indefinite, not so much controlled by as at the mercy of, dissolved oxygen, oxide and such other impurities the solution may contain.
E = Eo + | | Log

Figure II-7.
Reference electrode.
Graphite sheath.
Nickel electrode.
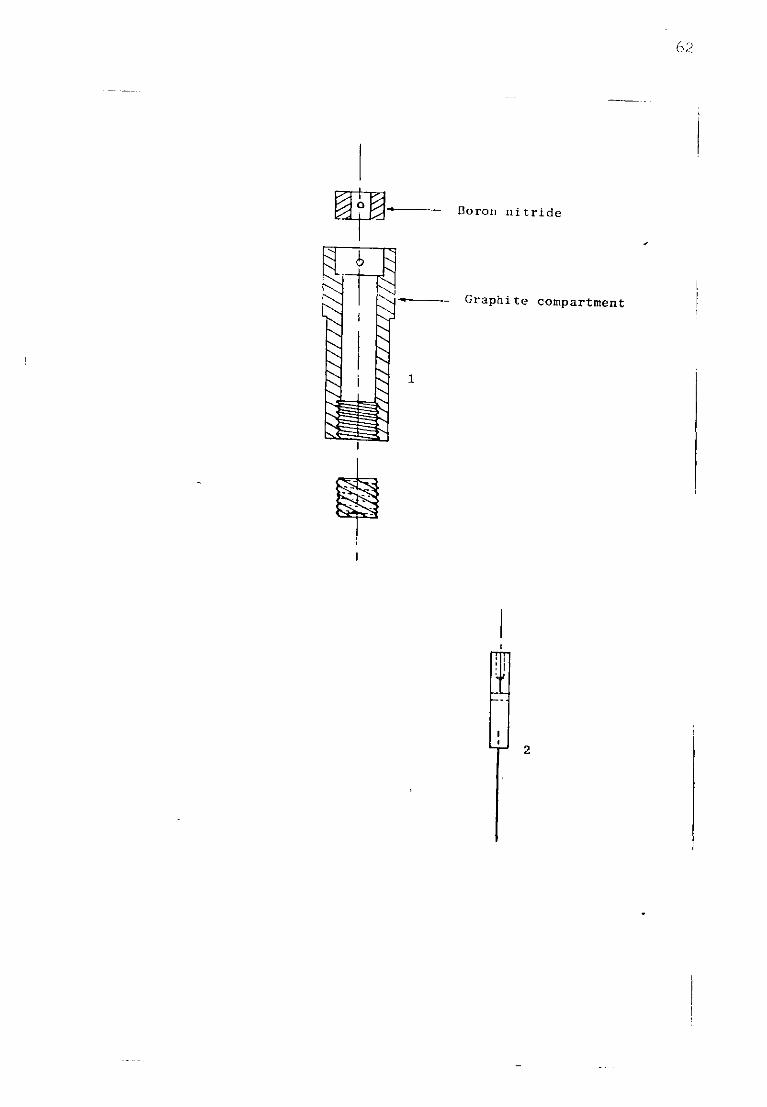
Boron nitride
Graphite compartment

t ) 3
Such a nickel reference system has been used in the present study and was checked by a simple experiment which consisted of measuring the potential function of time between two electrodes containing different Ni(ll) concentrations. The figure II.8 shows the result and limits the stability of the electrode to 2 hours. In addition, significant shifts and inconsistencies have been noticed in some experiments, probably owing to graphite powder contamination, which led the electrode to act as a graphite quasi reference electrode.
Therefore boron nitride containers, even if showing major disadvantages, have been generally preferred. The ionic contact with the melt was established by means of a doped pellet as described previously or by a lanthanum trifluoride single crystal (75) assimilated to an ionic membrane (conduction by F~ ions) (figure II.9). The single crystal showed good corrosion resistance in very pure melts but its use in aluminium-containing mixtures proved to be disastrous. The crystal certainly dissolved very rapidly.
It must be emphasised that the system Ni/Ni(ll) in molten sodium fluoride at 1300K, even if it is convenient as far as the requirements of a reference system, are concerned presents a characteristic behaviour in melts containing traces of oxides. It has been reported (110) that nickel behaves as if it were covered by a layer of nickel oxide in the presence of oxides. This induces a difference in reference potential between the redox couple Ni/Ni(ll) in fluorides and Ni/Ni(ll) in oxides. The reduction of potassium at 800°C in NaF KF mixtures has been recorded at a potential as anodic as -600mV. Similar observations were made in NaF at 1300K, when the
o u
Figure II-8.
E= F(t),between two Ni/Ni(II) reference electrodes.
r i c • T-. io"2m. el NiF„ 2 - 3
r o c . 10 m. e2 N i F 9
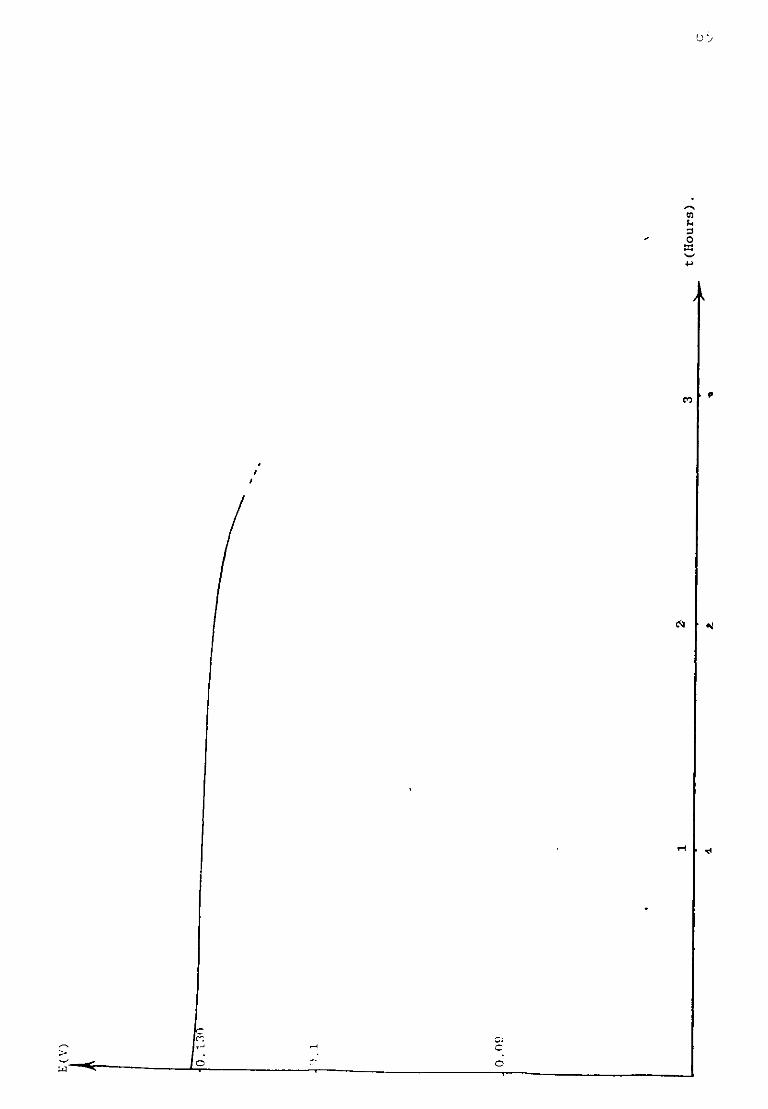
o5
en 3 o x +->
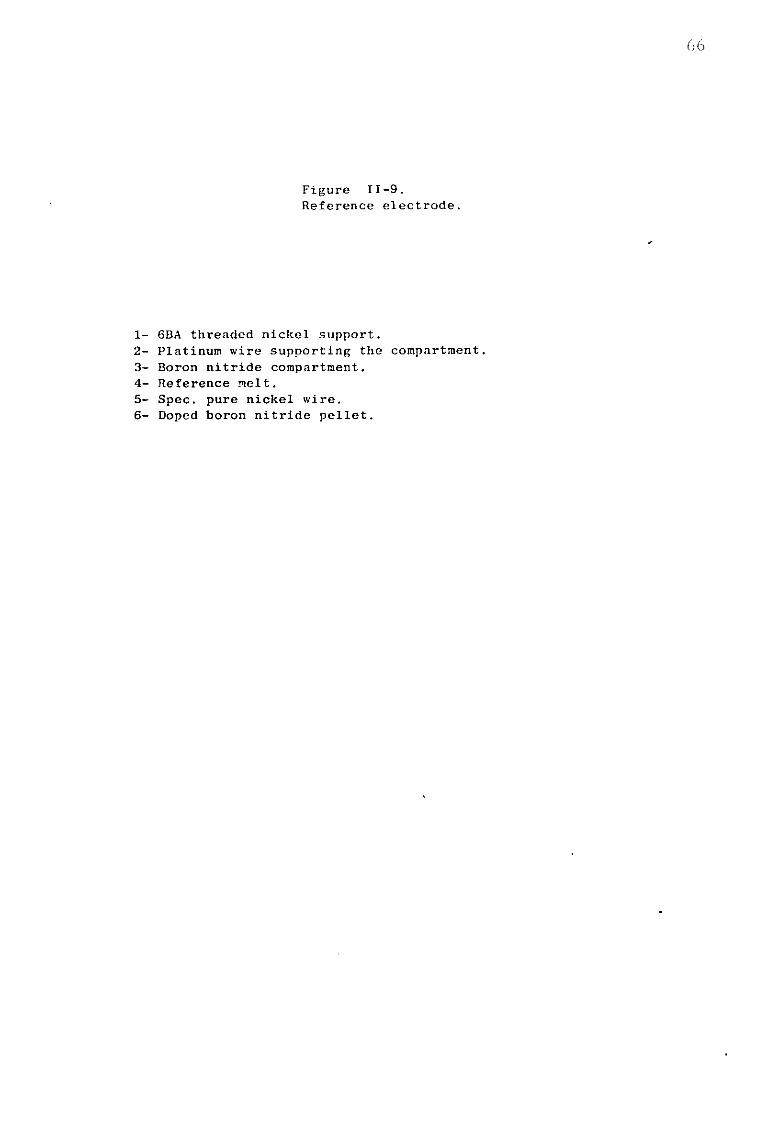
66
Figure II-9.
Reference electrode.
1- 6BA threaded nickel support.
2- Platinum wire supporting the compartment.
3- Boron nitride compartment.
4- Reference melt.
5- Spec, pure nickel wire.
6- Doped boron nitride pellet.
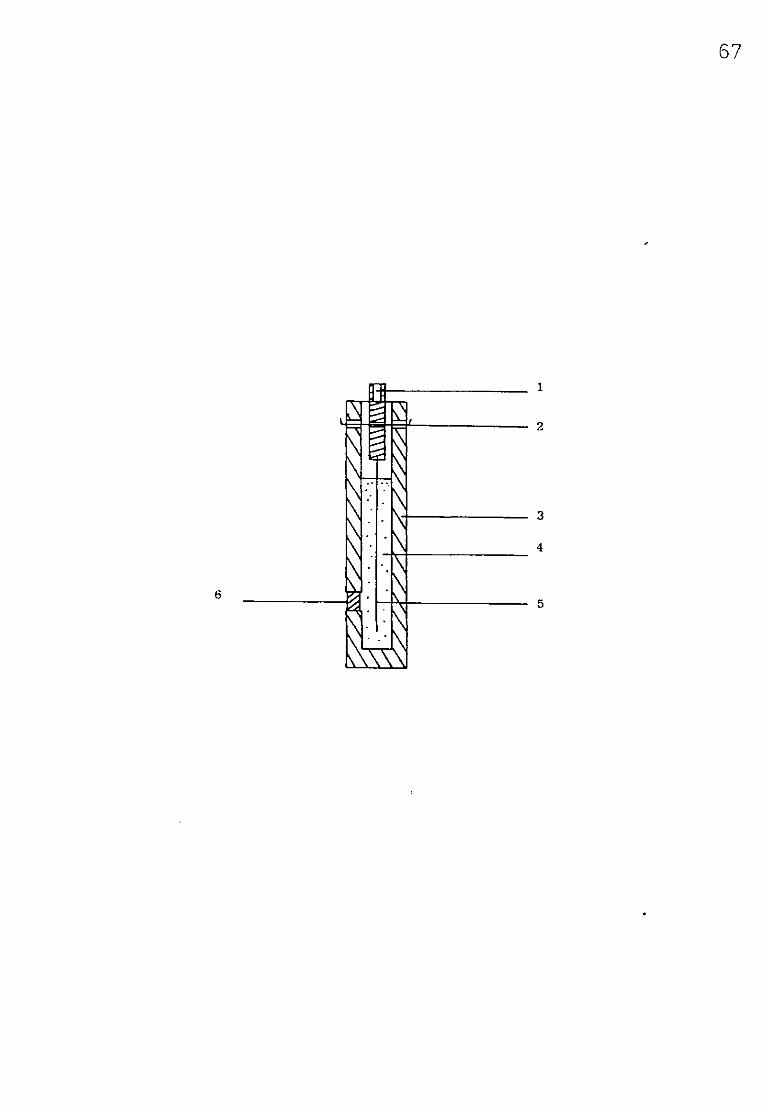
N
t3
I \ N

68
reference melt was not carefully purified. The figure 11.10
shows the reduction of the alkali cations occurring around
-750mV. It is still not clearly established whether the layer
corresponds to NiO or to a higher valency state of nickel
(ni30 ).
A semi-conducting behaviour as well as non
stoichiometric nickel oxide have been envisaged to explain
this phenomenon. In view of the latter argument, it was
necessary to use properly purified reference mixtures and to
design a lasting insulation especially in oxide-containing melts.
II.1.5.2. Working and Counter Electrode (Figure II.11)
Working electrodes were cut from 0.125 /m thick
platinum sheets and spot-welded on to platinum leads. Areas
were measured geometrically. Allowance was made for thermal - 6 o
expansion using the expansion coefficient of 9.610 t ( C)
given by Smithells (112).
When aluminium pools were used in emf measurements,
the contact with the aluminium was achieved by means of a
tungsten wire insulated in a boron nitride sheath.
Platinum flag electrodes of rather large surface
areas, and vitreous carbon have been chiefly considered as
counter electrodes. All these electrodes were connected to
the potentiostat by stainless steel rods (Figure 11.12).
II.1.6. Crucibles
The appendix 5 gives a review of different experiments
performed in sodium fluoride to evidence the interaction of
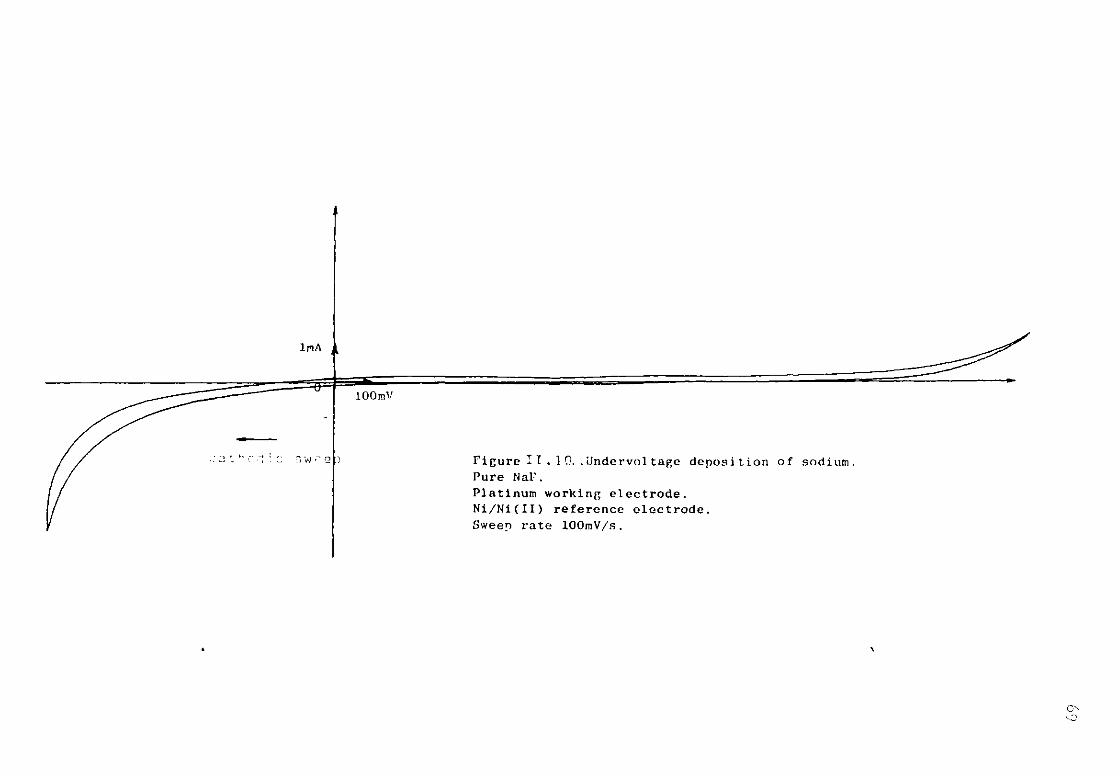
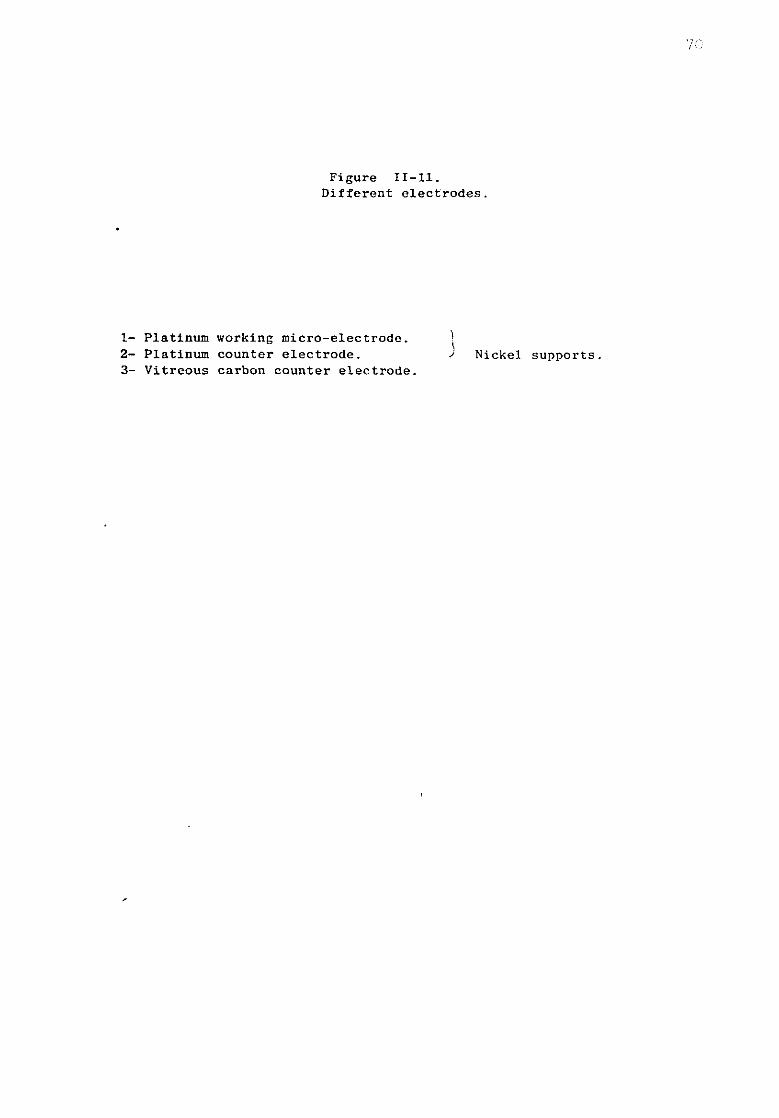
7C
Figure 11-11.
Different electrodes.
1- Platinum working micro-electrode. |
2- Platinum counter electrode. > Nickel supports
3- Vitreous carbon counter electrode.
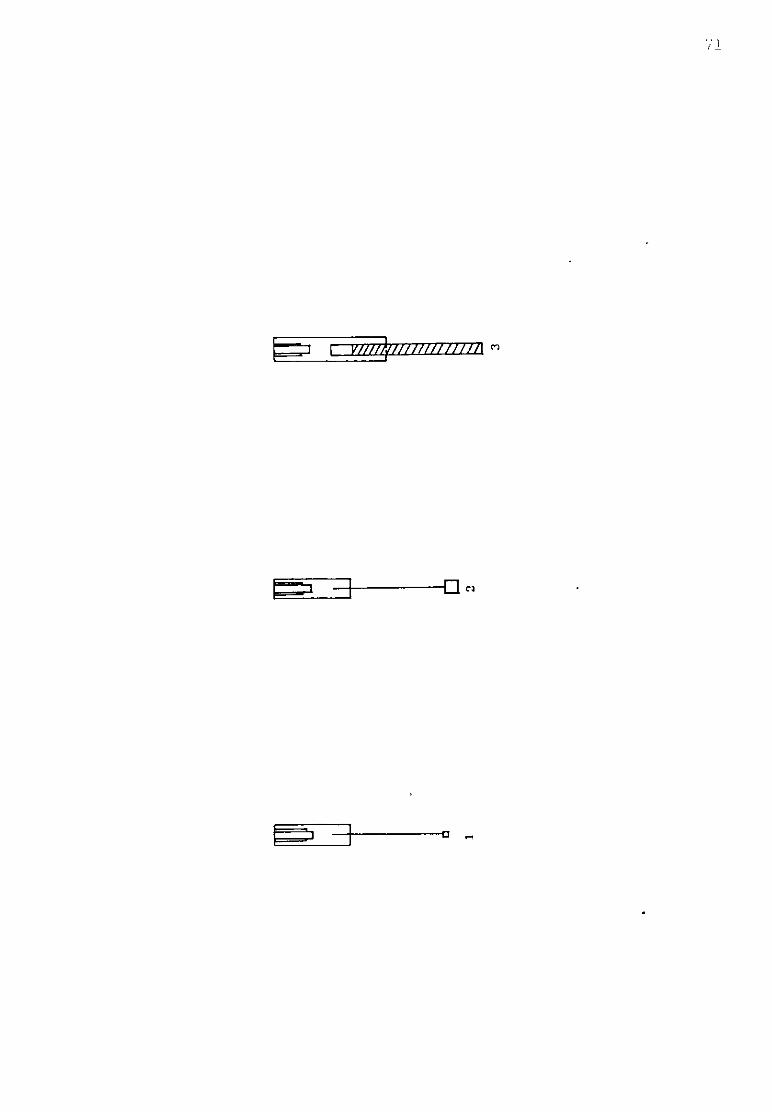
/1
c3

72
Figure 11-12.
Typical electrode support.
1- 2mm 0 stainless steel rod.
2- Pyrex or silica tubing 7mm 0 .
3- Araldite seal.
4- 6BA thread.
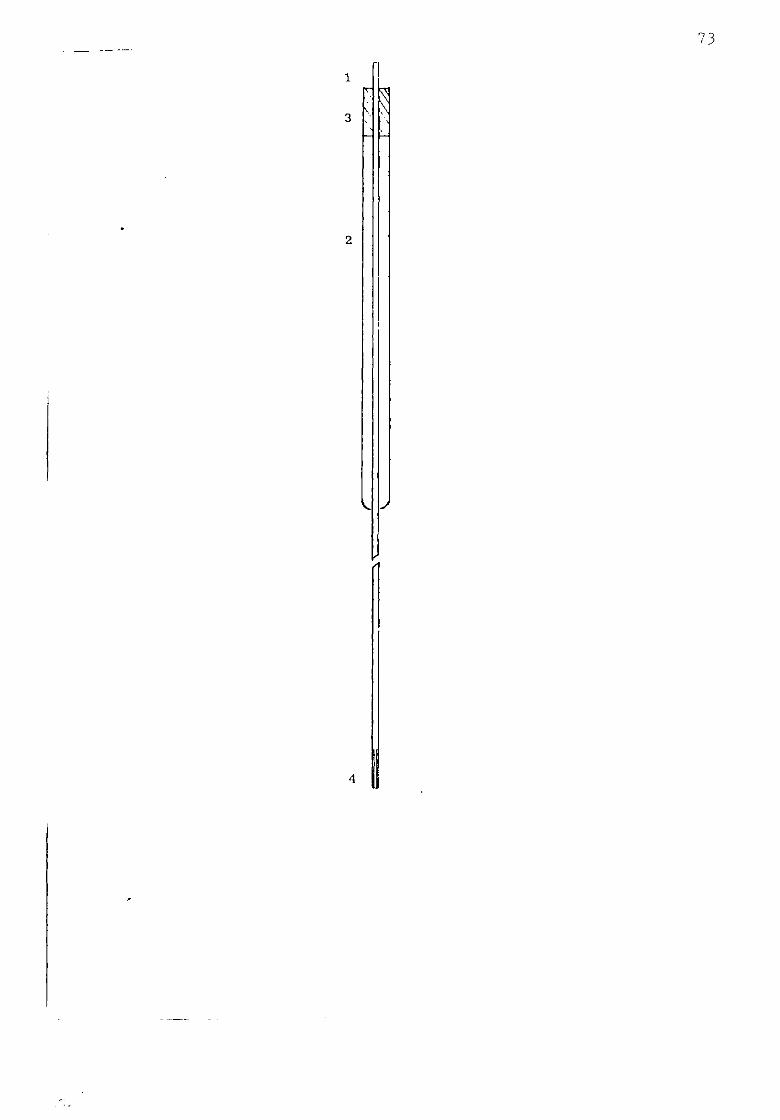
73
2
V J
4
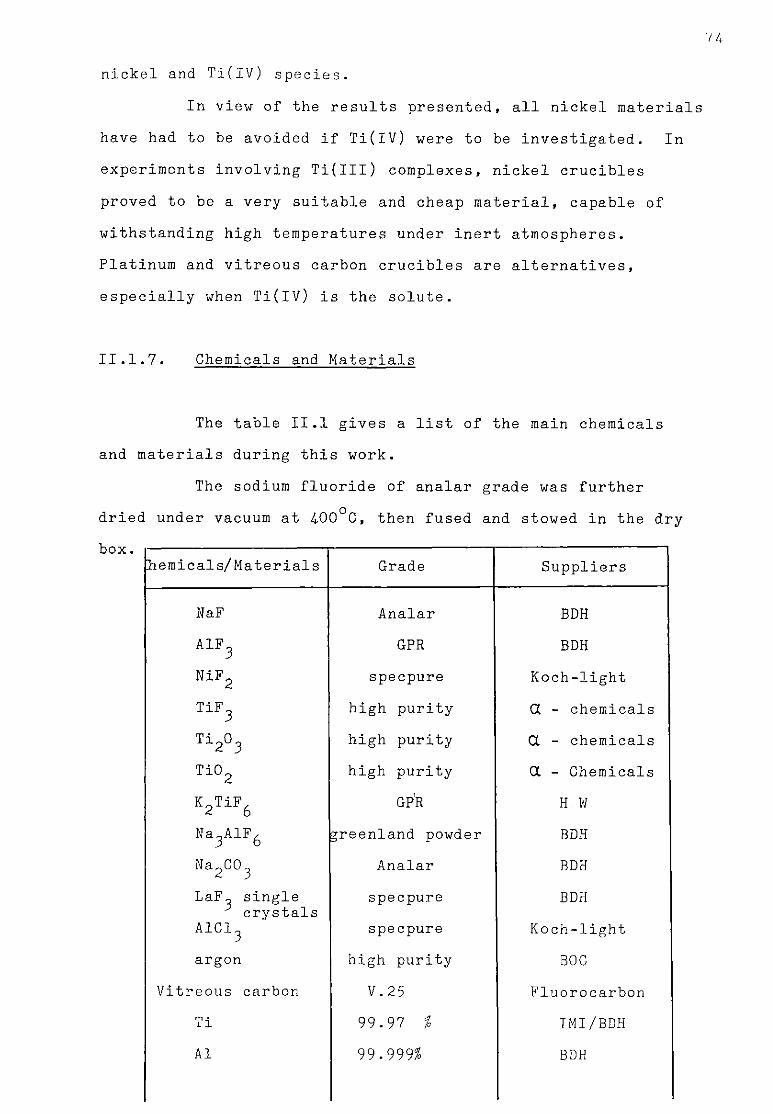
10 4
nickel and Ti(IV) species. In view of the results presented, all nickel materials
have had to be avoided if Ti(IV) were to be investigated. In experiments involving Ti(IIl) complexes, nickel crucibles proved to be a very suitable and cheap material, capable of withstanding high temperatures under inert atmospheres. Platinum and vitreous carbon crucibles are alternatives, especially when Ti(lV) is the solute.
II.1.7. Chemicals and Materials
The table II.1 gives a list of the main chemicals and materials during this work.
The sodium fluoride of analar grade was further dried under vacuum at 400°C, then fused and stowed in the dry
lieraicals/ Materials Grade Suppliers
NaF Analar BDH A I F 3 GPR BDH N I F 2 specpure Koch-light TiF^ high purity CC - chemicals Ti203 high purity Ct - chemicals Ti02 high purity CC - Chemicals
K2 T i F6 GPR H. W. Na3AlF6 greenland powder BDH Na2C03 Analar BDH LaF- single
crystals A I C I 3
specpure specpure
BDH Koch-light
argon high purity BOC
Vitreous carbon V.25 Fluorocarbon Ti 99.97 % IMI/BDH AL 99.999% BDH
The purification of the commercially available hydrated AlF^ was largely justified on the basis of its organic and inorganic impurities and two purification methods have been envisaged.
(1) The salt, contained in a vitreous carbon crucible, was dried at 150°C under partial vacuum in a silica cell. The aluminium fluoride obtained was then sublimed under vacuum at 750°C and collected on a water cooled nickel finger inside the cell as shown in figure 11.13 The purified salt was then recovered from the condenser and kept inside the dry box. As only 50g of AlF^ could be purified at a time using this technique, an alternative method was preferred.
(2) A hot and fairly concentrated solution of NH^p- HF was added to a solution of AlCl^ (111). The reaction was as follows:
AI CI 3 +3(NH^F-HF) = (NH^)3 A1F6 + 3EQ\
The precipitated (NH^)^ AlF^ was then filtered and placed in a platinum boat inside a silica tube. The cell was heated to about 200°C for about 10 hours and kept at 600°C for another 10 hours under a continuous flow of argon.
The purity of the aluminium fluoride obtained by this precipitation method was similar to that of the sublimed AlF^. A chemical analysis showed an oxide concentration of less than 0.01 in certain cases and batches of more than 150g could be obtained at a time.

7 0
V;ater outlet. I C
Silica eel1.
Water inlet
D Has inlet/outlet
Water cooled nickel finger.
Figure 1 1 . 1 3
Sublimation cell.
J
77
II.1.8. Experimental Procedure
11.1.8.1. Chronopotentiometric Measurements
Constant current pulses of varying heights were applied between the working micro electrode and the counter electrode. The change in potential between the working and reference electrodes was recorded on the oscilloscope screen or by an XY recorder by means of a Data-Lab 905 transient recorder. At the end of each cathodic pulse, the current was reversed in order to remove the reduced species from the electrode surface.
The chronopotentiograms were either photographed or analysed directly on the screen of the oscilloscope. The transition time was measured geometrically by a simple tangent construction- which gave an estimation ofT . Other geometrical constructions of transition time measurements have been reviewed by Spencer (14-4) • A derivative method has also been used especially when the chronopotentiograms were recorded on the screen of the storage oscilloscope by means of a differential plug unit, giving an accuracy which was comparable to that of the tangent construction.
11.1.8.2. Solute Additions
Titanium solute additions were made either by mixing both salts intimately prior to melting, or by pellets during theexperiment. Technologically, the addition of pellets in situ was performed using a stainless tube arriving just

78
above the molten mixture. This technique proved to be satisfactory with salts having a rather high solubility in NaF (for instance K^TiF^, or TiF^) but for oxide additions it was better to mix the solute with the salt before melting.
Though it is reasonable to attribute an ionic character to pure fluoride salts, this assumption does not hold in the case of oxides of covalent character which are likely to show a low solubility in media of ionic characteristics.
As in some cases it was necessary to vary the concentration of the solution in the course of an experiment, the additions of pellets were performed in association with a stirring of the solution. The device for pellet additions described above was then terminated by a graphite tube which could be plunged into the melt and used as an argon bubbler.
II.2. Experiments in molten chlorides
II.2.1. Furnace and temperature control:
A vertical Kanthal-wound furnace used for these experiments was of the same kind as those described by earlier workers in this laboratory (19)(151). Pulleys and counterweights allowed the furnace to be raised and lowered about the cell.
The temperature was controlled by a PID 25 Eurotherm that monitored a Pt/Pt/Rh 13$ thermocouple positioned within the central tube of the furnace. The cell temperature could be adjusted to within - one degree.

II.2.2. Cell
The cell consisted of either Pyrex or a silica envelope depending upon the working temperature, topped by a water-cooled brass head. (Figure II. 1-4). A vitreous carbon, pyrex or silica crucible was used to contain the melt and was located on a bed of glass or silica balls inside the cell as pictured in the figure II.14-.
A vacuum-tight seal was achieved between the brass head and the cell sleeve by means of an 0-ring (151).
II.2.3. Vacuum and gas supply system
Two separate vacuum and gas lines have been used for electro-chemical studies and purification purposes.
For electrochemical studies, the vacuum system consisted of a Pyrex line including an Edwards D50 rotary pump and a liquid nitrogen cold trap. Cell pressures of less than lOjlm could be achieved. The cell could be filled with high purity argon by rotating a two-way stop-cock. A mercury manometer in series gave an estimation of the pressure building up inside the line.
- HP argon was further purified by drying over magnesium perchlorate and a copper furnace, operating around 4-00°C, to remove any traces of oxygen. A bubbler filled with n dibutylphthal on the outlet of the cell provided an idea of the gas flow through the system.
The line used for the purification of batches of eutectic was designed on the same basis as above with an
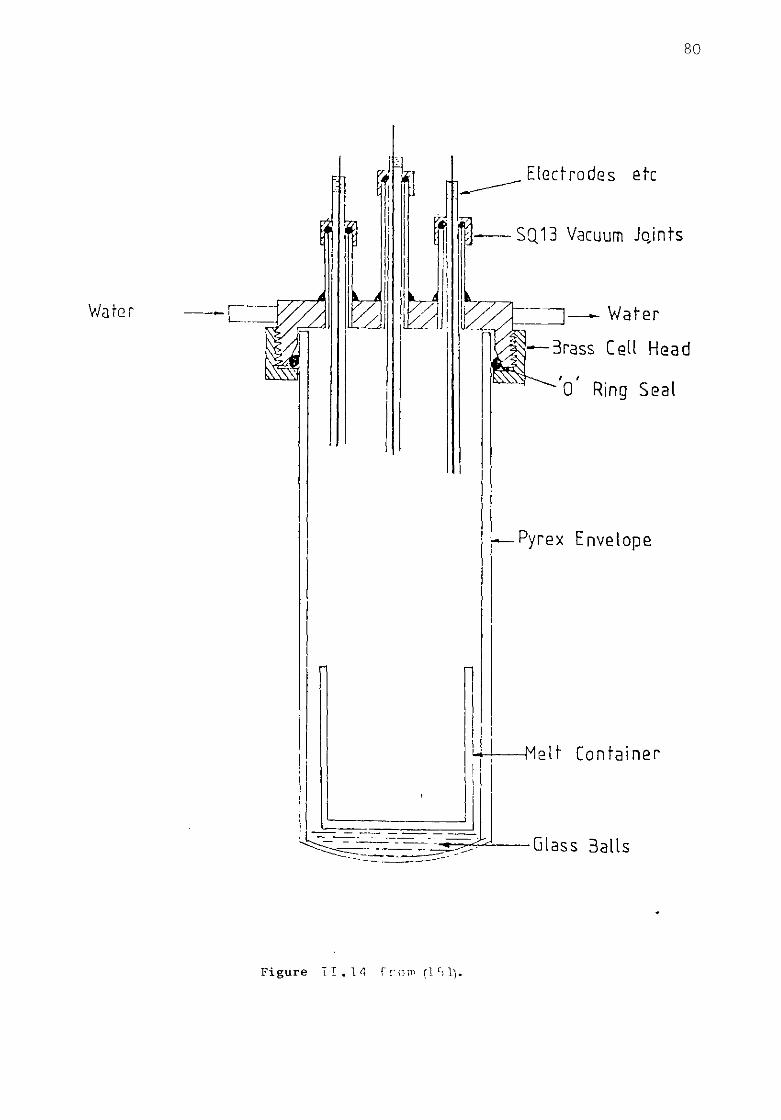
80
Electrodes etc
SQ13 Vacuum Jojnts
] — Water
3rass Cell Head
' o ' Ring Sea l
Pyrex Envelope
-Melt Conta iner
Glass Bal ls
81
additional oil diffusion pump coupled to a rotary pump capable of a greater pumping rate (usually EdwardsED 100).
Bottled anhydrous hydrogen chloride and chloride were dried by passing over activated charcoal at 500°C and magnesium perchlorate columns. (Figure 11.15 and 16).
II.2.4-. Electronic equipment
Pictures and description of the electronics used in this study have been presented in section II.1.4.
II.2.5. Electrodes
11.2.5.1. Platinum electrodes
Platinum flag electrodes were cut from 0.125 mm sheet giving areas of different values which were determined geometrically. They were spot-welded to 0.05mm diameter Pt wire which was in turn spot welded to a copper lead. Before use, the electrode was flame polished by heating in a reducing flame and washed in concentrated hychochloric acid.
11.2.5.2. Tungsten electrodes Tungsten microelectrodes were produced from 2mm
diameter rods sealed into silica glass and gave very good results during 2 or 3 runs before showing any signs of deterioration. Electrical contact with the tungsten was assured by silver-soldering a copper wire to the tungsten rod.
Figure 11.15
Purification and chlorination line
1- Kanthai furnace. 2- Fyrex cell head. 3- Gas inlet (Argon and chlorine) 4- HC1 or 01 valve.
5- Gas control panel, o- Gauge haed.
7- Gauge unit. 3- Copper furnace. 9- Molecular sieves. 10- Argon valve. 11- Cold trap. 12- 13- Furnace temperature controllers. 14- Rotary vacuum pump.
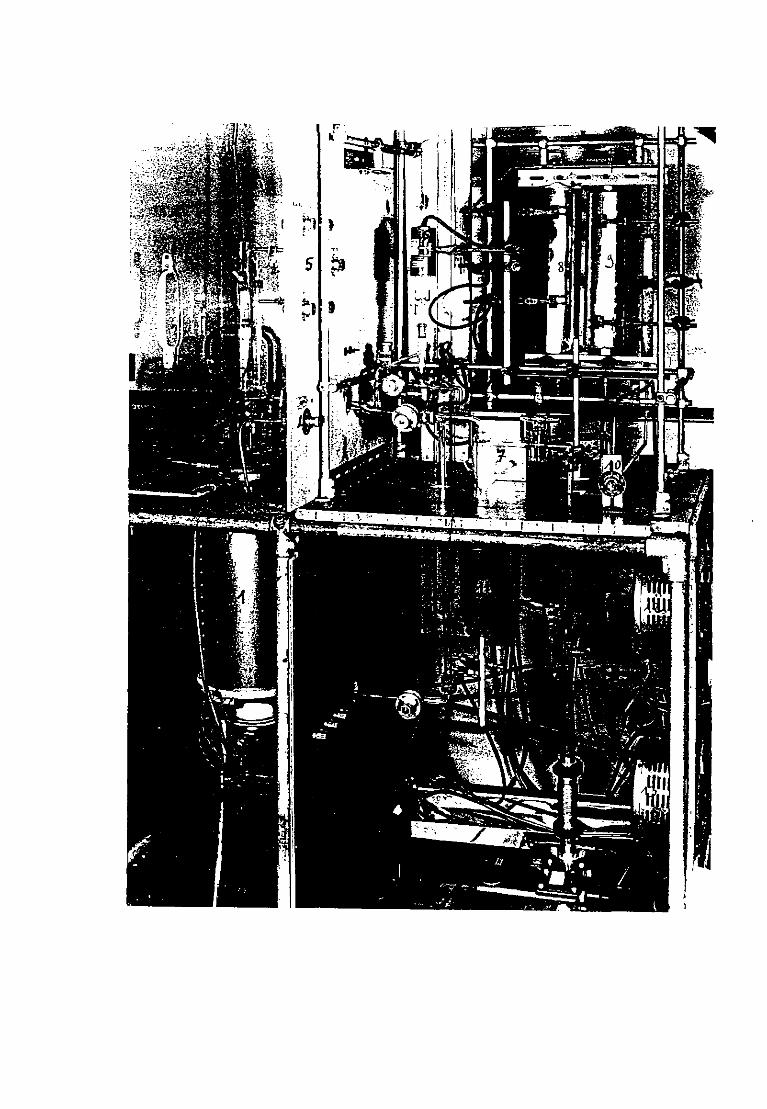

84
Figure 11.16.
Gas unit.
1- HC1 cylinder. 2- Chlorine cylinder.
5- Activated charcoal furnace. 4- Molecular sieves. 5- Gas regulation. 6- Emergency vacuum unit.
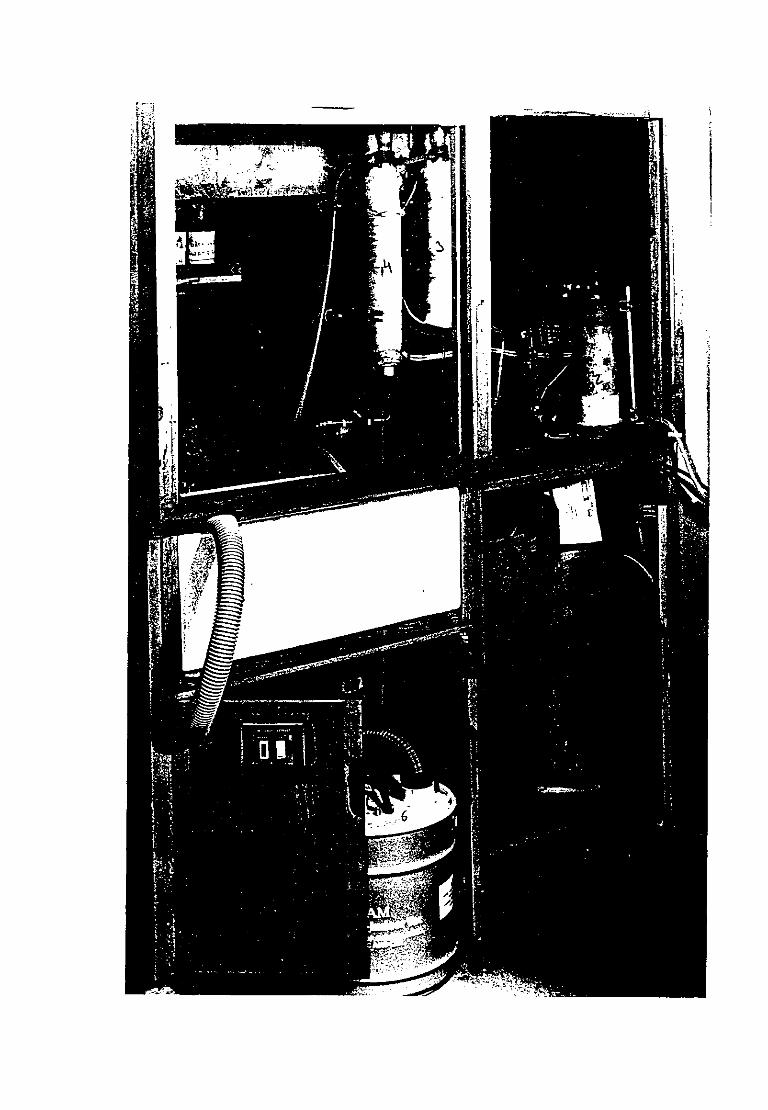

86
The electrode was subsequently highly polished to give a "mirror" surface.
II.2.5.3. Counter electrodes
Two types of counter electrodes were employed depending upon the experiment envisaged.
For electrochemical studies, such as voltammetry or chronopotentiometry, a platinum flag electrode of large area was used and constructed in the same way as described for the microelectrode.
The counter electrode for anodic dissolution consisted of a molten bismuth cathode, as shown in the figure II.17a, insulated from the solution which acted as a sink for the highly corrosive alkali metals formed during the dissolution of the anode. The contact with the liquid bismuth was made by means of a tungsten rod, of which all but the tip was sheathed with silica glass.
II. 2. 5. 4-• Reference electrodes
The silver-silver ion douple was used for the reference" electrode. A dilute solution (1M to 0.1M)of silver chloride in the solvent used for the experiment was contained in a Pyrex or silica glass bulb with a thin end. The contact with the melt was made with a silver wire, figure (II.17b). This design was first developed by Inman (152) for use in chloride melts at similar temperatures.

Figure 11.17a Figure 1 1 • 1
1-Copper lead.
2-Araldite seal.
3-Silica or Pyrex glass.
4-Platinum wire.
5-Tungsten rod.
6-Silica glass sheath.
7-Silica wool.
8-LiCl-KCl eutectic.
9-Liquid bismuth.
1-Silver w i r e .
2-Araldite seal.
3-Silica or Pyrex glass.
4-Platinum wire.
5-Silver w i r e .
6-Eutectic plus AgCl.
7-Silica or Pyrex b u l b .
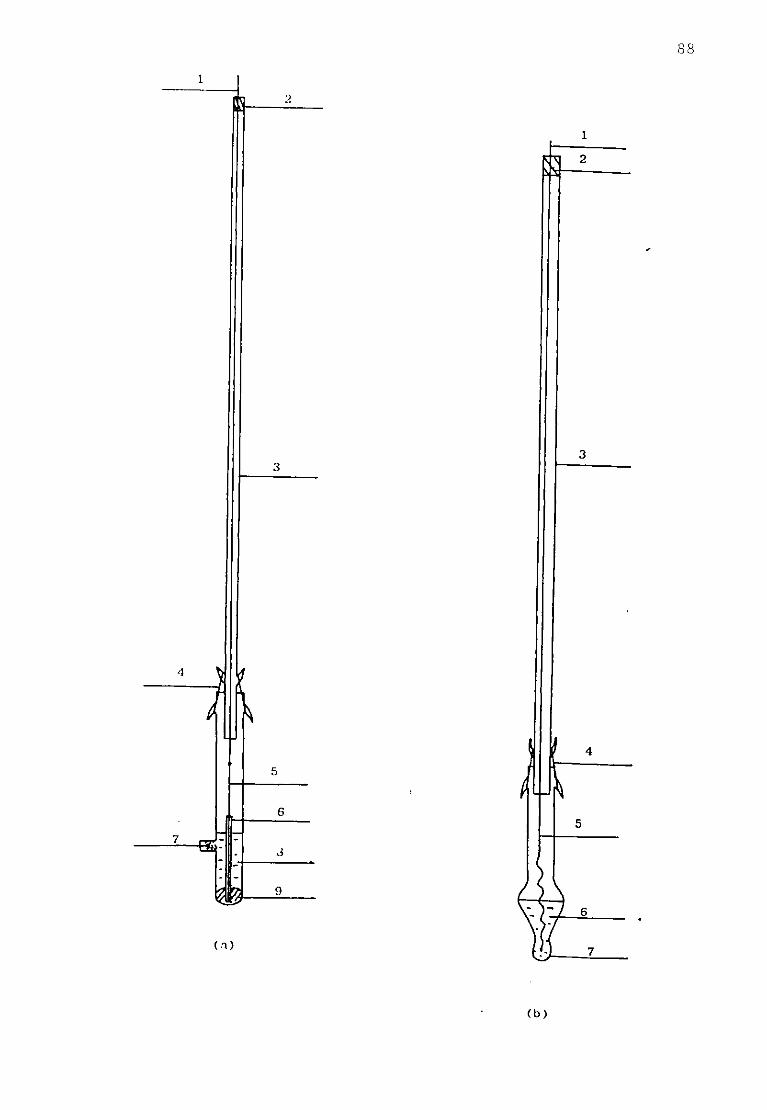
(b)
89
The silver ion solution in LiCl KC1 eutectic was prepared by dissolution of spectroscopically pure AgCl in appropriate quantities in purified LiCl KC1 eutectic.
11.2.6. Chemicals
The grade and supplier of the chemicals and materials used for these experiments are shown in table II.2.
Chemical Grade Supplier
LiCl GPR BDH Chemicals Limited KC1 Analar BDH Chemicals Limited W rod high purity BOC Murex
Pt foil & wire high purity Englehardt Argon high purity BOC TiCl. 4 GPR BDH Ti 99.97 IMI
II.2.7. Purification of the eutectic LiCl KC1
Major problems of purification arise when the solvent consists of salts which are hygroscopic like LiCl. The solubility of water in the system LiCl KC1 and the chemistry of the hydrolysis product form the major difficulties for the purification of melts based on such salts.
Different mechanisms have been suggested in several investigations for the electrochemical reduction of
90
water ( 153) (154-) (155). Depending upon the methods used in their preparation, the chloride mixtures are generally characterized by quoting the residual current at -2V (vs Pt/Pt(Il) 1M reference electrode) (62)(156).
The chloride melts require purification due to the presence of moisture and associated hydrolysis products, heavy metals and organic impurities, even if the basic constituents are of Analar grade. Thus the primary objective is to remove hydrolysis products and subsequent operations will be defined according to the degree of purity required.
A recent critical review by White (157) discusses the effectiveness of various methods which have been commonly employed during the last decade. Briefly, they present the following features:
(i) Desiccation and vacuum-drying by continuous
pumping associated with a continuous increase of the temperature,
(ii) The utilization of gaseous reagents which generally offer a good purity and can be introduced and removed easily.
The products of the hydrolysis are hydroxide and oxide and subsequently the reactions involving the gas introduced must be of the type:
0"" + 2HC1 = H20 + 2Cl"
OH" + HC1 = H20 + CI"
These reactions have been investigated extensively by Combes et al (158).
91
Maricle et al (159) reported the use of dry chlorine
to remove oxide following the reaction:
Cl2 + 0"" = h02 + 2C1*
Therefore, dried hydrogen chloride is bubbled through the melt
at IJ.50°C for a few hours, replaced by dried chlorine and finally
displaced by argon. The argon is allowed to pass through the
melt for some time in order to remove any dissolved HC1 or
chlorine.
(iii) Electrolysis
Many of the impurities of the LiCl KC1 eutectic
are electroactive and therefore it seems justified to suggest
electrolytic methods to remove most of them. The vacuum
preelectrolysis apparatus and arrangement is shown in
figure 11.18, the same experimental set up used by White (157).
All the glassware in contact with the melt is soaked in
concentrated HC1 solution for 12 to 24. hours and washed with
distilled water. Following the gaseous treatment, the electrodes
are quickly introduced (graphite anode and a tungsten or
stainless steel cathode) and a potential of approximately 2.5V
applied between them. The initial current is observed around
50mA and decreases to 15/l0mA after a few minutes, reaching
2 to 1mA over a 5 hour period. (jenerally, the electrolysis is
continued for 12 hours or more.
The choice of a suitable cathode is critical. For
instance the use of aluminium (160) can lead to a considerable
lowering of the potential of deposition of Li by alloying.
Similarly, the production of intercalation compounds with
vitreous carbon or graphite can produce the same effect (14-7).
As the impurities can be more noble than iron, a tungsten
Figure H.18 from (157) Cell for the purification of the LiCl-KCl eutectic.
A-Anode. B-Cathode. C-Breaker rod. D-Breakable bulb. E-Glass frit. F-SQ13 cap. G-Brass plate. K-To vacuum system. L-Receiver. ri-Heating element. N-B55 socket. P-Inner tube. Q-Cell head. R-O-Rings.
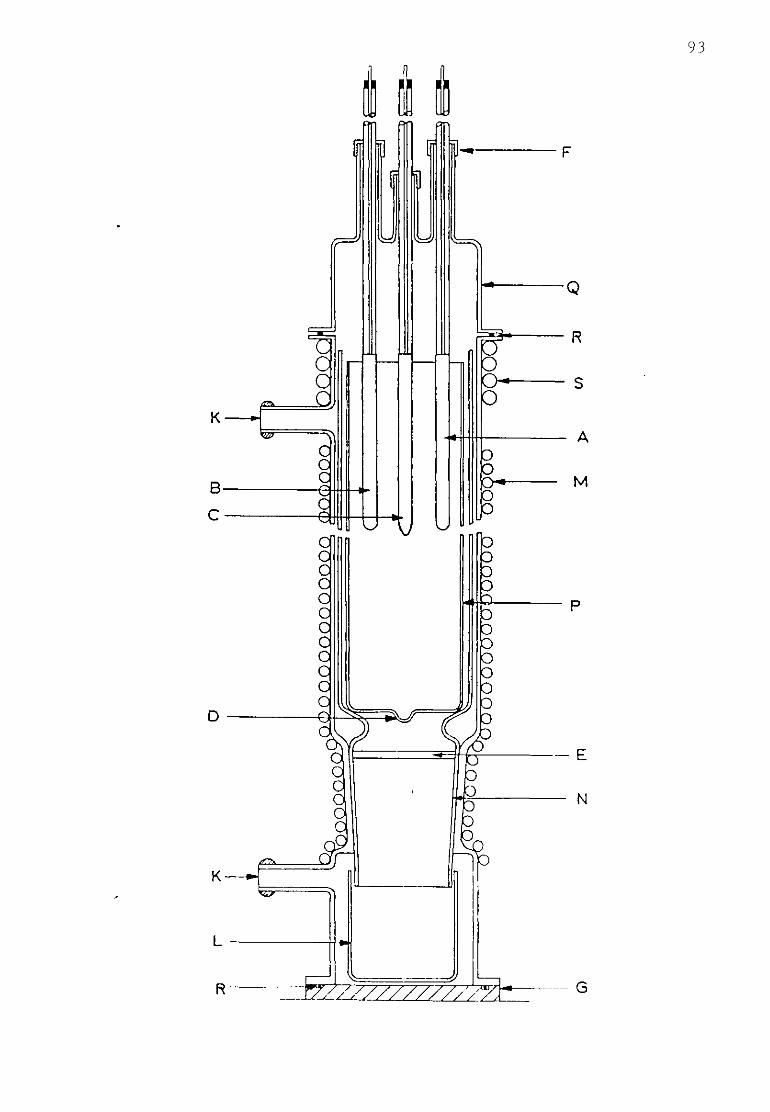
93
94
cathode is the most suitable as far as more efficient electrolysis is concerned.
The bulb of the inner tube inside the purification cell is then broken by means of a rod and by adjusting the right pressure above and below the glass frit or eventually the silica wool filter, the melt is filtered and collected in the lower beaker. After cooling, the purified melt is transferred to the dry box by means of an argon-filled polythene bag.
By following this procedure up to 500 g of eutectic could be purified in one batch from which 7 to 8 individual experiments could be run.
The purity of this melt was then checked by cyclic sweep voltammetry (Figure 11.19) and a good purification was judged by observing the current at -1.8V (vs Ag/Ag(l) reference electrode) which must be in the range of 150 to 200 |1A cm
II.2.8. Experimental procedure
All glassware and cell components in contact with the melt were soaked in concentrated HC1 baths for up to 24 hours and then thoroughly washed with distilled water.
After assembly of the pell, it was positioned in the furnace support and evacuated overnight at a pressure of 10|lm Hg. The cell was then filled to atmospheric pressure with HP argon and isolated from the line by adequate stopcocks, disconnected and transferred to the dry box where it was loaded with the purified melt. The reference electrode bulb was filled and hooked to the electrode itself. The closed cell was then reconnected to the vacuum line, degassed for several hours and lowered slowly inside the furnace. When the salt is

lU'ih-nxifle wave Figure 1 1 . 1 8
Sween voltammogram of ourified LiCl-KCl at 450C Tungsten working electrode. Sweep rate 100 rnVs" .
/u
molten, HP argon is introduced, providing a small flow at a slight positive pressure.
At this stage the cell and its components were ready for electro-chemical studies.
II.2.9. Compounds preparation
II.2.9.1. Preparation of TiCl^
TiCl^ is not available commercially because of its extreme sensitivity to oxygen and water vapour. Basically, two methods have been reported in earlier studies (173) (l6l). (i) by the direct synthesis of TiCl^, using the action of TiCl^ on Ti metal in a precisely controlled temperature gradient. (Figure 11.20.) (ii) by reacting Ti metal with aluminium chloride which produces a Ti(ll) aluminium chloride complex. This complex
is destroyed by heating under vacuum at 300°C to give volatile AlCl^ and TiCl^. The rate of the reaction is rather slow but after a few hours a black compound appears and the reaction is considered completed after 4-8 hours. The reaction has been conducted at 250°C under an argon partial pressure of approximately 0.5 atm in a sealed silica tube. Very pure TiCl^ has been produced by this method.
II.2.9.2. Preparation of K2TiCl
TiCl Under specific conditions of pressure and temperature
vapours react with solid alkali chlorides to produce complex

Figure I I . 2 0 .
Cell for the p r e p a r a t i o n of T i C l 2 >
1 - S 0 1 3 cap.
2-Pyrex cell.
3-Purified T i C l 4 inlet.
4-Puri fied T i C l . 4
5 - S e a l i n g p o i n t .
6 - S i l i c a c e l l .
7-Ti c l i p p i n g s , temperature 1 ^ = 1 0 7 0 0 .
8 - T e m p e r a t u r e T = 1 0 4 0 C .
9 - R e c e i v e r of T i C 1 2 > temperature T 3 = 9 0 0 C .
10-TiCl .
Scale a p p . ^ .
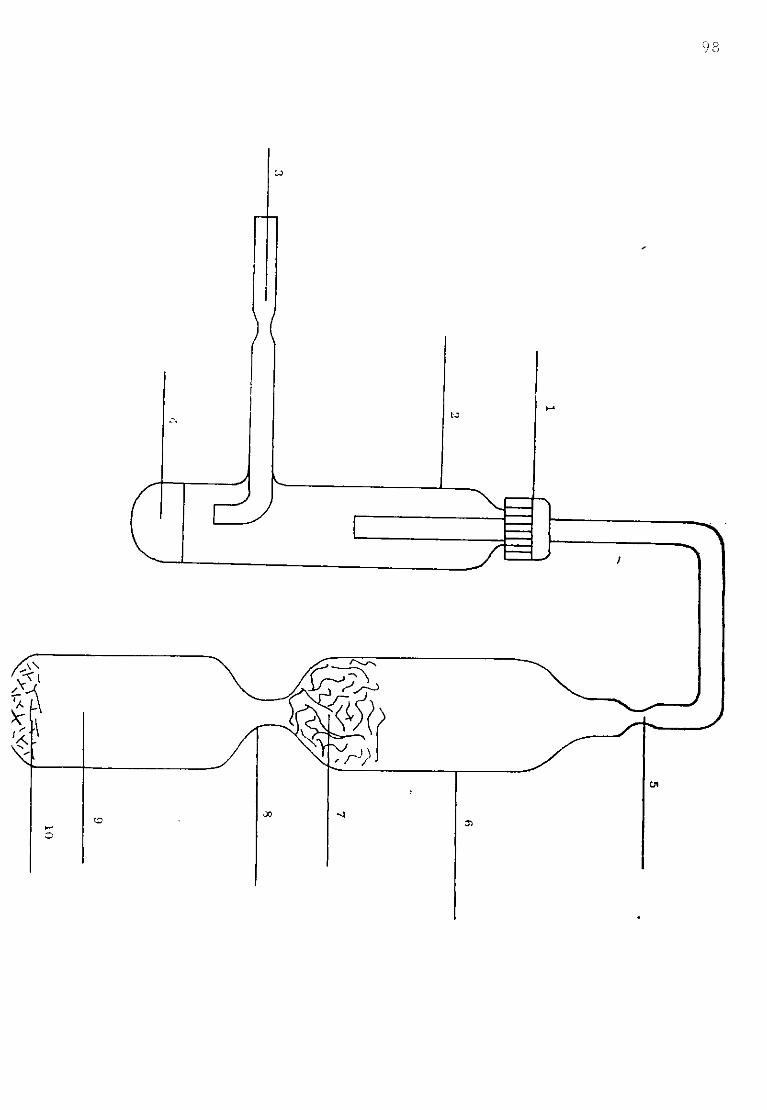
98

compounds. The method which was used involves the direct reaction of TiCl, on finely divided KC1 powder. This method was proposed by S.N. Flengas and others (162). The phase diagram of the system KC1 TiCl^ indicates only two eutectics and the consequently melting compound K^TiCl^, the solubility of TiCl^ in LiCl-KCl will depend on the formation of the compounds.
Figure 11.21 shows the cell employed to prepare K^TiCl^. Commercially available TiCl^ contains volatile oxychlorides and lower chloride impurities and consequently purification was necessary. TiCl^ was purified by refluxing at 136°C in the presence of copper filings to remove the oxychlorides. The purified TiCl^ was then vapour-transported inside the pyrex tube (diameter 25mm) bent at a right angle and sealed off. The horizontal arms of the cell contained analar KC1.
By heating TiCl^ to about 135°C and the potassium chloride to 4-00°C, K^TiCl^ was formed quantitatively after approximately 12 hours. The compound obtained contained a slight excess of absorbed TiCl^ which was eliminated by heating to 100°C under partial vacuum.
Thermodynamic properties and data on the formation of K^TiCl^ have been reported in (164.) and it appears that at 450°C only 0.57 mole % of I^TiCl^ can be dissolved in the LiCl-KCl eutectic and that the equilibrium pressure of TiCl,
4 above the eutectic/salt mixture is around 27.8 mm Hg. This shows, as will be emphasised in the following sections, that dissolution of K2TiCl^ in the LiCl-KCl eutectic is always accompanied by a significant volatilization of TiCl,. This

Figure 1 1 . 2 1 .
Cell for the preparation of
1-TiCl inlet. 4 2 - S e a l m g point.
3-Copper filing and TiCl .
4-Silica cell. 4
5-KC1.
6-Purified TiCl .
100
k2ticl6.
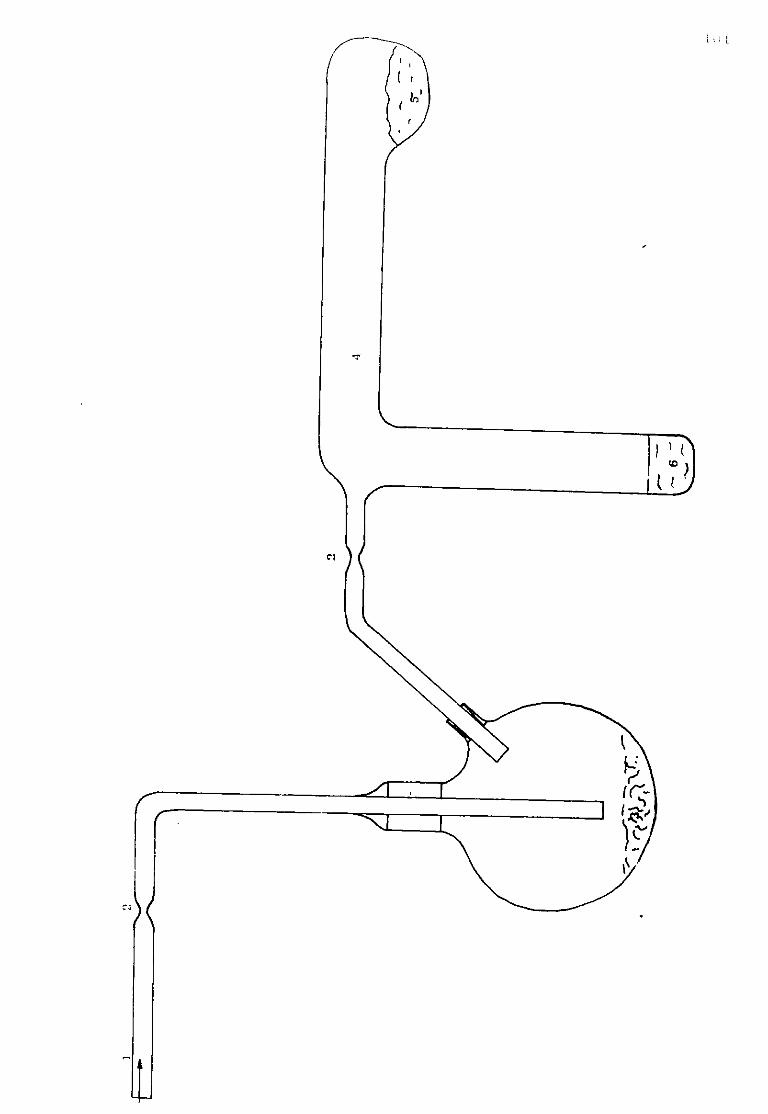

102
major disadvantage became obvious when an accurate knowledge of the concentration of the Ti (IV) species was required following the introduction of K^TiCl^. Loss could be avoided by maintaining pressure of TiCl. above the melt.
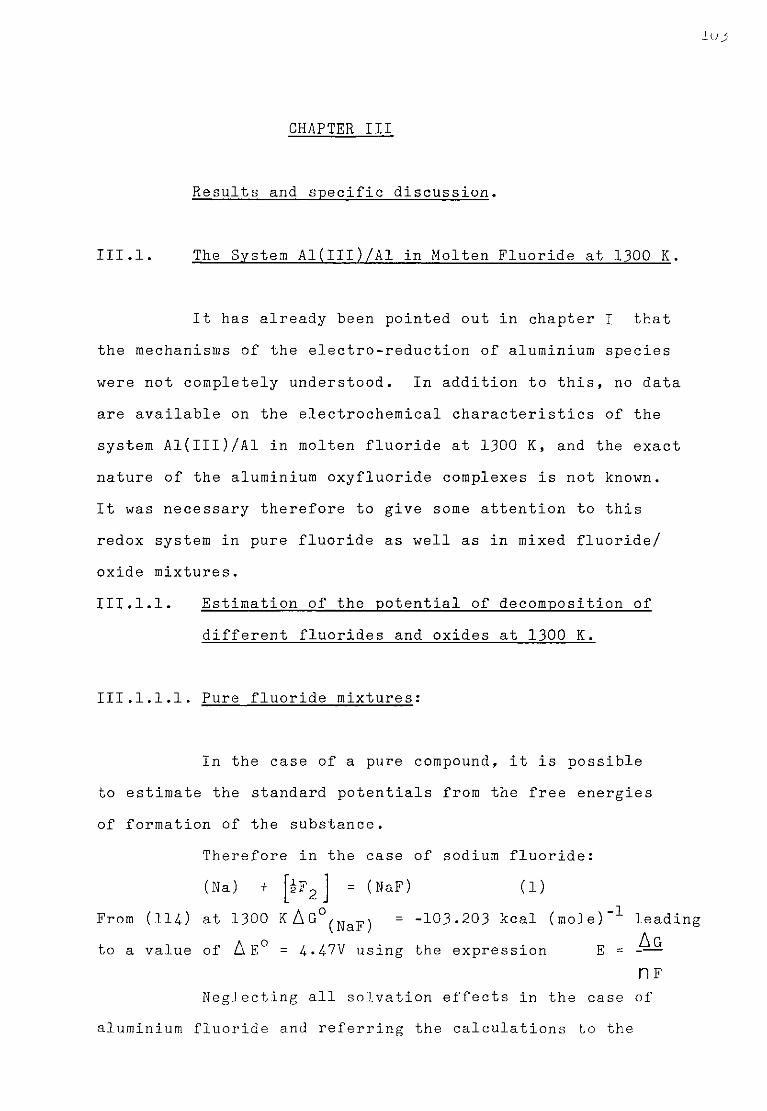
CHAPTER III
Results and specific discussion.
III.l. The System A1(III)/A1 in Molten Fluoride at 1300 K.
It has already been pointed out in chapter I that the mechanisms of the electro-reduction of aluminium species were not completely understood. In addition to this, no data are available on the electrochemical characteristics of the system A1(III)/A1 in molten fluoride at 1300 K, and the exact nature of the aluminium oxyfluoride complexes is not known. It was necessary therefore to give some attention to this redox system in pure fluoride as well as in mixed fluoride/ oxide mixtures.
III.1.1. Estimation of the potential of decomposition of different fluorides and oxides at 1300 K.
III.1.1.1. Pure fluoride mixtures:
In the case of a pure compound, it is possible to estimate the standard potentials from the free energies of formation of the substance.
Therefore in the case of sodium fluoride: (Na) + hF. = (NaF) ( 1 )
From (11/) at 1300 KAG°^ N a F^ = -103.203 kcal (mole) 1 leading to a value of A E° = 4-./7V using the expression E = -A G
nf Neglecting all solvation effects in the case of
aluminium fluoride and referring the calculations to the
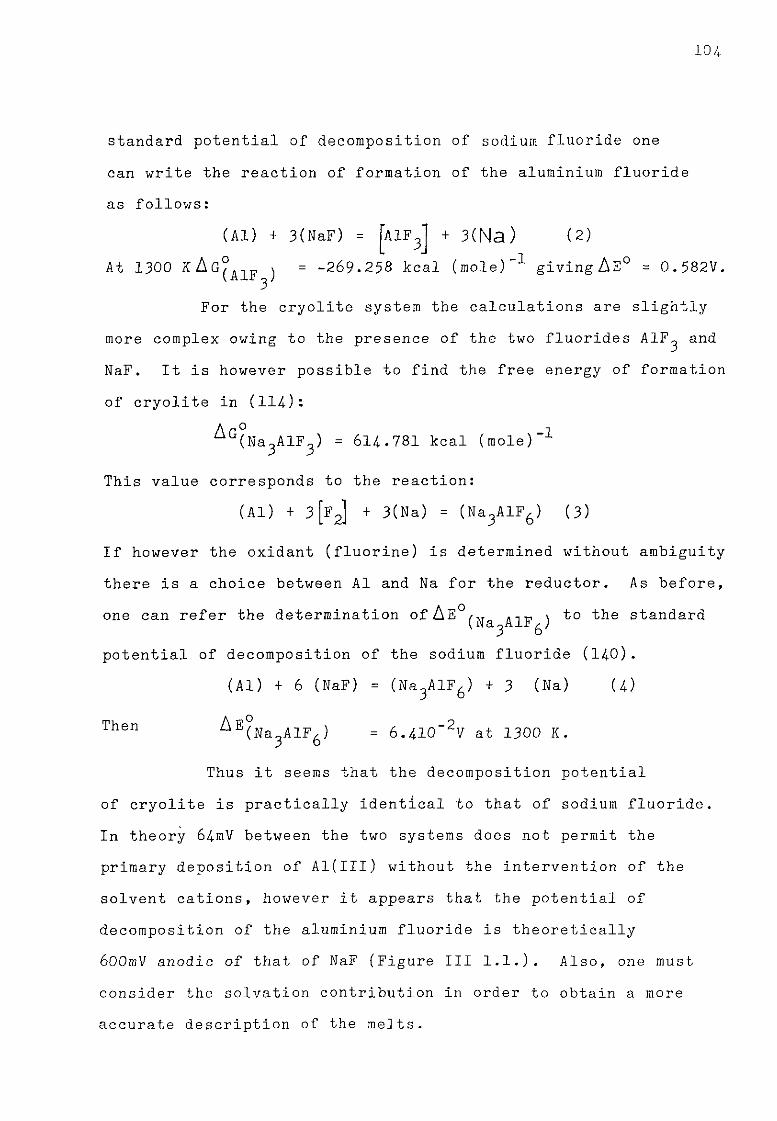
10 4
standard potential of decomposition of sodium fluoride one
can write the reaction of formation of the aluminium fluoride
as follows:
(Al) + 3(NaF) = [AlFj + 3(Na) (2)
At 1300 K A G ° a 1 f ) = -269.258 kcal (mole)"1 g i v i n g A E 0 = 0.582V.
For the cryolite system the calculations are slightly
more complex owing to the presence of the two fluorides AlF^ and
NaF. It is however possible to find the free energy of formation
of cryolite in (114): A r° i
( N a q A 1 F O ) = 6 1 4 . 7 8 1 kcal (mole) -1
This value corresponds to the reaction: (Al) + 3 [ f j + 3(Na) = (Na^AlF^) (3)
If however the oxidant (fluorine) is determined without ambiguity
there is a choice between Al and Na for the reductor. As before,
one can refer the determination ofAE°/^ a a to the standard 3 6
potential of decomposition of the sodium fluoride (140).
(Al) + 6 (NaF) = (Na3AlF6) + 3 (Na) (4)
T h e n ^ E(Na 3AlF 6) = 6.410"2V at 1300 K.
Thus it seems that the decomposition potential
of cryolite is practically identical to that of sodium fluoride.
In theory 64mV between the two systems does not permit the
primary deposition of Al(lll) without the intervention of the
solvent cations, however it appears that the potential of
decomposition of the aluminium fluoride is theoretically
6OOmV anodic of that of NaF (Figure III 1.1.). Also, one must
consider the solvation contribution in order to obtain a more
accurate description of the melts.

f <\1\ 4 . 47V
A
IV
7
Na /Na(0)
(in NaF or Na 0)
A1F /A1(0)
Na A1F /Al(0) o o
A l o 0 /A1(0)
Figure 11 I . 1 . 1
Standard potentials of decomposition at 1300K.
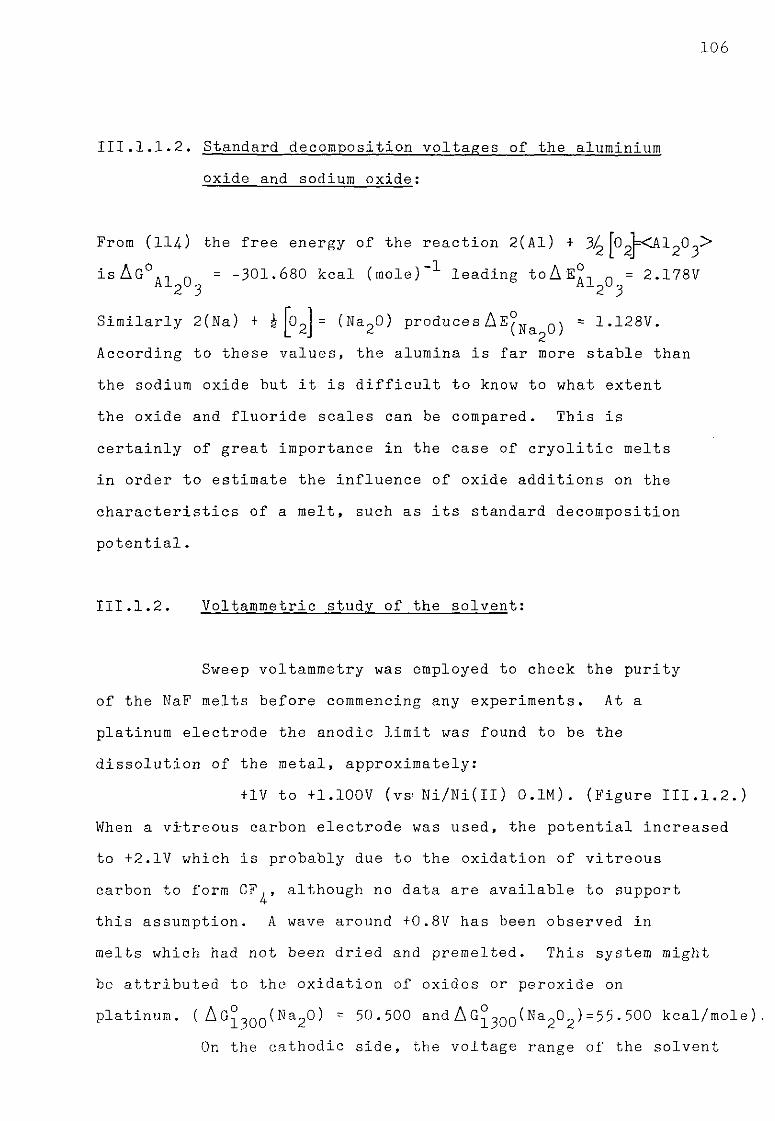
106
III.1.1.2. Standard decomposition voltages of the aluminium oxide and sodium oxide:
From (114) the free energy of the reaction 2(A1) + |b2j=<Al203> isAG° A 1 Q = -301.680 kcal (mole)"1 leading t o A E A 1 Q = 2.178V
2 3 2 3 Similarly 2(Na) + £ [°2] = ( N a
2°) produces AE° N & = 1.128V. According to these values, the alumina is far more stable than the sodium oxide but it is difficult to know to what extent the oxide and fluoride scales can be compared. This is certainly of great importance in the case of cryolitic melts in order to estimate the influence of oxide additions on the characteristics of a melt, such as its standard decomposition potential.
III.1.2. Voltammetric study of the solvent:
Sweep voltammetry was employed to check the purity of the NaF melts before commencing any experiments. At a platinum electrode the anodic limit was found to be the dissolution of the metal, approximately:
+1V to +1.100V (vs- Ni/Ni(ll) 0.1M). (Figure III.1.2.) When a vi-treous carbon electrode was used, the potential increased to +2.IV which is probably due to the oxidation of vitreous carbon to form CF., although no data are available to support this assumption. A wave around +0.8V has been observed in melts which had not been dried and premelted. This system might be attributed to the oxidation of oxides or peroxide on platinum. ( AG° 3 Q 0(Na 20) = 50.500 and A G°3 0 0 ( N a ^ ) = 5 5 . 500 kcal/mole)
On the cathodic side, the voltage range of the solvent
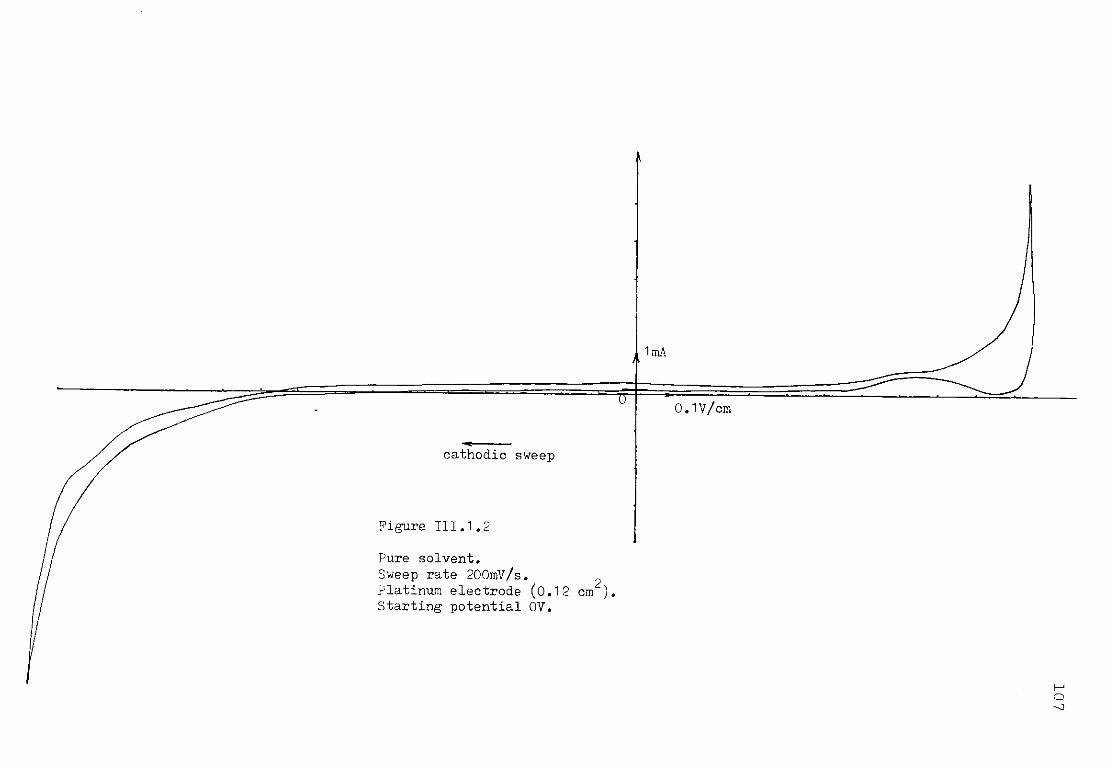
cathodic sweep
Figure III.1.2
Pure solvent. Sweep rate 200mV/s. Platinum electrode (0.12 Starting potential OV.
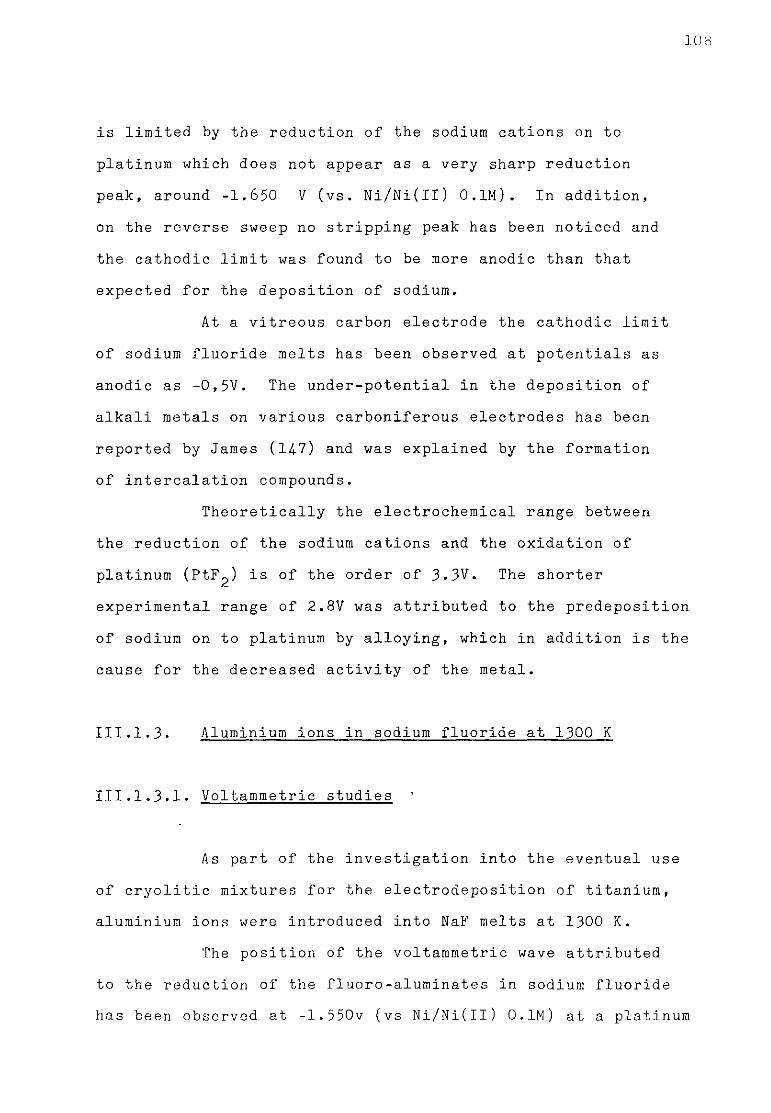
108
is limited by the reduction of the sodium cations on to platinum which does not appear as a very sharp reduction peak, around -1.650 V (vs. Ni/Ni(Il) 0.1M). In addition, on the reverse sweep no stripping peak has been noticed and the cathodic limit was found to be more anodic than that expected for the deposition of sodium.
At a vitreous carbon electrode the cathodic limit of sodium fluoride melts has been observed at potentials as anodic as -0,5V. The under-potential in the deposition of alkali metals on various carboniferous electrodes has been reported by James (14-7) and was explained by the formation of intercalation compounds.
Theoretically the electrochemical range between the reduction of the sodium cations and the oxidation of platinum (PtF^) is of the order of 3.3V. The shorter experimental range of 2.8V was attributed to the predeposition of sodium on to platinum by alloying, which in addition is the cause for the decreased activity of the metal.
III.1.3. Aluminium ions in sodium fluoride at 1300 K
III.1.3.1. Voltammetric studies
As part of the investigation into the eventual use of cryolitic mixtures for the electrodeposition of titanium, aluminium ions were introduced into NaF melts at 1300 K.
The position of the voltammetric wave attributed to the reduction of the fluoro-aluminates in sodium fluoride has been observed at -1.550v (vs Ni/Ni(II) 0. 1M) at a platinum

109
electrode (Figure III.1.3.) A cathodic limit of -1.650V for the solvent at a platinum electrode has been observed, placing the deposition of the aluminium ions + lOOmV anodic of that of the sodium ions. The main reduction wave is preceded by a very sharp peak around -1.390V. Regarding the oxidation, a shoulder is visible at 1.260V before what appears to be the stripping peak of the aluminium, followed by a broad illdefined wave. No peak corresponding to the very sharp peak mentioned above appears during the reoxidation.
A series of fast sweeps between -0.9V and -1.6V (vs Ni/Ni(ll) 0.1M) led to a voltammogram of a different pattern. (Figure III. 1.4). Although the main reduction wave around -1.550V did not shift much from its original position, the sharp peak disappeared completely. However, the shoulder observed during the reoxidation presented an increase in height in the same way as the large wave following the stripping peak of aluminium and eventually it became even higher than the latter. If the electrode is maintained at a potential close to zero (consequently at a slightly positive current) for two minutes the very sharp wave reappears in the same position with approximately the same height as exemplified in figure III.1.2.
A voltammetric study of the main reduction wave produced the data assembled in table III.1.1. It should be noted that the potential of the reduction process shifts towards more cathodic potentials as the sweep rate increases: 30mV passing from 50mV/s to 300 mV/s. The plot of I ^ versus v2 (figure III.1.5) produces a straight line with zero intercept at sweep rates lower than 300 mVs-"1". For higher sweep rates, the
] 10
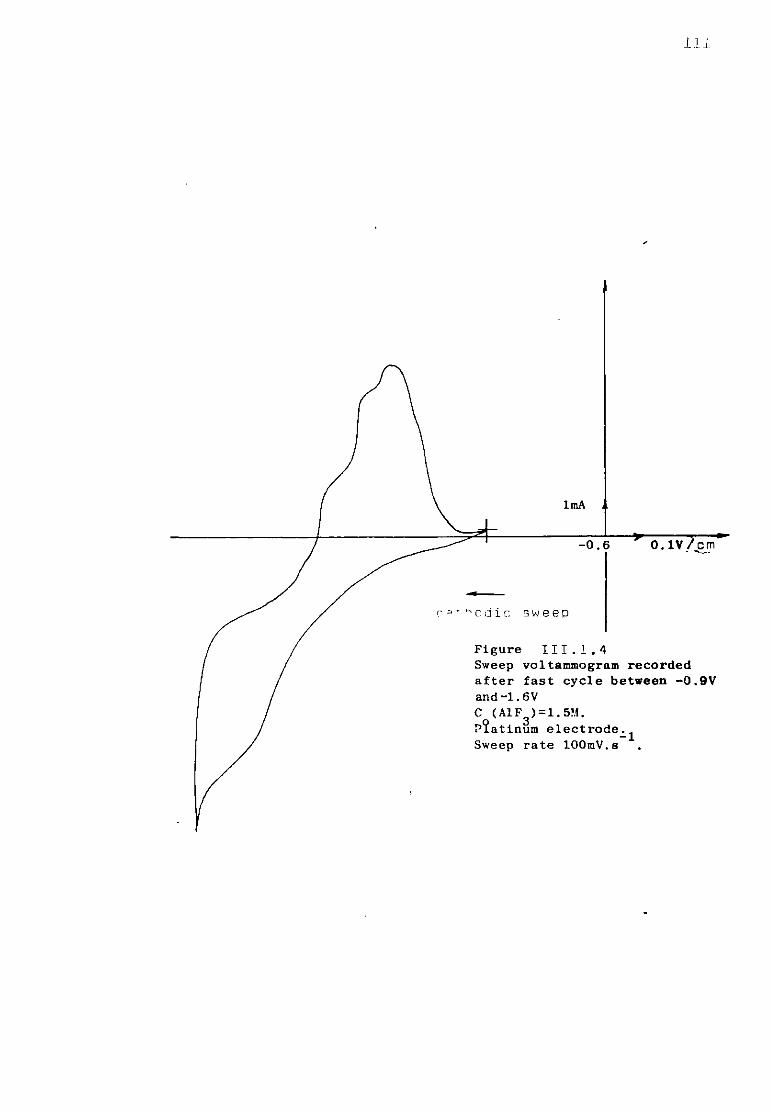
498

I p
(nA)
10
Figure 111 . 1. 5 r c
h 0.5
I versus v P
5 10 15 0.5 ,r -1 0.5
v (mV.s )
i—1 m
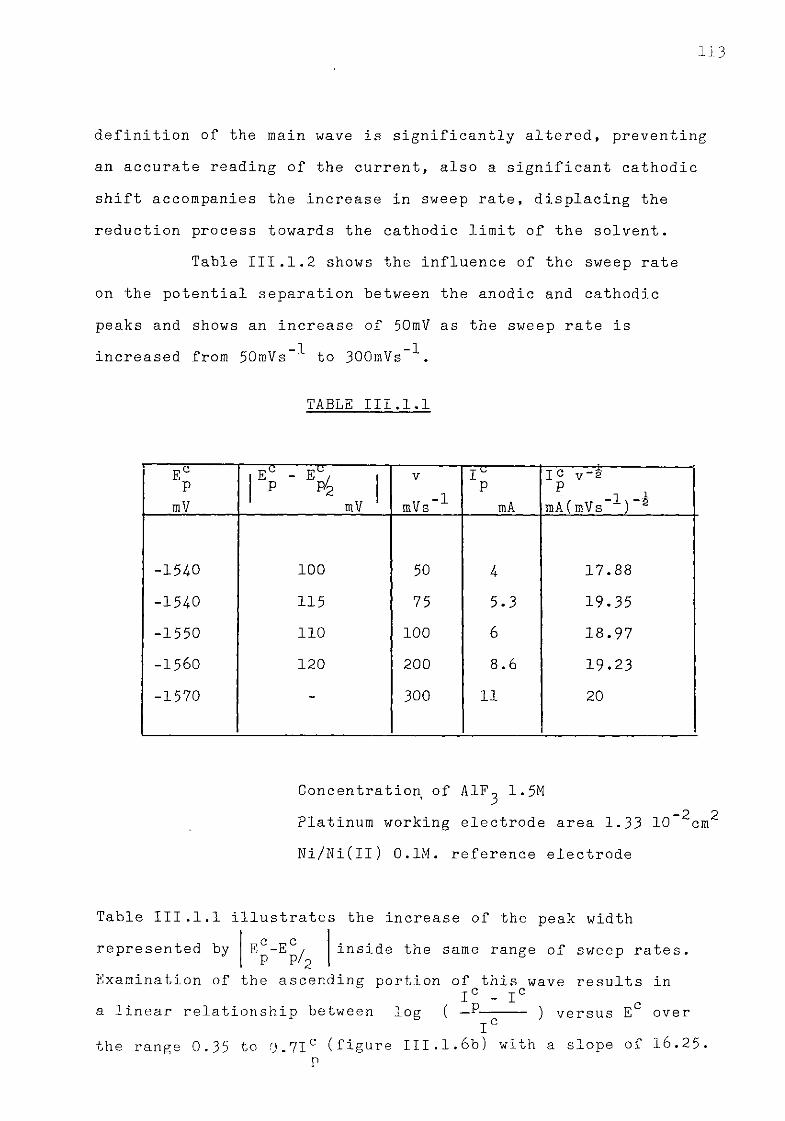
113
definition of the main wave is significantly altered, preventing an accurate reading of the current, also a significant cathodic shift accompanies the increase in sweep rate, displacing the reduction process towards the cathodic limit of the solvent.
Table III.1.2 shows the influence of the sweep rate on the potential separation between the anodic and cathodic peaks and shows an increase of 50mV as the sweep rate is increased from 50mVs~P to 300mVs ^.
TABLE III.1.1
Ec P
mV
7"S P E - E / p p/2 mV
V
mVs~P
I" P mA
I c V-4 P ! a mA(mVs ±)~2
-1540 100 50 k 17.88 -154-0 115 75 5.3 19.35 -1550 110 100 6 18.97 -1560 120 200 8.6 19.23 -1570 - 300 11 20
Concentration of AlF^ 1. 5M - 2 2
Platinum working electrode area 1.33 10 cm Ni/Ni(ll) 0.1M. reference electrode
Table III.1.1 illustrates the increase of the peak width
represented by E -E / P P/- inside the same range of sweep rates. Examination of the ascending portion of this wave results in a linear relationship between log ( —P-
ic - ic
) versus E over i
the range 0.35 to 0.7IC (figure III.1.6b) with a slope of 16.25. P
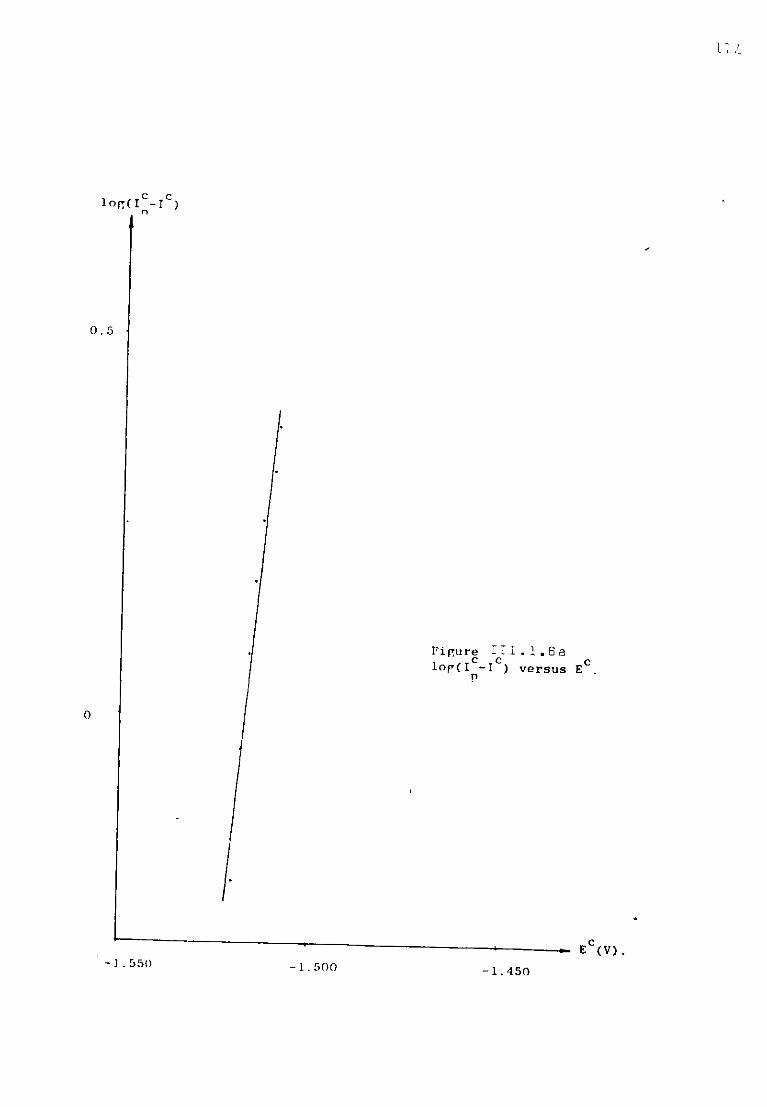
114
log(I C-I°)
0.5
Figure I I I . l . B a o c ^
log(I -I ) versus E n
' - 1.550 - 1.500
— E C ( V ) .
-1.450

115
iop(ic-rc),ic n
-0.5
Figure 1 1 1 . 1 . 6 b
1OF(I -I )/IC versus E C
p
E C ( V )
-1.550 -1.500 -1.450
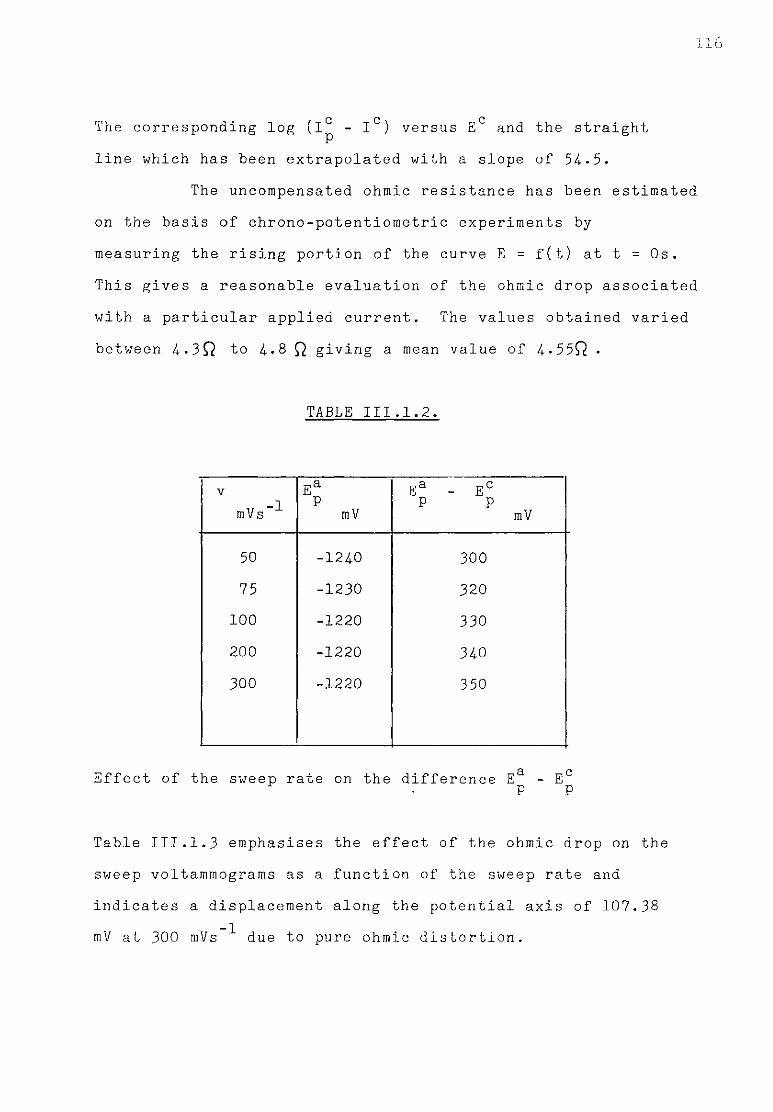
116
The corresponding log versus E and the straight P line which has been extrapolated with a slope of 54.5.
The uncompensated ohmic resistance has been estimated on the basis of chrono-potentiometric experiments by measuring the rising portion of the curve E = f(t) at t = Os. This gives a reasonable evaluation of the ohmic drop associated with a particular applied current. The values obtained varied between 4»3fi to 4.8 Q giving a mean value of 4.55fi .
TABLE III.1.2.
V u -1 mVs
E a P mV
Ea P - Ec
P mV
50 -1240 300
75 -1230 320 100 -1220 330 200 -1220 340 300 -1220 350
Effect of the sweep rate on the difference Ea - E c P P
Table III.1.3 emphasises the effect of the ohmic drop on the sweep voltammograms as a function of the sweep rate and indicates a displacement along the potential axis of 107.38 mV at 300 mVs due to pure ohmic distortion.
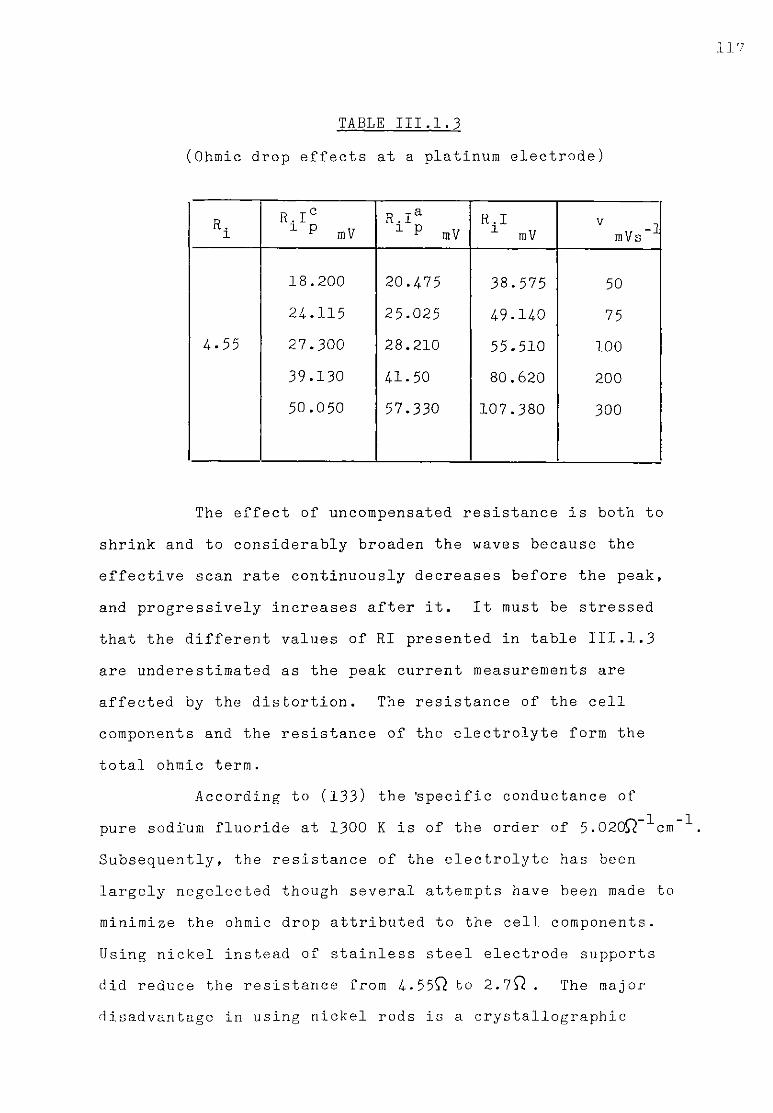
117
TABLE III.1.3
(Ohmic drop effects at a platinum electrode)
R. 1 R. I c 1 P u ^ mV
R.Ia 1 P mV
R.I 1 mV
v _i mVs
18.200 20.475 38.575 50 24.115 25.025 49.140 75
4.55 27.300 28.210 55.510 100 39.130 41.50 80.620 200 50.050 57.330 107.380 300
The effect of uncompensated resistance is both to shrink and to considerably broaden the waves because the effective scan rate continuously decreases before the peak, and progressively increases after it. It must be stressed that the different values of RI presented in table III.1.3 are underestimated as the peak current measurements are affected by the distortion. The resistance of the cell components and the resistance of the electrolyte form the total ohmic term.
According to (133) the 'specific conductance of pure sodium fluoride at 1300 K is of the order o f 5.020Q'- cm Subsequently, the resistance of the electrolyte has been largely negelected though several attempts have been made to minimize the ohmic drop attributed to the cell components. Using nickel instead of stainless steel electrode supports did reduce the resistance from 4.55Q to 2.7^ . The major disadvantage in using nickel rods is a crystallographic
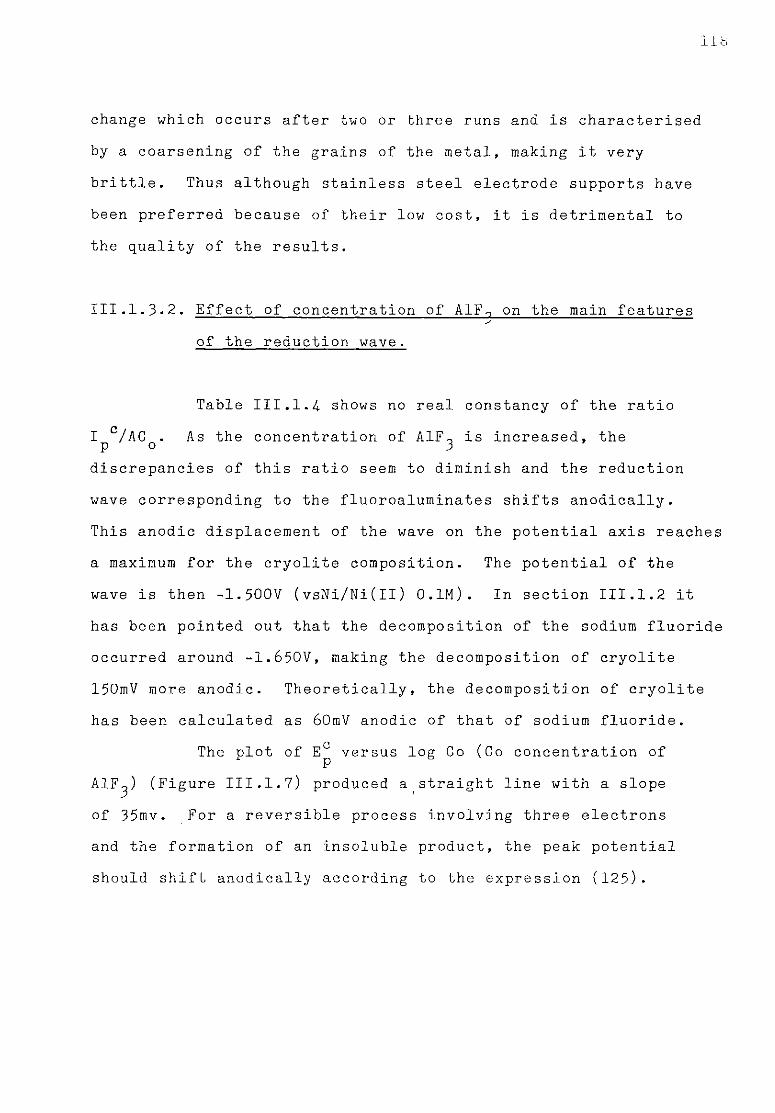
505
change which occurs after two or three runs and is characterised by a coarsening of the grains of the metal, making it very brittle. Thus although stainless steel electrode supports have been preferred because of their low cost, it is detrimental to the quality of the results.
III.1.3.2. Effect of concentration of AIFq on the main features of the reduction wave.
Table III.1.4- shows no real constancy of the ratio I C/AC . As the concentration of A1F- is increased, the p o 3 discrepancies of this ratio seem to diminish and the reduction wave corresponding to the fluoroaluminates shifts anodically. This anodic displacement of the wave on the potential axis reache a maximum for the cryolite composition. The potential of the wave is then -1.500V (vsNi/Ni(H) 0.1M). In section III.1.2 it has been pointed out that the decomposition of the sodium fluorid occurred around -1.650V, making the decomposition of cryolite 150mV more anodic. Theoretically, the decomposition of cryolite has been calculated as 60mV anodic of that of sodium fluoride.
c / The plot of Ep versus log Go (Co concentration of AlF^) (Figure III.1.7) produced a straight line with a slope of 35mv. For a reversible process involving three electrons and the formation of an insoluble product, the peak potential should shift anodically according to the expression (125).
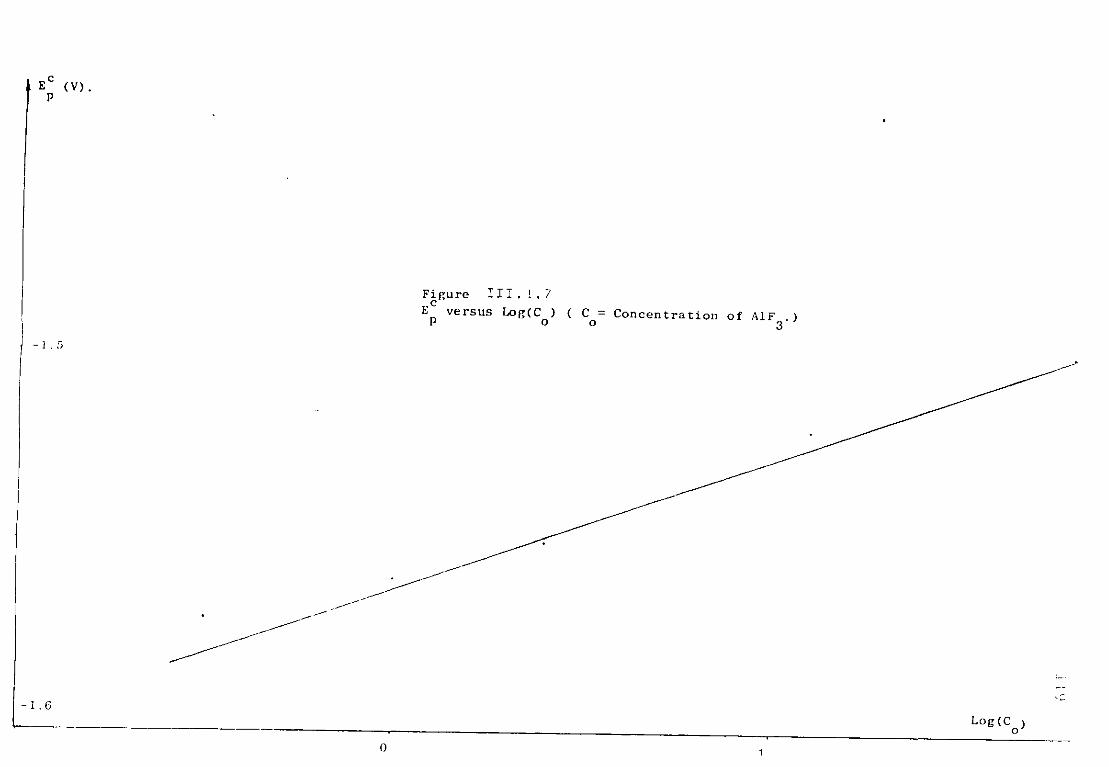
t E p c < v ) -
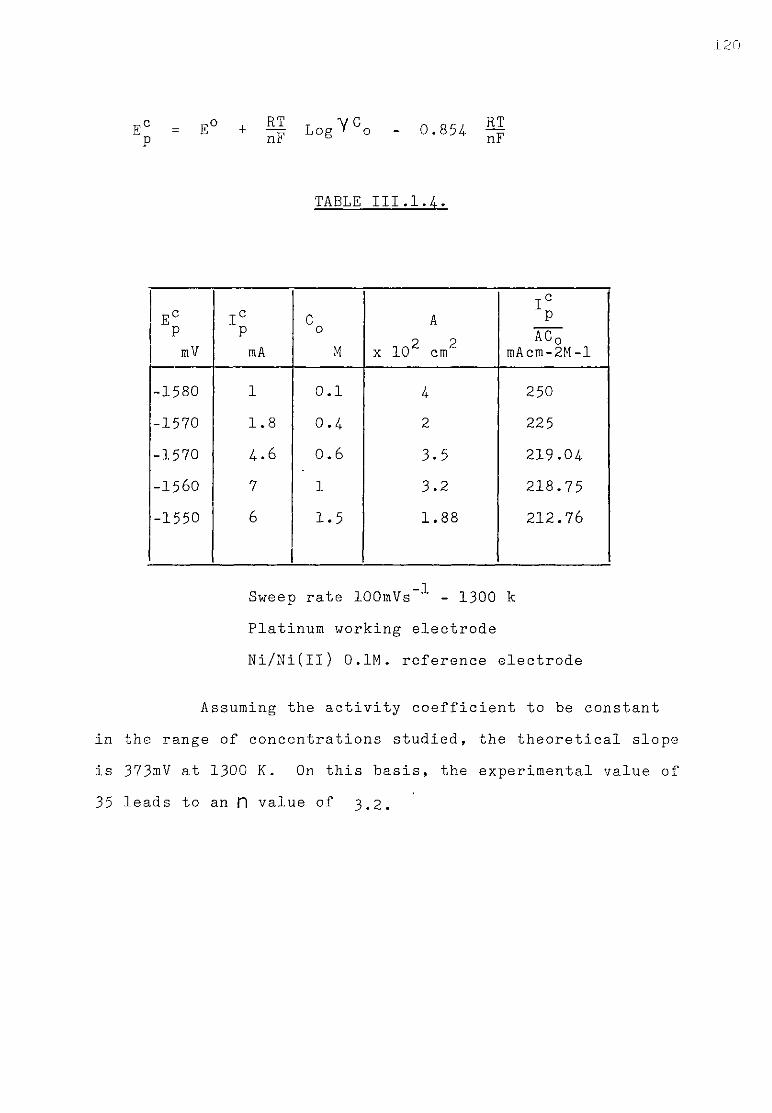
120
-c .o , RT T V C n o c i RT E = E + —T7 Log ' o - 0.854 p nF 5 nF
TABLE III.1.4.
EC P mV
I c P mA
C 0 M
A
x 102 cm2
I c P
AC0 mAcm-2M-1
-1580 1 0.1 4 250 -1570 1.8 0.4 2 225 -1570 4.6 0.6 3.5 219.04 -1560 7 1 3.2 218.75 -1550 6 1.5 1.88 212.76
Sweep rate lOOmVs-1 - 1300 k Platinum working electrode Ni/Ni(Il) 0.1M. reference electrode
Assuming the activity coefficient to be constant in the range of concentrations studied, the theoretical slope is 373mV at 1300 K. On this basis, the experimental value of 35 leads to an PI value of 3 . 2 .
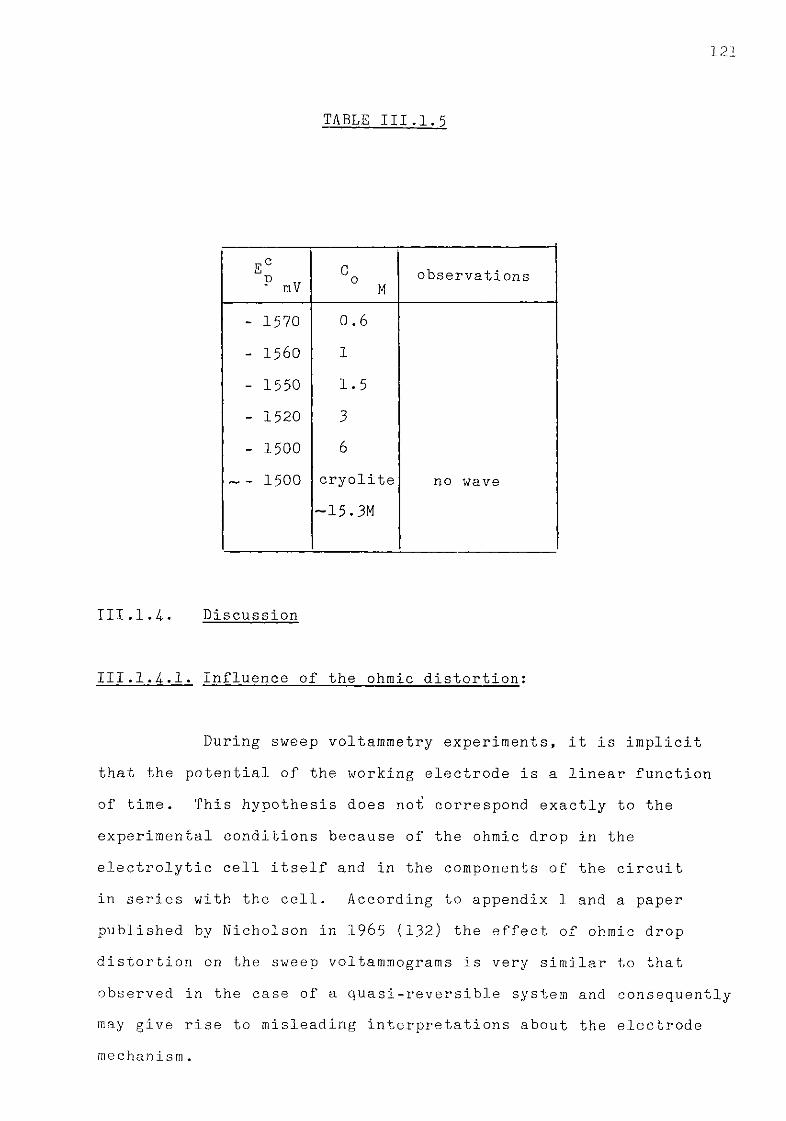
121
TABLE III.1.5
E C P mV
C 0 M observations
- 1570 0.6
- 1560 1
- 1550 1.5 - 1520 3 - 1500 6
~ - 1500 cryolite no wave -15.3M
III.1.4-. Discussion
III. 1. 4.. 1. Influence of the ohmic distortion:
s implicit ar function to the
the circuit a paper
mic drop to that con sequently electrode
mechanism.
During sweep voltammetry experiments, it i that the potential of the working electrode is a line of time. This hypothesis does not! correspond exactly experimental conditions because of the ohmic drop in electrolytic cell itself and in the components of the in series with the cell. According to appendix 1 and published by Nicholson in 1965 (132) the effect of oh distortion on the sweep voltammograms is very similar observed in the case of a quasi-reversible system and may give rise to misleading interpretations about the

R T The term H X(at) introduced by Nicholson represents
the displacement along the potential axis of the reduction or oxidation wave.
H and X(at) defined by the following expressions.
H =(||) FnA VTCD"a CqR
a = a n d i ( t ) = n F A V f c D a " C q X ( a t )
at E , H X(at) = R I p nF p
Different values for R I have been presented in table • P F
III.1.3. Bearing in mind that the error on the peak current may be large even for relatively low ohmic drops, larger values for R I may be envisaged and it is possible that the part played
P
by the ohmic components is of prime importance in the large potential differences observed between the anodic and cathodic
O C svstems as well as between E and E / . I rreversible p p/,
characteristics could therefore be interpreted partly in terms of ohmic drop distortion.
III.1.4.2. The reaction AI(III) + 3e = Al in sodium fluoride at 1300 K
The plot of log (1° - I c) versus Ec for a reversible process involving three electrons and the formation of an
nF insoluble product, is a straight line with a slope of 2.2 = 58 C / \ c
in the approximate range 0.5 to 0.9 I (134.) and E^ versus Log Cq should also produce a straight line with a slope of 37.3 mV. Examination of figures III 1.6a and III.1.7 indicates that this description fits the experimental results rather well.
123
Nevertheless, in view of (112) one cannot ignore the alloying affinity between Al and Pt at 1300 K. This effect could account for the presence of the broad and ill defined wave following the stripping peak of Al from the cathode surface (Figure III.1.2) and, in addition, the
I C - I c c plot of 1og( P )versus Ec shown in the figure III.1.6b
ic
favours such a description providing an n value of 3.14--Excluding any possible contribution by the ohmic drop to
3. C C C the differences E - E and E - E /, the rather large P P P P/2
values of the latter could be taken as an indication of a three-electron reversible system with the formation of a soluble product. On this basis a value of Ex can be
2 estimated using the formula
E c = Ejl. - 1.11 p 2 nF Q Taking E^ = 1.552V as a mean value for the position of
the reduction peak, one obtains Ex = 1.510V (vs Ni/Ni(ll) 0.1M) 2
However, the descriptions proposed above cannot be definitive; it is only tentatively suggested that the formation of an AlPt alloy would account rather well for the general pattern of the data obtained. Chronopotentiometric studies of this system, because of the poor definition and reproducibility of the results, did not permit any meaningful analysis of this reduction reaction.

III.1.5. The influence of oxide additions to the system Al(III)/A1.
III.1.5-1. Voltammetric studies of dissolved alumina in sodium fluoride at 1300 K.
As was observed in the last section, the potential of the reduction of the fluoroaluminates in sodium fluoride occurred at a potential lOOmV anodic of that of solvent cations (Figure III.1.3). By adding different concentrations of alumina to the solvent, the figures III.1.8 and III.1.9 have been recorded, together with the data assembled in table III.1.6.
TABLE III .1.6.
c A12°3 M
Ec P mV
I c P mA
V
mVs ^ 2A 2 10* cm Observations
0.125 -1350 2.1 100 k
0. 25 -1330 4.3 100 k
0. 65 -1300 12.6 150 4 Disappearance of the very sharp peak.
0. 75 -1280 10.8 100 3.5 1. 5 -1250 26 100 4
P l a t i n u m w o r k i n g e l e c t r o d e - 1 3 0 0 K
N i / N i ( I I ) 0 . 1 M r e f e r e n c e e l e c t r o d e
e f f e c t s of o x i d e a d d i t i o n s to the s y s t e m
A l / A l ( i u )
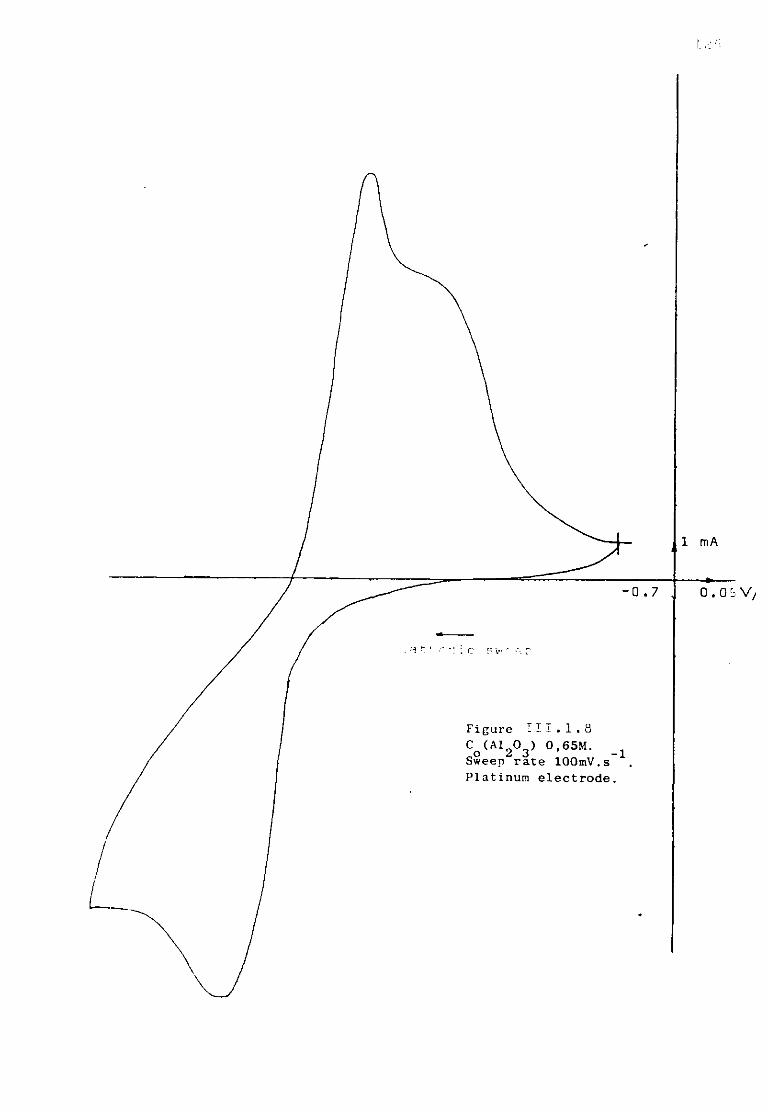
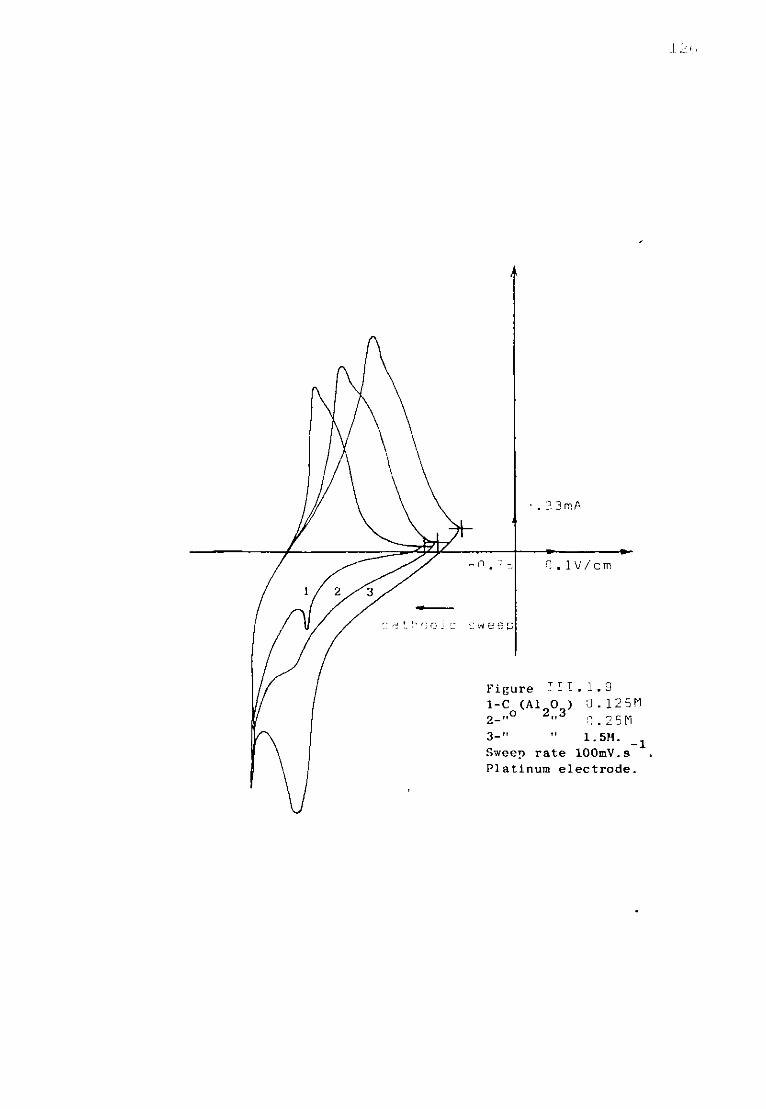
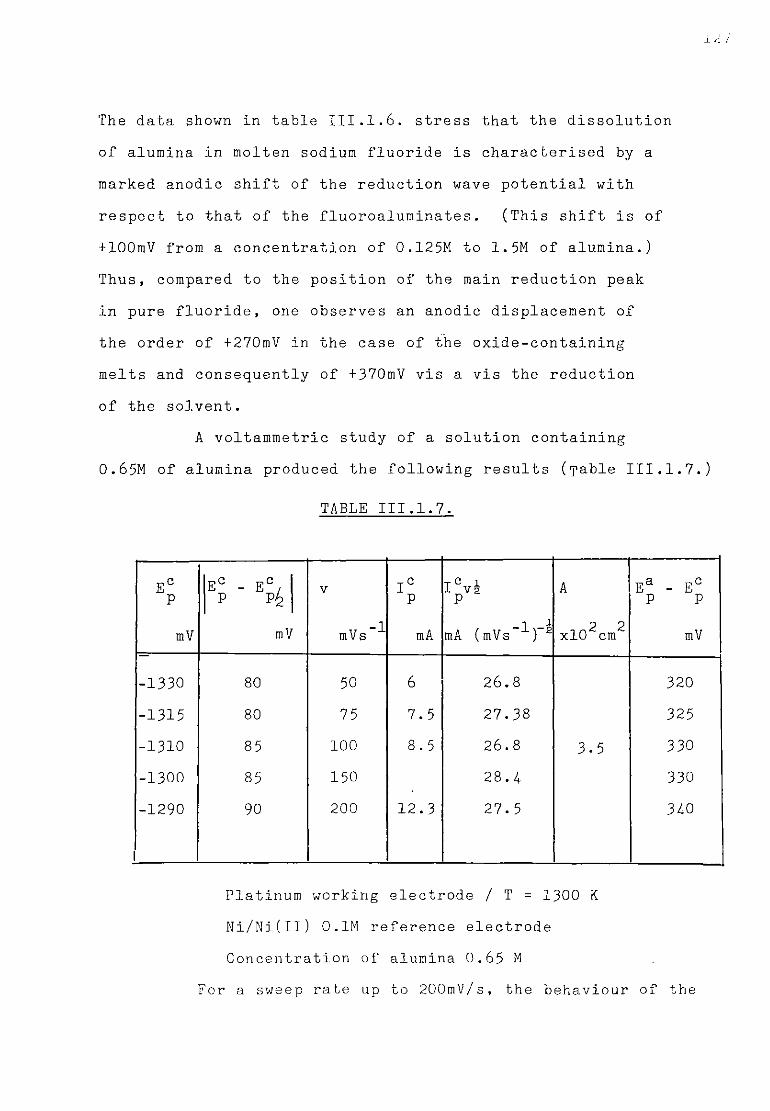
i 9 9
The data shown in table III.1.6. stress that the dissolution of alumina in molten sodium fluoride is characterised by a marked anodic shift of the reduction wave potential with respect to that of the fluoroaluminates. (This shift is of +100mV from a concentration of 0.125M to 1.5M of alumina.) Thus, compared to the position of the main reduction peak in pure fluoride, one observes an anodic displacement of the order of +270mV in the case of the oxide-containing melts and consequently of +370mV vis a vis the reduction of the solvent.
A voltammetric study of a solution containing 0.65M of alumina produced the following results (Table III.1.7.)
TABLE III .1.7.
E c P
mV
E c P - E
c /
mV
V
mVs ^
I c P
mA
T C 1 Vs -L i
mA (mVs )~2
A
2 2 xlO cm
E a - EC P P
mV
-1330 80 50 6 26.8 320
-1315 80 75 7.5 27.38 325 -1310 85 100 8.5 26.8 3.5 330
-1300 85 150 28.4- 330
-1290
1
90 200 12.3 27.5 34-0
Platinum working electrode / T = 1300 K Ni/Ni(Il) 0.1M reference electrode Concentration of alumina 0.65 M
For a sweep rate up to 200mV/s, the behaviour of the
c ~ ratio I v 2 j_s good agreement with that for a diffusion-controlled process. At low sweep rates the cathodic peak potential shifts anodically with increasing sweep rate tending to be constant at higher sweep rate values (Figure III.1.12) Examination of the figure III.1.13» which illustrates the
c - -variation of I v 2 as a function of the sweep rate, indicates p a slight increase of I v 2 as the sweep rate is increased.
Ec versus log C (C concentration of & o o The plot of alumina), shown in the figure III.1.11, emphasizes a linear shift of the cathodic process along the potential axis, a function of the concentration.
Plotting the quantity log (IC - I C) versus Ec over P
Q
the approximate range 0.5 - 0.91 » one obtains a straight line with a slope of 47.5 (Figure III.1.15a) However, examination of the ascending portion of the wave results in a linear
I C - I C c
relationship between log (—'- ) vs E over the range 0.35 ic
to 0.7 I c (Figure III.1.15b) with a slope of 15.6. The P observed half peak width E c - Ec/ P P h increased slightly with 2 -i increasing sweep rate from a value of 80mV at v = 50mVs to
90mV at v = 200mVs The corresponding anodic peak potential cl E showed an anodic shift with increasing the sweep rate of pc
20mV for a four-fold increase in sweep rate. Decreasing the cathodic switching potential has
a significant effect upon the reoxidation scheme. The figure III.1.14 shows the presence of another system prior to the peak which has been attributed to the dissolution of aluminium from the electrode. The sweep voltammogram also shows a general increase in the height of the reoxidation systems. It is probable that as the potential goes cathodic the amount of
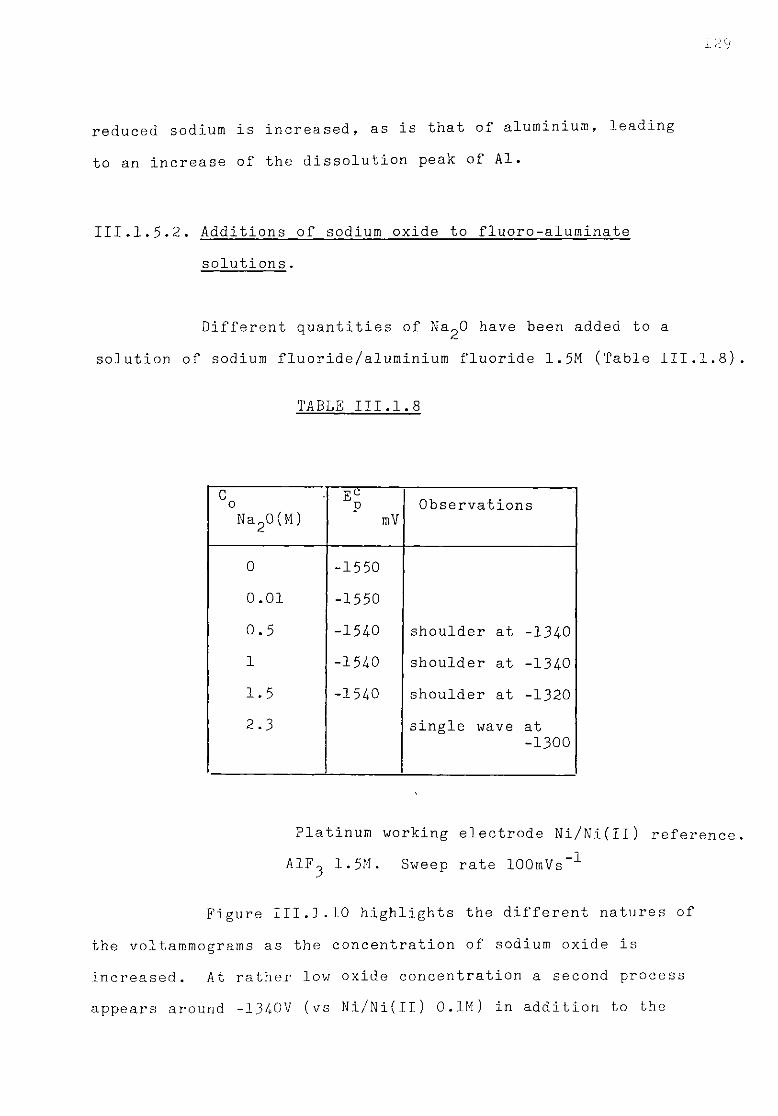
i 9 9
reduced sodium is increased, as is that of aluminium, leading
to an increase of the dissolution peak of Al.
III.1.5.2. Additions of sodium oxide to fluoro-aluminate solutions.
Different quantities of Na^O have been added to a solution of sodium fluoride/aluminium fluoride 1.5M (Table III.1.8).
TABLE III.1.8
c 0 Na20(M)
Ec P
mV Observations
0 -1550 0.01 -1550
0.5 -15/0 shoulder at -134-0 1 -15/0 shoulder at -134-0 1.5 -15/0 shoulder at -1320 2.3 single wave at
-1300
Platinum working electrode Ni/Ni(II) reference. A1F3 1.5M. Sweep rate lOOmVs"1
Figure III.1.10 highlights the different natures of the voltammograms as the concentration of sodium oxide is increased. At rather low oxide concentration a second process appears around -13/0V (vs Ni/Ni(Il) 0.1M) in addition to the
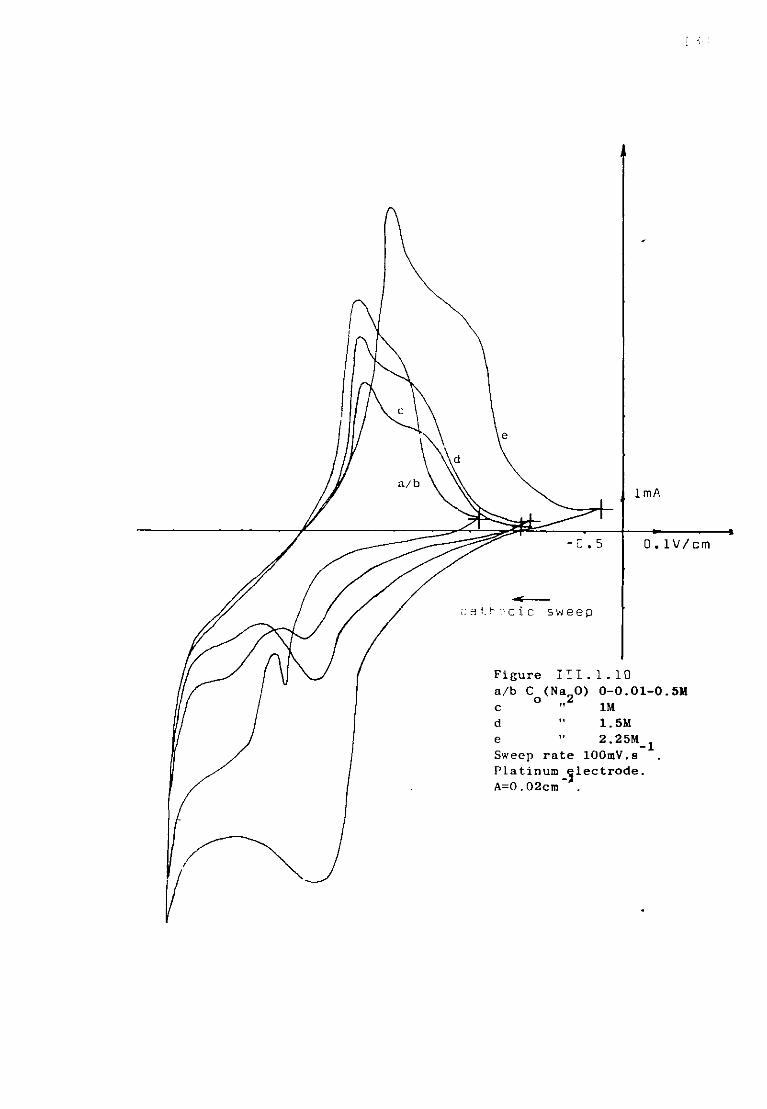
1mA
-0.5 0 . l V / c m
d i e s w e e p
Figure I I I . 1 . 10 a/b C (Na_0) O-O.Ol-O.5M
o 2 c " 1M d " 1.5M e " 2.25M Sweep rate lOOmV.s Platinum ^lectrode A=0.02cm ~
-1
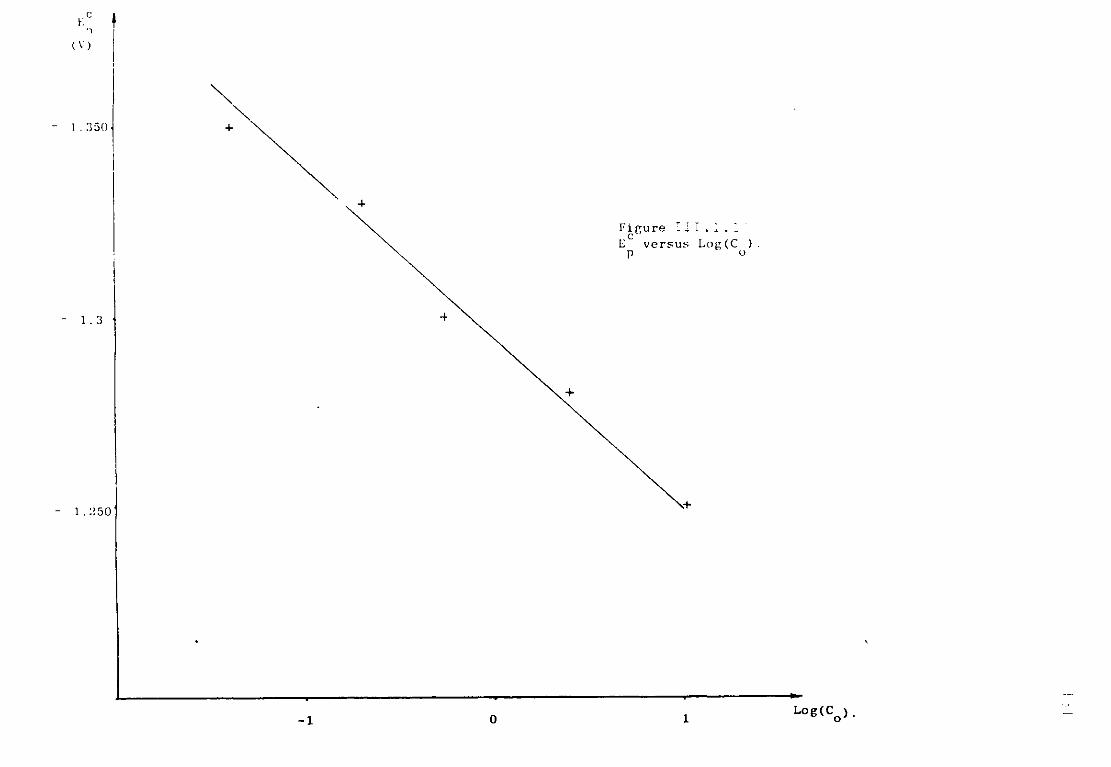
l<>g<co).
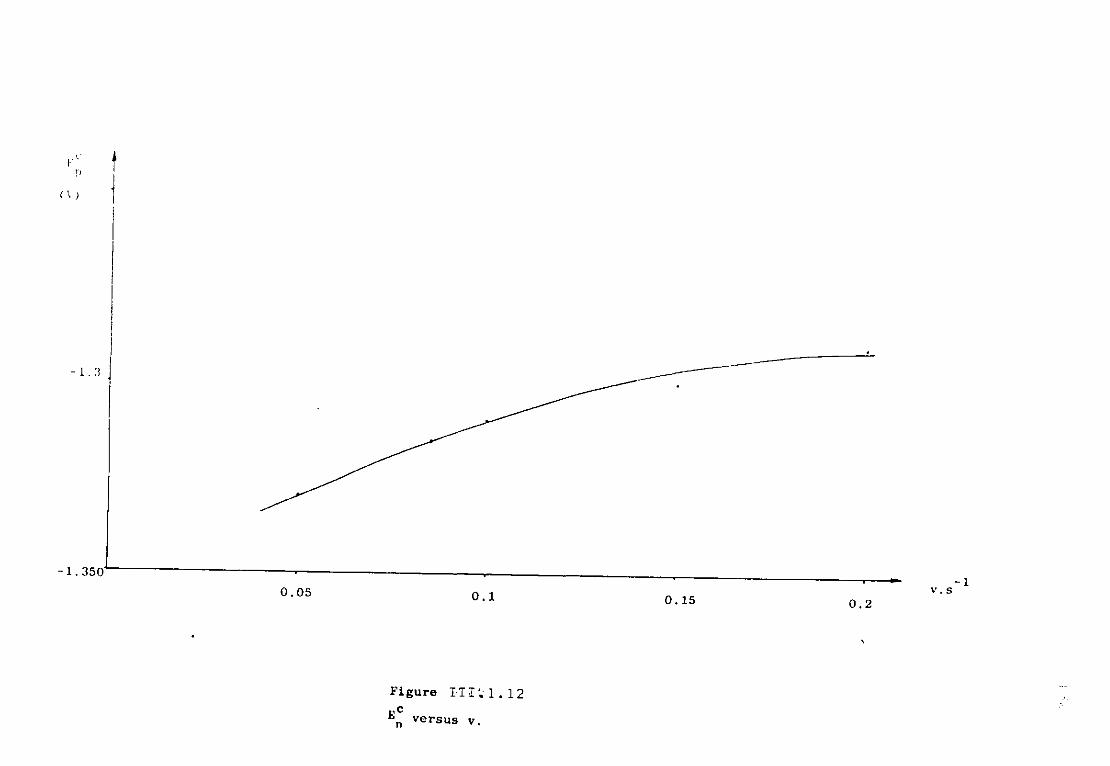
( \ )
1 . 3
-1.350
0.05 0.1
Figure III',1.1 2
fc versus v.
0.15 v. s
-1 0 . 2

c -0.5 i . v p -0.5| ( m A . V . s )
:u> J
U . o 5 0. 1
r i R u r B 5 I I I
I .v versus p
+
0. 15 0.2 V. s - 1
I. }'j
v.
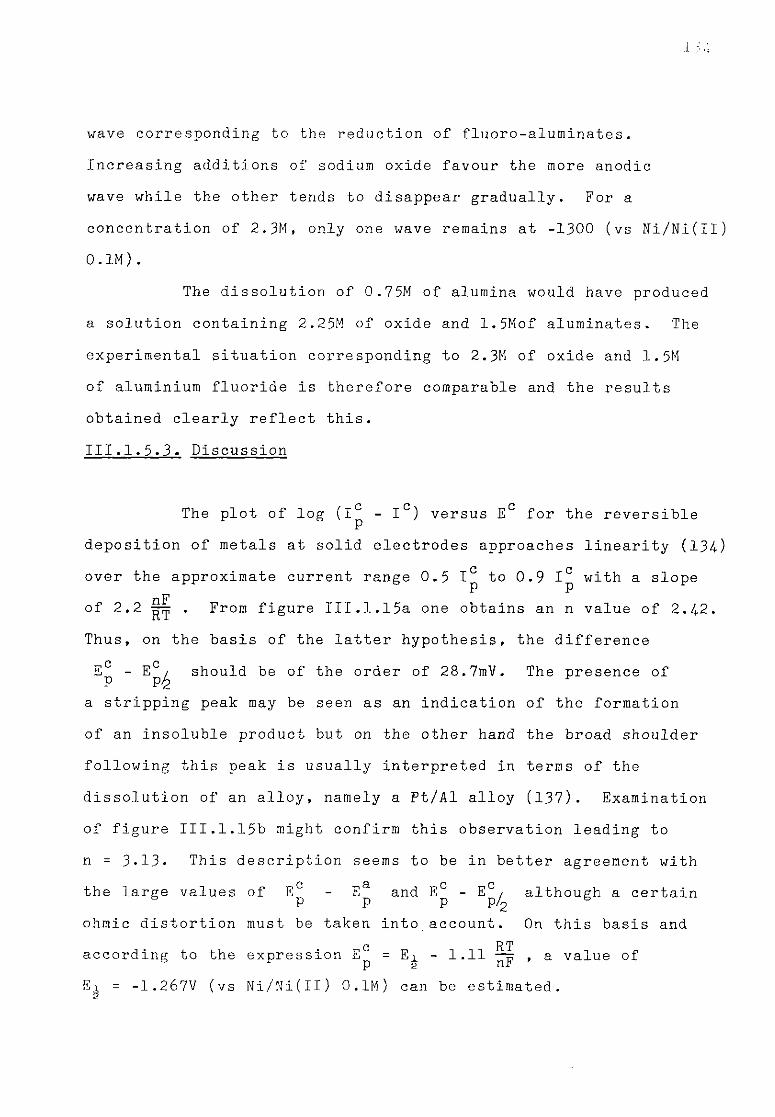
wave corresponding to the reduction of fluoro-aluminates. Increasing additions of sodium oxide favour the more anodic wave while the other tends to disappear gradually. For a concentration of 2.3M, only one wave remains at -1300 (vs Ni/Ni(II) 0.1m) .
The dissolution of 0.75M of alumina would have produced a solution containing 2.25M of oxide and 1.5Mof aluminates. The experimental situation corresponding to 2.3M of oxide and 1.5M of aluminium fluoride is therefore comparable and the results obtained clearly reflect this. Ill. 1. 5.3 . Discussion
The plot of log (lc - I c) versus Ec for the reversible P deposition of metals at solid electrodes approaches linearity (134-)
c c over the approximate current range 0.5 I to 0.9 I with a slope
nF of 2.2 -Tp . From figure III.1.15a one obtains an n value of 2.4.2. Thus, on the basis of the latter hypothesis, the difference EP " EP^ s h o u l d b e o f t h e o r d e r o f 28.7mV. The presence of
a stripping peak may be seen as an indication of the formation of an insoluble product but on the other hand the broad shoulder following this peak is usually interpreted in terms of the dissolution of an alloy, namely a Pt/Al alloy (137). Examination of figure III.1.15b might confirm this observation leading to n = 3.13. This description seems to be in better agreement with the large values of E - E a and Ec - Ec, although a certain
P P P P/2 ohmic distortion must be taken into account. On this basis and
c RT according to the expression E = Ei - 1.11 —vr , a value of p 2 nr Ei = -1.267V (vs Ni/Ni(II) 0. 1M) can be estimated. s


lnp( ic-ic ) p
- 0 . 5 J
L U-
Figure *I-II.1.15a c c c
log(I -I ) versus E . p
- 1 . 300 - i.250 - 1.200 E°(V) .
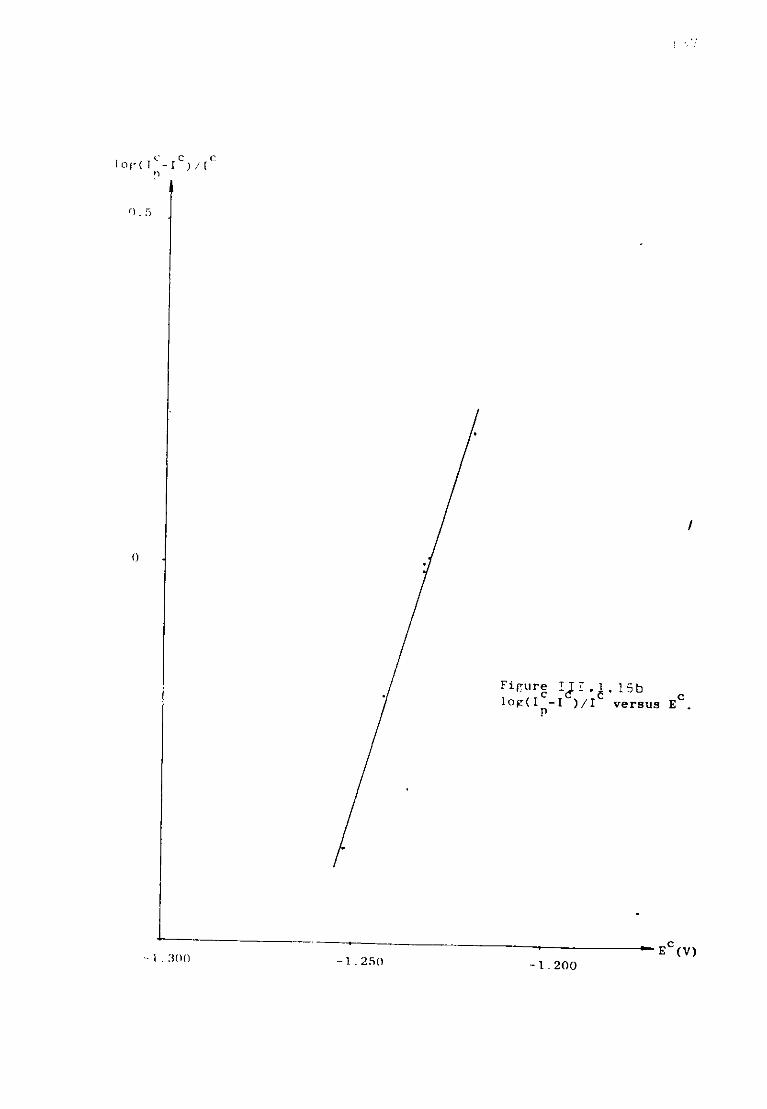
- 1.300 -1.250 - 1.200

As has been shown in figure III.1.10, the reduction mechanism introduced by the addition of oxide could eventually replace that observed in pure sodium fluoride. Of course, one can speculate upon the species involved and the process by which the reduction of the aluminium-containing ions is anodically shifted. It has already been emphasised that the aluminium
species in sodium fluoride are strong acceptors of 0 particles, probably leading to the formation of large oxyanions containing one or two aluminium atoms (97). It would, therefore, be logical to expect a chemical reaction emphasizing the occuring acid-base change of configuration, but according to (122) the final reduction potential would have been even more cathodic and
ic besides the behaviour of the quantity _p does not favour such
vi~ a scheme at low sweep rate, the theory predicting a fall of the ratio as the sweep rate increases. It is possible that the overvoltage introduced by the presence of oxocomplexes could largely compensate for this shift and lead to a final situation which can be ascribed to destabilization.
In view of the results of section III.1.5.2. one may reasonably assume that:
i) the fluoroaluminates seem to be strong acceptors of the 0 ~ particle;'
ii) the species formed during the dissolution of alumina to NaF melts, and those with addition of Na^O to NaF AlF^ mixture, are likely to be the same;
iii) the presence of two separate waves for intermediary concentration of Na^O could be taken as an indication of the formation of new complexes. The change over from a pure fluoride environment to one which is

1.39
probably mixed is therefore characterised by an anodic shift of the reduction process. One has stressed in section 1.2.3 that the great similarity in size of the particles 0 and F could promote the replacement of the F by 0 which could thus appear to be the stronger base.
III.1.6. The special case of cryolitic melts.
III.1.6.1. Emf measurements in cryolitic solutions
The following cell has been investigated.
A 1
( 1 )
AlF^ - 3NaF ( 2 )
A1F3 - 3NaF +n A1203
A 1
j unction
Saget (127) has established that the equilibrium for the dissociation of the pure cryolite could be written as follows
A1F^~ = A1F~ + 2F~
and characterised this reaction by a constant K^ at 1300 k •
a(A1F~) a(F")2
k rr a 1 a(AlF^)

Rolin and Bernard (130) have reported that cryolitic melts
could be assimilated to ideal solutions with up to 20 Wo of
additives. Therefore, it is a good approximation to introduce
ionic fractions in all the following calculations. At an
aluminium electrode the electrochemical reaction can then
be expressed by: •n n0 , RT T E = E + 3P L o
i
N ( A 1 F3" )
( V )6
The electrolytic junction was a boron nitride diaphragm
impregnated with sodium fluoride. It has been reported that
the transference number of the sodium cations was almost
unity (76) (131) leading to a negligible potential of junction.
The potential of the cell can thus be considered
equal to:
E R T
3F Log N ( A I F 6
3 " )
(n_)6
( 2 )
R T
3F Log N ( A I F 6
3 " )
(nf-)6 ( 1 )
Increasing additions of alumina to the second part
of the cell produced the data assembled in1 the table III.1.9.
TABLE III .1.9
E (cell) mV
C 0 . Wt/o Al2 0 3
0 2 + 50 5 + 70 8
' 120
180 14 ^ 200
Effect of addition of alumina on the
potential of the redox system Al/Al(lll)
141
It can be seen that at saturation (14 Wt# of Al^O^)
the emf of the cell has a mean value of +190mV. In view of (1),
this can be interpreted as a decrease of the activity of the F~
particles with increasing additions of alumina. Saget et al
( 8 4 ) came to the same conclusion but published a value of
+100mV for similar operational conditions.
The dissolution of alumina in cryolitic melts may
be written differently according to the oxofluoroaluminate
under consideration.
Spectroscopic and cryoscopic studies (96) (97) (98)
indicated that the most probable species were of the type:
Alo F 1 ~ y - Alo0 F 0 ^~2x - Alo0o F 2" z - A10o F y 2 2x 2 2 z 2 t
Different values for x-y-z and t have been proposed. It seems
that aluminium is found only in octahedral or tetrahedral
environments in cryolite (127) , thus y should correspond to
values of 3 or 5. Similarly for x values of 3 or 5 have been
suggested, together with 4 and 6 for z and 2 and 4 for t.
It is improbable that in alumina-saturated melts
species containing more than one aluminium atom will be stable,
but rather that they will be stabilised by low 0/al ratios.
Various values for K- have been suggested, ranging from 0.02
to 0.17 (ionic fraction) (127). Saget et al (84) reported
a value of 0.03 which could be a rather good estimation. Taking
an option for one particular complex in a certain configuration
it is therefore possible to calculate corresponding values for
A E . Unfortunately, no meaningful data have yet been obtained,
probably owing to secondary equilibria occurring between the
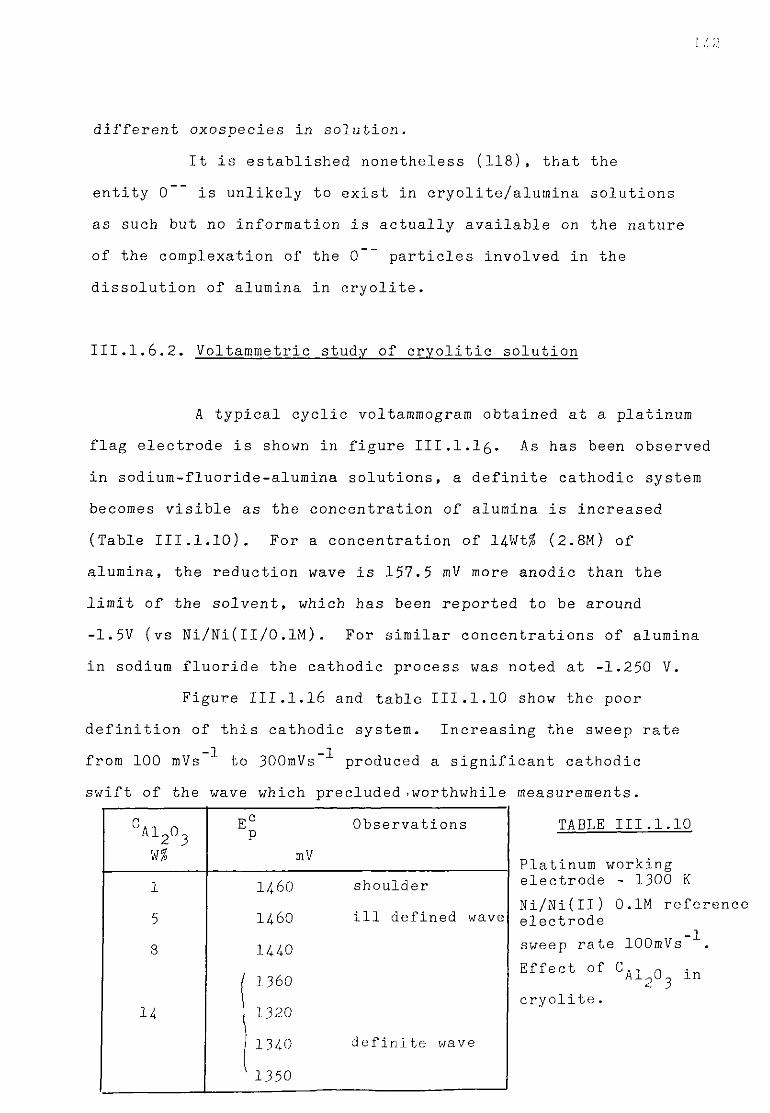
different oxospecies in solution. It is established nonetheless (118), that the
entity 0 is unlikely to exist in cryolite/alumina solutions as such but no information is actually available on the nature of the complexation of the 0 ~ particles involved in the dissolution of alumina in cryolite.
III.1.6.2. Voltammetric study of cryolitic solution
A typical cyclic voltammogram obtained at a platinum flag electrode is shown in figure III.l.l£. As has been observed in sodium-fluoride-alumina solutions, a definite cathodic system becomes visible as the concentration of alumina is increased (Table III.1.10). For a concentration of 14Wt$ (2.8M) of alumina, the reduction wave is 157.5 mV more anodic than the limit of the solvent, which has been reported to be around -1.5V (vs Ni/Ni(lI/0,1M). For similar concentrations of alumina in sodium fluoride the cathodic process was noted at -1.250 V.
Figure III.1.16 and table III.1.10 show the poor definition of this cathodic system. Increasing the sweep rate from 100 mVs to lOOmVs"'1' produced a significant cathodic swift of the wave which precluded'worthwhile measurements.
TABLE III.1.10
Platinum working electrode - 1300 K Ni/Ni(II) 0.1M reference electrode sweep rate lOOmVs
C a 12°3 W %
E c P mV
Observations
1 1460 shoulder
5 1460 ill defined wave
8 1440
( 136 0 14 2 320
134 0 definite wave
1350
Effect of C cryolite.
Al^O^ in
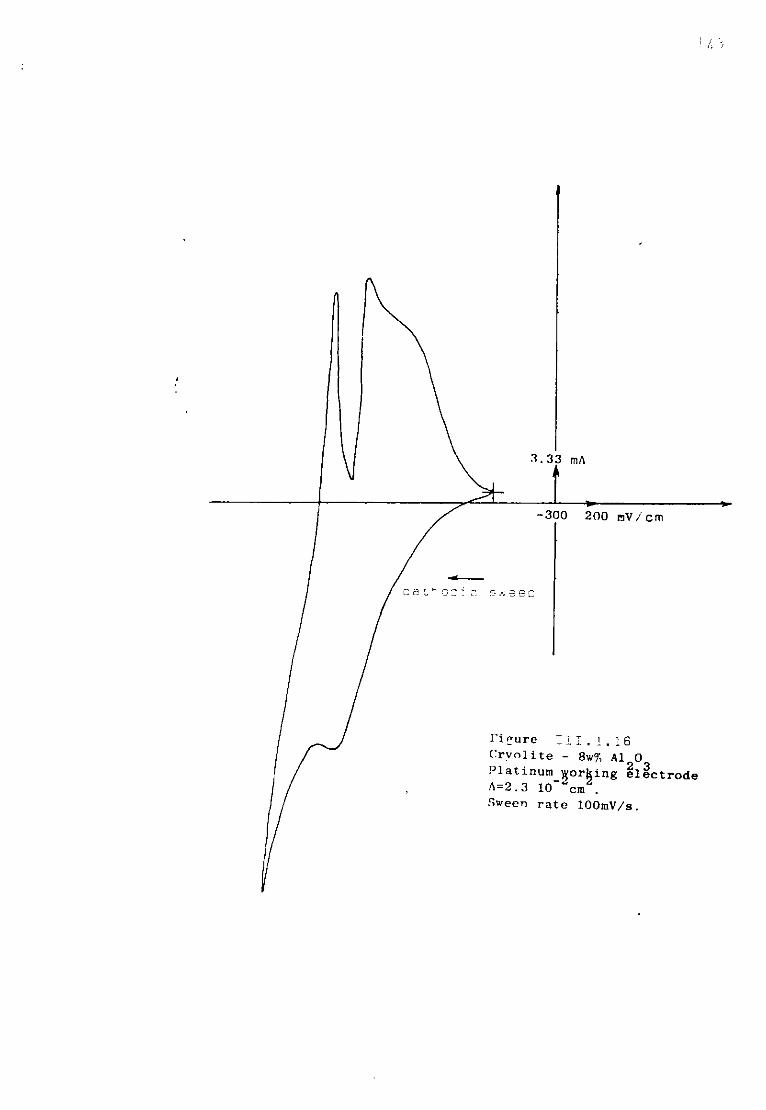
J-U
One can of course speculate on the change of acidity which occurred following the dissolution of large quantities of AlF^ in NaF melts to interpret the difference of almost 200 mV which occurred between the reduction of alumina in cryolite and in sodium fluoride. The acidity of cryolitic melts can be related to the ratio
nNaF + nAlF3
Varying between zero to 0.25 when passing from pure NaF to cryolite, the new concentration of F particles could well lead to the formation of different species. (8/)(128)(129).
In cryolite/alumina solutions Gilbert et al (97) favoured species of the type -A1-0-A1- . Following this hypothesis, the reduction mechanism of the oxofluoraluminates could involve a second or higher order reaction.
Schuman (136) has reported second order reaction criteria for sweep voltammetric investigations. According to a general reaction of the type 0 + me = qR the respective values of m and q will dictate the theoretical expression leading to Ec - EC, I and P Ph E - E P P
a necessary to describe
Ec - Ea
the process. For m = 2 and q = 1 at 1300 K the difference P P
can be as high as 127.8mV for a reversible reaction involving three electrons, and where both product and reactant are soluble. In addition the sweep voltammograms will present characteristics which are similar to those observed when ohmic components are present.
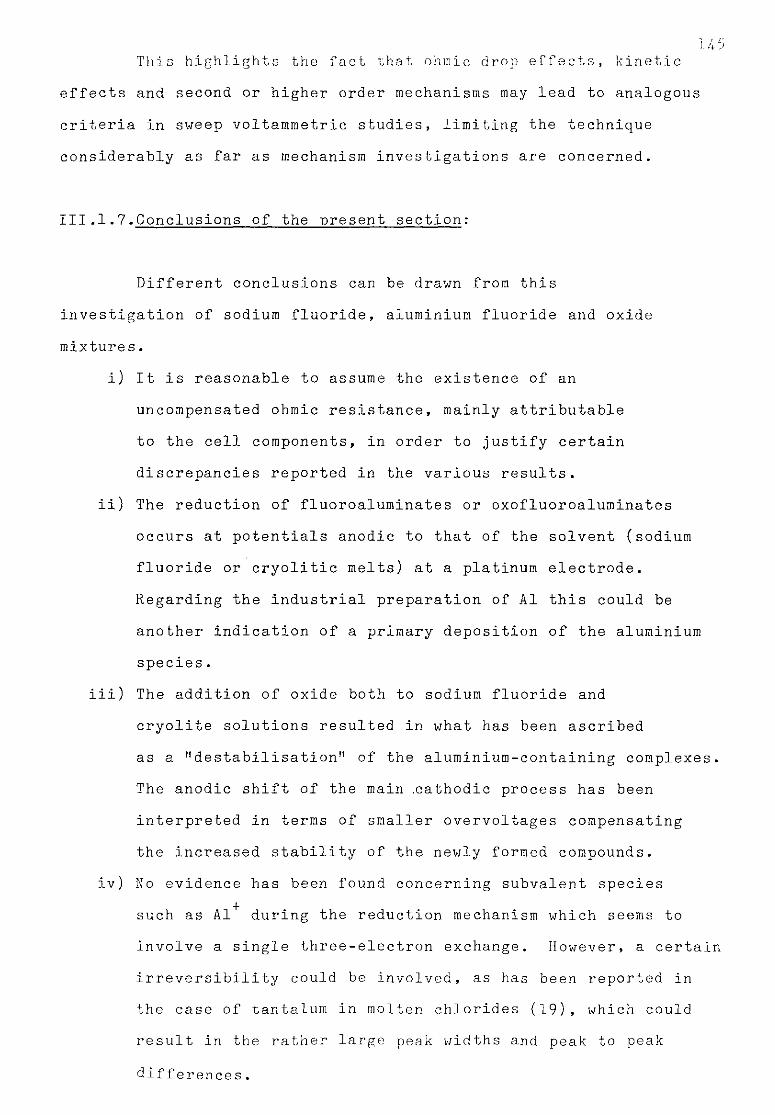
5 T h i s h i g h l i g h t s t h e f a c t t h a t ohinic d r o p e f f e c t s , k i n e t i c
effects and second or higher order mechanisms may lead to analogous criteria in sweep voltammetric studies, limiting the technique considerably as far as mechanism investigations are concerned.
Ill.1.7.Conclusions of the present section:
Different conclusions can be drawn from this investigation of sodium fluoride, aluminium fluoride and oxide mixtures.
i) It is reasonable to assume the existence of an uncompensated ohmic resistance, mainly attributable to the cell components, in order to justify certain discrepancies reported in the various results,
ii) The reduction of fluoroaluminates or oxofluoroaluminates occurs at potentials anodic to that of the solvent (sodium fluoride or cryolitic melts) at a platinum electrode. Regarding the industrial preparation of A1 this could be another indication of a primary deposition of the aluminium species.
iii) The addition of oxide both to sodium fluoride and cryolite solutions resulted in what has been ascribed as a "destabilisation" of the aluminium-containing complexes. The anodic shift of the main .cathodic process has been interpreted in terms of smaller overvoltages compensating the increased stability of the newly formed compounds,
iv) No evidence has been found concerning subvalent species such as Al+ during the reduction mechanism which seems to involve a single three-electron exchange. However, a certain irreversibility could be involved, as has been reported in the case of tantalum in molten chlorides (19), which could result in the rather large peak widths and peak to peak differences.
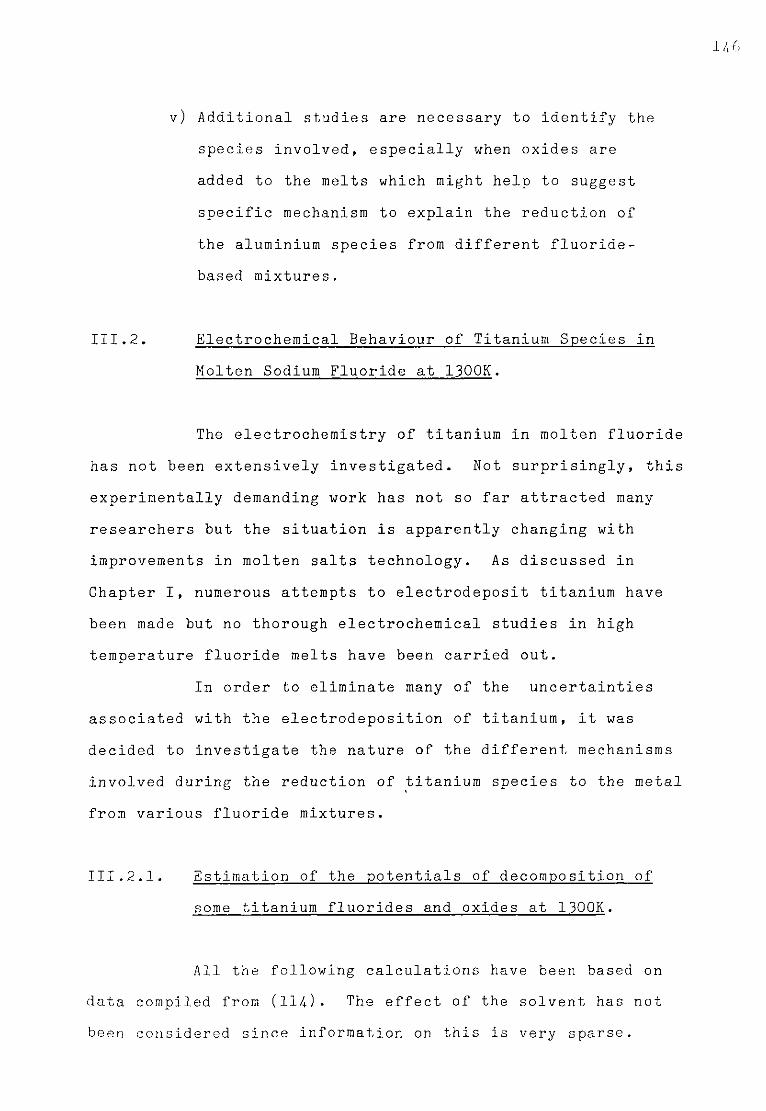
146
v) Additional studies are necessary to identify the species involved, especially when oxides are added to the melts which might help to suggest specific mechanism to explain the reduction of the aluminium species from different fluoride-based mixtures.
III.2. Electrochemical Behaviour of Titanium Species in Molten Sodium Fluoride at 1300K.
The electrochemistry of titanium in molten fluoride has not been extensively investigated. Not surprisingly, this experimentally demanding work has not so far attracted many researchers but the situation is apparently changing with improvements in molten salts technology. As discussed in Chapter I, numerous attempts to electrodeposit titanium have been made but no thorough electrochemical studies in high temperature fluoride melts have been carried out.
In order to eliminate many of the uncertainties associated with the electrodeposition of titanium, it was decided to investigate the nature of the different mechanisms involved during the reduction of titanium species to the metal from various fluoride mixtures.
III.2.1. Estimation of the potentials of decomposition of some titanium fluorides and oxides at 130QK.
All the following calculations have been based on data compiled from (114). The effect of the solvent has not been considered since information on this is very sparse.
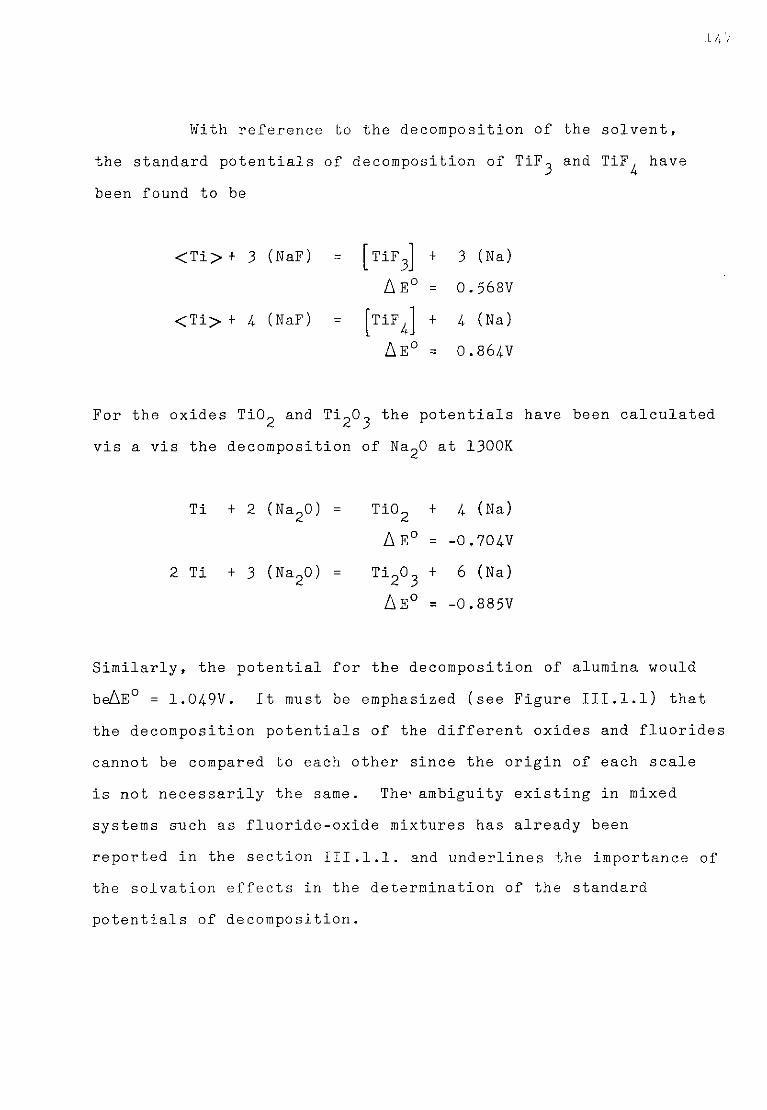
534
With reference to the decomposition of the solvent, the standard potentials of decomposition of TiF^ and TiF^ have been found to be
< T i > + 3 (NaF)
<Ti> + 4 (NaF)
[TiF 3. A E °
TiF 4. A E
+ 3 (Na) = 0.568V
+ 4 (Na) = 0.864V
For the oxides Ti02 and Ti^O^ the potentials have been calculated vis a vis the decomposition of Na^O at 1300K
Ti + 2 (Na20) = Ti02 + 4 (Na) A E ° = -0.704V
2 Ti + 3 (Na20) = + 6 (Na) A E ° = -0.885V
Similarly, the potential for the decomposition of alumina would beAE° = 1.049V. It must be emphasized (see Figure III.l.l) that the decomposition potentials of the different oxides and fluorides cannot be compared to each other since the origin of each scale is not necessarily the same. The' ambiguity existing in mixed systems such as fluoride-oxide mixtures has already been reported in the section III.1.1. and underlines the importance of the solvation effects in the determination of the standard potentials of decomposition.
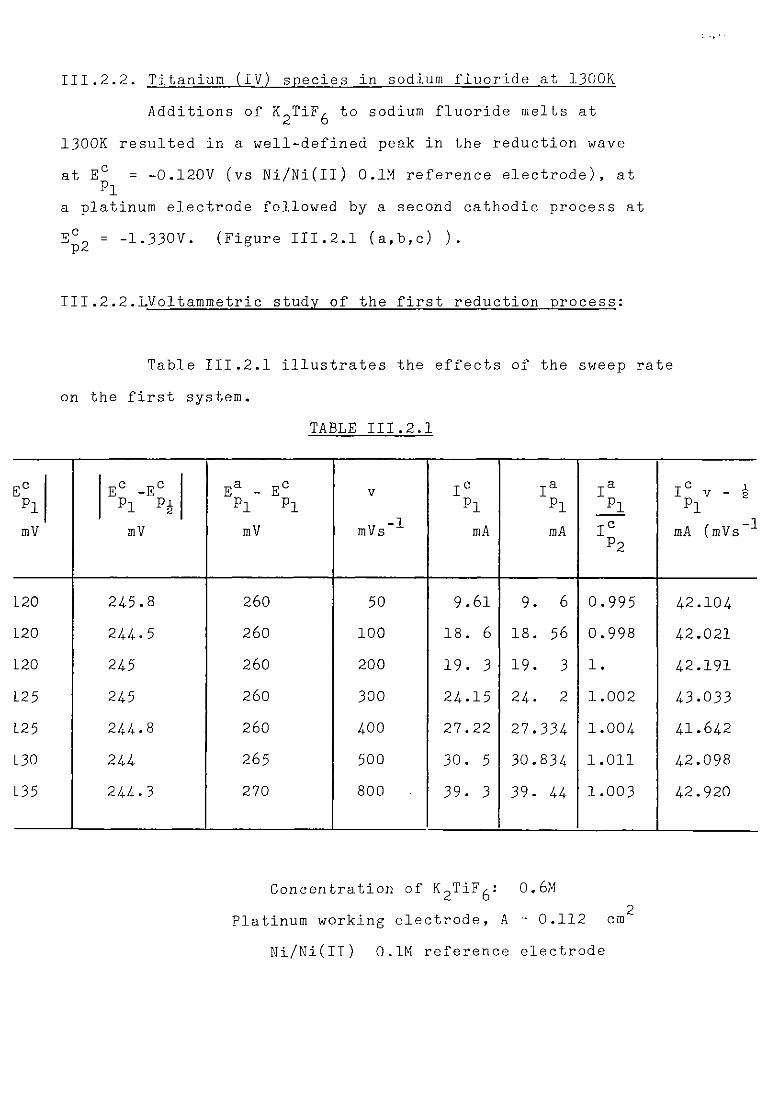
III.2.2. Titanium (IV) species in sodium fluoride at 1300K Additions of K~TiF, to sodium fluoride melts at 2 6
1300K resulted in a well-defined peak in the reduction wave
at Ec = -0.120V (vs Ni/Ni(ll) 0.1M reference electrode), at p1
a platinum electrode followed by a second cathodic process at e£2 = -1.330V. (Figure III.2.1 (a,b,c) ).
Ill.2.2.LVoltammetric study of the first reduction process:
Table III.2.1 illustrates the effects of the sweep rate on the first system.
TABLE III.2.1
Ec E c -E° E a - Ec V I c I a I a I C v - J P1 Pi P+ P1 p
l pl
pl
pl p
l
mV mV mV mVs~P mA mA I c p2
mA (mVs-"*
L20 245.8 260 50 9.61 9. 6 0.995 42.104 L20 244.5 260 100 18. 6 18. 56 0.998 42.021 L20 245 260 200 19. 3 19. 3 1. 42.191 L25 245 260 300 24.15 24. 2 1.002 43.033 L25 244.8 260 400 27.22 27.334 1.004 41.642 L30 244 265 500 30. 5 30.834 1.011 42.098
L 3 5 244.3 270 800 39. 3 39. 44 1.003 42.920
Concentration of K^TiF^: 0. 6M Platinum working electrode, A = 0.112 cm
Ni/Ni(Il) 0.1M reference electrode

. 33m/
- t 00 1 0 G m v c rn
Figure i 11 . . 1 i a , : 1
NaF-TiF^.
Platinum working electrode.
Ni/Ni(II) reference electrode.
Sweep rate l O O m V . s - 1 .
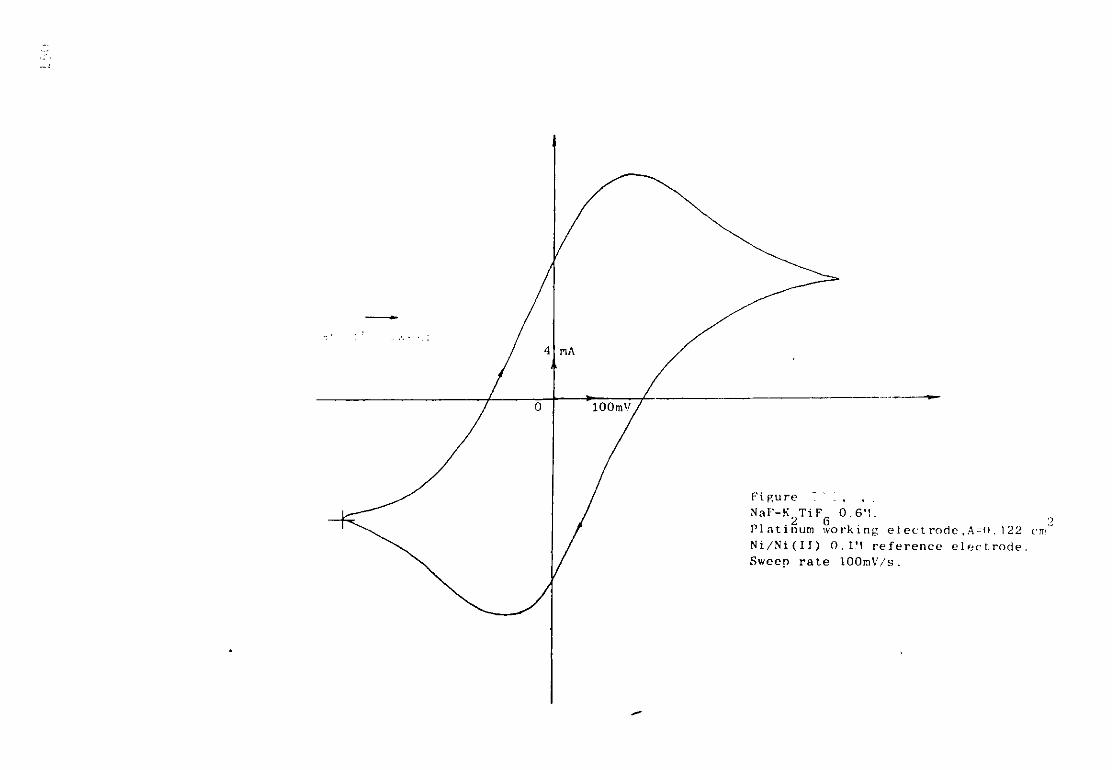
Fi gure 7 7 ! .
NaF-K TiF_ 0.6M. • 2 6 . Platinum working e 1 ect rode , A-<). 1 22 cm
Ni/Ni(II) 0.1,M reference electrode.
Sweep rate lOOmV/s.
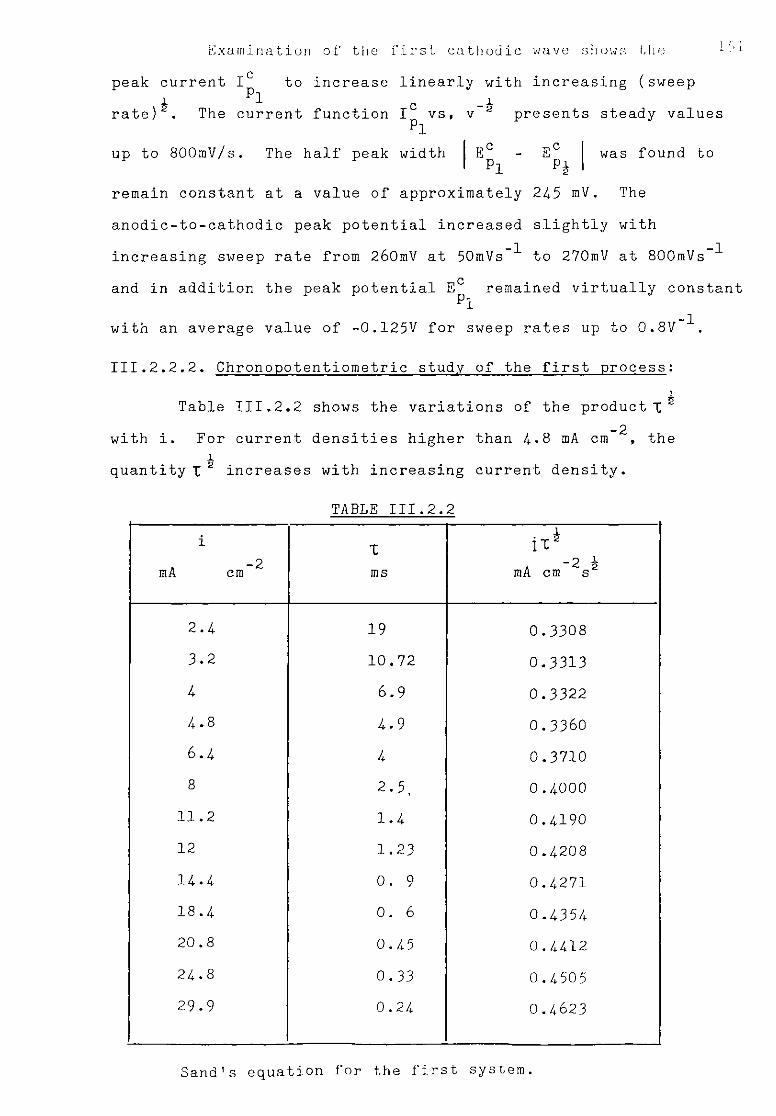
E x a m i n a t i o n of the first c a t h o d i c wave shows the ^ 1
peak current 1° to increase linearly with increasing (sweep i pi
rate)2. The current function vs, v~2 presents steady values
up to 800mV/s. The half peak width EC - Ec was found to pi pj
remain constant at a value of approximately 24-5 mV. The
anodic-to-cathodic peak potential increased slightly with - 1 - 1 increasing sweep rate from 260mV at 50mVs to 270mV at 800mVs
and in addition the peak potential E^ remained virtually constant
with an average value of -0.125V for sweep rates up to 0.8V \
III.2.2.2. Chronopotentiometric study of the first process:
Table III.2.2 shows the variations of the product! 2 -2 with i. For current densities higher than 1.8 mA cm , the
jl quantity!2 increases with increasing current density.
TABLE III.2.2 i i ! ix
-2 mA cm ms mA cm 2s 5
2.1 19 0.3308 3.2 10.72 0.3313 4 6.9 0.3322 1.8 1.9 0.3360 6.1 1 0.3710 8 2.5, 0.1000
11.2 1.1 0.1190 12 1.23 0.1208 11.1 0. 9 0.1271 18.1 0. 6 0.1351 20.8 0.15 0.1112 21.8 0.33 0.1505 29.9 0.21 0.1623
Sand's equation for the first system.

i 9 9
i L xs _ t2
The plot of E versus log ( r ) t2
line with a slope of -0.097, figure III.2.2. Current reversal curves have been recorded and led to the data assembled in the table III.2.3 (Figure III.2.3) for different values of the anodic and cathodic pulse length
and t respectively.
TABLE III.2.3
1 = 1 a c t = t a v ^c ^a Xc
mA mS mS mS Ta
0.5 10 7 2.4 2.916
0.6 10 5 1.7 2. 94
0.8 10 3.4 1.1 3. 1 1 7 2.5 0.8 3.125
1.4 5 1.4 0.55 2.545
Current reversal chronopotentiometry concentration of K^TiF^ 0.6m
2 platinum working electrode 0.10 cm Ni/Ni(ll) 0.1M reference electrode
tc It can be seen that the ratio of — remains close to three. a
III.2.2.3.Discussion
The behaviour of the ratio -- r u l e s o u t kinetic V 2

k (mv)

-xT
<h
Figure I T I . 2 . 3
Current reversal chronopotentiometry.

155
complications. The mean value of the peak width together
with the peak-to-peak potential and the quantity I n are _1
p/2 in good agreement with the description of a single electronic reversible system with formation of a soluble product.
An Ex has been estimated for this system; 2
Ei = 0.00/V(vs Ni/Ni(II) 0.1M reference electrode) (calculated 2
at 0.85 I (122). P For the same system, in fluoride at 773°C, Mamantov
et al (75) have found an Ei = 0.08V (Ni/Ni(ll) saturated) and 2
gave a value for the diffusion coefficient of Ti(lV) ions, D: 2.6 10~6 cm2 s"1.
If one assumes that the initial concentration of Ti(lV) has not varied during the experiment ( neglecting the dissociation equilibrium (K^TiF^) = F^J + 2 (K F) because of stabilization of the Ti(IV) species by complexation, see appendix 2) one can evaluate the value of the diffusion coefficient according to the expression
IC = 0.4-52 (nF)3/2 ,(Dv)2 A Co (RT) P
- 5 - 2 - 1
thus obtaining the value DI1.9 10 cm s , which is approximately tenfold that of Mamantov and coworkers. This could be explained in terms of errors made in the determination of the electrode area. A loss of solute would have the opposite effect.
Reporting the value of D previously cited in the i (JTD)
Sand's equation IX2 = nFCA — L with a value of n = 1 and A = 0.12 cm' i _ 2 1
one obtains iX2 I 0.223 mA cm s2 , against an experimental 0.33 2 i mA cm s2.
j.5<:>
i The increase of the product iT 2 with i has been
theoretically treated by A.J. Bard (148). The proposed model
is as follows:
ix = nF (TCD)* T 4 + ( c } A e + Q + n F p
av
where (C^-i) is "the average double layer capacity in the potential av
interval A E , and the amount of electricity required for oxide
film formation, Pis the amount of electroactive species adsorbed
on the electrode. At 1300K it is known that the platinum oxides
are unstable, therefore the term may be ignored.
The term (C^) can be roughly estimated using the av
data of Inman et al (150) on the double layer capacities at
a platinum electrode in KC1 LiCl: if one assumes that the
charging effect occurs in the first 50mVs, taking (C^^) 40 F cm" , / P av
one obtains (C, ) A E 210' C cm" . dl av i
The plot of iTversus I 2 (figure III.2.4) shows that for small current densities the usual Sand's equation is obeyed
and for higher current densities the interaction of the terms
(C^^) > A E and nF may be considered as significant in the av
measurements of the transition times. The iX intercept gives a
value of 1.6 10 ^ C cm / \ c KiSZa et al (149) predicted a ratio equal to 3
for a reversible process involving one electron and the
formation of a soluble product. The experimental value fits
this theory rather well.
Thus, in view of the results obtained in voltammetry
and chronopotentiometry, it seems reasonable to assume the
reduction Ti(lV) + e = Ti(lII) to a single electron reversible
reaction at a platinum electrode with the formation of a soluble

- 2 mA.cn ms
/ '
/ / /
5

product characterized by E^ = 0.04V vs (Ni/Ni(II) reference
electrode).
III.2.3 Study of the second cathodic process:
III.2.3.1.Chronopotentiometry and voltammetry
A scan rate investigation of this system (Table III.2.4) 1 C — g shows an increase of the quantity I v with increasing sweep
p2 rate. Mamantov et al (75) studying the same system in the entectic KF. LiF. NaF at 773K attributed this effect to an adsorption of titanium species on to the platinum electrode.
Q The peak potential E shifts cathodically with p2 increasing sweep rate. The half peak width, Ec - E c p2a 2
increases from 85mV at 50mV/S to 100 mV at 300 mVs"1. The potential peak separation also undergoes an increase with increasing the sweep rate.
TABLE III. 2.4
P2 mV
P2 mV
E' p2 mV
E C - EC p2/.
mV
Ec - E a p 2 p 2
mV
v
m Vs -1
v-2 P 2 -1 1 mA ( mVs )2
a p2
11.4 16 23 28.2
36.5
12 18.2 25.1 31.2 42
1450 1450 1470 1480 1490
85 90
100 100 100
100 120 180 250 270
50 100 200 300
500
50. 58 50. 6
51. 43 51. 48 51.618
1. 05 1.1375 1. 091 1. 106 1.1506
Concentration K^TiF, 0.6M 2 6
P l a t i n u m w o r k i n g e l e c t r o d e O.O/crrA
ia
ic
The anodic-to-cathodic peak current ratio p^ was c
greater than unity and showed random variation with increasing
sweep rate. Increasing the cathodic switching potential results
in an increase of the anodic peak height, the position of the
wave remaining virtually unchanged (Figure III.2.1 a and b).
In chronopotentiometric experiments when large
current (ij^6.4 mAcm ) densities were employed, the rising
portion of the curve in figure III.2.5 could suggest the
presence of a first transition time which could be explained
in terms of a preceding reduction. Let us consider the two
reactions below:
0 + n^ = r1 (1)
R1 + n2e = R2 ^ The relation between n^ and n^ and the two respective transition
times has been given in a previous paper (148). x 2 nn + no \
ti((-1 2) _l} = x
n l
Assuming that the reduction mechanisms of the titanate species
involve two steps of one and three electrons respectively, one
obtains = This could explain why the estimation of X^
was so difficult and poorly reproducible at high current densitie
One can measure both transition times together, considering an
overall process of four electrons with a concentration of 0.61M
of Ti(IV) and a diffusion coefficient of 1.9 10"5cm2 c"1. This i _2 i gives IX 2Z 0.909 mA cm S2 for an experimental value of 1.23mA
- 2 n h cm 'S2 . ( Table III .2.5)

160
Figure III . 2 . 5 Chronopotentiogram showing the presence
of two different transition times for large current densities.
I = 5mA, c
0.5V 0
0.2ms

TABLE III.2.5
i I X a
iXs
mA cm mA mS -2 h mA cm S2
36 4.5 1.2 1.2470
40 5 0.95 1.2330
44 5.5 0.77 1.2209 48 6 0.67 1.2424 52 6.5 0.57 1.2420
56 7 0.48 1.2270
Sand's equation for the second process at high current densities.
2 i An attempt to plot E versus Log( ^ ) h a S b e e n m a d e
t2
but was unsuccessful probably owing to the difficulty of measuring X as the current is increased.
III.2.3.2. Discussion
The results obtained at a platinum electrode for the second cathodic process do not exactly fit the description of the reversible deposition of either a soluble or an insoluble product.
c h The increasing of I vs v and the slight increase Po c ^
of I v a vs v indicate that the process is mainly diffusion-P2
controlled, but the increase of the peak-to-peak separation and peak width do not favour a reversible process.
Ec - E C
p2 p2 /2
The intervention of ohmic components may be and
certainly correspond better to the formation 1(_/ cl E 9 - E p p2
of soluble products. The theory indeed predicts a peak width a E - E = 2.2 = 24 6- 6 m V at 1300K leading to p p / nF n 6
2 value of 82.2mV for a three-electron system. Using the
c c experimental value of E - E = 93.7 mV, then n = 2.63. P 2 P2/ 2
As no other process has been observed during the reduction of titanium species, it is reasonable to assume that the final reduction is of the type Ti(IIl) + 3 e = Ti(0). Mamantov et al (75) reached the same conclusion in NaF-KF-LiF entectic at 753°K and assumed the formation of a soluble product due to.the solubility of Ti in Pt. It is of interest to note that titanium is known to form several intermetallic compounds with platinum such as Pt^Ti and Pt Ti (112).
Thus, on the basis of the formation of an intermetallic comppound between titanium and platinum and assuming a reversible reduction, an E^ for the Ti(lII) + 3 e = Ti(0) process can be
2 calculated from the expression (122)
Ep = Ei - 1.11 nF
E^ = -1.4-08V (vs Ni/Ni(Il) 0. 1M) may be suggested as characterising the final reduction of Ti(III) species. In the NaF-KF-LiF entectic, Mamantov proposed a value of -1.660V (vs Ni/Ni(ll) saturated electrode) which referred to the (Ni/Ni(ll) 0.1M) reference system, giving an even more negative value, -1.737 V.
550
An anodic dissolution conducted at -0.850V (vs (Ni/Ni(IIl) 0.1M) produced data, illustrated in the figure III.2.6 from which a mean number of electrons of = 2.5 has been calculated. Unfortunately, no more meaningful data have been estimated from a series of anodisation under the same conditions.
It has already been pointed out in Chapter 1 that there is actually no evidence for the existence of divalent titanium in pure molten fluorides (75). The reduction seems to proceed directly from Ti(IIl) to Ti metal. The small n value, estimated from figure III.2.6 has been attributed to the very poor reproducibility and the difficult stabilisation of the potentials after each anodisation.
III.2.4-. Effect of addition of oxide to the system Ti(IIl)/Ti
III.2.4-.1 Voltammetric Studies:
Figure III.2.7 shows the influence of additions of TipO^ in NaF melts to the last reduction wave. The different voltammograms obtained do not present the characteristic stripping peaks which were observed in the case of aluminium (see section III . l)
A single cathodic process is observed around -1.130V (vs Ni/ Ni(Il) 0.1M) with a corresponding reoxidation wave at -0.770V. These voltammograms do not show the well defined shape observed under similar conditions for the reduction of oxofluoroaluminates. The influence of increasing sweep rate upon the reduction system is given in table 111.2.6.

E F V)
3
i'i g u r e ~ I I •
Anodisation of a Titanium electrode.
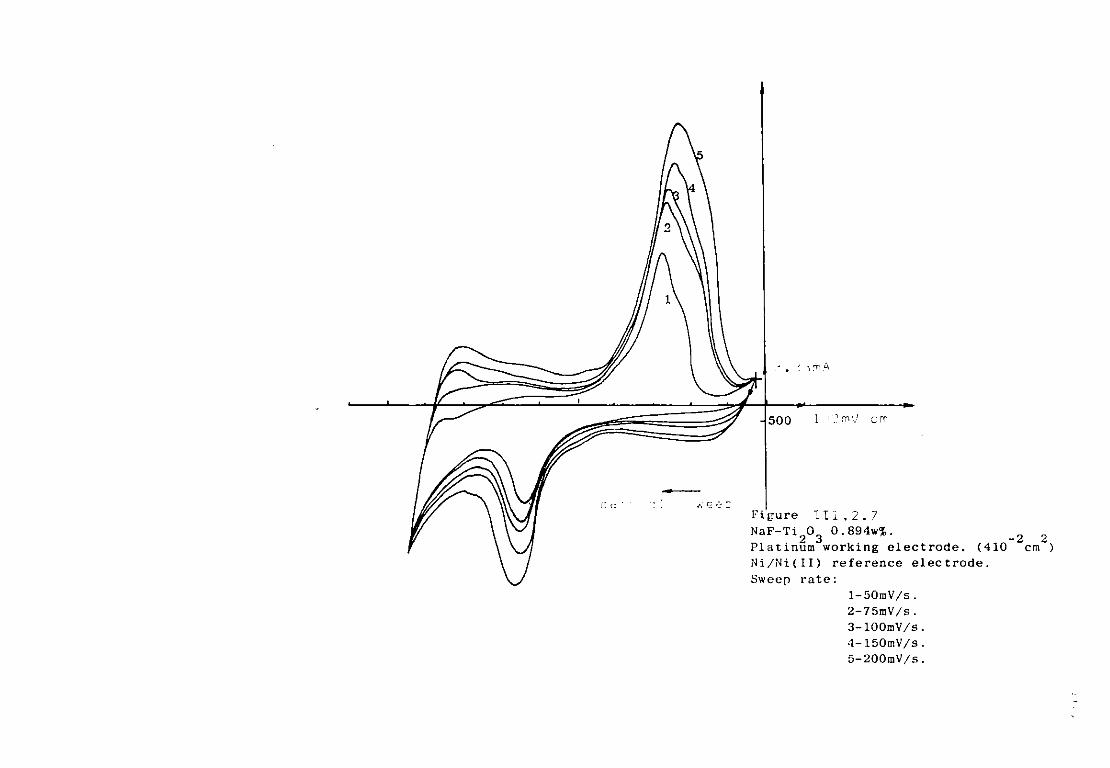
j ima
-500 1 : 7 m V cm
Figure 11i . 2 . 7
NaF-Ti^O^ 0.894w%. Q
Platinum working electrode. (410 cm") Ni/Ni(II) reference electrode. Sweep rate:
1-50mV/s. 2-75mV/s. 3- lOOmV/s. 4-150mV/s. 5-200mV/s.
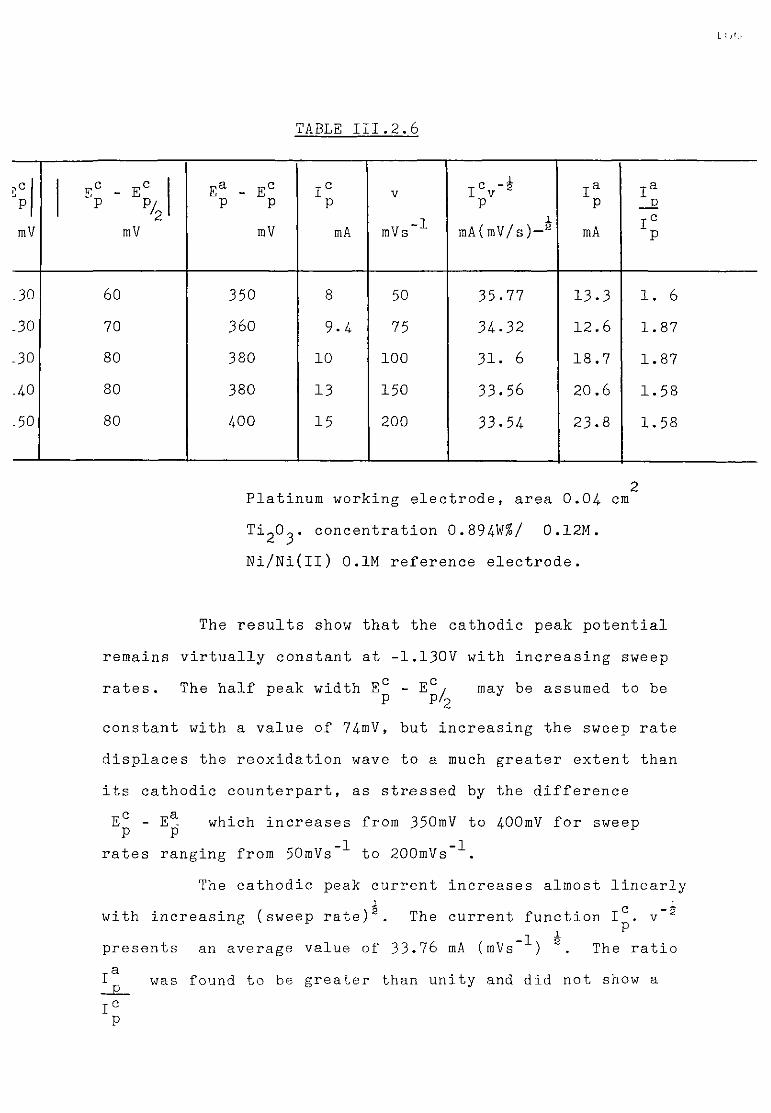
TABLE III.2.6
P c J
p
mV
E° - E C P P/ 2
mV
Ea - E C P P
mV
I c P mA
V
mVs~^
jc -4 I V p
mA(mV/s)—2
I a P
mA
I a
I c P
.30 60 350 8 50 35.77 13.3 1. 6 -30 70 360 9.4 75 34-32 12.6 1.87 -30 80 380 10 100 31. 6 18.7 1.87 -40 80 380 13 150 33.56 20.6 1.58 -50 80 400 15 200 33.54 23.8 1.58
Platinum working electrode, area 0.04 cm Ti^O^. concentration 0.894W$/ 0.12M. Ni/Ni(ll) 0.1M reference electrode.
The results show that the cathodic peak potential remains virtually constant at -1.130V with increasing sweep
c c rates. The half peak width E^ - E ^ may be assumed to be
constant with a value of 74niV, but increasing the sweep rate displaces the reoxidation wave to a much greater extent than its cathodic counterpart, as stressed by the difference
c a E - E - which increases from 350mV to 400mV for sweep p p ^ rates ranging from 50mVs ^ to 200mVs ^.
The cathodic peak current increases almost linearly i c _ i
with increasing (sweep rate)2. The current function I . v~2
-1 2 ^ presents an average value of 33.76 mA (mVs ) . The ratio a
Ip was found to be greater than unity and did not show a ic
167
characteristic trend as the sweep rate increased. / C C \ c A plot of log (I - I ) versus E was linear with
c c a slope of 50.05 over the current range of 0.5Ip to 0.91
(Figure III.2.8a). Examination of the ascending portion of c c
the wave results in a linear relationship between log^ - I ^ and ic
over the range 0.35 I C - 0.71C, (Figure III. 2.8b) with a slope P P of 14.7 (134).
III.2.4.2. Discussion
In analogous operational conditions, but in the absence of oxide, the final reduction of the Ti(lll) species had been reported around -1.450V, see section III.l. Recently, the system corresponding to this cathodic process was observed at -1.130V.
The reduction of the solvent on figure III.2.7 appears to occur approximately 150mV anodic compared to that recorded on the figure III.2.1. It is possible that the reference compartment contained oxide impurities which, as mentioned in Chapter IIf provoke similar effects. Subsequently, the reduction of the Ti(IIl) species resulting from the dissolution of Ti^O^ occurs 170mV anodic of that observed in pure fluoride melts.
According to (122) the formation of a more stable complex would have been accompanied by a cathodic shift of the reduction wave along the potential axis.
It is difficult to attribute the increase of the peak width definitely to an irreversible characteristic, or to an ohmic drop distortion, since an accuracy of + lOmV is expected in the determination of any one parameter of the

555
Figure III.2.8a.
c c c log(l -I ) versus E .
E°(V) -1.100

i 9 9
Figure 1 1 1 . 2 . 8 b log(I -I°)/I C versus E°. n
E°(V) -1 .050
170
recorded curves. Nevertheless, the significant increase a c
of the quantity E^ - E^ is beyond doubt and might reflect the kind of irreversibility observed for instance in LiCl-KCl with tantalum (l9).
The reversible reduction at a solid electrode where both product and reactant are soluble is described by the c c c nF linearity of log^ - I ^versus E with a slope of 0.58 ^
ic
c c in the current interval 0.35 I to 0.71 . The slope of the p p F
figure III.2.8b leads to an n value of 2.84. Assuming the / •» r* product to be insoluble, the slope of the plot log( I - I ) P c F
versus E is 2.2 — . The Figure III.2.8a produces a slope RT
which corresponds to an n value of 2.55. Q Since the ratio I remains virtually constant it
-s V S
is reasonable to consider this cathodic process diffusion-controlled with no major kinetic complications.
It has already been pointed out in the previous section that certain "solubility" of titanium in platinum has to be considered (75). In view of the different results observed in the present work and on the basis of such a solubility, an E^ may be estimated, Eil-1.238V (vs Ni/Ni(IIl).
2 2
0.1M reference electrode. Nonetheless, this estimation does not reflect the behaviour of the peak-to-peak potential difference (Table III.2.6) with increasing sweep rate. (54) has reported the formation of insoluble Ti(III) species; it is possible that during the reoxidation of the product of the reduction, the limit of the solubility of the Ti(IIl) complexes could be reached giving rise to a zone of saturation around the electrode or the formation of a thin layer of insoluble compounds. It is also possible that large oxyanions will be formed
during the dissolution of Ti^O^. The activity of the oxofluoro-species will therefore increase in the vicinity of the electrode causing a local increase of the p0~~ and a passivating layer as mentioned above may therefore result from the precipitation of oxyfluorocomplexes of Ti(III). In terms of uncompensated ohmic resistance it is possible that ohmic components which are difficult to detect may result from such a situation. The poor definition of the chronopotentiograms obtained with this system precluded meaningful results probably because of the proximity of the reduction of the solvent cations.
III.2.5 emf measurements in sodium fluoride Ti 0 mixtures
The following cell was investigated:
Ti NaF
TiF.
NaF
Ti2°3
Ti
j unction
The junction was a boron nitride diaphragm impregnate with soddum fluoride. It has already been pointed out that th junction potential can be ignored owing to the high value of the transference number of the sodium cations. (see section II .1.5.1) .
For different concentrations of Ti^O^ in sodium fluoride the following results were recorded.

TABLE III.2.7
CTiFp CTi 0 * Wt%
E mV
Observation
1.99(0.36M) 0.5 1501
120 110;
126
1(0 .134-M) 280) 300 305 270>
'288.75
1.8 solubility problem
Considering a solution of lWt$ of Tl^O^ the redox potential of the system Ti(IIl)/Ti is 288.75mV positive to that in oxide free melts. In view of the low concentration of Ti(III) in each compartment of the cell, it is very difficult to express this potential difference in terms of the consumption of fluoride ions as has been suggested for cryolitic melts (see section III.1.6). One can, of course, speculate on the possible cause of this result such as the intervention of two basically different electrochemical equilibria in each compartment of the cell.
The Titanium (III) ions in molten fluoride are very likely to possess an octahedral or tetrahedral structure (185).
It is, therefore, reasonable to postulate the following equilibrium between the two complexes (127).
TiF/~ = TiFT + 2F~ (l)
This reaction is very similar to that considered in the case of
the fluoroaluminates (see previous section III.1.6)
For a titanium electrode the electrochemical reduction
process is as follows:
TiF 3- + 3e Ti + 6F' ( 2 )
with „ ^o RT T E = E + Log a( tif^")
a ( F " ) 6
By introducing Ti^O^ instead of TiF^, it is unlikely that a
similar equilibrium as (1) could be established in the melt
leading therefore to a different electrochemical reaction
from (2) .
Whatever the oxofluoride complex is, the electrochemical
reaction could involve an exchange of a certain number of 0"~ or
F particles achieving a more positive potential. As was the
case in the cryolitic melts with the dissolution of alumina, the
dissolution of Ti^O^ in sodium fluoride produces structural
species, the identification of which is necessary in order to
suggest a definitive mechanism.
The other possibility is the formation of a passive
layer following the introduction of oxides. This layer could
consist of titanium oxides in a similar way to that described by
(110) in the case of nickel electrodes. This hypothesis could
also explain, to some extent, the large potential difference
between the cathodic and the anodic waves during sweep
voltamraetric experiments.
It has been observed that the titanium electrodes
showed scute signs of corrosion after the experiments. In melts
containing more than of Ti^O^ we even noted a complete dissolution of the titanium rods used as electrodes. The electrodes were also attacked to a certain degree in pure fluoride solutions.
It has been suggested that the high oxygen content of the titanium rods was at the root of this phenomenon, (1000 to 1500 p.p.m) and that heating under vacuum resulted in deeply oxidised titanium electrodes. For this reason, high purity titanium wires (0 concentration 900 p.p.m.) were used. It did improve the corrosion resistance of the electrodes but they were still deeply corroded which can probably be attributed to a pitting of the metal by localized oxide formation.
III.2.6. General discussion
For cryolite melts containing 5 to 8Wt% alumina, which is approximately the composition of the industrial cells, it has been found that the reduction of the aluminium species at a platinum electrode occurred at an average potential of -1.453V versus the nickel (II)/Nickel reference electrode.
In sodium fluoride, the reduction of Ti(III) species resulting from the dissolution of' Ti^O^ has been reported at -1.280V versus the same reference. In a direct comparison of the two systems, there is a difference of 173mV in favour of the reduction of the Ti(III) oxocomplexes, but in fact this
difference lessens with decrease in the ratio n A1FQ ( ^ ) nAlF^+nFaF } '
It has been observed in a sodium fluoride 1.5M Al^O^ solution that the reduction appeared at -1.250V," thus as far as the

175
respective potentials of reduction are concerned, it seems that the cryolitic mixtures have more advantages for the reduction of the Ti(lII) species than the sodium fluoride-alumina mixtures. This could be attributed to a change of the overvoltages or to a variation of the activity of the particle F~, especially if the oxide concentration is rather high. Nonetheless, it is still too early to propose a definitive mechanism for the reduction of Ti(IIl) from molten fluoride-oxide mixtures.
The sharp anodic peak of the figure III.2.2 was considered at first to be an indication of the formation of an insoluble product but, on the contrary, the figure III.2.8b seems to reinforce a scheme involving the formation of a
EC - EC/ P P/o and soluble product, and the large values of c a
E - E do favour such a model. P P Taking into account a possible uncompensated ohmic
resistance, due presumably to large variations of the activity of oxospecies at the vicinity of the electrode, the interpretation of the different results becomes even more complicated and inconclusive.
Considering now a more applied aspect of the situation described above, the use of cryolitic melts could be benefi-cial for the reduction of the Ti(lll) species. Namely, this reduction is governed by the relative strength of the acids Al(III) and Ti(IIl). It has been reported in section III.l that aluminium cations were strong acceptors of F~ particles and this effect is even more pronounced with additions of alumina. The high reactivity of titanium species with oxygen to form oxyanions demands electrochemical characterisation of these
i- / ';
complexes in the melt system and consequently, further electrochemical study is required.
III.2.7. Electrodeposition of Titanium from Ti^CU/NaF mixtures at 1300K
The electrolyses have been conducted potentiostatically in batches of 150g to 300g of melt under dry argon using mainly nickel or vitreous carbon crucibles. The usual three-electrode system has been considered except in the case of electrolysis of large quantities of melt where a two-electrode set up has been preferred (see III.2.7.4-). The reference electrode was contained in a boron nitride compartment as described in the chapter II.
Owing to solubility problems, it has been extremely difficult to reach concentration higher than 3.5$ of Ti^O^ in molten sodium fluoride at 1300K. By quenching melts containing 4. to 5Wt$ of Ti^O^, it has been observed that the concentration of titanium oxide in the lower part of the melt was much greater than that in the upper, even after 6 hours at 1300K. X-ray analysis conducted on those insoluble compounds showed evidence of undissolved Ti203 and produced many lines which did not correspond to any listed Ti(IIl) species, or other compounds compatible with the initial components of the melt.
In t h e p r e v i o u s s e c t i o n i t h a s b e e n e m p h a s i s e d t h a t
t h e i n t r o d u c t i o n of o x i d e i n t o s o d i u m f l u o r i d e m e l t s w a s
c h a r a c t e r i s e d by a r e d u c t i o n p o t e n t i a l of the t i t a n i u m s p e c i e s
m o r e a n o d i c t h a n in t h e c a s e of p u r e f l u o r i d e s . T h i s a n o d i c
d i s p l a c e m e n t b e i n g of t h e o r d e r of + 1 7 0 m V , the e l e c t r o d e p o s i t i o n
177
of titanium from such solutions seemed a priori conceivable. Different operational parameters have been considered:
the electrolysis potential, the influence of the nature and shape of the cathode, the concentration of solute, and the stirring of the solution.
The pretreatment of the substrate prior to the electrolysis step is of prime importance. The lack of correct pretreatment will result in poor adhesion (or complete absence) and, as the requirements for product performance becomes more stringent, so the methods of pretreatment must become more rigorous. Ideally, the condition of the surface prior to entering the electrolyte should be as follows:
(i) free from significant oxide or other surface films (requiring subsequently a surface polishing),
(ii) free from gross surface defects, (iii) of uniform appearance, (iv) free from excessive amounts of dissolved gas, (v) free from grease or oil which could produce a
thin film of carbon at high temperatures. Therefore, before each experiment the electrodes were highly polished, as far as their respective shapes would permit, with a good me'chanical polisher, washed thoroughly with acetone and chloroform and finally stowed in the dry box. The condensed table III.2.8 gives the different results associated with various operational conditions.
III.2.7.1 Structure of the different coatings:
Figure III.2.9 represents a nickel plate cathode
178
coated with a more or less even layer of titanium. The deposit has a fine grained structure and it has been observed that a change in this structure occurred as the potential became more cathodic on increase of growth rate (Figure III.2.10). The structure, as observed under the optical microscope, is very granular showing a large proportion of occluded melt. However, this fine structure is not always produced: in the case of an iron cathode (very low C content) the coating was dendritic (Figure III.2.11a and Figure.2.lib) and needle-like even when the potential is not as negative as in the case of the figure III.2.10. In order to minimize this dendritic growth, an alternating potential has been imposed. The electrolysis
was started at Ee = E^ - lOOmV and maintained at this value 2
for 50 to 500 s then switched back to zero for 10 to 100 s. During this time high purity argon was bubbled into the melt in order to homogenize the concentration thus providing an external stirring of the solution.
The most interesting result has been obtained with pulses of 120 s. and 4-0 s. respectively. But even then a significant growth of short dendrites could be seen, very similar to those illustrated by the photograph III.2.10 on nickel.
On platinum, the coatings had a fine structure but sometimes with isolated nodules: Figure III.2.12 illustrates these nodular features on platinum flag electrode. The occurrence of the nodules is believed to be related to the surface topography of the electrode and prolonging the time of electrolysis the nodules disappeared and the structure became more granular, figure III. 2.13-
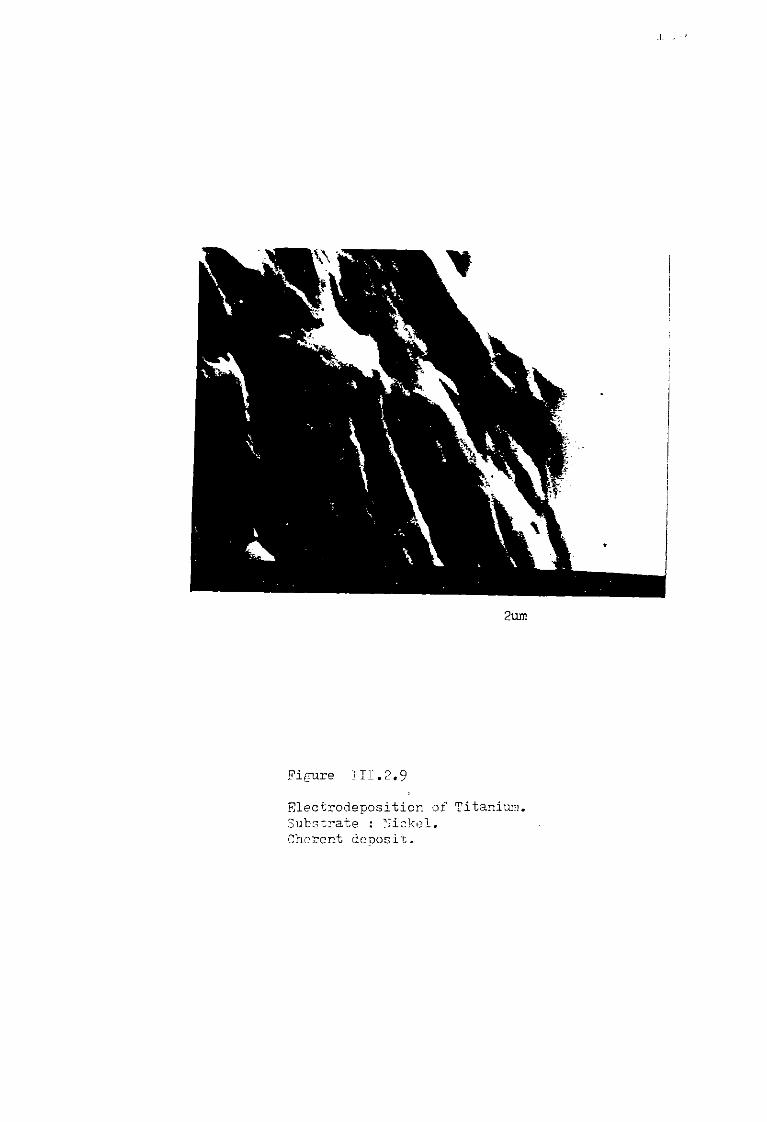
2um
Figure JII.2.9 )
Electrodeposition of Titanium. Substrate : Nickel. Oherent deposix.
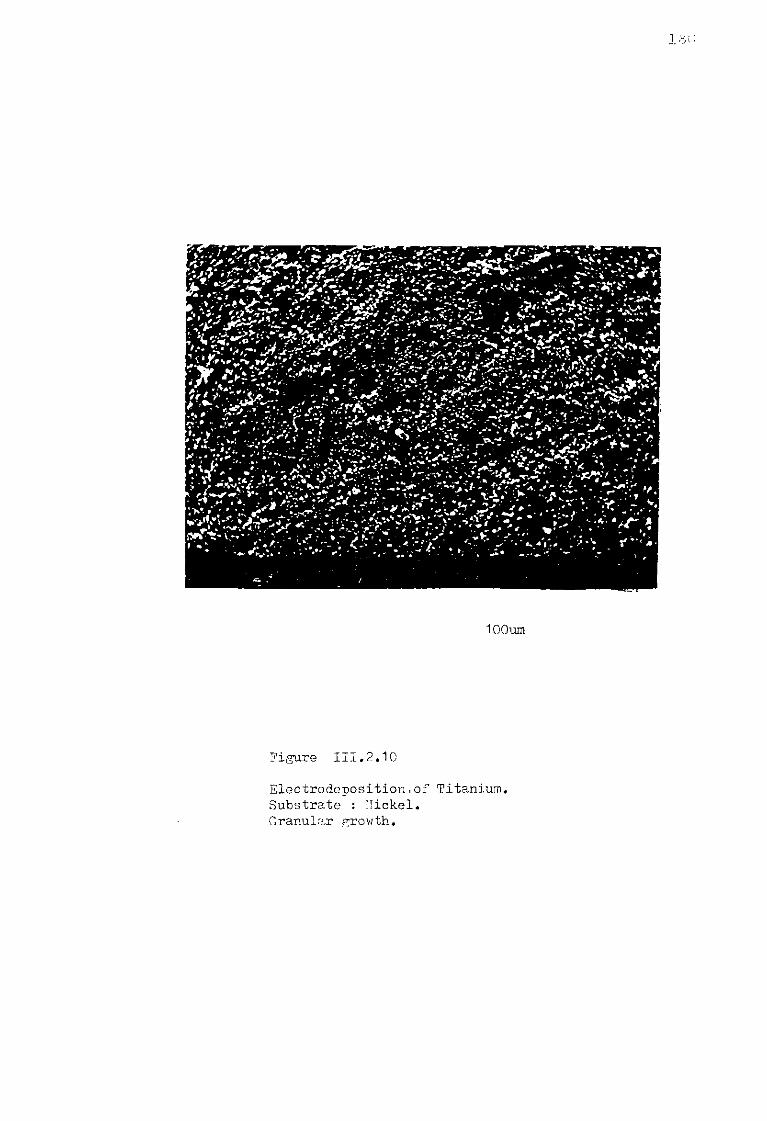
1 oil
100um
Figure III.2.10
Electrodeposition.of Titanium. Substrate : Nickel. Granular growth.

20um
Figure III.2.11a
Electrodeposition of Titanium. Substrate : Iron,, NaF-Ti 0„ 1.95 wtv .

2um
Figure III.2.11b
Electrodeposition of Titanium. Substrate : Iron! ?IaF-Tio0 1 .95 w-tf . Dendritic growth.

Table III.2.8
Pictuic i Run
Concentration Ti.O. 2 a W°i>
Cathocfc area
-> era"
Substrate
E
e
mV
Coulombs
Thickness
ym Adhesion Purity
Current eff ic iency
0 0 Crucible Deposit.
i 1 2 nickel flag El/2 " 5 0 ~ 90 12 good 99 90 VC Coherent
V. 9 2 2.5 2.6 nickel flag E 1 / 2 - 100 800 100 good ~98 88 .Vi- Coherent
V.10 3 2.5 3 nickel flag h/2 - 2 0 0 800 - 8 0 good .96 81 VC Granular
V . 11 a V.llb
4 1.93 2.4 iron rod El/2 " 5 0 708 / poor / 89.2 VC Dendri tie
5 2. 2 2.6 iron rod El/2 " 1 0 0 805 poor / 93.8 Ni Dendr i t ic
6 2.5 2.2 iron rod El/2 " 2 0 0 832 / poor / 94.8 Xi Dendritic
V. i: 7 ? 1.8 platinum flag El/2 " 5 0 68.5 - 9 to 12 good / 89.3 VC Nodu1ar
V. 13 8 3.5 2 platinum flag El/2 " 1 0 0 395 70 good 98.5 96.4 Ni Coherent
9 2 2 1.92 tungsten rod E 1 / 2 - 50 465 / / VC DenJr i tic;
10 2.5 2.1 tungsten rod El/2 " 1 0 0 625.3 / poor 95.8 Ni Dendrit it •.
11 3.5 3.2 Ti rod El/2 " 1 0 0 1550 / no adhesior / 97.9 Ni Dendri t ic
El/0 - -1.08V j
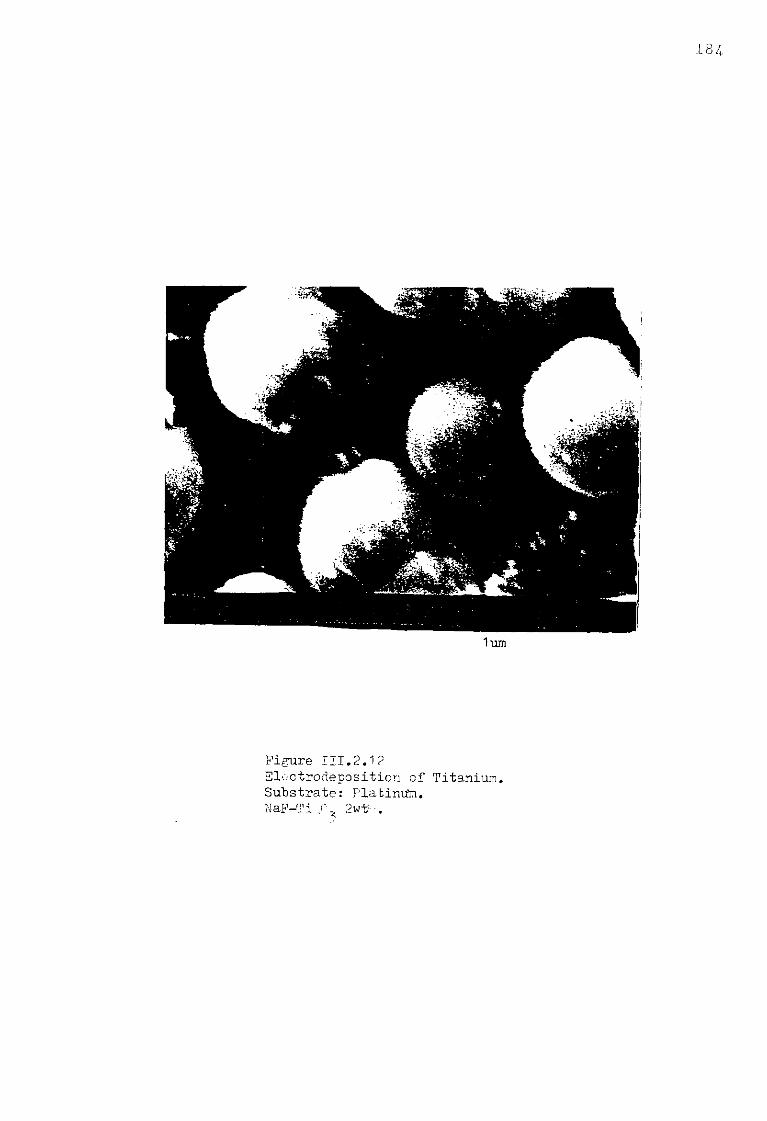
18/,
1um
Figure III.2.1?
Eloctrodeposition of Titanium. Substrate: Platinum. NaF-Ti r 2wt--.
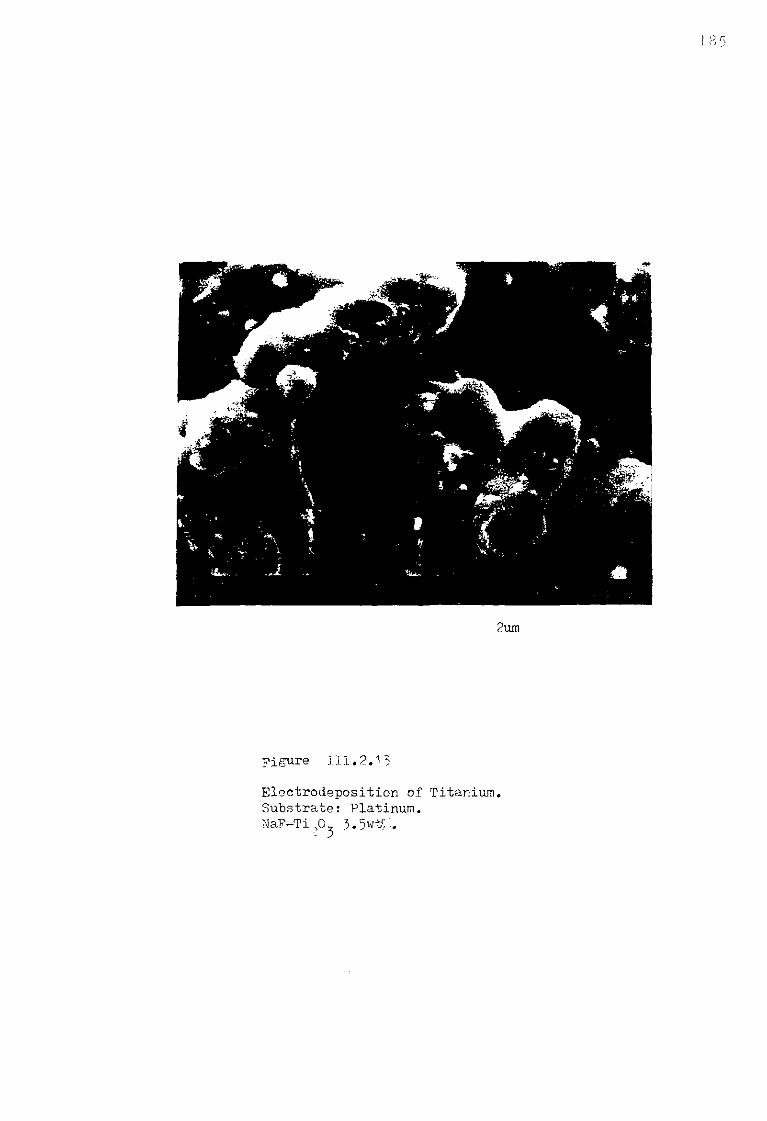
2um
Figure H I . 2 . 1 5
Electrodeposition of Titanium. Substrate: Platinum. NaF-Ti,0 % 5 w t A .
1- 8 6
III.2.7.2. Adhesion:
Coating adhesion is an important property which in practice is difficult to measure with any accuracy. In many cases a qualitative test is employed. Simple tests involve electroplating test flag electrodes and subjecting the test electrodes to bending or filing. Other qualitative tests include thermal shock, temperature cycling, drilling of a blind hole in the layer and then pushing the coating with a rod inserted in the hole until cracking of the coating occurs. The only test performed in this study was to submit the electrodes to bending and this gave some qualitative measures of relative adhesion.
The ability of the deposited metal to adhere to the substrate is governed by the strength of the surface coating interface. In the case of the iron cathode, a film of metal fluoride and oxide forms between it and the subsequently deposited titanium, giving a very poor adhesion. This was observed by X-ray analysis after flaking off from the substrate. This lack of adhesion has not been observed with nickel or platinum substrates in which the surface coating interface is strongly reinforced at 1300k by the ability of titanium to form an intermetallic compound.
III.2.7.3 Surface finish and purity.
important additional
The surface finish of the deposited titanium is since ideally in thin coatings it should not require polishing. The surface finish is obviously a
function of the structure of the deposits. On the nickel plates on which the best structures have been obtained, a smooth surface has resulted when the thickness did not exceed 20 to 50 m. For thick coatings, the state of the surface deteriorates to produce a granular and even dendritic structure as the time of electrolysis is increased.
Generally, the purity of the washed deposits was in the range of 81 to 97% determined by electron scan microprobe analysis. The major impurities have been oxygen and sodium probably originating in occluded melt. In dendritic deposits even after an acidic leaching (HF and HCl) occlusions of melts could still be observed under the optical microscope.
On platinum substrates, small particles of occluded melt have been noticed, even in the case of coherent structures, making the deposits extremely brittle.
III.2.7.4. Large scale electrolyses.
Large scale electrolyses have been carried out using a simple two electrode system. The anode was a graphite rod (25m/m diameter) positioned at the centre of the crucible. The cathode was a stainless steel, plate or semi-cylindrical electrode in order to minimize the effect of a assymmetrical current line distribution. An argon bubbler was introduced in some experiments as a stirrer.
Baths of 1000 to 1500g of sodium fluoride were contained in nickel graphite or stainless steel pots, the concentration of the solute ranging from 2.5 to 5Wt%. To maintain the level of the concentration as constant as possible, additions of pellets of Ti90^ have been used.
Unfortunately, the rate of dissolution was too slow to improve the profile of the concentration gradient even by using the argon bubbler: practically undissolved pellets have been recovered after two hours in the melt. In the light of these observations it was decided to mix intimately Ti^O^ and the sodium fluoride inside the dry box prior to melting.
Using a graphite anode and a nickel cathode Monier and Grandjean (138) have measured the decomposition voltage of different oxides in molten cryolite by the potential decay. The same method has been considered to estimate the decomposition voltage of Ti^O^ in sodium fluoride at 1300K at a stainless steel cathode. This method consists of applying a constant current pulse for a few seconds to establish the electrolysis potential at this particular current and switching off the current to eliminate the I.R. drop. The potential decay curves in general exhibited only one plateau.
By plotting the two sets of results (Figure III.2.14) one can obtain an estimation of the quantities E +7] - 71 + RI
e 1 a 1 c and E q
+ T) a ~ 7]c« The extrapolation of both straight lines gives the potential E^, which can be interpreted as the effective potential for the decomposition of the oxide. This value is generally different from that calculated by the variation of the free energy occuring during electrolysis (E^).
From Figure III.2.14 Ed is estimated at 1.270V. Compiled from (114) the decomposition voltage corresponding to the reaction 2 < T i 2 0 3 > + 3<C> = 4 <Ti> + 3 (C02) is E-fc = 0.987V. Nevertheless, it must be emphasised that the accuracy of the measurements leading to figure III.2.14 does

A . cm h
0.5
0.4
0.3
0.2
1.270 1.5
Figure I I I . . .1 1
Decomposition voltage of Ti 0 . ^
Stainless steel cathode (o.2 cm ).
Graphite anode.
h-1 oo
190
not give a precise determination of Ed but a rough estimation
of the electrolysis voltage. At potentials below 1.6V no deposits were obtained
even if the anode showed apparent signs of corrosion and a certain number of coulombs had been passed proving that an electrochemical reaction had taken place (CO or CC>2 evolution ?) The value of 1.6V was then selected for the electrolysis on a
stainless steel cathode corresponding to a starting current of -2 4.00 to 4-50 m Acm . After a few minutes of electrolysis, the
_2 current reached a value of 250 to 200 m Acm . This current decreased steadily over approximately two hours, reaching a
_2
value of the order of 100 m Acm and not showing any signs of decrease afterwards.
The efficiency of the deposition of titanium, calculated on the basis of the number of coulombs passed during the electrolysis and the mass of metal obtained was only of the order of 33.3$. This result suggests that nother process could well be involved. Revazyan (81) has already pointed out the possibility of the involvement of the sodium ions in the electrodeposition of aluminium, presumably caused by the accumulation of NaF near the cathode. Codeposition of sodium may occur as a pararitic reaction due to the NaF enrichment, the cathode becoming saturated with sodium and some eventually moving into the melt and reducing the titanium complex. It was then decided to increase the current of electrolysis by increasing the applied voltage, even at the expense of an increased intervention of the sodium ions, and to stir the solution by bubbling argon during the experiment. At 1 .75 V a better efficiency was obtained viz 4-8.6$. From this value of 1.75V a further increase of the voltage (or even
the solute concentration) did not produce better efficiency. In addition, all deposits have been of dendritic structure and very difficult to separate from the melt, leading to very complex purity determination. A further development would be to investigate the effect of a liquid cathode which could require a lower potential of electrolysis due to the depolarization which corresponds to the change in free energy by alloying Ti and the metal of the cathode. However, at present, no attempt has been made in this direction and this question needs a careful investigation.
III.2.7.5. Conclusions of the present section:
It has already been reported in section III.2.4 that the effect of additions of titanium oxide to sodium fluoride melts was an anodic shift of approximately 170 mV with respect to the reduction of the solvent at a platinum electrode. In view of this observation, it was thought that the electrodeposition of titanium from sodium fluoride oxide melts was more favourable than from pure fluoride mixtures, but unfortunately the electrodeposition of titanium from Ti^O^ - NaF mixtures at 1300K produced disappointing results. The absence of a kinetic step in the overall mechanism is probably responsible for the dendritic structure obtained in the great majority of the deposits, but as far as plating is concerned, interesting results have been obtained on nickel substrates. Scaled-up electrolysis on stainless steel cathodes led to dendrite formation as well as traces of powdery metal attributed to a codeposition of the solvent alkali metal. The
separation of the deposited metal from the melt was rather difficult owing to a large occlusion of melt.
It should be noted that, in the Kroll process with magnesium metal, the reaction between TiCl^ and Mg produces finely divided metal, mixed with salts, which collects at the bottom of the crucible. Each particle becomes coated with magnesium and magnesium chloride. The solidified product is a cake consisting of approximately 60 to 70 W % of Ti. This product is therefore pyrophoric and requires further purification by vacuum distillation or leaching (Appendix 3).
The coarse dendritic titanium deposits obtained during the large scale electrolysis certainly had a better morphology and were non pyrophoric, and the superficial entrained salt could be separated from the metal by leaching with acidic solutions. However, the occluded melt cannot be washed away easily and contributes greatly to lowering the overall purity of the deposited metal. The only major disadvantage is the poor solubility of Ti20^ in sodium fluoride and it would certainly be worth investigating other possible solvents for Ti^O^, such as cryolitic melts. In fact, Ti^O^ is not the most convenient solute and it would have been*far more advantageous for industrial purposes to base a process on TiO^, but unfortunately the presence of Ti metal and Ti(IV) species at 1300K leads to disproportionation reactions of the type: Ti + 3Ti(lV) = 4Ti(lIl). As far as electroplating is concerned, such a process is certainly not wholly satisfactory but with regard to the electrowinning of titanium, the purity of the deposits and their structure are
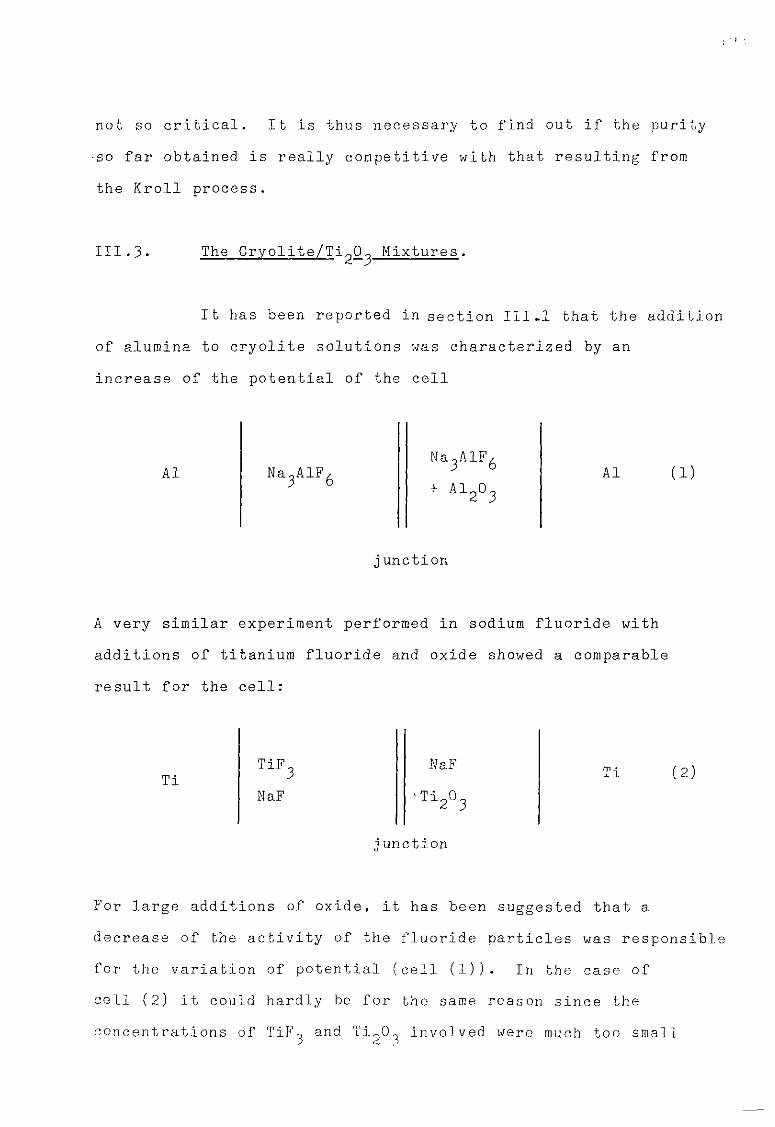
not so critical. It is thus necessary to find out if the
•so far obtained is really competitive with that resulting
the Kroll process.
purity
from
III.3. The Cryolite/Ti^CU Mixtures.
It has been reported in section III.l that the addition
of alumina to cryolite solutions was characterized by an
increase of the potential of the cell
A1 na3alf6
na3alf6
I A I 2 O 3
A1 ( 1 )
junction
A very similar experiment performed in sodium fluoride with
additions of titanium fluoride and oxide showed a comparable
result for the cell:
Ti TiF.
NaF
NaF
Ti2°3
j unction
Ti (2)
For large additions of oxide, it has been suggested that a
decrease of the activity of the fluoride particles was responsible
for the variation of potential (cell (1)). In the case of
cell (2) it could hardly be for the same reason since the
concentrations of TiFQ and Ti 0 o involved were much too small

194
to induce large pertubations of the activity of the F ions.
A local passivation has been invoked tentatively to explain
this phenomenon (see section III.2).
III.3.1. Voltammetric Study of the Cryolite-Ti^O^ Solutions:
The figure III.3.1 shows the voltammogram of a pure
cryolite melt at a platinum electrode. No well defined cathode
system is visible, apart from a very sharp peak prior to the
reduction of the cryolite. This sharp peak has already been
reported in NaF-AlF^ mixtures (see section III.l). The cathodic
limit of the solvent is estimated to be around -1.500V vs Ni/Ni(ll)
0.1M reference electrode.
The figure III.3.2 presents the effect of the addition
of Ti^O^ to pure cryolite. A single wave is visible at -1.250V.
In section III.2 the cathodic process attributed to the reduction
of the Ti(IIl) oxospecies in NaF was reported at -1.280V. In
cryolitic melts the reduction of the oxofluoroaluminates was
recorded around -1./50V, depending upon the alumina concentration
(see section III.l). It therefore seems reasonable to identify
the cathodic wave at 1.250V, following the addition of Tin0o in
cryolite, as the reduction of the'Ti(III) species.
The absence of a cathodic peak at -1./50V indicates
that no oxofluoro-complexes of aluminium have been formed and
could be interpreted in terms of relative strength of the acids
Al(III) and Ti(lII). Thus it appears that the complexes resulting
from the dissolution of Ti^O^ are stronger acceptors of 0
particles than those which would have followed additions of
Alo0o, but it could also mean that the eventual aluminium
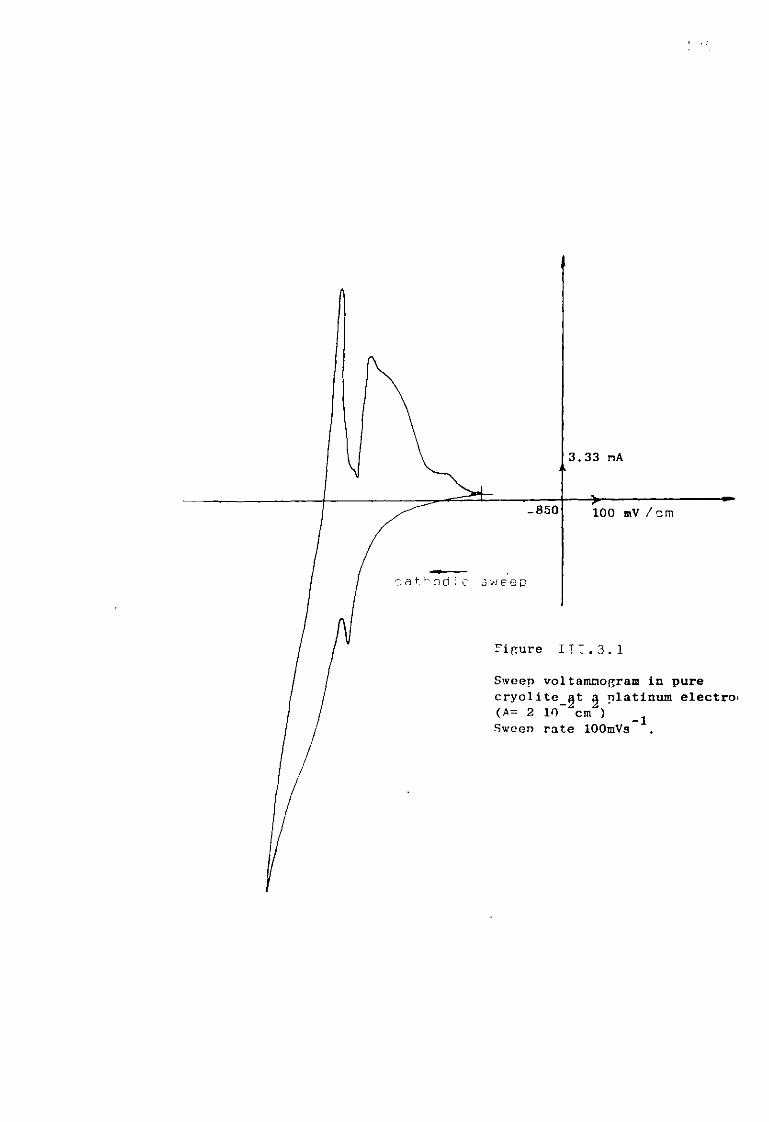

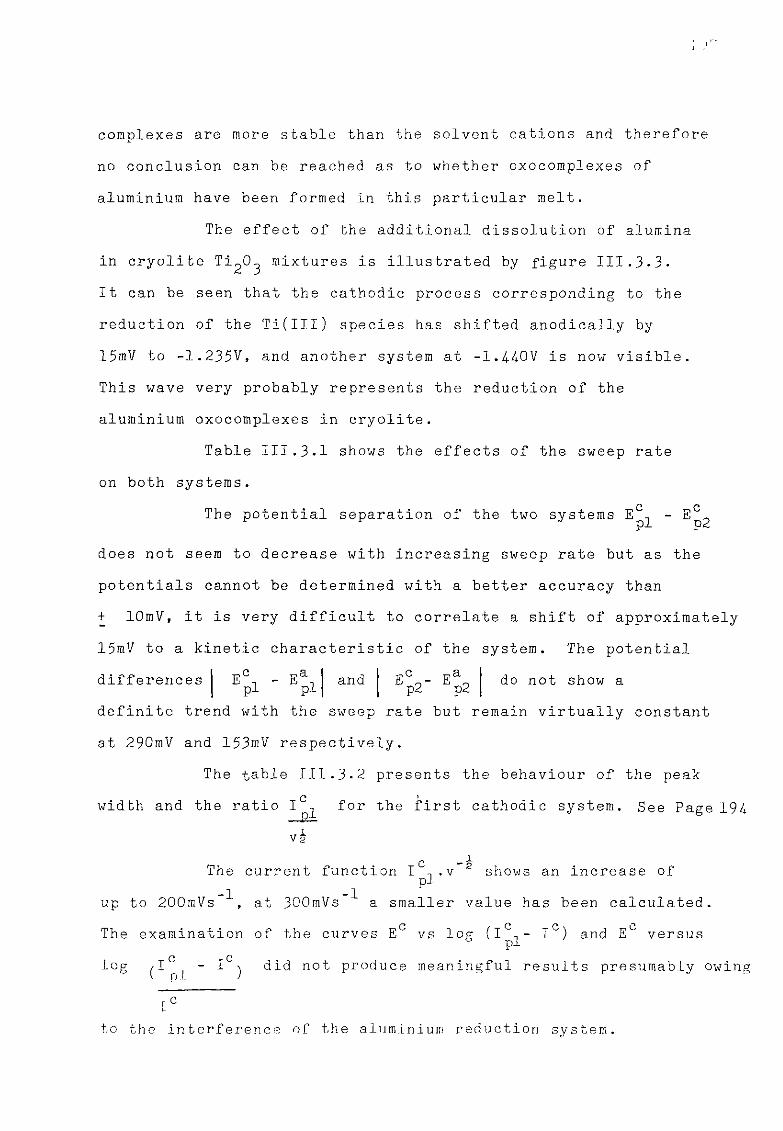
complexes are more stable than the solvent cations and therefore no conclusion can be reached as to whether oxocomplexes of aluminium have been formed in this particular melt.
The effect of the additional dissolution of alumina in cryolite Ti^O^ mixtures is illustrated by figure III.3-3. It can be seen that the cathodic process corresponding to the reduction of the Ti(IIl) species has shifted anodically by 15mV to -1.235V, and another system at -1.440V is now visible. This wave very probably represents the reduction of the aluminium oxocomplexes in cryolite.
Table III.3.1 shows the effects of the sweep rate on both systems.
c c The potential separation of the two systems E ^ - E ^
does not seem to decrease with increasing sweep rate but as the potentials cannot be determined with a better accuracy than + lOmV, it is very difficult to correlate a shift of approximately 15mV to a kinetic characteristic of the system. The potential
differences epi ' epi
and p2~ p2 do not show a definite trend with the sweep rate but remain virtually constant at 290mV and 153mV respectively.
The table III.3-2 presents the behaviour of the peak c '
width and the ratio I ^ for the first cathodic system. See Page 194 I T
c - ~ The current function I n . v 2 shows an increase of
1 up to 200mVs , at 300mVs a smaller value has been calculated. C i c C \ c The examination of the curves E vs log (I - I ) and E versus pl
c c log " d ) P r°d u c e meaningful results presumably owing
ic
to the i n t e r f e r e n c e of the a l u m i n i u m r e d u c t i o n s y s t e m .
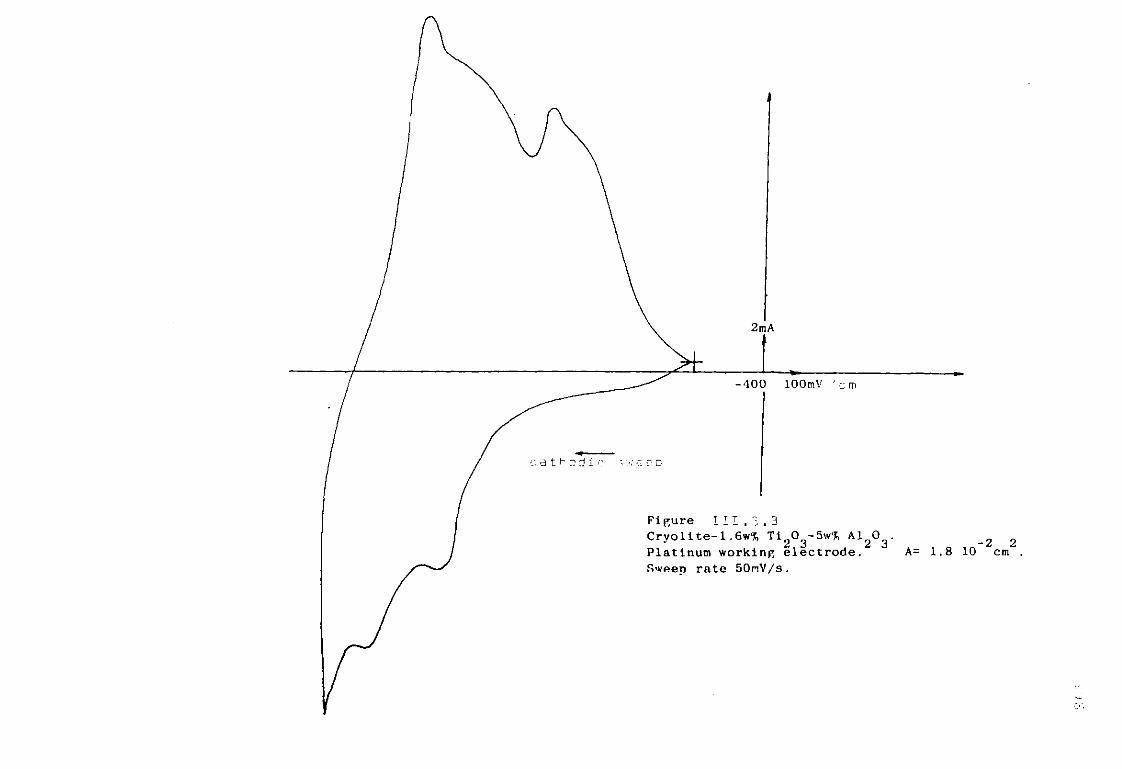
2mA
-400 100mV
: e n
Figure 1 11 . 2 . 3
Cryolite-1.6w% Ti 20 3-5\v% AlgO . _ 2 2
Platinum working electrode. A= 1.8 10 cm .
Sweep rate 50nV/s.
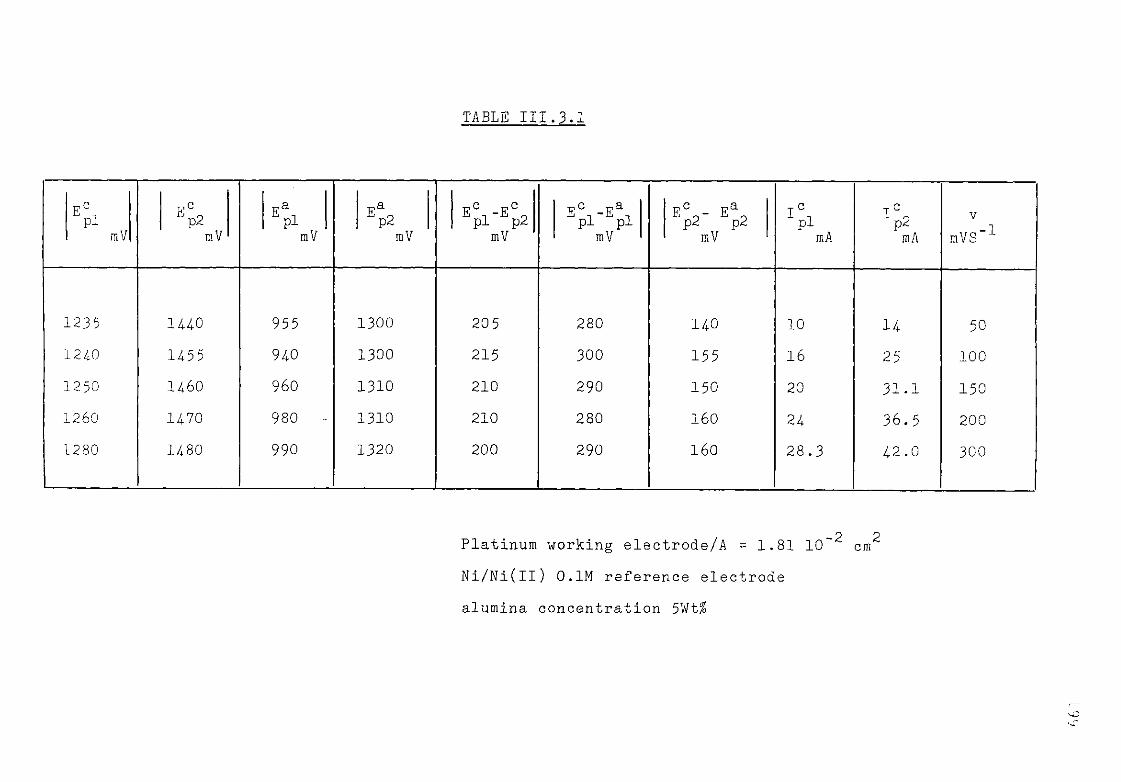
TABLE III.3.1
Pi mV p2
mV E i Pi mV
p2 mV
E P 1 - E P 2 mV E , - E , Pi Pi mV
p2 p2 mV
I c pl
mA I c p2
mA V
m V S " 1
1 2 3 5 1 4 4 0 9 5 5 1 3 0 0 2 0 5 2 8 0 1 4 0 1 0 1 4 50 1 2 4 0 1 4 5 5 9 4 0 1 3 0 0 2 1 5 3 0 0 1 5 5 1 6 2 5 1 0 0 1 2 5 0 1 4 6 0 9 6 0 1 3 1 0 2 1 0 2 9 0 1 5 0 2 0 3 1 . 1 1 5 0 1 2 6 0 1 4 7 0 9 8 0 1 3 1 0 2 1 0 2 8 0 1 6 0 2 4 3 6 . 5 2 0 0 1 2 8 0 1 4 8 0 9 9 0 1 3 2 0 2 0 0 2 9 0 1 6 0 2 8 . 3 4 2 . 0 3 0 0
P p Platinum working electrode/A = 1.81 10 cm Ni/Ni(ll) 0.1M reference electrode alumina concentration 5Wt%

TABLE III .3.2
E , - E i pi ps
mV v a
mA(mVs"5)
v
v "I mVs
90 1.41 50 90 1.60 100
100 1.63 150 110 1. 7 200 120 1.63 300
The anodic dissolution of a titanium electrode in pure cryolite at -0.950V is illustrated in figure III.3.4. The concentrations after each anodisation have been estimated on the basis of Ti(lll) species formation. The extrapolated straight line has a slope corresponding to an n value of 2.46. Because of the large scatter of the different points, only very little importance can be attributed to this n value. Different anodisations performed at -0.9 and -IV did not produce more significant values of n. III.3-2. Discussion
In voltammetry the treatment of two reversible systems can be carried out independently, provided the potenti
118 T separation of the two waves is of the order of n . For ^ n 298 reactions involving three electrons at 1300k this expression gives 171.6mV. Table III.3.1 shows values of the difference
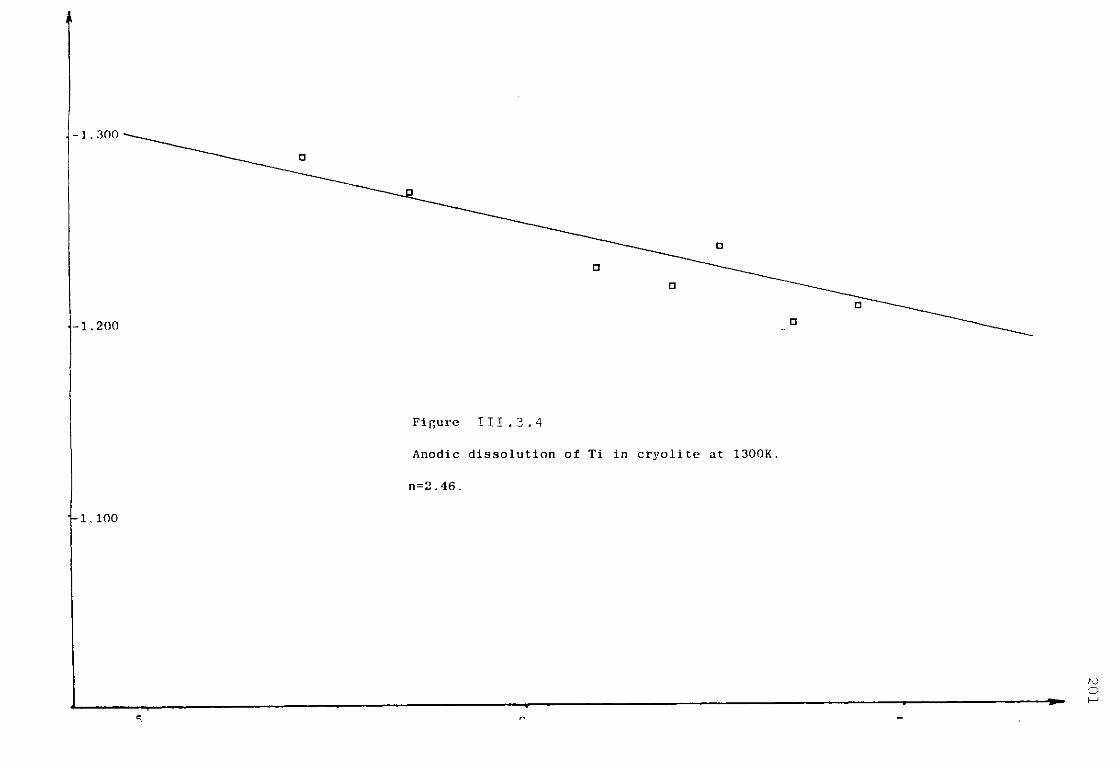

202
c Q ^pl" ^p2 which lies largely outside the theoretical
estimation (average 210 mV). In the voltammogram of the figure III.3.3» the interference of the aluminium system in the reduction of the titanium complexes looks very likely, and the scatter of the points observed by plotting c I c - I c
E versus log (_p ) could be an indication of a greater
irreversibility than that observed for instance in sodium fluoride.
III. 3.3. Electrodeposition of Titanium from cryolitic mixtures
Different attempts to electrodeposit titanium from cryolitic mixtures have been made using a three-electrode system. In this series of experiments the cathode substrate has been considered as a critical parameter of successful electrolysis: platinum, nickel, liquid aluminium and stainless steel have been employed. The reference electrode was built on the system Ni/Ni(Il) which has been used throughout the study. The composition of the bath as well as the electrolysis potential have been investigated to optimise the quality of the eventual deposits.
The major advantage of using cryolitic melts has been the increase of the Ti^O^ solubility which went up to approximately 5W% and was a function of the concentration of dissolved alumina. According to visual observations and Xray analysis of the melts after cooling, of Ti^O^ could be dissolved in cryolitic baths already containing 6W% of alumina. Undissolved Ti90„ has been found for higher A190„ concentrations.
203
No systematic study of the solubility of Ti^O^ as a function of Al^O^ in cryolite has been made and, in any case, 5W% of TiO^ has been the highest concentration of solute envisaged. Figures III.3.5 and 111.3.6 are scanning electron micrographs of deposits obtained at a voltage E = Ei - lOOmV. An arbitrary
c value of Ei was estimated from the mean value of E on the 5 pi
hypothesis of a reversible system; (Ei I -1.212V). Different i
values for the electrolysis potentials have been calculated on the basis of this E^ .
a Microprobe analysis of those deposits showed
evidence of a codeposition of A1 and Ti. Varying the conditions such as the potential and the time of electrolysis did not result in the single deposition of titanium. Increasing the time of electrolysis and decreasing the potential favoured alloys of higher A1 concentration.
A rather interesting result has been observed on platinum as illustrated by the photograph 111.3.6 where a very compact, but porous deposit can be seen. The proportion of occluded melt was much less than in the case of a deposit on nickel (photograph III.3.5). On platinum, the best case showed a concentration of 32.5 W% of titanium in the Ti/Al alloy. It has been impossible to give unique characterization of the stoichoimetiy "the compound found by codeposition of A1 and Ti (190).
III./. The Cryolite/TiO^ Mixtures
It is possible that complex molten salt systems containing titanium such as molten titaniferous slags, may

Figure III.3.5 ( X 14500)
f"ickel substrate. Cryolite.
^ijx 4.5 wt c- . a140 3 5 wt .

20 5
Figure 111.3.6 (X 10000)
Platinum electrode. Cryolite. tile., 5wt£ . Al^Oi dwtf.

be refined to systems containing fewer chemical components by
the use of a molten salt solvent capable of extracting the
titanium phase. The phase diagram for the TiO^/Na^AlF^ system
has been reported by (141) and they have reported a solubility
of 4.23W$ at 1000°C. The solubility of Ti02 in the solvent
NaF 15W$ AlF^ has been investigated by Anikin et al (14.2) and
they have observed a solubility of 5W$ and although the titanium
phase, which was crystallized on cooling was not identified
apparently no Ti02 is recrystallized. In this study a similar
solubility was noticed before finding evidence of recrystallized
TiO^ by X-ray analysis.
III.4-1 Emf measurements in cryolite - alumina - TiO^ mixtures
The experiments performed under this section have been
similar to those described in section III.1.3.1 and no further
comment will be made on the experimental aspects. The following
cell has been considered:
BN + NaF
AL na3alf6 na3alf6
A I 2 O 3
tio^
AL
The table III.4-.la highlights the results obtained. The
observedAe is slightly increased by increasing additions of
Ti02. This is the trend one might expect if there is an
additional consumption of F particles. In terms of the acid-
base concept mentioned in section III.l this could be taken as
an indication of the strengths of the acid Ti(IV) relative to
that of Al(III). Namely for 8 Wt# of alumina and for an increase
in Ti02 additions from lWt$ to 5Wt$, the A e of the cell increases
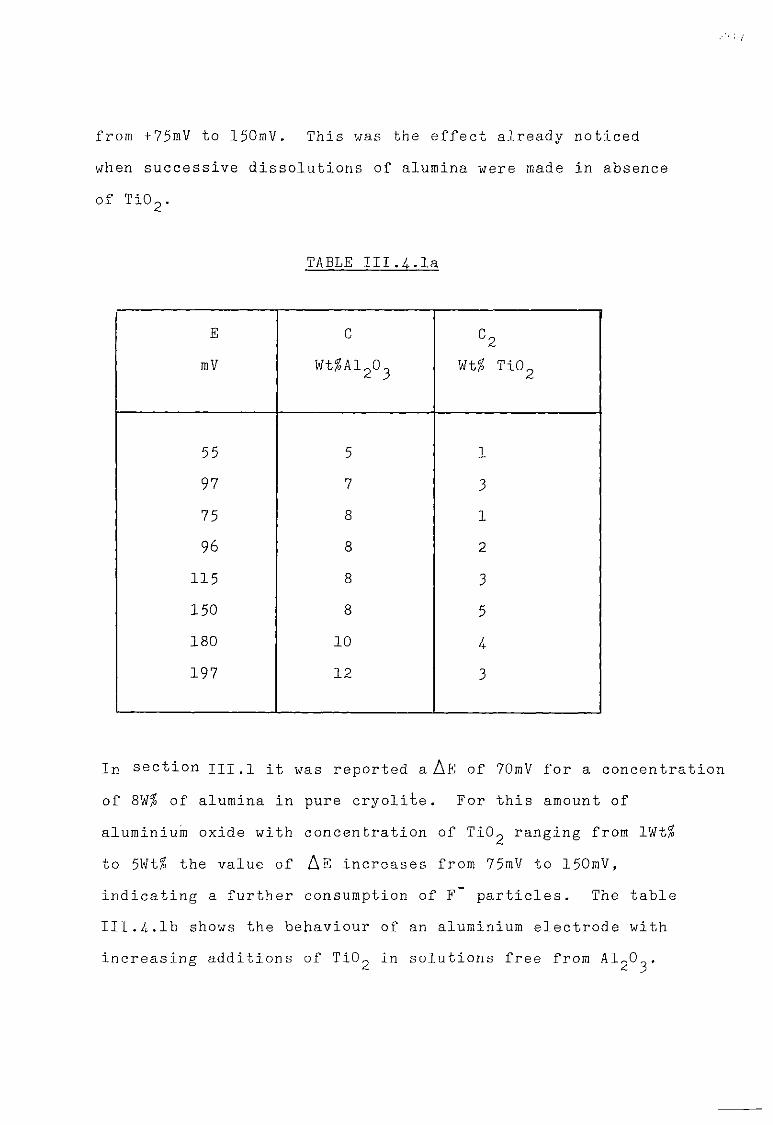
from + 75mV to 150mV. This was the effect already when successive dissolutions of alumina were made of Ti02.
TABLE III. 1.la
E C C2 mV Wt%Al203 Wt% Ti02
55 5 1 97 7 3 75 8 1 96 8 2
115 8 3 150 8 5 180 10 4 197 12 3
In section U I . l it was reported a A e of 70mV for a concentration of 8W% of alumina in pure cryolite. For this amount of aluminium oxide with concentration of TiC>2 r a ngi ng from lWt% to 5Wt% the value of A e increases from 75mV to 150mV, indicating a further consumption of F particles. The table III.4.lb shows the behaviour of an aluminium electrode with increasing additions of TiOp in solutions free from A1«0 .
noticed
in absence

TABLE 4-.lb
E mV
C1 Al203Wt$
C2 Ti02Wtf0
0 1 8 0 3
30 5 60 6
Apparent limit of solubility. (Precipitation of TiO^.)
Comparing these values with those obtained with Al^O^ dissolution one can see a rather similar set of results. It is therefore difficult to reach a conclusion regarding the respective strengths of the acids Al(lll) and Ti(III) and it seems unnecessary to speculate any longer on the matter.
III.4-2. Voltammetric Study.
Figure III.4.1 shows a complete voltammogram of 0.3M TiOp P u r e cryolite. Two systems are visible: a broad wave around + 70mV vs (Ni/Ni(ll) reference electrode and the second reduction process at -1.250V.
When Ti^O^ was added to pure cryolite (see section III. 3) the main reduction wave was observed around this potential and this could be an indication of identical Ti(III) complexes, whether the starting solute is Ti 0 or Ti0o.
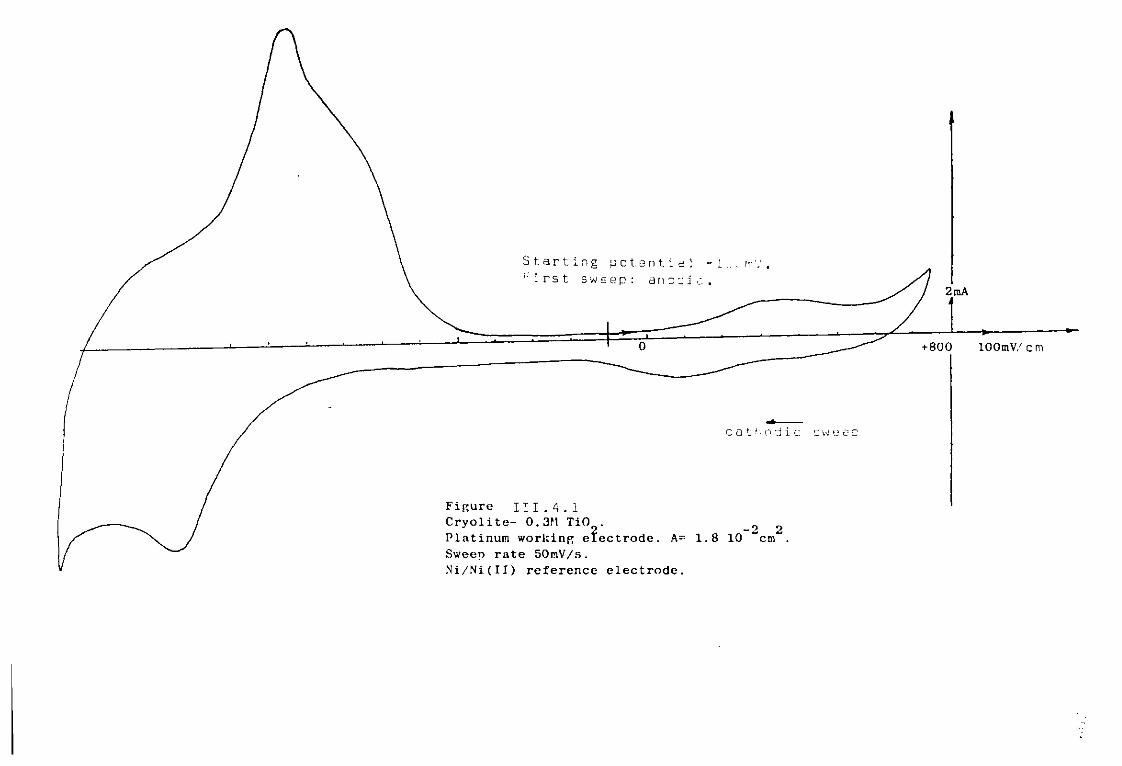
S t a r t i n g p o t e n t i a l t i r s t s w e e p : a m ' j i m'; .
lOOmV/ c m
c a t ^ n d i c c w e e c
Figure 1 1 1 . 4 . 1
Cryolite- 0.3M TiO
Platinum working electrode
Sweep rate 50mV/s.
Ni/Ni(II) reference electrode.
- 2 2 A= 1.8 10 cm
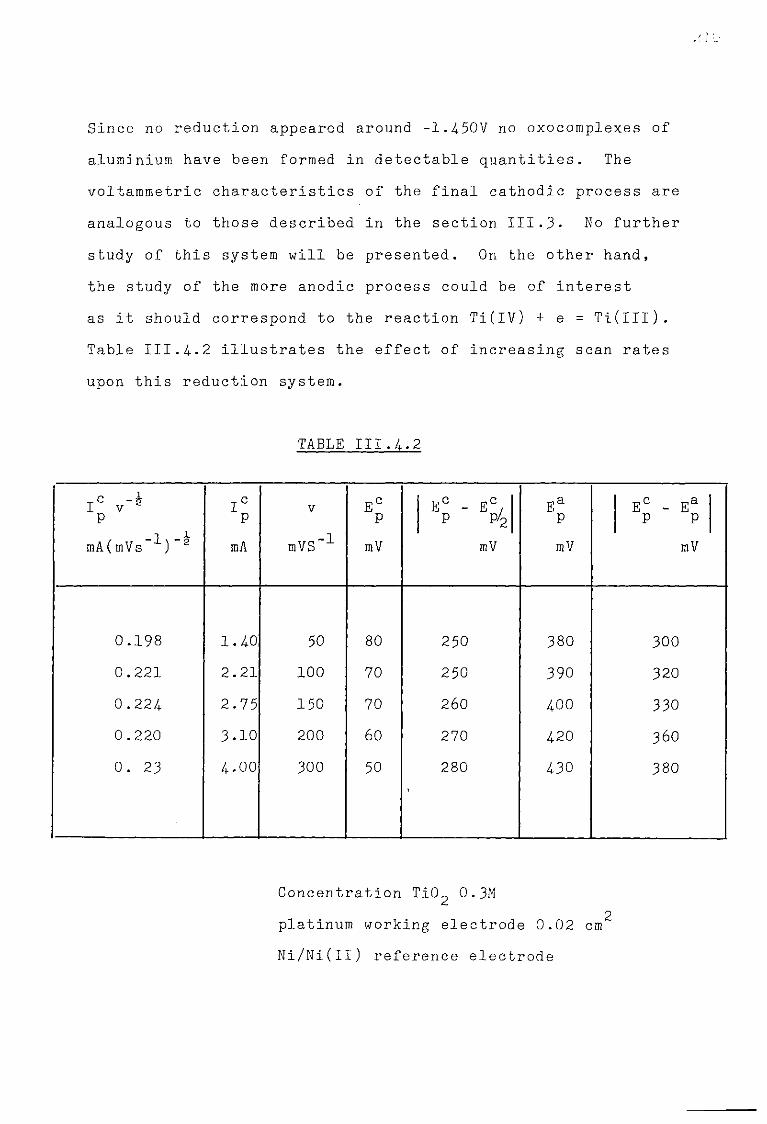
Since no reduction appeared around -1.450V no oxocomplexes of aluminium have been formed in detectable quantities. The voltammetric characteristics of the final cathodic process are analogous to those described in the section III.3- No further study of this system will be presented. On the other hand, the study of the more anodic process could be of interest as it should correspond to the reaction Ti(IV) + e = Ti(IIl). Table 111.4.2 illustrates the effect of increasing scan rates upon this reduction system.
TABLE III.4.2
T C -J I V p
mACmVs'1)
1° P mA
V
mVS"1
E c P
mV
E c - Ec, P p/2 mV
E a P mV
E c - E a P P
mV
0.198 1.40 50 80 250 380 300 0.221 2.21 100 70 250 390 320
0 .224 2.75 150 70 260 400 330 0.220 3.10 200 60 270 420 360 0. 23 4.00 300 50 280 430 380
Concentration Ti02 0.3M 2 platinum working electrode 0.02 cm
Ni/Ni(II) reference electrode

Cryolite plus 5w% A 12°3'
Concentration of TiO , 0 . 0 5 M . 2
Platinum electrode^ A= 0.03cm .
Sweep rate lOOmVs
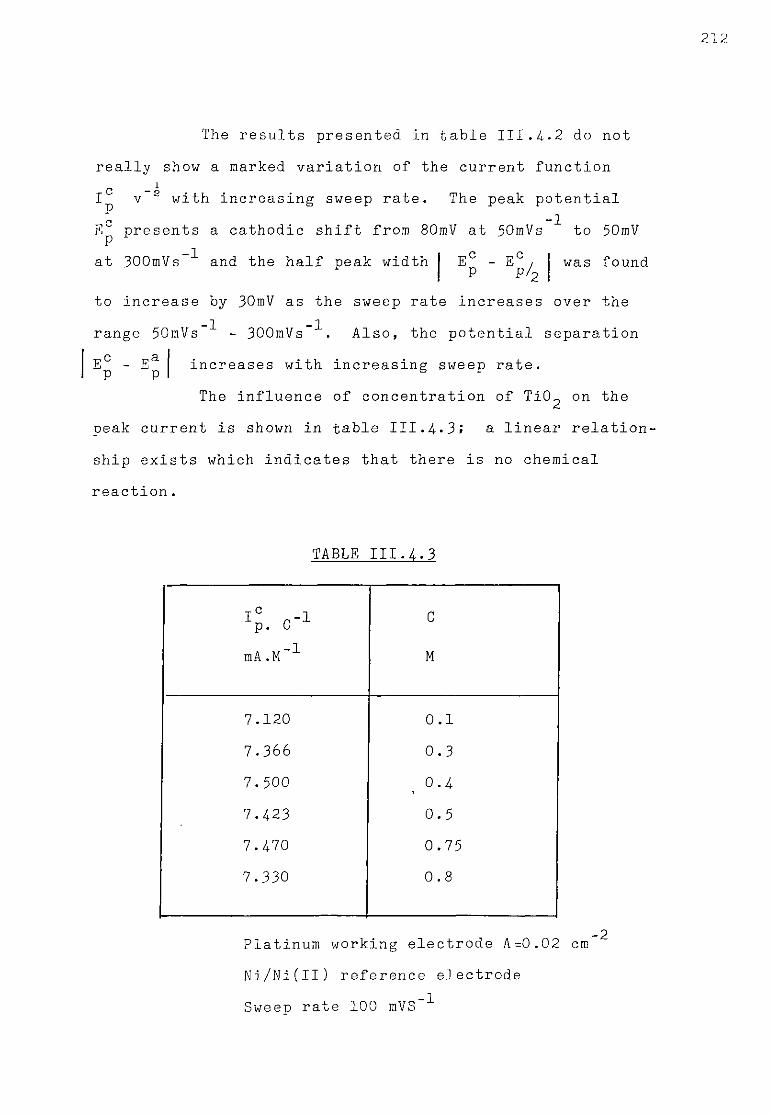
212
The results presented in table III.4.2 do not really show a marked variation of the current function
i I v with increasing sweep rate. The peak potential .h C -1
Ep presents a cathodic shift from 80mV at 50mVs to 50mV -1 at 300mVs and the half peak width E - E
p A was found
to increase by 30mV as the sweep rate increases over the - 1 - 1
range 50mVs - 300mVs . Also, the potential separation Ec - E a P P increases with increasing sweep rate.
The influence of concentration of TiO^ on the peak current is shown in table III.1.3; a linear relation-ship exists which indicates that there is no chemical reaction.
TABLE III.1.3
^ r-1 p. 0 C
mA.M"1 M
7.120 0.1 7.366 0.3 7.500 0.1
7.4-23 0.5 7.170 0.75 7.330 0.8
Platinum working electrode A=0.02 cm Ni/Ni(Il) reference electrode Sweep rate 100 mVS ^
600
Discussion
The results obtained from this brief investigation do not provide sufficient information for a complete mechanistic study. Nevertheless, the results do suggest that the dissolution of Ti02 results in species containing Ti(lV) as the main constituent.
The reduction process observed around +70mV could be attributed to a one-electron exchange resulting in the formation of a soluble product. If one assumes a mean value of 260mV for the peak width over the sweep rate range displayed in the table III.4*2, this value is very close to 246mV at 1300 K corresponding to a reversible single-electron reaction where both reactant and product are soluble (122). The peak potential separation however presents values which are larger than those one would have expected following the hypothesis mentioned above. The irregular increase of the current function could be interpreted in terms of a weak adsorption of Ti(IV) complex on to platinum (126) (75).
In a study of the same system in pure fluoride (see section III.2), the reduction peak of the reaction Ti(IV) + e = Ti(IIl) was observed at -0.125V versus the same reference and characrterized as a single-electron reversible reaction with soluble product and reactant. The situation arising from the use of cryolitic oxide mixtures as solvents seems to have changed the characteristics of this reduction making them more irreversible as highlighted by table III.4.2.
It must be emphasised that no final reduction of titanium (III) fluorocomplexes has been observed in cryolite.
On similar grounds mentioned in section III.2, the introduction of oxide definitely has a destabilizing effect on the Ti(IIl) species.
111. 4-. 3 . Electrodeposition of Ti from cryolite TiO^ Al^Q^
mixtures
It was shown in section III.2 that the electrowinning of titanium is possible under specific operational conditions. In section III.3 it was shown that using Ti^O^ as feed material, electrolysis of cryolite alumina mixtures led to codeposition of Ti and Al.
As far as industrial process is concerned the utilization of TiO^ is certainly much more advantageous. Indeed rutile (TiO^) is a naturally occuring mineral and could be used easily.
The I.V plot shown in figure III.4-.3 was obtained in a solution that contained Na-AIF/-, Alo0o and Ti0o and indicates
3 6 2 3 2 a decomposition potential of 1.170V at a nickel cathode. This result was obtained in a large electrolysis cell in which the anode was always a graphite rod. The dotted curve in figure III.4-.3 represents the decomposition of Al^O^ at a nickel cathode from (138). Thus, it can be seen that the current density of the electrolysis is of extreme importance since the deposition of aluminium seems to overlap that of Ti for current densities
2 higher than 4-30 mA cm .
In order to avoid as far as possible the codeposition of aluminium, electrolyses have been performed between 1.300V and
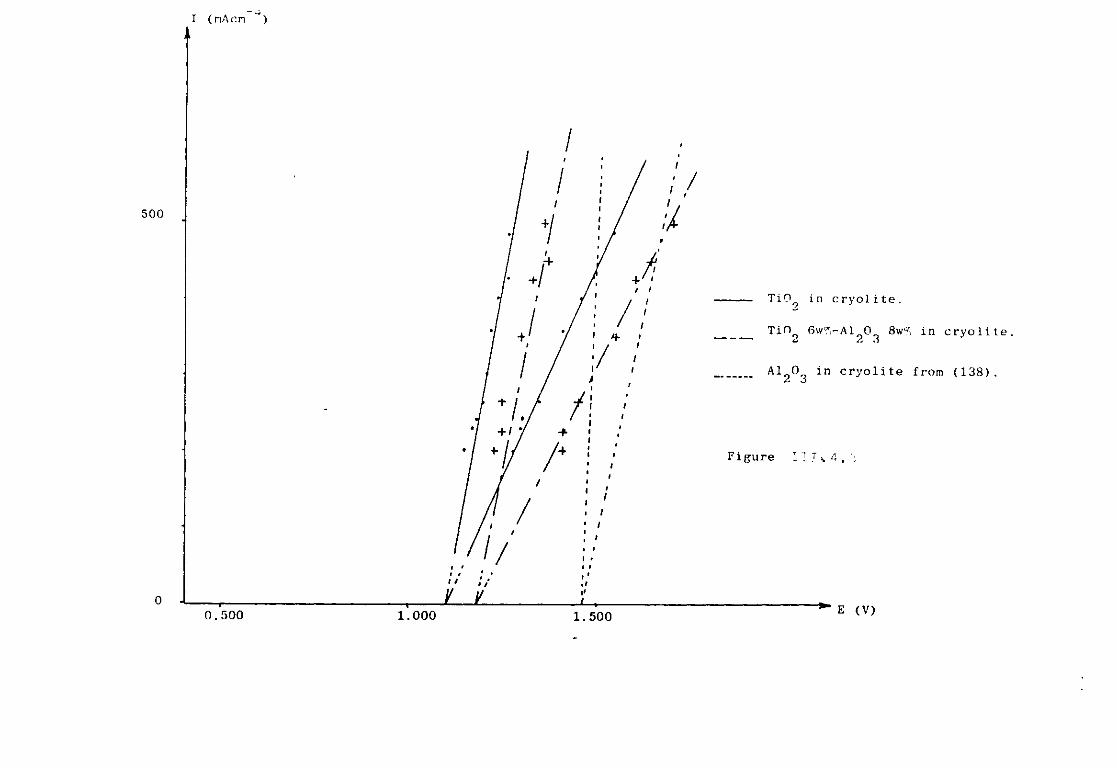
I (nAcn ")
?i (•>
2 1.5V, at current densities between 125 and 325 mA/cm .
The data for the electrodepositing experiments are summarized in table III.4.4-. According to these results it seems that a liquid aluminium pool as cathode produces the most interesting result. The insoluble products which have been observed in contact with the electrode in several different experiments proved by X-ray analysis to be composed of Na^TiF^. The X-ray pattern also showed a great number of unlisted lines.
It must be pointed out that the determinations of current efficiency based on microprobe analysis are not very accurate owing to large amounts of entrapped salts and therefore the values could be much lower as the microprobe technique used in these experiments did not differentiate ionic species from neutral entities. The samples were leached in diluted HF solutions in order to preserve the deposited aluminium.
The low values of the current efficiences regarding the deposition of Ti could reflect the effect of reduced species as well as possible reoxidation reactions at the anode and parasitic reactions (codeposition of Al). One can indeed conceive a definite correlation between the current efficiences of electrolysis and the thermodynamic stability of Ti(IV) ions in solutions in the various electrolytes.
One could schematically describe the mechanism by the disproportionation reaction of Ti and Ti(lV).
< T i > + 3 T i ( I V ) = 4 T i ( I I l ) (1) in s o l u t i o n in s o l u t i o n
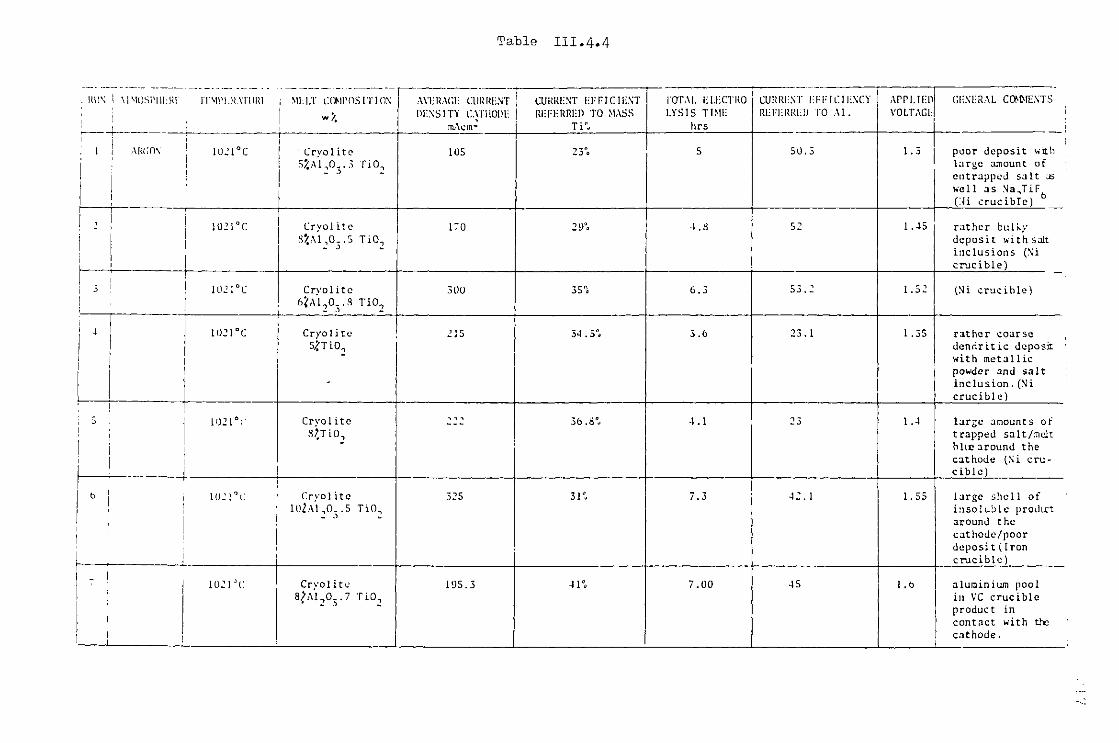
Table III.4.4
. RUN i M'MOSPIIF. RF ; IT.MPI.R.\TUR1 | mli.t c o m p o s i t i o n
' i ! !
AVERAGE CURRENT DENSITY CATHODE
mAcm-
\ CURRENT i;F PIC HINT REFERRED TO MASS
Ti"j
rOTAI. ELECTRO LYSIS TIME
hrs
CURRIINT EFFICIENCY RHPIIRIUIO TO Al.
APPLIHD VOLTAGE
GIINHRAL COMMENTS
i 1 . . . . ; 1 ! argon ' i o j i ° c
! ! 1
1 1 ' Cryol ite
! A 1,0..5 T i O , 2 2
105 25°o 5 50.5 1.3 poor deposit with large amount of entrapped salt us well as Na^TiF^ (Ni crucible)
1
1 2
I .
i 1 1
1
1021°C 1 1
Cryolite
S^AI,0,.5 T i O , 2 j 2
170 29°» 4.8 52 1 .45 rather bulky deposit with salt inclusions (Ni crucible)
| 3 i 102 l°c Cryolite 6?A1,0..8 T i O ,
500 55°a 6.5 55.2 1.52 (Ni crucible)
i 4 ! 1021°C Cryolite
5r?TiO, 215 54 .51» 5.6 25.1 1 .55 rather coarse
dendritic deposit with metallic powder and salt inclusion.(Ni crucible) ! !
i 3 . j 1 U 2 1 V 1
i 1 ! 1 j 1
Cryolite SJ.TiO,
222 56 .8°, 4.1 25 1 .4 large amounts of trapped salt/melt hlie around the cathode (Ni cru-cible)
b J j ii):i°(:
1 1 1 1
i
Cryolite 11)2A1 ,0. . 5 T i O ,
2 .1 2
525 31". 7.5 42.1 1 .55 large shell of insoluble produrt around the cathode/poor deposi t(Iron crucible)
1021JC Cryolite
8/0X1,0.. 7 T i O , 2 .•> 2
195.5 41° 7.00 45 1.6 aluminium pool in VC crucible product in contact with the cathode.
It seems that at 1300K this reaction is largely displaced to the right (1//) but due to the fact that Ti has an activity of less than one because of its alloying with Al, the rate of the reaction could be significantly modified. Gaseous GO and 00^, however, which are produced at the graphite electrode, dissolve in the melt and may back react with Ti(IIl) ions and reoxidize them to Ti(IV). This reaction could be of extreme importance as it was observed that after long electrolysis a film of black carbon covered part of the surface of the melt and sometimes short-circuited the electrodes.
When the cathode is a molten aluminium pool, a reaction between dissolved Ti02
a n d m o b b e n metal might be as follows:
3 Ti02 + /(Al) = 2(A1203) + 3Ti in melt in melt in Al
The theoretical change in Gibbs free energy for this reaction calculated on the basis of energy of formation data is (11/):
A g ° 3 Q 0 = -105.787 kcal
It is therefore reasonable to assume that this reaction will run parallel to the electrochemical rea'ction and the efficiency regarding the production of Ti metal should be increased. This could be an indication for the slightly better efficiency obtained by using a molten Al cathode (Table III./.3).
However, owing to the use of a vitreous carbon crucible, the formation of carbides cannot be ruled out. Aluminium carbide A1.C- may be formed by reaction of the molten

oi o
crucible. Then the following reaction might
3Ti = 4(A1) + X T i C >
in A1 solid
< Al^C X T i C > + 2 A 12°3
in melt
It is probable that Al^C^ is formed prior to the electrolysis and
then reacts with titanium metal and oxide to produce TiC. Actually
a yellow substance has been observed on the bottom of the crucibles
which have been used frequently with molten Al. X-ray analysis
showed evidence of Al^C^ formation but no line could be attributed
to TiC.
To explain this apparent absence of TiC one could
invoke the following reaction:
2 Ti02 + <TiC> = T i2°3 + ( C 0) + < T i >
in melt in melt
Unfortunately, no data are at present available on this type
of reaction at 1300K in cryolite.
In the absence of a diaphragm to separate the anode
products from the cathode compartment, convectional mass transfer
would be taking place and reduced titanium species would also
reach the anode where they would be oxidized especially in small
cells as was the case in the present study. It is fairly
obvious that the very bulky deposits obtained in this series
of electrolysis do not have a better morphology than the products
from the Kroll process and are certainly not of the same purity.
aluminium with the
occur:
<aiy3>
OR
3Ti02 +
in melt
The only advantage of a simultaneous deposition of Al and Ti is that a lower potential is required than in electrolysing solutions to produce pure Al and than non pyrophoric deposits are obtained.
Using oxide-containing melts proved to be beneficial for crystal growth at low temperature (inorganic fluxes or surface levelling agents) but they cause the disadvantage of introducing oxygen in the deposits possibly as -Al-O-Ti, or simply as oxides. Nevertheless, at the expense of the purity, the quality of electrolytic deposits produced via high oxide-containing baths seems to present few positive aspects. The obtaining of Ti as single electrolysis product has not, however, been achieved in cryolitic melts. The same conclusion has been reported by Notoya (145) who tried to deposit Ti from molten chloro-aluminates at lower temperatures.
III.5 Electrochemical studies of titanium in molten chlorides at 450°C and 550°C.
As part of the research of an electrochemical process for titanium production from molten salts, the possible use of the eutectic LiCl KC1 has been formed recently in semi-industrial processes (191). It has been highlighted in the previous sections that fluoride melts could present some positive aspects as far as the electrowinning of titanium is concerned but proved to be disappointing for electroplating applications. The utilization of a melt of much lower melting temperature is certainly attractive but will not improve the solubility of the solute species. It

was thus decided to focus essentially on the final reduction of titanium species in molten Licl K(jl at 4-50 and 550°C, in order to obtain a characterization of this reduction step which could be critical if any scaled up applications were envisaged.
III.5.1. Anodic dissolution of Ti in LiCl KC1 eutectic
III.5.1.1. Anodisation of Ti in LiCl KC1 at 150°C
It has been reported in a previous work (165) that the anodic dissolution of a titanium electrode leads to divalent species. Nardin et al observed the reduction of Ti(II) complexes in BaCl2 LiCl KC1 around -1.150V (vs Ag/Ag(l) (72). Initially, the anodic oxidation of a titanium electrode in molten LiCl KC1 at 4-50°C was investigated in an attempt to introduce titanium ions into the melt. Two methods are available for this: anodic dissolution, and the addition of compounds.
Dissolution of a large titanium anode (~lcm ) was attempted by constant potential coulometry at potentials varying in the range of -700mV to -IV (vs Ag/Ag(l) 1M). Figure III.5.1 illustrates the plot of E = F (log C) obtained by successive anodisation of a titanium electrode at -IV. Concentrations have been calculated on the basis of divalent titanium formation. A straight line is observed at low concentration with a slope of close to 0.058V against a calculated value of 0.07V for a two-electron transfer. The plot seems to level out at a concentration of approximately Ci = 8.35 10 as shown by the scatter of points observed as the anodization proceeds. In addition, the melt was obscured rapidly by black cloudiness. This point could reasonably be taken as an estimation of the limit of the solubility of Ti(II) in LiCl KC1 at 150°C.
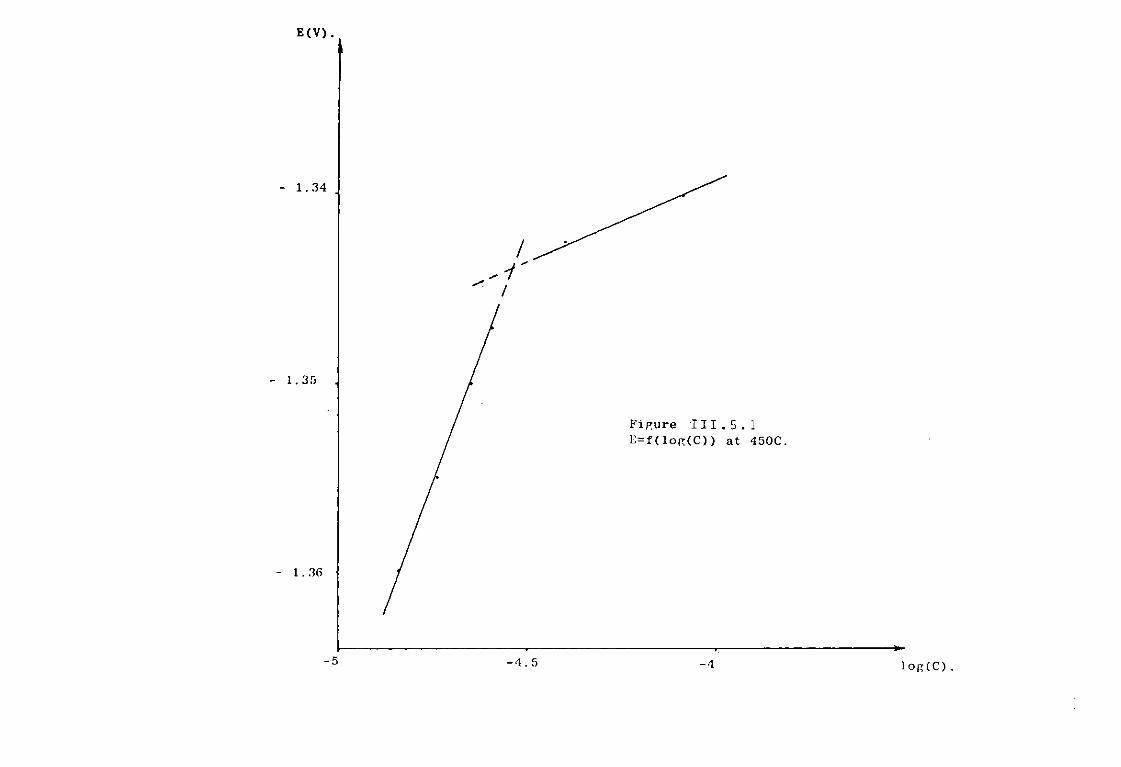
More anodic dissolution potentials produced currents which were too large to permit accurate measurements of low concentration cell potentials and resulted almost immediately in a black precipitate. The very low solubility of Ti(II) species at /50°C in this eutectic was further confirmed by direct addition of small pellets of synthesized TiCl^. At the beginning of the dissolution the melt surrounding the pellets turned light green and, after stirring, to deep black with evidence of a precipitation. After a few hours the melt above the precipitate was light green, as observed during the early stage of the anodisation and reported by (62) and (166) in NaCl.
A linear sweep voltammogram, made before the appearance of the black precipitate, is shown in the Figure III.5-/a. No precise data could be obtained from sweep voltammograms and chronopotentiograms performed in such melts, nonetheless a cathodic wave appeared around -1.1V.
Oxide formation on the surface of the electrode due to trace oxide impurities is a possibility which cannot be ruled out and although stringent precautions were employed during the purification, enough oxygen might still have been present in the melt to produce a passive oxide layer. One must bear in mind the rather high oxygen concentration of the commercially-available Ti which could well be at the root of titanium oxide formation on the surface of the electrode, particularly on titanium anodes. It must be emphasised that outgassing experiments did not result in improved characteristics as far as the anodization curves are concerned.
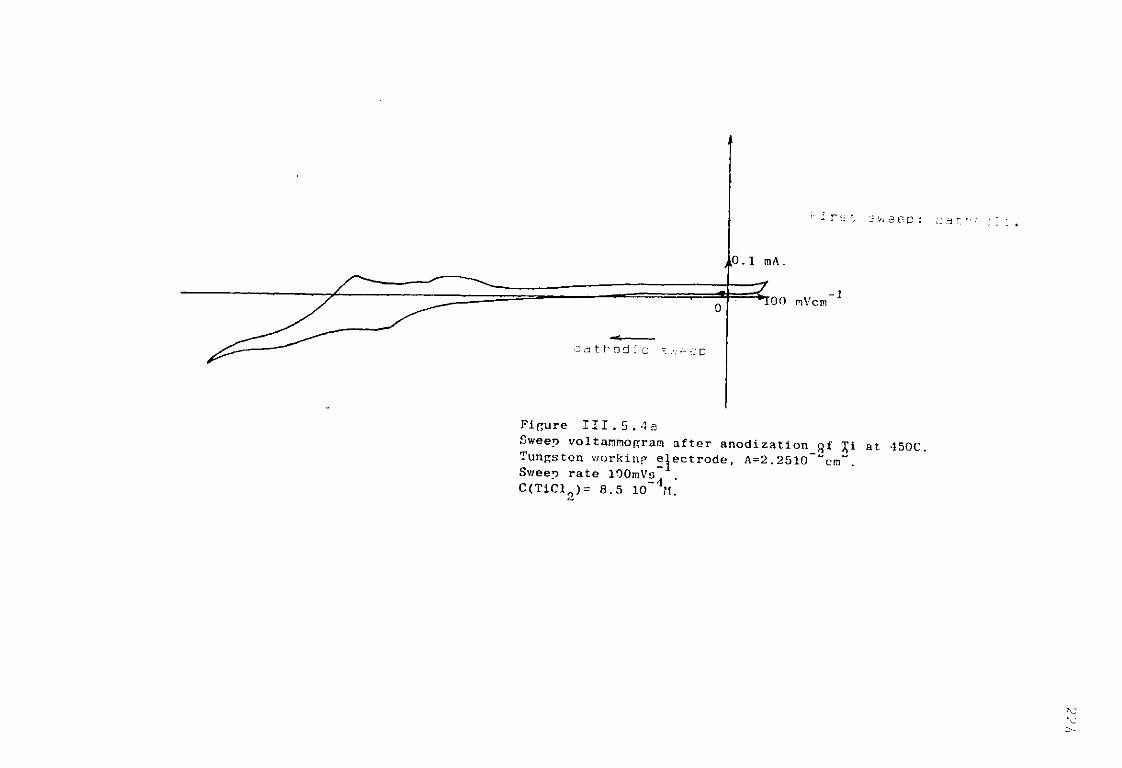
j- r t L-W9GP : c; a r . -
, k0. 1 ma
Z TOO mVci -1
a t h o d : c p
Figure I I I . 5 . 4 a
Sweep voltammogram after anodization qf at 450C. Tungsten working electrode, A=2.2510~"cnT . Sweep rate lOOmVs . C ( T i C l 0 ) = 8.5 l O ' V

Passivation of metals in LiCl KC1 is certainly not new (167) (108)(19) and various theories on the subject are now available. Passivation due to the formation of complexes has been proposed (169) in an attempt to explain the behaviour of certain metals in chloride melts. One can envisage the existence of lower valent polymeric materials remaining on the surface of the electrode and being insoluble at this temperature.
The addition TiO did not seem to change the characteristics of the melt and it appeared to be completely insoluble even in melts containing up to 5W% of KF. During anodic dissolution of titanium at -0.9V in unpurified melts, a whitish-yellow film was seen to form on the surface of the melt after a few hours, accompanied by a partial disappearance of the black precipitate formed during anodization. X-ray analysis of this whitish compound did not show evidence of titanium oxide and could, therefore, be interpreted in terms of oxychlorides. In order to increase the solubility of TiCl^ it was decided to work at 550°C.
III.5.1.2. Anodic dissolution of Ti in LiCl KC1 at 550°C
" Anodic dissolution of Ti electrodes has been performed in similar conditions to those described above. On the basis of divalent titanium formation the plot of E versus log (C) produced a straight line with a slope of 0.086V (Figure III.5.2) for a calculated value of 0.082V, without presenting a discontinuity as was the case at 450°C. Nevertheless, the black cloudiness which is associated with the precipitation of
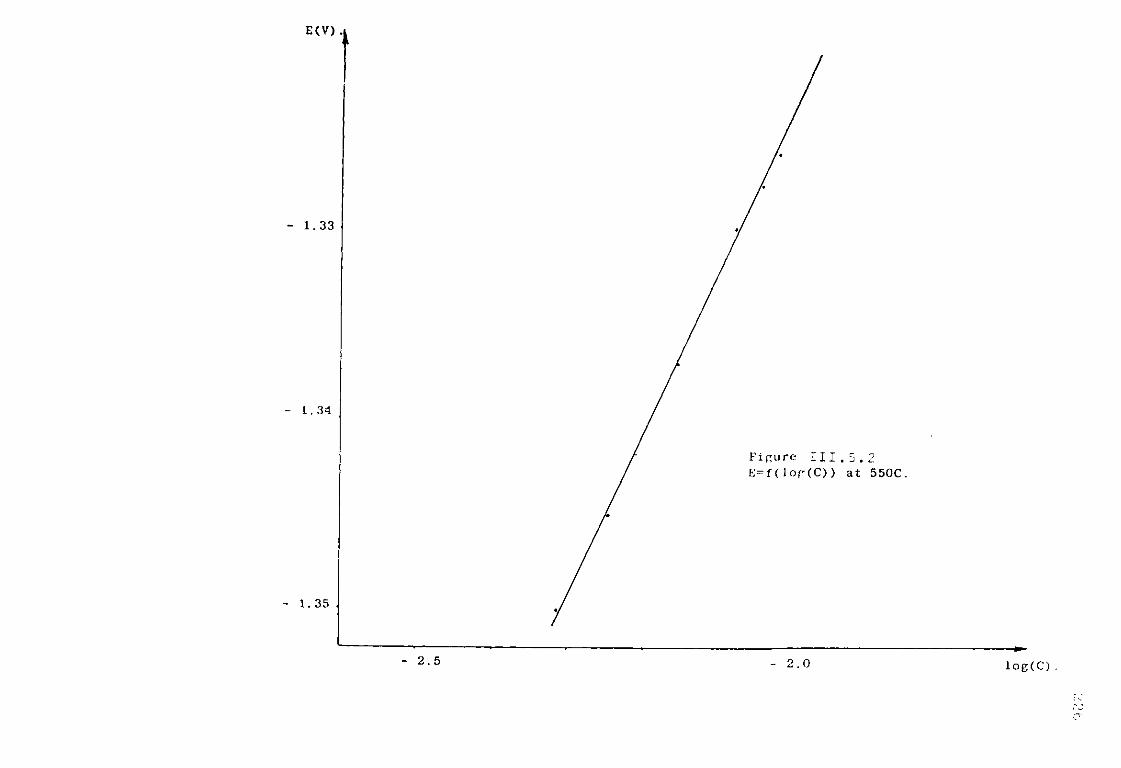
TiCl^ has been seen to occur at a calculated concentration of _2
2.510 , assuming the formation of divalent titanium. If this value is taken as the solubility limit for TiCl0 at 550°C, it presents a large increase compared with that at X50°C (8.351° ) . This result is in rather good agreement with those published by Baboian et al (62) who confirmed the formation of Ti(Il) by anodization but did not observe a solubility limit at 550°C. Loginov et al (170) did not publish specific data on the anodization of titanium but reached the conclusion that divalent titanium was formed.
X-ray analysis of the precipitate, performed under argon using a Debye Scherrer Camera, showed evidence of TiCl^ associated with a great number of lines which did not correspond
. . h to any listed Ti(II) compounds. More than a century ago, Wohler (171) postulated the existence of TitOH^. This compound cannot be excluded, especially if one remembers that even very pure eutectic melts still contain a certain amount of hydroxide. This black compound reacts with water, producing a gaseous evolution assumed to be hydrogen. This underlines the complexity of the chemistry of Ti and, above all, the lack of up to date information and data concerning this dichloride.
III.5.1.3. • Discussion
Various works and publications are available on the solubility of titanium dichloride in LiCl KC1 melts (62)(170)(172).
Baboian et al (62) reported a value I.4.8 10~^M. for the limit of solubility of TiCl in LiCl KC1 at 150°C. They even

performed experiments at 550°C and did not observe or publish
a solubility limit which is in good agreement with our present result. On the other hand, Filippova et al (172) related an extraordinary value of 0./7M at /00°C for the solubility of TiCl^. This value seems rather surprising, especially in view of our results performed in high purity conditions.
The phase diagrams of LiCl TiCl2 and KC1 TiCl2
have been published by Ehrlich and co-workers (173) but no information is available on the ternary system.
It has been suggested by (17/) that TiCl " was /
very likely to be the stable entity on the alkali-chloride-rich side of the phase diagrams. This latter point was further confirmed by Ehrlich in KC1 TiCl2 who observed a peritectic reaction at 671°C and attributed the formula K2Ti Cl^ to the compound which forms an eutectic with KC1 by 27 mole % of TiCl2
at 632°C. But on the other hand no eutectic or peritectic reactions have been reported with the system LiCl TiCl2.
The existence of undissociated molecules of TiCl2
in ionic melts such as LiCl KC1 is improbable, but one could suggest large ionic clusters composed of Cl-Ti-Cl sub units with direct bonds between the Ti atoms, these ionic clusters being defined as structural units containing more than one metallic atom per unit, which are in fact a transition to solid TiCl2 which is known to possess a layer structure with bonds between the Ti atoms. Following this hypothesis the activity of TiCl2 in the eutectic should be rather high, certainly higher than it would be in the presence of TiCl;
Mi-llie polarizing power (Z__) of the K+ cations which
r 3 have a larger size and smaller charge than the Ti cations is
2 + certainly weaker than that of Ti . Therefore, the chloride
2+ ions will be strongly attracted by Ti leading eventually to the formation of complexes of the type TiCl, . One might say that K+ cations do not capture a significant enough amount of CI particles to open the structure of the melt and permit the formation of large ionic clusters composed of one or two 01-Ti-CI sub units.
The presence of large cations and/or an increase of temperature which will produce a greater openness of the structure of the melt, are therefore necessary to allow the existence of large clusters (see (19)).
The low solubility of TiCl^ which has been observed could then be interpreted in terms of lack of thermal expansion of the melt structure. (The increase of solubility limit of TiCl^ with increase in temperature could be an indication in favour of this latter argument). According to (173) this situation is analogous to that in other binary systems where one of the components has a layer structure in the solid state (MgCl^, CdCl^). It has been observed (165) that the solubility of TiCl^ increases with increase in the radius of the solvent
2+ 2 + cation (MgCl^ replacing LiCl) . Since Mg and Ti have approximately the same ionic radii, and considering the similarity in structure of the divalent chloride salt, it is reasonable to assume similar behaviour of MgCl^ and TiCl^ in LiCl-KCl eutectic (175).
Apart from salts that have typically ionic lattices, many are partly covalent and crystallise in layer structures.
2 _
In MgCl^ the octahedral MgCl^ groups are linked together to form infinite layers. The chloride ions are arranged in a hexagonal, close-packed structure (similar to that of TiCl0),
two layers being filled together with atoms of the one layer falling above the hollows of the lower layer. In MgCl^, the
2+ Mg occupy half the total available octahedral holes and the
2+
two adjacent layers of CI with Mg between them form a
composite Cl-Mg-Cl layer. (196) The ternary diagram of KC1 LiCl MgCl^ has been
published (176) (Figure III.5.3.) in which the region of liquid and crystals form between 450 and 550°C is not indicated, but it is conceivable that at the eutectic composition, for small concentrations of MgCl2» this series of points lies in the liquid/solid region. The situation in LiCl KC1 with TiCl2 might be identical and certainly would explain the very low solubility noticed at 450°C. Therefore in view of the arguments above, it is logical to expect a low solubility of TiCl2 in LiCl KC1 between 450°C and 550°C as is in fact the case (Figure III.5.3.)
III.5.2. Electrochemical study of TiCl^ in the eutectic LiCl KC1 at 550°C.
Titanium species were introduced either by addition of pellets of TiCl2, by anodic dissolution or by dissolution of pellets o-f K^TiCl^. Voltammetric studies of the reduction of Ti(Il) at a platinum and at a tungsten electrode produced a set of rather different results. It must be stated that no response has been recorded beyond -0.650V on a vitreous carbon electrode, which agrees well with a paper published by James on the under-voltage deposition of alkali metal on graphite (147).
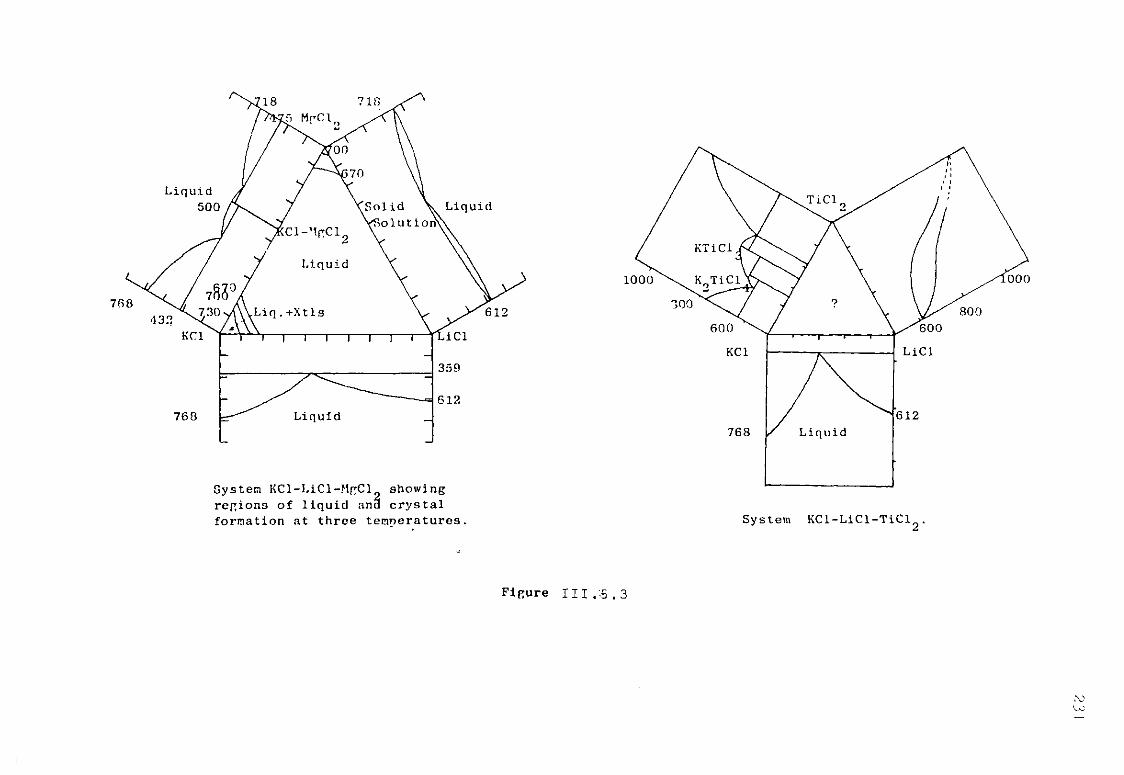
768
768
-
1 1 1 1 1 1 I 1
-
Liquid
_
System KCl-LiCl-MgCl showing
regions of liquid ana crystal
formation at three temperatures.
1000 000
System KCl-LiCl-TiCl . J 2
Figure 1 1 1 . .5. 3
,v>
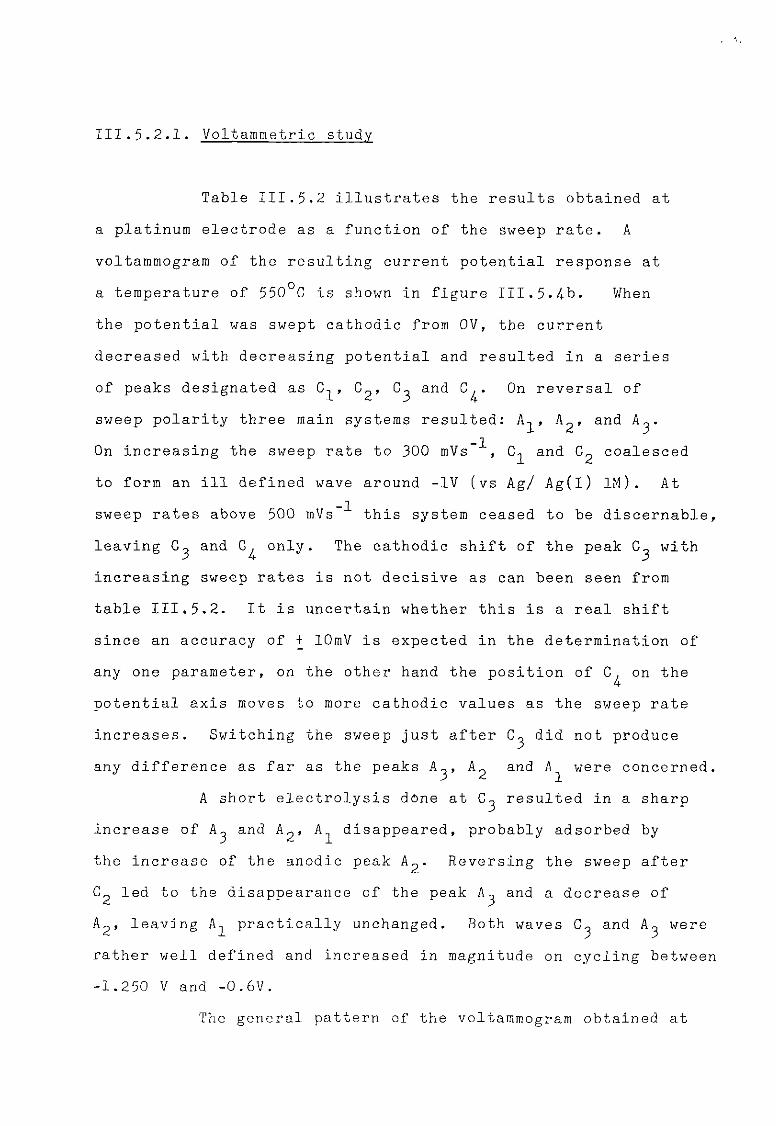
III.5.2.1. Voltammetric study
Table III.5.2 illustrates the results obtained at a platinum electrode as a function of the sweep rate. A voltammogram of the resulting current potential response at a temperature of 550°C is shown in figure 111.5.4-b. When the potential was swept cathodic from OV, the current decreased with decreasing potential and resulted in a series of peaks designated as C^, C^, C^ and C^. On reversal of sweep polarity three main systems resulted: A^, A^, and A^. On increasing the sweep rate to 300 mVs , C^ and C^ coalesced to form an ill defined wave around -IV (vs kg/ Ag(l) 1M). At sweep rates above 500 mVs this system ceased to be discernable, leaving G^ and G^ only. The cathodic shift of the peak C^ with increasing sweep rates is not decisive as can been seen from table III.5.2. It is uncertain whether this is a real shift since an accuracy of + lOmV is expected in the determination of any one parameter, on the other hand the position of C. on the
4-potential axis moves to more cathodic values as the sweep rate increases. Switching the sweep just after C^ did not produce any difference as far as the peaks A^ and A^ were concerned.
A short electrolysis done at C^ resulted in a sharp increase of A^ and A^, A^ disappeared, probably adsorbed by the increase of the anodic peak A^. Reversing the sweep after C^ led to the disappearance of the peak A^ and a decrease of A^, leaving A^ practically unchanged. Both waves C^ and A^ were rather well defined and increased in magnitude on cycling between -1.250 V and -0.6V.
The general pattern of the voltammogram obtained at
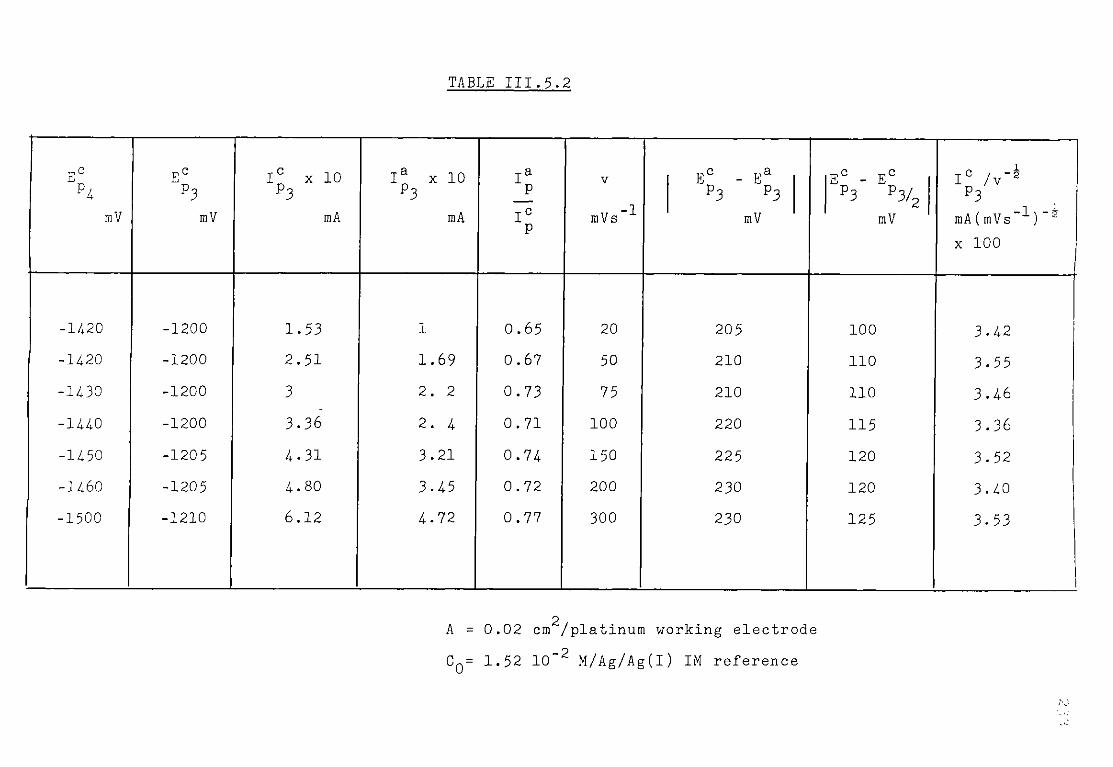
TABLE III.5.2
T,C Hi
P 4 mV
E c
P 3
mV
I C x 1 0 P 3
mA
I a x 1 0 P 3
mA
I a
P
P
V
mVs ^
E C - E a
P 3 P 3
mV
E c - E c
p 3 p 3 / 2
mV
i
3
mA(mVs )~ 2
x 1 0 0
- 1 4 2 0 - 1 2 0 0 1 . 5 3 1 0 . 6 5 2 0 2 0 5 1 0 0 3 . 4 2 - 1 4 20 - 1 2 0 0 2 . 5 1 1 . 6 9 0 . 6 7 50 2 1 0 1 1 0 3 . 5 5 - 1 4 3 0 - 1 2 0 0 3 2 . 2 0 . 7 3 7 5 2 1 0 1 1 0 3 . 4 6 - 1 4 4 0 - 1 2 0 0 3 . 3 6 2 . 4 0 . 7 1 1 0 0 2 2 0 1 1 5 3 . 3 6 - 1 4 5 0 - 1 2 0 5 4 . 3 1 3 . 2 1 0 . 7 4 1 5 0 2 2 5 1 2 0 3 . 5 2 - 1 4 6 0 - 1 2 0 5 4 . 8 0 3 . 4 5 0 . 7 2 2 0 0 2 3 0 1 2 0 3 . 4 0 - 1 5 0 0 - 1 2 1 0 6 . 1 2 4 . 7 2 0 . 7 7 3 0 0 2 3 0 1 2 5 3 . 5 3
1
2 A = 0.02 cm /platinum working electrode Cn= 1.52 10"2 M/Ag/Ag(I) IM reference
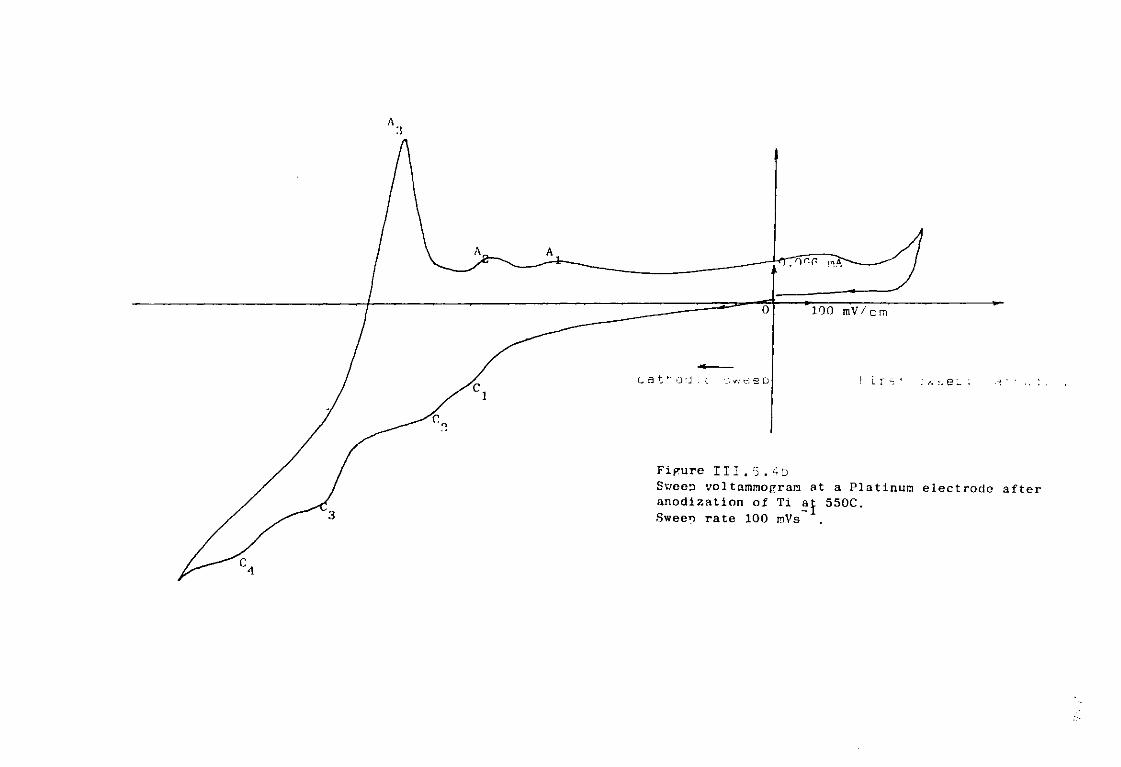
cats o d / i t l s d
100 mV/cm
a r. e
Figure 1 1 1 . 5 . 4 b
Sv/eeo vol t ammo gram at a Platinum electrode after anodization of Ti aj 550C. Sweeq rate 100 mVs

a platinum electrode presents significant similarities and differences from those obtained by Nardin et al (72). They reported the final reduction of Ti(II) to Ti(0) around -1.150 and attributed the reduction Ti(IIl) + e = Ti(Il) to a system appearing towards -0.5V. They also noticed the presence of a wave at -IV which was subsequently identified as the reduction of a complex, excluding the possibility of oxychlorides on purity grounds. Baboian et al (62) reported a value of -1.04-V (Ag/Ag(l)) for the apparent standard electrode potential of the couple Ti/Ti (II). Quemper et al (177) from voltammetric experiment,observed that the reduction wave of the reaction Ti(Il) + 7e = Ti(0) occurred around -1.2V against the same reference. On the basis of these publications the peak C^ could be attributed to the reduction of Ti(IIl) to Ti(Il) due to a probable disproportionation of the added TiCl^. This reduction involving only one electron should present a peak height approximately three times less than C^ which is approximately the case, although the peak current measurement is rendered innacurate due to the interference of the other systems. The identification of C^ remains outstanding, but the fact that the waves C- and C^ are transformed into a single system at high sweep rates could be an indication that both processes are related to the same valency of titanium. In the previous section, it has already been stressed that, even in a carefully purified melt, small traces of oxide or hydroxide could be found. It could therefore be that an oxychloride complex of Ti(lII) is present, showing a reduction potential close to that of the pure chloride species.
236
In addition no interpretation for the peak C has 4 been suggested and since no direct effect has been observed between this cathodic process and the system C^ it was decided to concentrate on the final reduction of titanium (II) complexes, ignoring for the time being the existence of C. as
4 well as C^ and C- . Examination of the results for the reduction process
c C0 shows that the peak current I increases linearly with 3 P3 J
increasing (sweep rate)2 with a zero intercept (Figure III.5.5) and the current function IC/vg remains essentially constant with
P3 increasing sweep rate (table III.5.2). The half peak width increases from lOOmV to 125mV by increasing the sweep rate from 20mVs to 300 mV/s. Examination of the ascending portion of this wave results in a linear relationship between log^I0 - Ic^vs
1° c c over the approximate range 0.35 I , 0.7 I , with a slope p3 p3
corresponding to an n value of 1.90 (Figure 111.5.6). The corresponding log(lc - Ic)vs E c over the range 0.5 - 0.9 1°
p3 P3 was curved (Figure III.5.7). The anodic response is well defined and its general shape does not indicate that the process is one of reversible deposition and stripping of an insoluble product. The cathodic peak potential E and reverse potential
P 3 3 E separation increases from 205mV to 230mV with a tenfold P 3 ia
increase of the sweep rate. In addition, the ratio p3 is
P 3
less than unity and presents a slight increase as the sweep rate increases.
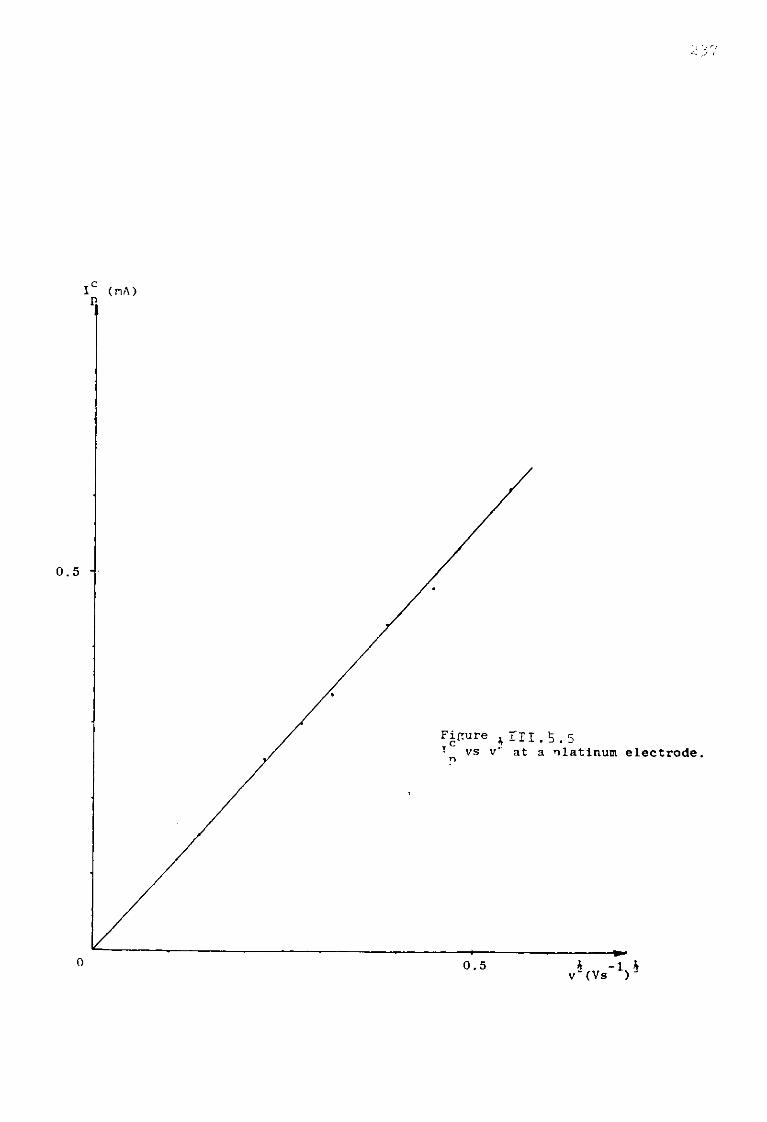
0 0.5 * -1 * v" (Vs
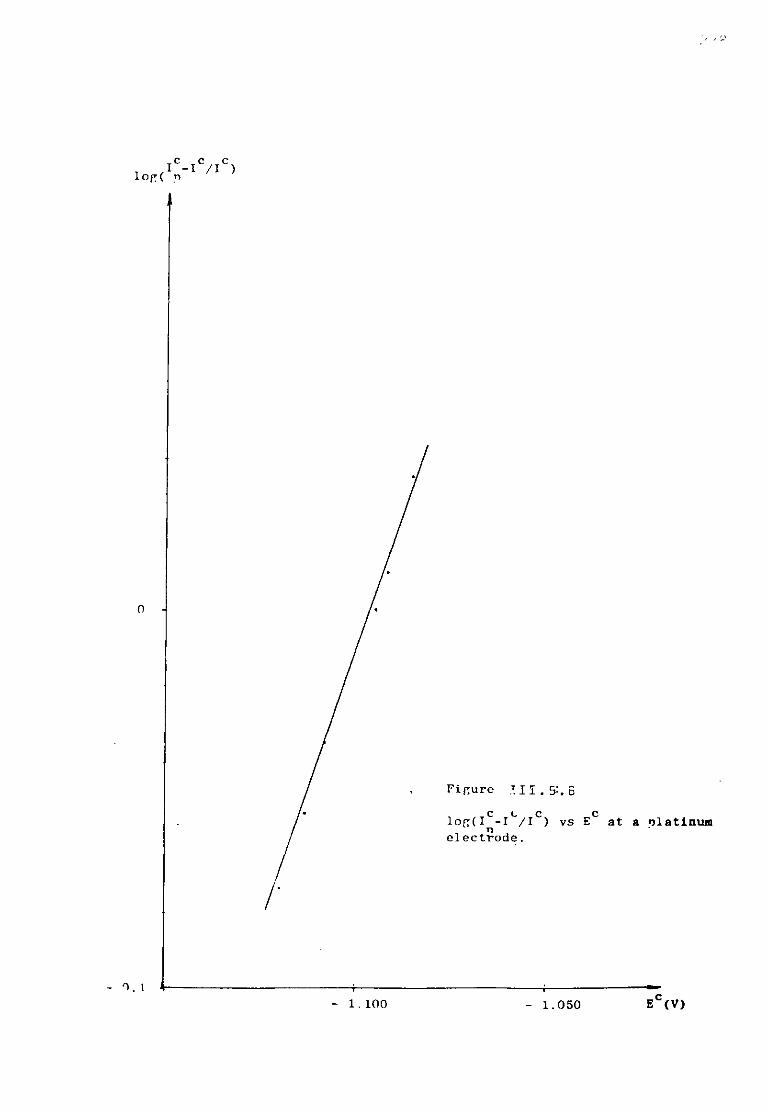
C c c 1 ,l n ) lop:( n
i
- 0 . 1
Figure i n . 5:. s
c c c c log(I -I /I ) vs E at a olatlnua o electrode.
- 1.100 - 1.050 E C ( V )
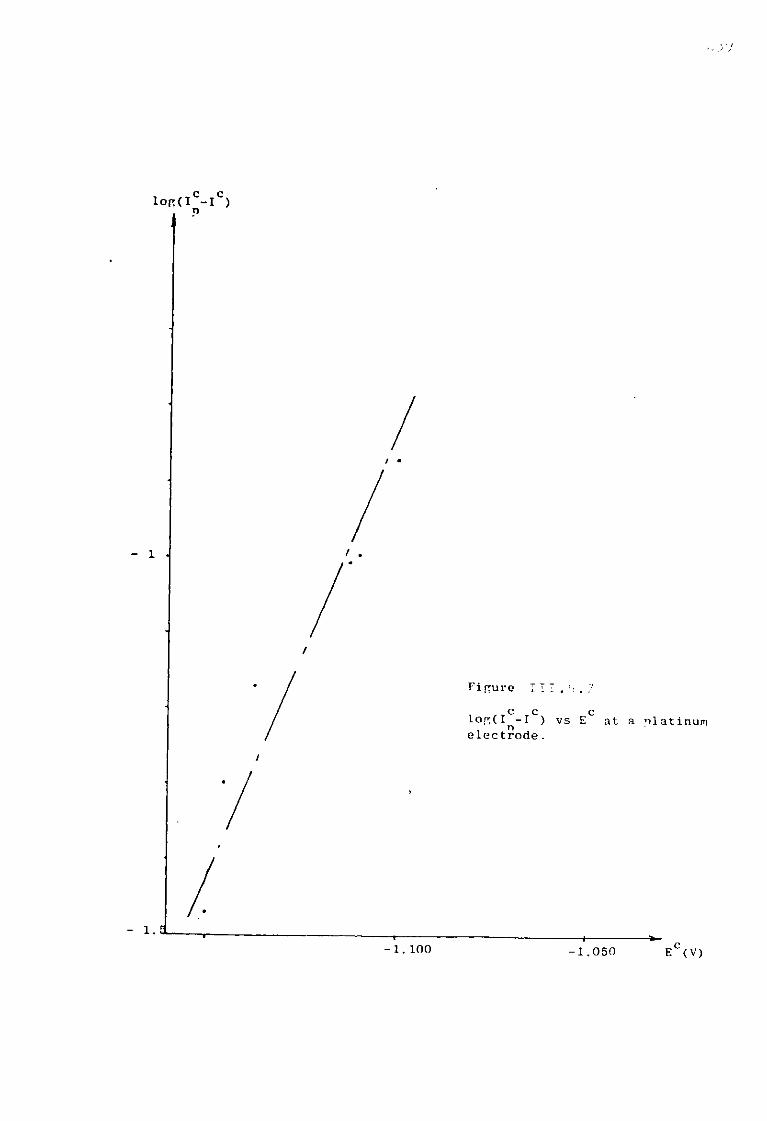
Figure III.';./
c c c log(I -I ) vs E at a platinum n electrode.
—i -1.050 E°(V)

/• 0
At the same temperature, at a tungsten electrode, the morphology of the voltammograms was slightly better defined and presented several differences, (Figure III.5.8). Starting from OV and decreasing the potential, only two waves have been observed, the first system C^ at approximately -0.9V (vs Ag/Ag (I) reference electrode) coinciding therefore to the peak C^ at a platinum electrode. The second process Ci, at -1.2V corresponded to C^ as previously described. No wave which could have been associated with the system C^ on platinum has been observed. Apart from and A^ on the reoxidation other ill defined waves are observed, A^ B, C. The nature of these systems seems complex since they disappear or coalesce with A- and A^ at sweep rates higher than 300mVs ^. In addition, after several cycles between -0.6V and -1.3V these systems were no longer discernable, although the systems 1 and 2 settled to a steady position (Figure III.5.8).
Study, as in the previous case, was concentrated on the second system, assumed to correspond to the final reduction of Ti(Il) species. Table III.5.3 shows the effect of sweep rate on the main characteristics of the reduction process.
Increasing the sweep rate over the range 20mVs ^ to 300mVs ^ resulted in a cathodic shift of the peak potential from -1.170V to 1.220V, a slight increase of the peak width (E° -(20mV) and an increase of the peak to peak potential separation from 215mV to 24-OmV.
c ' The cathodic peak current I increases linearly
i p2 with (sweep rate)2 (Figure III.5.9), with a zero intercept. The
c' -1
current function I v 2 remains essentially constant over the P2 J
range of sweep rate considered.
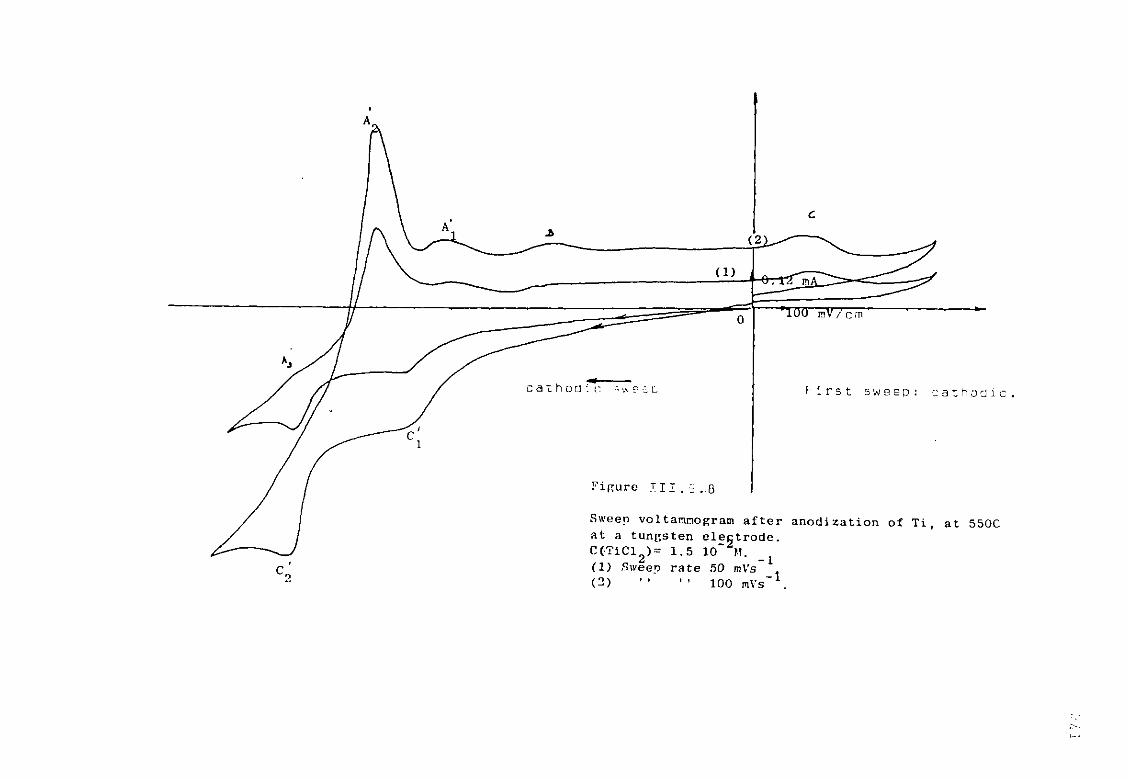

TABLE III. 5.3
c 1 P2
x 10
mA
i a ' P2 x 10
mA
i a
P2 i c
P2
V
mVs ^
c ' e
P2 mV
c ' e -P2
t E / p/2 mV
a ' r» ' E - E P2 P2
mV
j c ' -h i V
p 2
mA(mVs" E 1 - 2
x 100
1. 8 x 2 0. 7 X 2 0.39 20 -1170 140 215 4.02 X 2 2.72 x 2 1 3 X 2 0.48 50 -1170 140 220 3.85 X 2 3. 4 x 2 2.62 X 2 0.77 75 -1180 145 220 3.92 X 2
4. 5 x 2 2.96 X 2 0.65 100 -1200 150 230 4. 5 X 2 4. 7 x 2 3.15 X 2 0.67 150 -1200 150 235 3.83 X 2 5. 3 x 2 3.32 X 2 0.62 200 -1220 160 240 3.74 X 2 6. 7 x 2 5. 5 X 2 0.82 300 -1220 160 240 3.87 X 2
CTi(II) = X- 5 2 1 0" 2 M
2 Tungsten electrode A = 0.0314 cm Ag/Ag(l) IM reference electrode

CnA )
244
The ratio of anodic to cathodic peak current is less than
unity and does not increase steadily with increasing the
sweep rate. (Table III. 5.3.). c' c c A plot of logfl - I } versus E was found to v p2
be linear over the range 0.5, 0.9 I with a slope of 60.1 mV c' c c The corresponding plot of log^I^ - I versus E was curved.
i
(Figure III.5.10 and Figure III.5-11).
Discussion
It seems that the electrochemical properties of the
reduction Ti(II) + 2e = Ti present some differences at platinum
and tungsten electrodes. c -h
The linear plots of I vs v vs v indicate that P in both cases the process is controlled. The cathodic shifting
peak potential also suggests a certain irreversibility, a
hypothesis which is also indicated by the rather large values
for the peak widths and peak-to-peak potential separation. c c The linear plot of E vs log^ . - I j at the platinum
electrode may be interpreted in terms of
(i) a reversible electrochemical reaction, where
both reactant and products are soluble (134).
Thus the Heyrovsky Iklovic equation applied
E = +
§ Lo g ( L L _ L _ I )
for the range 0.3 - 0.7 I . B P (ii) a quasi-reversible charge transfer with E c = E^ + RT Logfl -I \
p s cc f ;
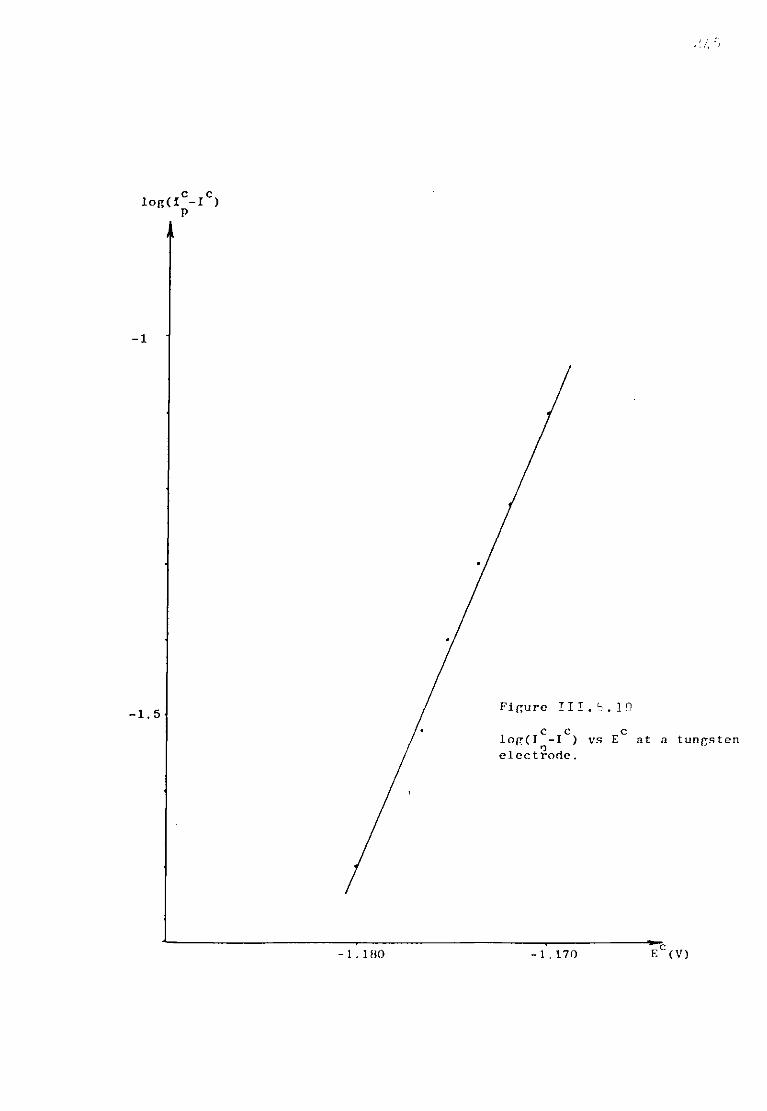
10r(ic-ic) P
A
-1
- 1.180 -1.170
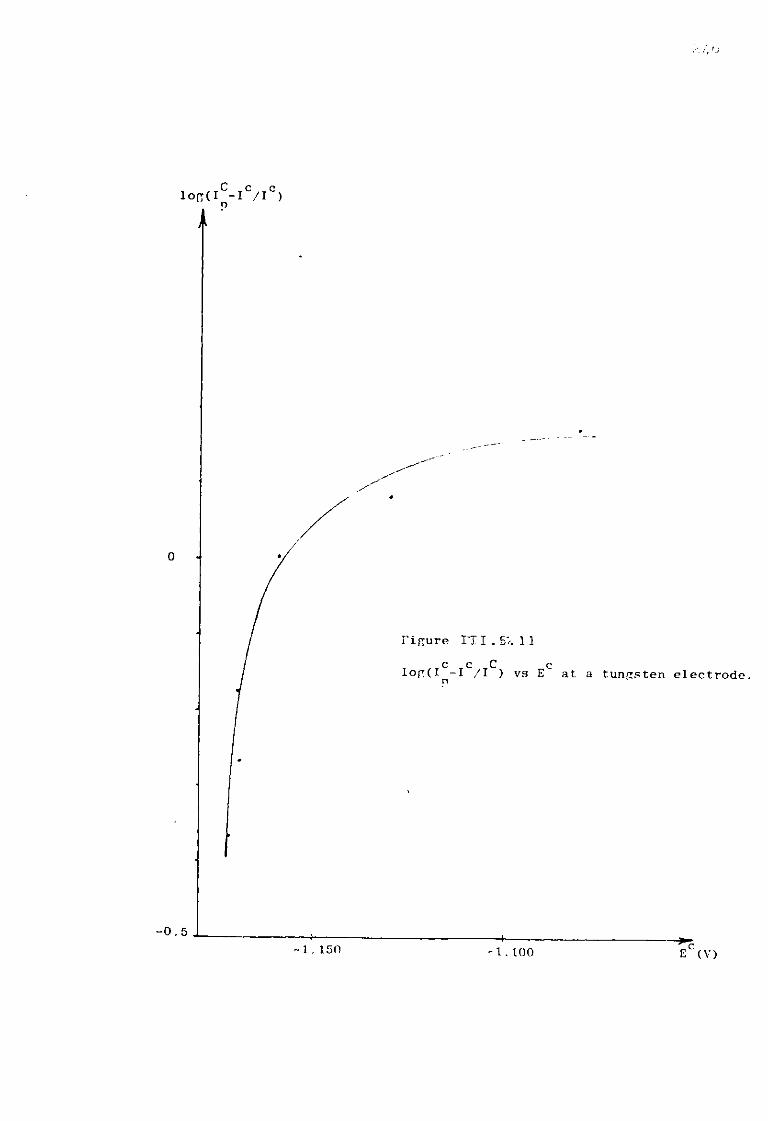
l o c ( I C - I C / I C ) o A '
Figure IT I . 5\ 1 1
c c C c log(I -I /I ) vs E at a tungsten electrode r>
-0.5 - 4 -
-1. 150 - 1 . 1 0 0 E°(V)
(a being the charge transfer coefficient of the cathodic step). The presence of an anodic peak on the reverse
voltammogram indicates that the process possesses a certain reversibility. It seems reasonable to ascribe this cathodic process to a quasi-reversible reduction associated with the formation of a soluble product. The "alloying" ability of Pt and Ti has already been reported (75) in Flinak at 500°C. In addition, a definite irreversibility was noticed in the same melt during the final reduction of tantalum species (19).
.1 r> i The above points could account for the large values of
and E a - E'
E" - Ec P2 p2 /
p2 p2
The alloying effect on the other hand was not observed in the case of tungsten electrode and the linear plot of
c c c log(I - I )vs E confirms the assumption. However, the ratio 3. I which is less than unity would tend to disprove it and, as
ic P
has been suggested in the case of a platinum electrode, an irreversible characteristic could be involved here too, justifying the irreversible properties displayed in the table III. 5.3. From the slope of the figure III.5.10, an n value of 1.94- can be estimated on the basis of a reversible system involving the formation of an insoluble product.
III.5.3- Chronopotentiometric study of Titanium (II) species:
Cathodic chronopotentiograms were recorded, over a wide range of current densities resulting in transition times between 0.03s to 3s. The morphology of the curves obtained has

also been found to be dependent upon the nature of the micro _2
electrode. After anodization of Ti corresponding to 1.5 10 _2
and 2 10 M the working micro electrode was maintained at -0.9V (vs Ag/Ag(l)) in order to avoid further oxidation of the Ti(ll) species.
All chronopotentiograms have been recorded on the screen of the storage oscilloscope and the transition times measured in situ by a simple tangent construction. It has been assumed that the transition times obtained correspond to the system described by the cathodic wave C^. This was a reasonable assumption since the starting potential had been fixed at -0.9V as stated previously.
r i
At a platinum electrode, the plot of X 2 vs t for the reduction wave C^ resulted in two straight lines for two different concentrations with zero intercept. For small current
i densities the product iX2 presents smaller values. This decrease in value of iX2 with current densities is not a characteristic of convection effects (178) which would have been noticed at low current densities (Table III.5.1. and figure III . 5 .12/111 .5.13) . ]h 1/2
X - t The plot of Log ( ) versus electrode potential
t 2' gave a straight line in the case of a platinum electrode but the line was definitely curved for a tungsten micro electrode.
JL i
However, the plot of Log (x2 - t2) on the latter could be assimilated to a straight line, but no linear relationship has been observed at a platinum electrode (pigure III. 5.14- and III.5.15), but the n value estimated from the slopes of the graphs has been found to be close to the postulated value 2, 1.96 and 1.94- respectively. The theory predicts a slope of nF for the
RT
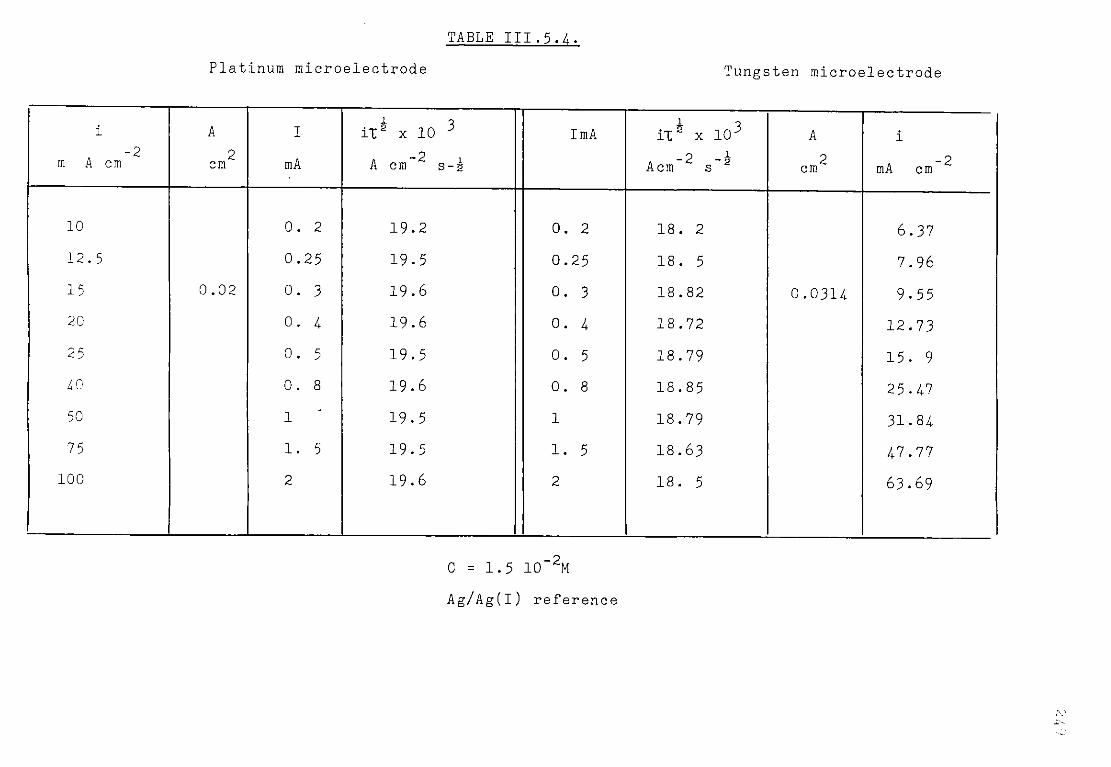
TABLE III. 5.1. Platinum microelectrode Tungsten microelectrode
i -2 m A cm
A 2 cm
I
mA
1 o ila x 10 ^ A cm 2 s-g
ImA 1 Q
iT2 x 10^ 2 1
Acm s"2 A 2 cm
i
mA cm-2
10 0. 2 19.2 0. 2 18. 2 6.37 12.5 0. 25 19.5 0.25 18. 5 7.96
i—1 0.02 0. 3 19.6 0. 3 18.82 0.03H 9.55 20 0. 1 19.6 0. 1 18.72 12.73 25 0. 5 19.5 0. 5 18.79 15. 9 10 0. 8 19.6 0. 8 18.85 25.17 50 1 19.5 1 18.79 31.81 75 1. 5 19.5 1. 5 18.63 17.77
100 2 19.6 2 18. 5 63.69
C = 1.5 10"2M Ag/Ag(l) reference


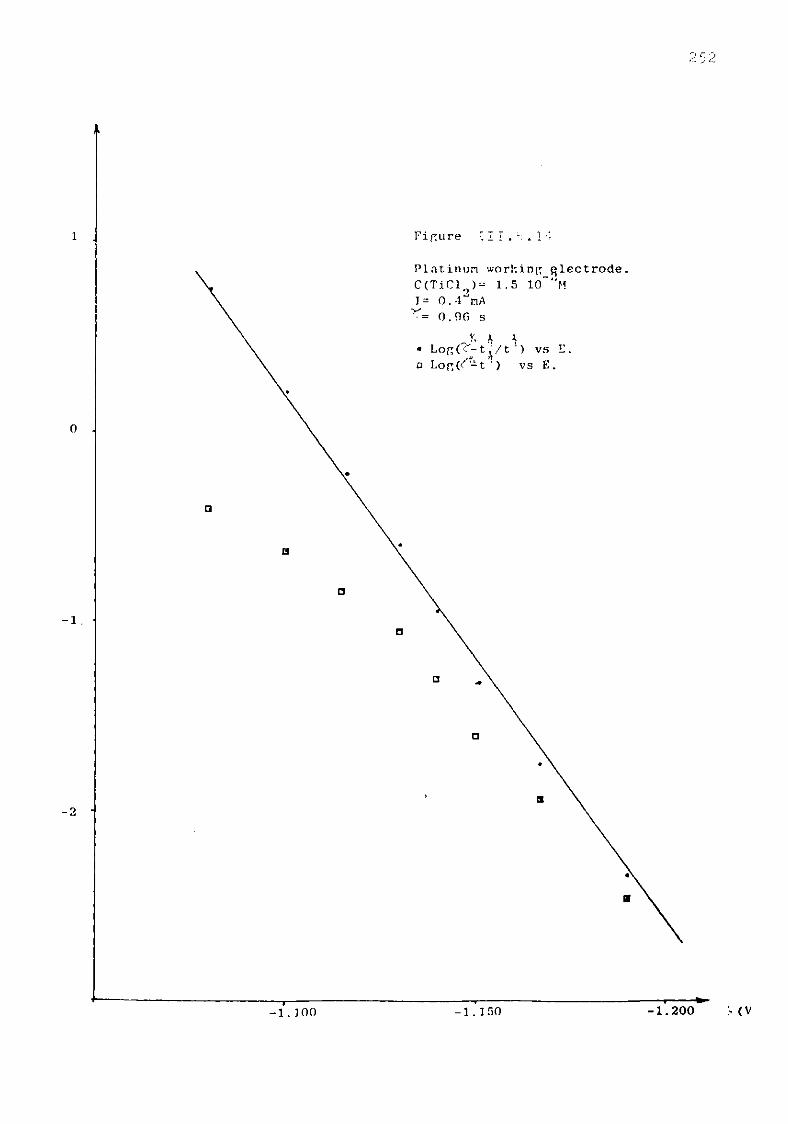
222
Figure [ I I . . 1
-1 .100 -1 . 150 - 1 . 2 0 0 < v

Figure 1 1 1 . 5 . 1 5
Tungsten working electrode. I = 0.5nA
1.4s
- i v h • Log( r^tI/t") vs E . a Log(2Lt' !) vs E.

2 54
plot of Log (x2 - t2) versus EC in the case of a reversible i
tH
system where both product and reactant are soluble. For the formation of an insoluble product, a linear plot of
I JL C Log (x2 - t2) vs E with the same slope must be considered. _2
The same plots performed at a difference concentration, 210 M resulted in approximately the same results.
The plot of the quarter wave potentials against the applied current showed an increase with the current increase. Concentration variations had little effect on E^• As the values were measured from oscilloscope traces a certain margin of error has to be considered which could explain the scatter of the points, especially at high current densities (Figure 111.5.16).
In addition current reversal, using the same current pulse and magnitude, resulted in a reverse transition time less than (average 0.29) of that obtained for the forward reaction at a platinum electrode. At a tungsten electrode the ratio had a mean value of 1.22.
III. 5. 4-. Discussion
The mechanism for the reduction of Ti(ll) species, assuming that divalent titanium is formed during anodic dissolution which in view of the results presented in this study seems reasonable, appears complex. No decisive conclusion can be formed, either at a platinum or at a tungsten electrode, as to whether the process is reversible and leads to a soluble or insoluble process.
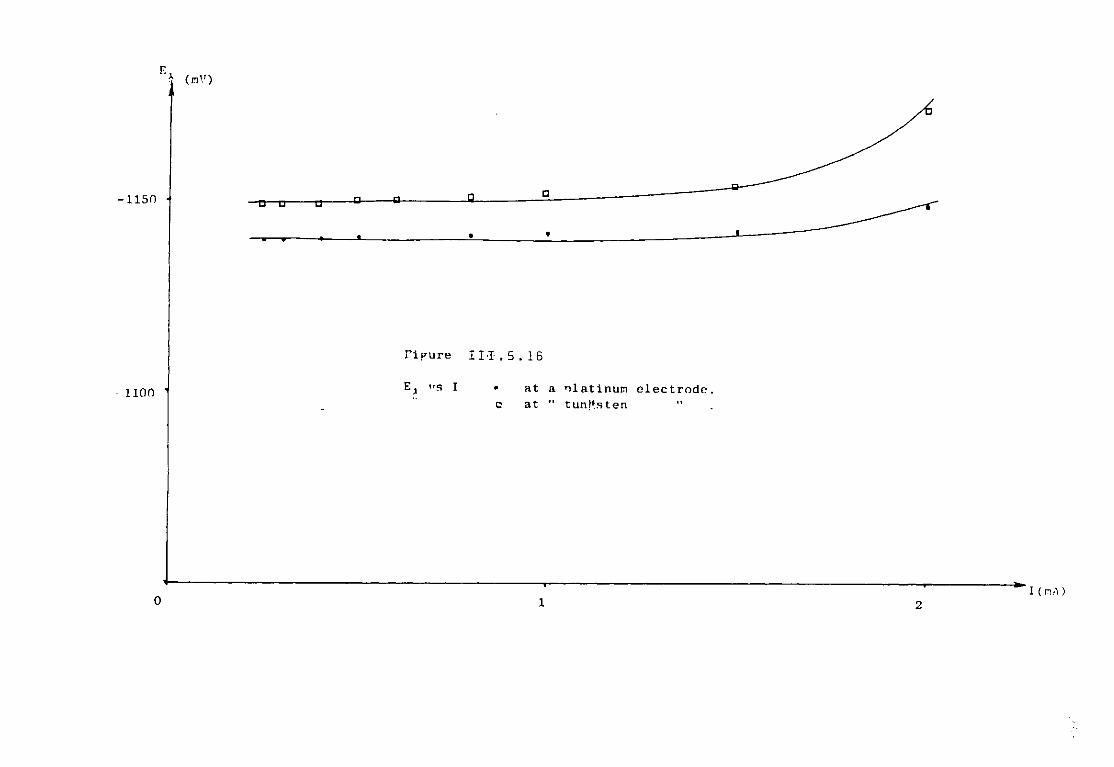
\ (nV)
-1150 4 ~n—cr
Fipure I I I . 5 . 1 6
1100 ex vs i at a nlatinum electrode,
at " tungsten
i (na)
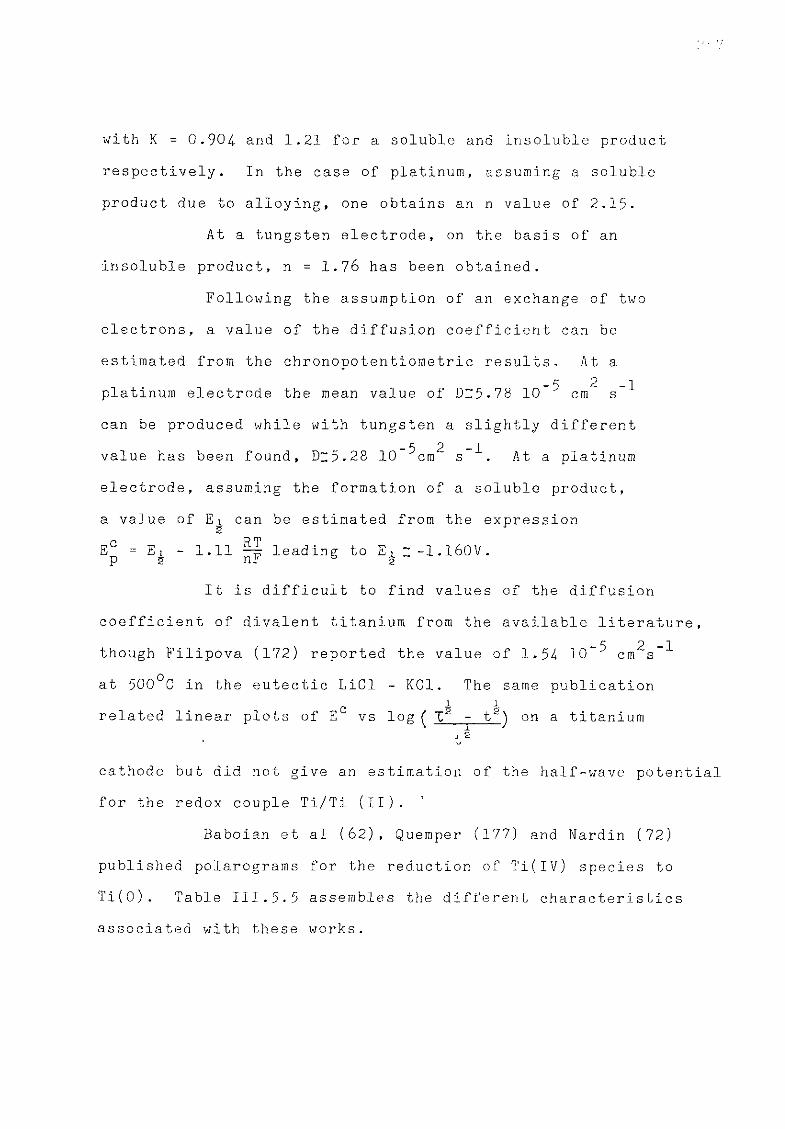
with K = 0.904- and 1.21 for a soluble and insoluble product
respectively. In the case of platinum, assuming a soluble product due to alloying, one obtains an n value of 2.15.
At a tungsten electrode, on the basis of an insoluble product, n = 1.76 has been obtained.
Following the assumption of an exchange of two electrons, a value of the diffusion coefficient can be estimated from the chronopotentiometrie results. At a
-5 2 platinum electrode the mean value of D15.78 10 cm s can be produced while with tungsten a slightly different
- 5 2 - 1 value has been found, Dl5.28 10 cm s At a platinum electrode, assuming the formation of a soluble product, a value of E^ can be estimated from the expression s R> RT Eu = E l - 1.11 ^ leading to E x 1-1.160V. p 2 nr 2
It is difficult to find values of the diffusion coefficient of divalent titanium from the available literature,
c 2 1 though Filipova (172) reported the value of 1.51 10"^ cm s at 500°C in the eutectic LiCl - KC1. The same publication
i x related linear plots of E vs log ( Ta - tg) on a titanium ~ ~ ?
cathode but did not give an estimation of the half-wave potential for the redox couple Ti/Ti (II). '
Baboian et al (62), Quemper (177) and Nardin (72) published polarograms for the reduction of Ti(IV) species to Ti(0). Table III.5.5 assembles the different characteristics associated with these works.

TABLE III .5.5.
E (v)
A ssumed reaction
melt T (°c)
refer en'
-1 . 04 (Ag/Ag(I) ) Ti(Il) + 2e = Ti LiCl-KCl 550 62 -1 .250 (Ag/Ag(I) ) Ti(II) t 2e = Ti LiCl-KCl 450 177 -1 .150 (Ag/Ag(I) ) Ti(II) + 2e = Ti BaCl2-LiCl-KCl 470 72 -1 .660 (Ni/Ni(II)) Ti(III)+ 3i - Ti NaF-LiF-KF 500 75 -1 .160 (Ag/Ag(I)) Ti(II) t 2e = Ti LiCl-KCl 550 This wor! -1 .408 (Ni/Ni(II) Ti(III) + 36 ^ Ti NaF 1027 This wor'
More recently, Chassaing et al (195) reported a study on the different reduction steps of the titanium species at 700°C in different chloride-based melts. They observed the presence of a step involving Ti(ll) species in pure CsCl, LiCl and the eutectic LiCl-KCl. On the other hand, they did not report the existence of Ti(ll) complexes in the eutectic CsCl-KCl at 400°C and interpreted this phenomenon in terms of thermal destabilization of Ti(ll) in favour of Ti(lll) species.
Mamantov et al (75) made an investigation of the titanium system in molten NaF.KF.LiF at 500°C and their results showed that the final reduction reaction proceeds directly from Ti(IIl) to Ti(0) as apparently in the eutectic CsCl-KCl. According to Hamer et al (192) the reduction potential E - -1.798V
against the Ni/Ni(ll) reference system
becomes -3.014V versus Ag/Ag(l) in molten fluorides. Unfortunately, Chassaing et al (195) did not report any reduction potential value for the couple Ti/Ti(lll) in CsCl-KCl and thus no definitive conclusion is possible.
One can, of course, speculate on the cause of the destabilization of Ti(II) in fluoride mixtures as well as in the eutectic CsCl-KCl, but Orgel (193) offers elements of a possible explanation. One has to refer to the crystal field theory which relates the origins and the effects of surrounding ligands assimilated to negative point charge on the central transition ion. For the sake of simplicity, one can attribute a particular configuration to Ti(III) and Ti(Il) (see section III.2.5 and III.5.1.3) e.g. octahedral and tetrahedral. The external electronic shell for Ti(lll) and Ti(Il) is partially filled and shows that Ti(III) is a d 1 ion and Ti (II) a d 2 ion. The crystal field theory shows in addition that, owing to the action of the ligand , the five d - orbitals are split into two groups with an energy separationA» called the crystal field stabilizing energy as a function of the configuration. For example this energy is less for a tetahedral configuration than for an octahedral, the orbitals possessing different symmetries.
Changing from a pure chloride environment to a fluoride one results in an increase of the CFSE A (193) . Besides, as the size of the fluoride ligands is less than that of the chloride for an identical charge, it is possible that the interatomic distance between the central ion and the ligand is diminished with the fluoride configuration. More specifically, the Ti(ll) ion, having two external e l e c t r o n s , w.i L I r e p e L the Ligands m o r e strongly than its
counterpart Ti(III) which has only a single external electron. It has been demonstrated (194-) that the CFSE is also proportional to Qr^ where Q is the charge of the ligand, r the mean value
r5
of the radius of a d orbital and R the interatomic distance.
Thus one can easily imagine a situation where the GFSE is greater for the Ti(lll) than for the Ti(Il) complexes only because the polarizing power of the solvent anion (Z_, Z the
r3
charge of the anion and r the ionic radius) has increased. Another fact which reinforces this assumption has been reported by Mamantov (75) who found evidence for the same destabilizing effect in mixed systems such as fluoride - chloride. Clearly, the fluoride complexes appear more stable. However, it is only tentatively assumed that the field effect is the main contribution to the destabilization of Ti(Il) species in fluoride mixtures since it does not take thermal contributions into account.
As far as the rather particular case of the eutectic CsCL-KCl is concerned, it is difficult a priori to invoke a unique thermal effect rather than a change in the activity of the CI particles. The cations and Li + differs in relation
to their respective size, in tefms of polarizing power that of Li + is much greater than that of C - . As a consequence, one
+ can conceive that the Li ions will fix a greater number of CI anions resulting in a lesser CI activity. This is equivalent to saying that the acidity of the molten halides is increased by the addition of Li+ cations rather than by the addition of
-f Cq , but it is still too early to correlate a change of acidity with the stability of a given solute complex.
Regarding the electro deposition of titanium from

molten halides at temperatures ranging from 100°C to 700°C, a reduced number of intermediaries in the overall reduction is certainly beneficial for the overall efficiency and could be interesting in increasing the solubility of the feed material. Ti(IIl) complexes do indeed seem to be much more soluble than divalent species (195) in molten halides and therefore a process based on mixtures stabilizing Ti(III) species could prove economically viable.
CHAPTER IV
General Conclusions and Future Work
This investigation highlighted many of the problems
which are associated with the electrodeposition of refractory
metals from fused salts. This chapter is not intended to
review all the results underlined during the research but to
select the general features of the electrochemical properties
of titanium in molten chlorides and fluorides.
IV.1. General Conclusions
It has been confirmed that in molten chlorides the final reduction step of titanium involves divalent titanium species. No divalent titanium complexes have been observed in molten fluorides where the final reduction to metal proceeds directly from Ti(IIl) ions. In addition, a very low solubility of TiCl^ has been observed at 4-50°C in the LiCl-KCl eutectic.
The introduction of alumina to NaF and NaF-AlF^ mixtures has been marked by an anodic shift of the potential of the reduction of the aluminium species at a platinum electrode. It is still difficult to assess a definite mechanism which could explain this phenomenon but a change of the overvoltage associated with the reduction reaction could be involved. This effect could be taken as an indication of the primary deposition of aluminium. The possible change in the activity of F particles in the vicinity of the electrode could have altered the kinetics of the dissociation of the aluminium-containing complexes and subsequently dramatics]ly changed the global mechanism of
the reduction.

The voltammetric study of N&F.Ti20^ mixtures at 1300K showed a similar anodic shift of the final reduction potential. A modification of the structure of the double layer due to a local change in acidity has here again been assumed to be at the origin of this potential variation.
An ohmic drop, probably coupled with a certain irreversibility during reoxidation of the generated products, could explain the large potential difference which has been observed in both systems between the cathodic and anodic proce ss.
As almost 200mV separate the reduction of Ti species in mixed oxide fluoride systems from the cathodic solvent limit, several attempts to electrolyse NaF-Ti20^ mixtures have been performed. Interesting results have been obtained on nickel substrates where coherent coatings of limited thickness have been produced. Dendritic growths have been observed when decreasing the electrolysing potential or by changing from planar cathode to more intricate shapes. The nature of the cathode substrate has also been of critical importance as no platings have been attained on iron or stainess steel electrodes.
The influence of the composition of the electrolysing bath has also been underlined as,the codeposition of A1 and Ti has always been observed from cryolitic mixtures resulting in a very poor titanium current efficiency. In addition, the deposits obtained in such baths showed large amounts of occluded melt which necessitated further purification.
EV.2. Future Work
The c o n c e p t of the e l e c t r o r e d u c t i o n p r o c e s s e s on
the t y p e of d e p o s i t s h a s a l r e a d y been d i s c u s s e d jn p r e v i o u s

chapters. The design of a plating bath for instance, involves choosing systems which have the right kinetics. It is well known that fluoride melts, by opposition to chlorides, have the characteristic of inhibiting the formation of polynuclear species. Theoretically, it should be possible, using a suitable mixture of alkali halides or alkaline earth halides, to obtain a plating bath leading to coherent deposits, the only provision being that the overvoltage required to produce these deposits will not take the deposition potential beyond that of the solvent cations. It would now be interesting to investigate mixed systems (i.e. chlorides-fluorides) in order:
a) to lower the melting temperature b) to shift the reduction potential to
more anodic values
c) to benefit the properties of the fluoride mixtures with regards to the existence of simple ionic entities, higher stable valency states and a certain solubility of oxides.
Regarding the electrodeposition of Ti, a propert combination of halides could prove beneficial. This does not mean that all the interest in cryolitic melts has to be forgotten but it is necessary to look for improved experimental conditions, keeping in mind that the cryolite mixtures cannot be used directly to produce titanium metal. This requires further work which must focus on the determination of the exact nature of the species involved in the dissolution of oxide in fluoride

based melts, and their selective stabilities in the presence of various refractory metals. Subsequently, it is critical to determine accurately the relation existing between acidity and electrochemical properties.
Traditional electrochemical techniques apparently cannot fulfill this task on their own and must be coupled to more powerful physical techniques of analysis (in situ spectroscopy for instance).

REFERENCES
1. N.H. Nachtrieb., M. Steinberg. J. Amer. Chern. Soc. 72, 3558 (1950).
2. D. Inman., A.D. Graves and R.S. Sethi. Chapter 5 in Electrochemistry. Volume 1., Specialist Periodical Report. The Chemical Society. London. 1970.
3. Yu. K. Delimarskii., E.M. Skoberts and L.S. Berenblyum. J. Phys. Chem. USSR 22, 1108, (1918).
1. S.N. Glengas., E. Rideal. Proc. Roy. Soc. 233A, 14-3, (1956).
5. D. Inman. J. Sci. Instr. 39, 391, (1962).
6. J.O.M. Bockris., G.J. Hills, D. Inman and L. Young. J. Sci. Instr. 33, 138, (1956).
7. Yu. K. Delimarskii., I.D. Panchenko. Dokl. Acad. Nauk. USSR 9JL, 115, (1953).
8. Yu. K. Delimarskii., I.D. Panchenko. Ukrain. Khim. Zhur. 19, 17, (1953).
9. H.A. Laitinen, C.H. Liu and W. Ferguson. Anal. Chem. 30, 1260, (1958).
10. H.C. Gaur., H.L. Jindal. J. Electrochem. Soc. 16, 137, (1968).
11. G. Mamantov., D.C. Manning. Anal. Chem. 38, H91, ("1966).
O /
12. G. Mamantov., D.L. Manning. J. Electroanal. Chem. 18, 309 (1968).
13. E. Schmidt. Electrochim. Acta. 8, 23 (1963)
Ik- H.A. Laininen., W.S. Ferguson. Anal. Chem. 29, 4 (1957) .
15. D, Inman., J.O.M. Bockris. J. Electroanal, Chem. 3, 126 (1962).
16. F. Caligra., L. Martinot and G. Duyckaerts. J. Electroanal. Chem. 16, 335 (1968).
17. S. Senderoff., G.W. Mellors. J. Electroanal. Chem. 114, 556 (1967). J. Electroanal. Chem. 114, 586 (1967).
18. R. Spencer. Thesis 1973 London.
19. G. Warren. Thesis 1976 London.
20. Yu. K. Delimarskii., B.F. Markov. "Electrochemistry of Fused Salts". Sigma Press -Washington D.C. 1961
21. C.H. Liu., K.E. Johnson and H.A. Laitinen. Molten Salts Chemistry. ED. M. Blander - Interscience -New York 1964.
22. H.A. Laitinen., R.A. Osteryoung. Chapter 4 "Fused Salts" Ed. B.R. Sundheim. Macgraw-Hill New York 1964.
23. G.J. Hills., D. Inman and L. Young. Proc. 8th CIICE (90) 1956.
24.. E.R. Brown., R.F. Large. in "Technique of Chemistry" volume 1. part IIA Electrochemical Methods. Ed. A. Weissenberger., B. Rossiter/Wiley Interscience 1971.
25. R.S. Nicholson., I. Shain. Anal. Chem. 36/707 (1964).
26. D.L. Manning., G. Mamantov. J. Electroanal. Chem. 6, 227 (1963).
27. D.L. Manning., G. Mamantov. J. Electroanal. Chem. 7, 102 (1964).
28. D.L. Manning. J. Electroanal. Chem. 7, 302 ( 1 9 6 4 ) .
29. S. Senderoff., G.W. Mellors and W.J. Reinhart. J. Electrochem. Soc. 112, 840 (1965).
30. C.E. Thalmager., S. Bruckenstein and D.M. Gruen. J. Inorg., Nucl. Chem. 26, 347 (1964).
31. G. Mamantov., D.L. Manning. J. Electroanal. Chem. and Interf. Electrochem. 18, 309 (1968).
1 32. E.A. Ukshe., N.G. Bukun., D.I. Leikis and A.N. Frumkin.
Electrochim acta 9, 431 ( 1 9 6 4 ) .
33. A.D. Graves., G.J. Hills and D. Inman. Advances in Electrochem. volume 4 p. 161 New York (1966).
34. J. 0'M Bockris., D.B. Matthews. Proc. Roy. Soc. London. Sec. A., 292, 479 (1966).
269
35- J.O'M. Bockris., G.A. Razumney. Fundamental Aspects of Electrocrystallisation., Plenum Press. New York 1967.
36. B.E. Conway., J.O'M. Bockris. Pro. Roy. Soc. London Sec. A. 24-8, 394- (1958).
37. A. Damjanovic., J.O'M. Bockris. J. Electrochem. Soc. 110, 1035 (1963).
38. M. Fleischman., H.R. Thirsk.
Advances in Electrochemistry Vol.3. Chap. 3. Ed. Delahay and Tobias Interscience Pub., Inc./New York. 1963.
39. W. Mehl., J.O'M Bockris. J. Chem. Phys. 27, 1332 (1957).
4.0. H. Fischer. "Electrolytishe Abscheidung und Elektrokristallisation von Metallen" . Springer Verlag., Berlin., Gottingen Heidelberg (1954-).
4.1. A.R. Despic., K.J. Popov. "Transport Controlled Deposition and Dissolution of Metals". in "Modern Aspects of Electrochemistry" Ed. B.E. Conway., J. O'M. Bockris. Vol. 7, Chap. 1., 199.313 - Plenum Press New York (1972) .
4.2. A.R. Despic., D.M. Drazic and M. Mirjanic. Faraday Discuss. No.12. 126 (1978).
4-3. A.R. Despic., G. Savic., Maylic and M . Jacovic. J. Appl. Electrochem. 9, 117 (1979).
14. F. Mansfield., S. Gillman. J. Electrochem. Soc. 117, 581 (1970). J. Electrochem. Soc. 117, 1151 (1970).
270
45. J.N. Justinijanovic., J.N. Jovicevic and A.R. Despic. J. Applied Electrochem. 3,193 (1973).
4 6 . J.L. Barton., J.O'M. Bockris. Proc. Roy. Soc. London Ser. A. 268, 485 (1962).
47. D.R. Hamilton. Electrochim. Acta 8, 731 (1963).
4 8 . P.B. Price., D.A. Vermilyea and M.B. Webb. Acta Metal. 6, 524 (1958).
49. H. Fischer., K.Dorsch. German Patent 615959/16-07 (1935).
50. S. Senderoff. Metall. Rev. 11, 97 (1966).
51. J. Barksdale. "Titanium, its occurrence, chemistry and technology" p. 162-170. The Ronald Press. New York (1966).
52. A.R. Stetson. Mat. Design. 57, 81 (1963).
53. R.J.H. Clark "The Chemistry of Titanium and Vanadium". Elsevier Publishers (1968).
54. J.G. Wurm., L. Gravel and R.J.A. Potvin. J. of Electrochem. 10^, 301 (1957).
55. U.P. Elyutin., B.S. Hysov and Yu.Ya. Andreev. Soviet Electrochem. 3, 307-377-481 (1967).
56. E.B. Gitman., I.N. Sheiko. Ukrain. Khim. Zhur. 34, 836 (1968).

271
57. A. tfeser, Electroplat. Metal. Finish 29, 6 (1976).
58. J. Wurm. "European Conference on the Development of Molten Salts Applications". . Geneva. Batelle (1973) (62-9).
59. K. Matiasovsky., Z. Lubyova and V. Danek. Electrodep. and Surface Treat. 1, 13, 72 (1973).
60. M.V. Smirnov. Transaction of the Institute of Electrochemistry (Moscow). (Trans. Consultants Bureau). Volume 1, 22/31. Volume 1., p. 21. Vol 6. p.l.
61. B.G. Rossokkin., M.V. Smirnov and N.A. Loginov. "Electrochem. of Molten and Solid Electrolytes". .5, 11 (1967).
62. R. Baboian., D.L. Hill and R.A. Bailey. Canad. J. of Chem. 197 (1965).
63. N.I. Anufrieva. Electrokhimiya 6, 729., (1960).
61. R.V. Chernov., A.P. Nizov and Yu. K. Delimarskii. Ukrain. Khim. Zhur. 27, 122 (1971).
65. D. Schlain. , F.Y. MacCawley and !C. Wyche. J. Electrochem. Soc. 116, 1227 (1969).
66. N.E. Straumanis., S.T. Shih and A.W. Schlechten. J. Electrochem. Soc. 101, 16 (1957).
67. B.J. Fortin., J.G. Wurm. , L. Gravel and R.J.A. Potvin. J. Electrochem. Soc. 106, 128 (1959).
272
i
68. D.N. Baraboshkin. "Electrochemistry of Molten and Solid Electrolytes".. Acad. Sci. USSR 5, 83 (1967).
69. Y. Hashimoto., K. Uriya and R. Kono.
Denki Kagaku. 39, 516 (1971).
70. Y. Hashimoto. Denki Kagaku 39, 938 (1971). 39 (1982).
71. S. Tukumoto., E. Tanaka and K. Ogisu. J. Met. 27, 18 (1977).
72. M. Nardin., E. Chassaing and G. Lorthior in "Continuous Production of Titanium from Molten Salts". IMM Meeting Grenoble (1977) .
73. G.W. Mellors., S. Senderoff. J. Electrochem. Soc. 112-266 (1965).
74. A. Kerouanton., V. Plichon. C.R. Acad. Sci. Paris 280c, 197 (1975).
75. F.R. Clayton., G. Mamantov and D.L. Manning. J. Electrochem. Soc. 120, 1153 (1973).
76. W.B. Frank., L.M. Foster.
J. Phys. Chem. 61, 1531 (1957).
77. W. Jander., H. Hermann. Z. Anorg. Allgem. Chem. 239, (1938).
78. C. Kubik., K. Matiaovsky., M. Malinovsky and J. Zeman. Electrochim. Acta. 9, 1521 (1964).
79. E.W. Dewing. Met. Trans. 3, 195 (1972) .
273
80. H. Ginsberg., S. Wilkening.
Metall. 27, 787 (1973).
81. J.C. Mitchell., S.C. Samis. Trans. Met. Soc. AIME 2^5, 1227 (1969).
82. C.E. Ransley., H. Newfeld. J. Inst. Metals. 78, 25 (1950).
83. K. Yoshida., E.W. Dewing. Met. Trans. 3, 683 (1972).
84-. J.P. Saget., P. Homsi., V. Plichon and J. Badoz Lambling. Electrochim. Acta. 20, 819 (1975).
85. J. Thonstad., S. Rolseth. Electrochim. Acta. 23, 223 (1978).
86. J. Thonstad. Can. J. Chem. 34-29 (1969).
87. R. Snow., B.J. Welch. J. Electrochem. Soc. IT?, 1171 (1968).
88. L.N. Antipin. Zh. Fiz. Khim. 29, 1668 (1955).
89. R. Piontelli, B. Mazza and P. Pedeferri. Electrochim. Acta. 1, 2117 (1966).
90. R. Piontelli., G. Sternheim and M. Francini. C.R. Acad. Sci. Paris. 1^2, 1301 (1956).
91. A.A. Revazyan., B.S. Grigoryan and R.G. Shakhnazaryan. Arm. Khim. Zh. 26, (l). 65 (1973)
92. K. Arndt., W. Kalais. Z. Electrochem. 30, 12 (1924).
274
93. J. Brynestad., K. Grjotheim and S. Urnes. Met. Ital. 52, 495 (1960) .
94- W.B. Frank., L.M. Foster. J. Phys. Chem. 64, 93 (1960).
95. C. Solomons., J.H.R. Clark and J.O'M. Bockris. J. Chem. Phys. £9, 445 (1968).
96. B. Gilbert., G. Mamantov and G.M. Begun. J. Chem. Phys. 62, 950 (1975).
97. B. Gilbert., G. Mamantov and G.M. Begun. Inorg. Nucl. Chem. Letters 12, 415 (1976).
98. S.K. Ratkje., E. Rytter. J. Phys. Chem. 78, 1499 (1974).
99. J.L. Holm. Inorg. Chem. 12, 2062 (1973).
100. J. Thonstad. Electrochim. Acta. 12, 1219 (1967).
101. N. Watanabe., T. Asaue. J. Electrochem. Soc. Japan 34, 107 (1971).
102. J.L. Holm. "Thermodynamic Properties of Molten Cryolite and Other Fluorides Mixtures". Inst. Inorg. Chem. Univ. Trondheim NTH Norway (1971).
103. J. Thonstad., F. Nordmo and K. Vee. Electrochim. Acta 18, 27 (1973).
104. J. Thonstad., F. Nordmo and J.K. Rolseth. Electrochim. Acta. 19, 761 (1974).
275
105- A. Vajna. Bull. Soc. p. Electr. 1^, 85 (1952).
106. R.J. Snow., B.J. Welch. Austral. Inst. Min. Met. Proceed. 221, 4-3 (1967).
10 7. R. Winand. Electrochem. Acta. 17, 251 (1972).
108. H.R. Bronstein., D.L. Manning.
J. Electrochem. Soc. 19, 125 (1972).
109. J. Thonstad. J. Electrochem. Soc. 10, 316 (1968).
110. S. Pizzini., K. Morlotti and E. Roemer. J. Electrochem. Soc. 113, 1305 (1966).
111. W.P. Will., R.F. Barrow. Trans. Faraday Soc. 55, 730 (1959).
112. C.J. Smithells. Metals Reference Book. Volume II. London Butterworths (1962). F.A. Shunk. "Constitution of Binary Alloys". Second Supplement. Macgraw-Hill 1969.
113. A.G. Freeman., J.P. Larkindale.
Inorg. Nucl. Chem. Let. 5, 937 (1969).
111. J.A.N.A.F. Thermochemical Tables. Second Ed. US. Department of Commerce. Nat. Bureau of Standard.
115. G.N. Lewis. J. Franklin Inst. 226, 293 (1938).
116. B. Tremillon.
Pure Appl. Chem. 25, 395. ( 1971).

276
117. E.A. Guggenheim. J. Phys. Chem. 33. 842 (1929).
118. J. Brynestad., K. Grjotheim., F. Grunwald., J. Holm and S. Urnes. Discuss. Farad. Soc. 32, 90 (1967).
119. H. Flood., F. Forland. Acta. Chem. Scand. 1, 592 (1947).
120. C.K. Jorgensen. Structure and Bonding (Berlin) 1, 234 (1960).
121. P.G. Zambonin., J. Jordan. J. Amer. Cer. Soc. 91, 2225 (1969).
122. R.S. Nicholson., I. Shain. Anal. Chem. 36, 706 (1964). R.S. Nicholson. Anal. Chem. 38, 1406 (1966).
124. R.S. Nicholson., I. Shain. Anal. Chem. 27, 178 (1965). W.T. de Vries., E. von Dalen. J. Electroanal. Chem. 10, 183 (1965).
125. P. Delahay. "New Instrumental Methods in Electrochemistry". Interscience Pub. New York, London (1954) p.132.
126. R.H. Wopschall., I. Shain. Anal. Chem. 39, 1514. (1967).
127. J.P. Saget. Ph.D. thesis Paris (1973).
128. T. Forland., S.K. Ratkje. Acta. Chem. Scand. 27, 1883 (1973).

277
129. S.K. Ratkje. Electrochem. Acta. 21, 515 (1976).
130. M. Rolin., M. Bernard. Bull. Soc. Chem. France 129, (1962).
131. A. Tual., M. Rolin. Electrochem Acta. 17, 2277 (1972).
132. R.S. Nicholson. Anal. Chem. 37, 1351 (1965). Anal. Chem. 37, 667 (1965). N.R. de Tacconi., A.J. Calandra and A.J. Arvia. Electrochem. Acta. 18, 571 (1973).
133. G.J. Janz. "Molten Salts Handbook" Academic Press (1967). London. New York.
131. G. Mamantov., D.L. Manning and J.M. Dale. J. Electroanal. Chem. 9, 253 (1965).
135. M. Rey. Electrochem. acta. 11, 991 (1969).
136. N.S. Schuman. Anal. Chem. ^1, 112 (1969).
137. D.M. Kolb. "Physical and Electrochemical Properties of Metal Monolayers on Metallic Substrates". In "Advances in Electrochemistry and Electrochemical Engineering" Volume II. Ed. by Gerischer -C.W. Tobias. Wiley Interscience (1978).
138. R. Monier. Ph. Grandjean. Helv. Chem. Acta. 2163 (1960)
139. R. P iontelli. Metallurgia Ital. 52, 169 (1960).
278
110. E.W. Dewing. Met. Trans. 1, 1691 (1970). E.W. Dewing.
Met. Trans. 1, 2211 (1970).
111. T.P. Madhavan., K. Malinovsky and V. Danek. Chem. Zvesti 25, 253 (1971)
112. I.N. Anikin., I.I. Naumova and G.V. Rumyantseva. Sov. Phys. Crystallogs. 10, 172 (1965).
113. G. Boe., K. Grjotheim., K. Matiasovsky and P. Fellner. Canad. Met. Quarterly 10, 179 (1971).
111. R. Spencer. PhD. Thesis 1970. University of London.
115. T. Notoya., R. Midosikawa. Denki Kagaku. 36, 111 (1968)
116. C.H. Liu., K.E. Johnson and H.A. Laitinen. "Molten Salt Chemistry". M. Blander ed. New York/Interscience
(1961) .
117. D.A. James. J. Electrochem. Soc. 122, 921 (1975).
118. A.J. Bard. Anal. Chem. 33, 11 (1963).
119. A. Kisza., U. Twardoch. Bull. Acad. Sci. Polon. 20, 1063 (1972).
150. D. Inman., A.D. Graves. J. Electrochem. Soc. 209, 181 (1965).
151. P.G. Dudley. M.Phil. Thesis.University of London 1980.
279
152. D. Inman. Ph.D. Thesis. University of London (1957).
153. C.A. Melendres., J.P. Ackerman and R.K. Steunenberg. Proc. Int. Symp. Molten Salts. Electrochem. Soc. (1976). Ed. J.P. Pemsler/J. Braunstein/K. Nobe/D.R. Morris/N.E. Richard.
154-. Y. Kanzaki., M. Takahashi. J. Electroanal. Chem. 58, 349 (1975).
155. N.A. Minh., B.J. Welch. J. Electroanal. Chem. 92, 179 (1978)
156. S.W. White., D. Inman and B. Jones. Trans. Faraday. Soc. 6 4 , 2841 (1968).
157. S.H. White. "The Role of Water During the Purification of High Temperature
11 11 Ionic Solvents in Ionic Liquids". D. Inman., D.G. Lovering eds. Plenum Press. p.185. 1981.
158. R. Lysy., R. Combes. J. Electroanal. Chem. 83, 287 (1977).
159. D.L. Mariele., D.N. Hume. J. Electrochem. Soc. Jt, 354 (1960).
160. N.P. Yao., L.A. Hereday and R.C. Saunders. J. Electrochem. Soc. 118, 1039 (1971).
161. M. Soerlie., M. Oeye. Inorg. Chem. 17, 2473. (1978).
162. S.N. Flengas., T.R. Ingraham. Canad. J. of Chem. 38, 813 (1960).

280
163. S.N. Flengas., P. Pint. Canad. Met. Quart. 8, (2) 151 (1969).
164. J.H. Mui., S.N. Flengas. Canad. J. of Chem. £0, 997 (1962).
165. R. Huq. "Electrodeposition of Ti from Molten Chlorides" 1976 unpublished work. Imperial College.
166. D.H. Brown., A. Hunter and W.E. Smith. J. Chem. Soc. (Dalton Transac) 1, 79 (1979).
167. R. Piontelli., G. Sternheim and N.J. Francini. Chem. Phys. 2£, 113 (1965).
168. A. De Haan., H.V. Poorten.,
C.R. Acad. Sci. Paris. 261, 5462 (1965).
169. D.L. Prior. Ph.D. Thesis. University of California L.A. (1971).
170. N.A. Loginov., M.V. Smirnov.,
Transaction (Trudy) No. 4 of the Institute of Electrochem. Urals Acad, of Sci. 2, 21 (1964).
171. R. Wohler. i Liebig's ann 74, 212 (1850).
ir H. Goerges., A. Stahler. Pogg. ann £2, 3400 (1909).
172. J.A. Filippova., A.N. Baraboshkin. Tr. In. Ta. Elektrokhimi Ural'sk Nauch. Tsentr. ANSSR. 27, 35 (1978).
281
173. P. Von Ehrlich., R. Schmitt. Z. anorg. allg. Chemie 308, 93 (1961). P. Von Ehrlich., H. Kuhln. Z. anag. allg. Chemie. 292, 139 (1957).
171. F.C. Kracek. J. Am. Chem. Soc. j>2, 1136 (1930). K. Komarek., P. Herasymenko. J. Electrochem. Soc. 105, 216 (1958).
175. A.D. Pelton., W.T. Thompson. Can. J. of Chem. £8, 1585 (1970).
176. Phase Diagrams for Ceramists. "Nat. bureau of standard". The Amer. Ceram. Soc. p.332. Supplement (1969).
177. F. Quemper., D. Deroo and N. Rigaud. J. Electrochem. Soc. 119, 1353 (1972).
178. J.M. Coulson., J.F. Richardson. Chemical Engineering 1, 220 (196l).
179. D.M. Gruen. in "Fused Salts" p.301. ed. B.R. Sundheim. Macgraw-Hill (1961).
180. P.A. Foster. J. Am. Ceram. Soc. /£, (l) 116,(1962).
181. E.P. Dergunov. Dokl. Alead. Nauk. SSSR 60, 1185 (1918).
182. P.A. Foster, J. Am. Ceram. Soc. 13, (2) 67 (1960).
183. Y. Hayakawa., H. Kido. Sci. Rept. Saitama. Univ. 1, 11 (1952).
282
181. M.V. Smirnov., Yu. N. Krasnov. "Electrochemistry of Molten and Solid Electrolyte". in transaction of the Institute of Electrochemistry. No. 1 p.22 Consultants Bureau New York. (1961).
185. S. Nakahara., S. Mahajan.
J. Electrochem. Soc. 127, 283 (1980).
186. H. Lux. Z. Electrochem. /£, 303 (1939), 52, 220 (1918).
187. H. Flood., T. Forland. Acta. Chem. Scand. 1, 592. (1917).
188. E.C. Franklin in "Nitrogen Systems of Compounds". Rheinhold ed. New York 1935.
189. V. Gutmann. Monatsh. 83, 161 (1952).
190. J.J. Duruz., G. Stehle., L. Landolt. Electrochem. Acta. 26, 771 (1981).
191. P.R. Juckniess., D.R. Johnson. Dow. Chem. Co. US. pa-f-,
No. 1118 5291 (1978) G. Cohel., J. Fisher., L. Snyder. "Electrowinning of Titanium from TiCl,".
4 Dow Chemical Co. 1th International Conference on Titanium/ Kyoto Japan 1980.
192. W.J. Ham er-, M.J. Malmberg. , B,. Rubin. J. of Electrochem. Soc. 1A2, 750 (1965).
193- L.E. Orgel. "An Introduction to Transition Metal Chemistry: Ligand Field Theory"., 2nd ed. Methuen. London. 1966.
191. R.G. Burns. "Mineralogical Applications of Crystal Field Theory". Cambridge University Press. London 1970.
283
195- E. Chassaing., F. Basile., G. Lorthioir. , J. of Appl.
Electrochem. 11, 187 (1981).
196. N.N. Greenwood in "Ionic Crystals, Lattice Deflects and Nonstoichiometry" p. 54 to 59. London. Butterworth 1968
28 4
APPENDIX 1
Distortion of Voltammograms by Ohmic Drop.
A paper published by Nicholson (123) on the effects of the ohmic drop on "the general shape of the voltammograms sheds another light on this particular problem.
According to the theory of linear sweep voltammetry the potential of a working electrode follows a linear function of time.
E(t) = E^ - vt (I) (sign-for a cathodic sweeep)
Where Ei is the initial potential and v the sweep rate. In all the following calculations the capacity current will be negelected. De Vries (124) showed that, when the calculations involving the capacity current were feasible, they were of very little use and the effect of the capacity current in terms of distortion effect was negligible compared to that of the ohmic drop.
But nonetheless, one must keep in mind that this capacity current plays a certain 'part in the overall distortion especially if one remembers that the capacity of the double layer is not constant during a sweep.
The potential time function becomes then:
E(t) = E. - vt + Q i (2) or E (t) = E± - vt + nFA q(t)fi
where A is the electrode area, q(t) the flux of oxidised and
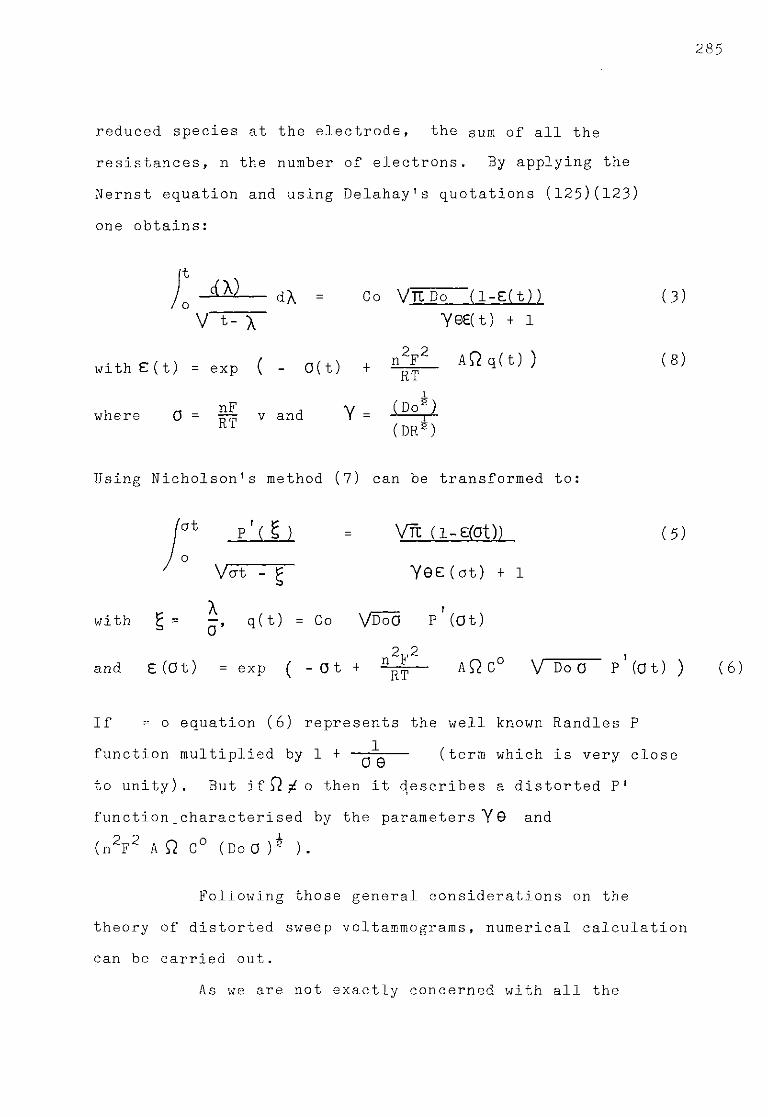
285
reduced species at the electrode, the Sum of all the resistances, n the number of electrons. By applying the Nernst equation and using Delahay's quotations (125)(123) one obtains:
o dX = Co V t c d o ( i - e ( t ) ) ( 3 )
V t - x Y © e ( t ) + 1
with £(t) = exp ( - o(t) + A Q q ( t ) ) ( 8 )
1 w h e r e 0 = IrlS v a n d Y = ^ )
R r (DR2)
Using Nicholson's method (7) can be transformed to:
'ot p'( t ) = Vrt (l-gfot)) (5) o
Vert - g Y 9 £ ( o t ) + 1
with g = q (t) = Co VBoO p'(Ot) 2 2
and £ (Ot) = exp ( - Ot + ^ — Aft C° V Do 0 p'(Ot) ) (6)
If = o equation (6) represents the well known Randies P function multiplied by 1 + (term which is very close u w to unity). But if ft -jL o then it describes a distorted P' function .characterised by the parameters Y 9 and (n2F2 A ft C° (DoO )2 ).
Following those general considerations on the theory of distorted sweep voltammograms, numerical calculation can be carried out.
As we are not exactly concerned with all the
286
mathematical part of this treatment we will only recall its fundamental conclusions.
A linear sweep voltammogram is practically 5 '
independent ofY© and distorted P function can be therefore characterised by the following value:
n2F A ft C° V DoO p' (MAX) = n (ip, Q ) (7)
P ' MAX r\ The ratio is a single valued function of n(ip.w) and P MAX
i thus the distorted P functions are determined by n time expected maximal ohraic drop i.e. n time the product of resistance and peak current which would appear in the absence of ohmic drop. Actually, calculations of P' function are rather tedious and have been performed by computerised methods in very few cases.
For a reduction process the predicted effects are therefore a cathodic shift of the peak potential, a decrease of the current height and an increase of the width of the wave For an anodic process, the adaption of the results obtained for the cathodic case is rather straight forward by changing the sign of the shift. Therefore, for a cycle sweep voltammogram the effect of the uncompensated ohmic resistance in terms of displacement along the potential axis will be
Q 9. I marked by a much larger difference E - E than the P P |
absence of an ohmic drop.

287
A p p e n d i x 2 .
Thermobalance test.
I Sodium fluoride: m 1=2.965 g.
m l t = 1 1 . 7 mg.
II Sodium fluoride - potassium fluorotitanate: m =3.0345 g.
m l t = 1 2 . 1 mg.
Heating rate 8C.mn \
Thermocouple Pt/Pt.13% Rh.
NaF: 2.602.
K T i F „ : 0.40145 2 6

2 88
T (C)
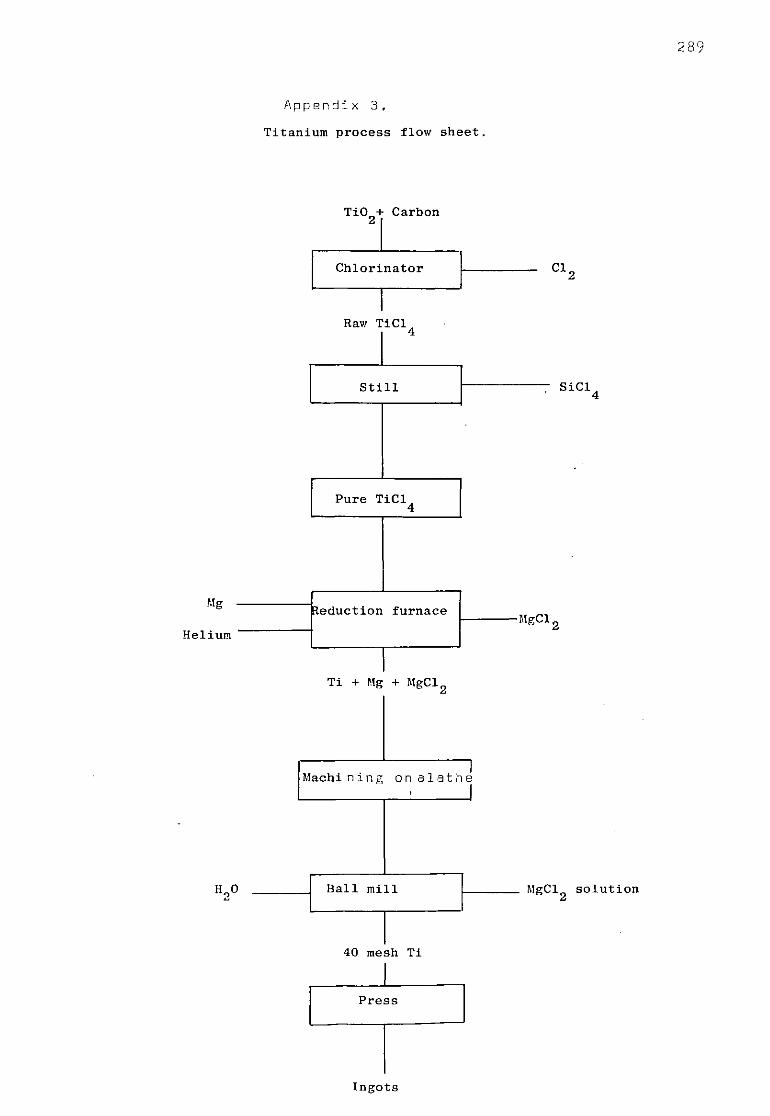
A p p e n d i x 3 .
Titanium process flow sheet.
Ti + Mg + MgCl,
Machi nine; o n a l a t h e
Ball mill
40 mesh Ti
M g C l 2 solution
Press
Ingots

A p p e n d i x 4 .
Phase diagrams of the svstems associated to NaF, AlF^, Al^O^, TiO^. and cryol
showing the solubility limits of these different compounds at I300K.

1xuu
1080 - /
1060 Liquid / Liquid"
1040 + / + ~ 1020 N a A 1 0 o j A 12°3 "
1000 _ / + Liquid + NaA10„ NaF + - 2
naa102 960
Liquid + NaF i i i
+ Al 0 1 2 I 3
2 4 6 8 12
NaF (w%) AlTo
System N a F - A l 2 0 3
(from 180)
1000
900
800
700
NaF 10 20 30 ' 40 A 1 F 3 (Mole%).
System NaF-AlF
( f r o m r . I 8 1 )
vo m

1000
950
Liquid
o ./+Corundun
Cryolite + Corundum 1 i •
10 15
na3alf6 A1 O -(w%)
System Na A1F - A l o 0
(From 182)
System N a 3 A l F 6 " T i 0 2
(Froml83)
?o so k)
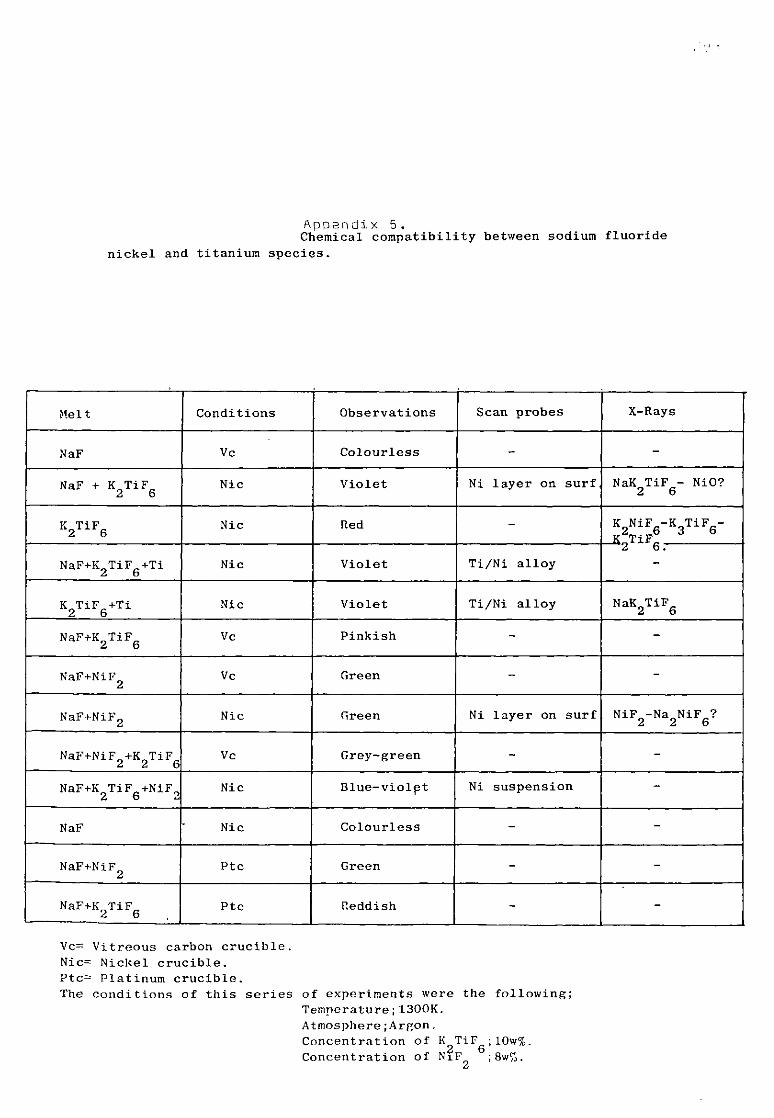
A p p e n d i x 5 . Chemical compatibility between sodium fluoride
nickel and titanium species.
Melt Conditions Observations Scan probes X-Rays
NaF Vc Colourless - -
NaF + K TiF 2 6
Nic Violet Ni layer on surf, NaK TiF - NiO? 2 6
K r tTiF„ 2 6
Nic Red - K 2 N i F 6 - K 3 T i F 6 " JCTiF_
NaF+K TiF +Ti 2 b
Nic Violet Ti/Ni alloy 2 b.
K TiF +Ti 2 6
Nic Violet Ti/Ni alloy N a K 2 T i F 6
NaF+K TiF 2 b
Vc Pinkish - -
NaF+NiF„ 2
Vc Green - -
NaF+NiFg Nic Green Ni layer on surf NiF -Na NiF ? 2 2 6
NaF+NiF +K TiF 2 2 6
Vc Grey-green - -
N a F + K 2 T i F 6 + N i F 0 Nic Blue-violpt Ni suspension -
NaF Nic Colourless - -
NaF+NiF 2
Ptc Green - -
NaF+K T i F . 2 b
Ptc Reddish - -
Vc= Vitreous carbon crucible. Nic= Nickel crucible. Ptc= Platinum crucible.
The conditions of this series of experiments were the following; Temperature;1300K. Atmosphere;Argon. Concentration of K^TiFgjlOwX. Concentration of NiF ;8w%.


![Bank Token Display Systemm Usin Micro Controller]](https://static.fdocuments.us/doc/165x107/547ac894b37959492b8b4b52/bank-token-display-systemm-usin-micro-controller.jpg)