
Electricity peak demand in Uganda: insights and foresight · Recent developments, including the...
16
ORIGINAL ARTICLE Open Access Electricity peak demand in Uganda: insights and foresight Geofrey Okoboi 1 and Joseph Mawejje 2* Abstract Background: Availability of reliable energy supply plays a critical role in the social, economic, and cultural transformation of society. The Uganda electricity sector has suffered long standing supply side constraints that resulted in suppressed demand and outages. Recent developments, including the completion of the 250 MW Bujagali project in 2012, have resulted in sustained growth in peak demand. However, this growth in peak demand appeared to stagnate by 2013. This study examines the recent trends as well as forecast the medium term path of electricity peak demand in Uganda. Methods: This study uses descriptive data exploration analysis and polynomial functions augmented by empirical estimations of structural break equations to account for the observed trends in electricity peak demand. The study applies the double exponential forecasting model to forecast total peak electricity demand. Results: The results show that the recent surge in electricity peak demand is due to increased electricity exports. Moreover, the results show a shift in electricity demand from peak to nonpeak time-of-use, possibly due to changing consumption patterns in the industrial sectors. Conclusions: The study draws two major conclusions. First, the growth in Uganda’s electricity demand in general and peak demand in particular has not stagnated as such but rather partially shifted from peak to nonpeak time-of- use zone. Second, electricity exports have contributed to growth of electricity peak demand. Importantly, higher electricity exports need to be considered in line with the system capacity given the current electricity spinning reserves of Uganda are less than 15 % of Uganda current installed capacity. Background Availability of reliable energy supply is critically import- ant for economic growth, poverty reduction, and the social and cultural transformation of society [1–3]. Defi- cient electricity infrastructure curtails social and eco- nomic development [4]. Proper energy planning ensures the sustainable development of energy systems that meet the growing energy demands. Electricity peak load mod- eling and forecasting is an important aspect of energy sector planning and management [5]. Electricity peak demand refers to the highest amount of electricity that an electrical system must supply to all its customers at any given time, in any one period such as a month [6, 7]. Peak demand occurs when the demand for elec- tricity sharply increases (spikes) in magnitude compared to a normal trend. The spike in demand can be short-lived or last for a longer period. Demand for electricity generally follows a cycle throughout the day. 1 The cycle is such that total demand is at peak between 19 and 23 h, declines from 24 h reaching the lowest level at 05 h. This load profile re- flects strong industrial demand for electricity which ac- counts for 62 % of electricity consumption in Uganda. The share of electricity demand by the different categor- ies of consumers, including industrial, commercial, and domestic consumers, and export is shown in Fig. 1. This demand at any given point in time of the day closely mirrors the consumption patterns in the various sector categories. For example, an industrial facility that switches on more machines at the start of a production shift, such as in the morning at 8 am, or even an office complex switching on the central air conditioning sys- tem in the early morning. In such circumstances, * Correspondence: [email protected] 2 Economic Policy Research Centre, Makerere University Campus, 51 Pool Road, P.O. Box 7841, Kampala, Uganda Full list of author information is available at the end of the article Energy, Sustainability and Society © 2016 The Author(s). Open Access This article is distributed under the terms of the Creative Commons Attribution 4.0 International License (http://creativecommons.org/licenses/by/4.0/), which permits unrestricted use, distribution, and reproduction in any medium, provided you give appropriate credit to the original author(s) and the source, provide a link to the Creative Commons license, and indicate if changes were made. Okoboi and Mawejje Energy, Sustainability and Society (2016) 6:29 DOI 10.1186/s13705-016-0094-8
Transcript of Electricity peak demand in Uganda: insights and foresight · Recent developments, including the...

ORIGINAL ARTICLE Open Access
Electricity peak demand in Uganda: insightsand foresightGeofrey Okoboi1 and Joseph Mawejje2*
Abstract
Background: Availability of reliable energy supply plays a critical role in the social, economic, and culturaltransformation of society. The Uganda electricity sector has suffered long standing supply side constraints thatresulted in suppressed demand and outages. Recent developments, including the completion of the 250 MWBujagali project in 2012, have resulted in sustained growth in peak demand. However, this growth in peak demandappeared to stagnate by 2013. This study examines the recent trends as well as forecast the medium term path ofelectricity peak demand in Uganda.
Methods: This study uses descriptive data exploration analysis and polynomial functions augmented by empiricalestimations of structural break equations to account for the observed trends in electricity peak demand. The studyapplies the double exponential forecasting model to forecast total peak electricity demand.
Results: The results show that the recent surge in electricity peak demand is due to increased electricity exports.Moreover, the results show a shift in electricity demand from peak to nonpeak time-of-use, possibly due tochanging consumption patterns in the industrial sectors.
Conclusions: The study draws two major conclusions. First, the growth in Uganda’s electricity demand in generaland peak demand in particular has not stagnated as such but rather partially shifted from peak to nonpeak time-of-use zone. Second, electricity exports have contributed to growth of electricity peak demand. Importantly, higherelectricity exports need to be considered in line with the system capacity given the current electricity spinningreserves of Uganda are less than 15 % of Uganda current installed capacity.
BackgroundAvailability of reliable energy supply is critically import-ant for economic growth, poverty reduction, and thesocial and cultural transformation of society [1–3]. Defi-cient electricity infrastructure curtails social and eco-nomic development [4]. Proper energy planning ensuresthe sustainable development of energy systems that meetthe growing energy demands. Electricity peak load mod-eling and forecasting is an important aspect of energysector planning and management [5]. Electricity peakdemand refers to the highest amount of electricity thatan electrical system must supply to all its customersat any given time, in any one period such as a month[6, 7]. Peak demand occurs when the demand for elec-tricity sharply increases (spikes) in magnitude
compared to a normal trend. The spike in demandcan be short-lived or last for a longer period.Demand for electricity generally follows a cycle
throughout the day.1 The cycle is such that total demandis at peak between 19 and 23 h, declines from 24 hreaching the lowest level at 05 h. This load profile re-flects strong industrial demand for electricity which ac-counts for 62 % of electricity consumption in Uganda.The share of electricity demand by the different categor-ies of consumers, including industrial, commercial, anddomestic consumers, and export is shown in Fig. 1. Thisdemand at any given point in time of the day closelymirrors the consumption patterns in the various sectorcategories. For example, an industrial facility thatswitches on more machines at the start of a productionshift, such as in the morning at 8 am, or even an officecomplex switching on the central air conditioning sys-tem in the early morning. In such circumstances,
* Correspondence: [email protected] Policy Research Centre, Makerere University Campus, 51 PoolRoad, P.O. Box 7841, Kampala, UgandaFull list of author information is available at the end of the article
Energy, Sustainabilityand Society
© 2016 The Author(s). Open Access This article is distributed under the terms of the Creative Commons Attribution 4.0International License (http://creativecommons.org/licenses/by/4.0/), which permits unrestricted use, distribution, andreproduction in any medium, provided you give appropriate credit to the original author(s) and the source, provide a link tothe Creative Commons license, and indicate if changes were made.
Okoboi and Mawejje Energy, Sustainability and Society (2016) 6:29 DOI 10.1186/s13705-016-0094-8

electricity demand may spike culminating into tempor-ary or sustained peak demand.Unmet electricity peak demand that outstrips infra-
structure generation, transmission, and distribution cap-acities stresses networks and may result in short-termdrop in voltage leading to outages [8]. Unmitigated elec-tricity outages have significant undesirable social andprivate impacts [9–14].The Uganda electricity sector has suffered long stand-
ing supply side constraints that resulted in suppresseddemand and outages [15]. Recent developments, includ-ing the completion of the 250 MW Bujagali project in
2012, have resulted in sustained growth in peak electri-city demand, culminating into spikes in total peak de-mand in June 2012 (518 MW) and December 2012(544 MW) as shown in Fig. 2.However, growth in peak demand appeared to stagnate
by 2013, averaging 493 MW. This apparent stagnation inpeak demand concerned stakeholders, including govern-ment, especially given the ongoing efforts to increaseelectricity generation that have primarily focused onexploiting hydropower by expediting the construction ofthe 183 MW Isimba and 600 MW Karuma Hydro PowerProjects whose expected completion dates are 2017 and2019, respectively.Despite these concerns, studies on electricity peak de-
mand have attracted little attention. Okoboi andMawejje [16] have attempted to account for this stag-nated peak electricity demand by examining the impactof adoption of power factor correction technology.Other studies have evaluated the possible role of renew-able energy—such as solar—as a substitute for grid sup-plied electricity [17, 18]. Despite these efforts, however,more analysis is required to fully understand the dynam-ics of electricity peak demand in Uganda. This is evenmore important considering that the country has priori-tized electricity generation as critical for greater eco-nomic performance and social transformation [19].Against this background, this paper examines the recent
trends in electricity peak demand in Uganda as well asforecast the medium term path of peak demand. We de-compose the trend in electricity peak demand, in particu-lar at transmission level, to try to establish the underlyingdrivers of the trend. Specifically, this paper considers thefollowing objectives: (1) examine the trend of peak de-mand; (2) assess the significance of electricity exports intotal peak demand; (3) examine the likely shift in domesticelectricity consumption from peak to other (shoulder and
Street lighting0%
Domestic consumers
22%
Commercial 12%
Medium industry
18%
Large industry
44%
Exports4%
Fig. 1 Distribution of electricity demand in 2015
*DD = Demand
400
440
480
520
560
Jan-
11
Mar
-11
May
-11
Jul-
11
Sep-
11
Nov
-11
Jan-
12
Mar
-12
May
-12
Jul-
12
Sep-
12
Nov
-12
Jan-
13
Mar
-13
May
-13
Jul-
13
Sep-
13
Nov
-13
Jan-
14
Mar
-14
May
-14
Jul-
14
)W
M(dna
medkae
P
Total Peak DD Domestic Peak DD
Fig. 2 Trend of Uganda’s electricity peak demand, 2011–2014
Okoboi and Mawejje Energy, Sustainability and Society (2016) 6:29 Page 2 of 16

off-peak) time-of-use (TOU) zones; (4) examine the rela-tionship between industrial production and domestic elec-tricity peak demand; and (5) forecast the medium termpath of electricity peak demand in Uganda.Using descriptive data exploration analysis and polyno-
mial functions augmented by empirical estimations ofstructural break equations, we show that the recent surgein electricity peak demand is due to increased electricity ex-ports. Moreover, we show a shift in electricity demand frompeak to nonpeak time-of-use, possibly due to changing con-sumption patterns particularly in the industrial sector.The remainder of this paper is organized as follows:
The “Context” section provides the context with regardto the Uganda electricity sector. The “Methods” sectionintroduces the methods used in the analysis. Results arepresented and discussed in the “Results and discussion”section. The “Conclusions” section provides the conclu-sions and recommendations.
ContextUganda is one of few African countries that fullyunbundled the electricity sector, devolved the role ofgovernment in the sector, and allowed private sectorparticipation. The reforms in Uganda’s electricity sectorwere motivated by a quest to improve overall sector effi-ciency [20, 15]. The general idea behind the reforms inthe electricity sectors across many countries, includingin sub-Saharan Africa, was that private sector participa-tion would enable increased supply of reasonably pricedand reliable electricity [21]. Recent detailed discussionsof the electricity sector reforms in Uganda can be foundin [15] and [22]. The timeline of Uganda’s electricity sec-tor reforms is shown in Table 1.
In general, the performance of Uganda’s electricity sec-tor has improved greatly, albeit slowly, since the reformperiod. With a generation capacity of 867 MW andavailable capacity of some 600 MW against peak de-mand for electricity estimated at 550 MW, Uganda nowhas surplus electricity. Consequently, periods of loadshedding have greatly reduced, and new connections andaccess have accelerated. The completion of the 250 MWBujagali plant, the 9.5 MW plant at Buseruka, and the3.5 MW plant at Nyagak coupled with the completion ofa number of mini-hydroplants has provided great re-prieve to the Uganda electricity industry and for the firsttime in over three decades Uganda has enough electri-city to satisfy peak demand. This has led to the decom-missioning of two of the emergency thermal plants. Inaddition, the 9.5 MW bagasse co-generation project atLugazi Sugar Cooperation of Uganda Limited (SCOUL)was completed raising total installed capacity from about540 MW in 2005 to 870 MW by 2015 (Table 2).To date, the generation capacity eclipses the pre-
reform installed capacity—a milestone that only a fewAfrican countries have managed [15].In a bid to save the scarce available resources and in-
stead focus attention on securing future electricity sup-ply, the Government scrapped subsidies to the electricity
Table 1 Timeline of Uganda’s electricity sector reforms
Dates Reforms
June 1999 Government approves the power sector restructuringand privatization strategy
November 1999 The new electricity Act is passed
April 2000 The Electricity Regulatory Authority becomesoperational
March 2001 The Uganda Electricity Board is unbundled and threecompanies created and registered namely: UEGCL,UETCL, and UEDCL
May 2001 Concessions for generation and distribution areadvertised
November 2002 Concession for generation awarded toEskom Enterprises
February 2003 Appointment of the Rural Electrification Board tooversee the Rural Electrification Trust Fund (RETF)
2005 UMEME awarded concessionaire to operate for20 years to purchase electricity in bulk from UETCLand distribute it along low voltage electricity linesto individual customers
Source: Karekezi et al ([21])
Table 2 Installed electricity capacity in MW 2010–2015
Plant name 2010 2011 2012 2013 2014 2015
Hydroelectricity
Nalubale 180 180 180 180 180 180
Kiira 200 200 200 200 200 200
Kasese Cobalt Company Ltd 9.9 9.9 9.9 9.9 9.9 9.9
Kilembe Mines 5 5 5 5 5 5
Bugoye Tronder 13 13 13 13 13 13
Mpanga 18 18 18 18 18 18
Ishasha 6.5 6.5 6.5 6.5 6.6 6.6
Buseruka – – 9 9 9 9
Bujagali – – 250 250 250 250
Kisizi 0.3 0.3 0.3 0.3 0.3 0.3
Nyagak – – 3.5 3.5 3.5 3.5
Thermal generation
Jacobsen Namanve 50 50 50 50 50 50
Electromaxx Tororo 20 20 20 20 50 50
Aggreko Kiira 50 50 – – – –
Aggreko Mutundwe 50 50 – – – –
Bagasse co-generation
Kakira sugar works 12 12 12 12 12 12
Kinyara sugar works 4.5 4.5 4.5 4.5 4.5 4.5
Lugazi SCOUL – – 9.5 9.5 9.5 9.5
Source: Electricity Regulatory Authority and Uganda Bureau of Statistics
Okoboi and Mawejje Energy, Sustainability and Society (2016) 6:29 Page 3 of 16

consumers in 2012. Subsequently, generation projectssuch as Karuma (600 MW), Ayago (600 MW), andIsimba (183 MW) have been earmarked for immediateconstruction.Other potential projects expected to start in the
medium term include Oriang 380 MW and thermalgeneration (100 MW) from the oil refinery. However,despite all these positive developments, Uganda’s electri-city sector is still small. Installed capacity, at 867 MW, isonly approximately half of Kenya’s 1600 MW andTanzania 1509.85 MW. Peak demand at 550 MW is onlya third of Kenya’s 1500 MW and a half of Tanzania’s1000 MW (Fig. 3).
Developments in distributionThe reforms in Uganda’s electricity sector necessitatedthe pursuit of a private sector-led industry. The Ugandaelectricity distribution network, formerly managed underthe Uganda Electricity Board (UEB)—a governmentparastatal—was concessioned to Umeme Limited in2005 under a 20-year lease contract. In a bid to speedup rural electrification, a few small distribution compan-ies and cooperatives were granted licenses to distributeelectricity in some of the most remote areas of Uganda.Consequently, the distribution network has been ex-panded with investments made by both the private sec-tor and the Rural Electrification Agency (REA). The listof companies currently distributing electricity in Ugandais provided in Table 3.
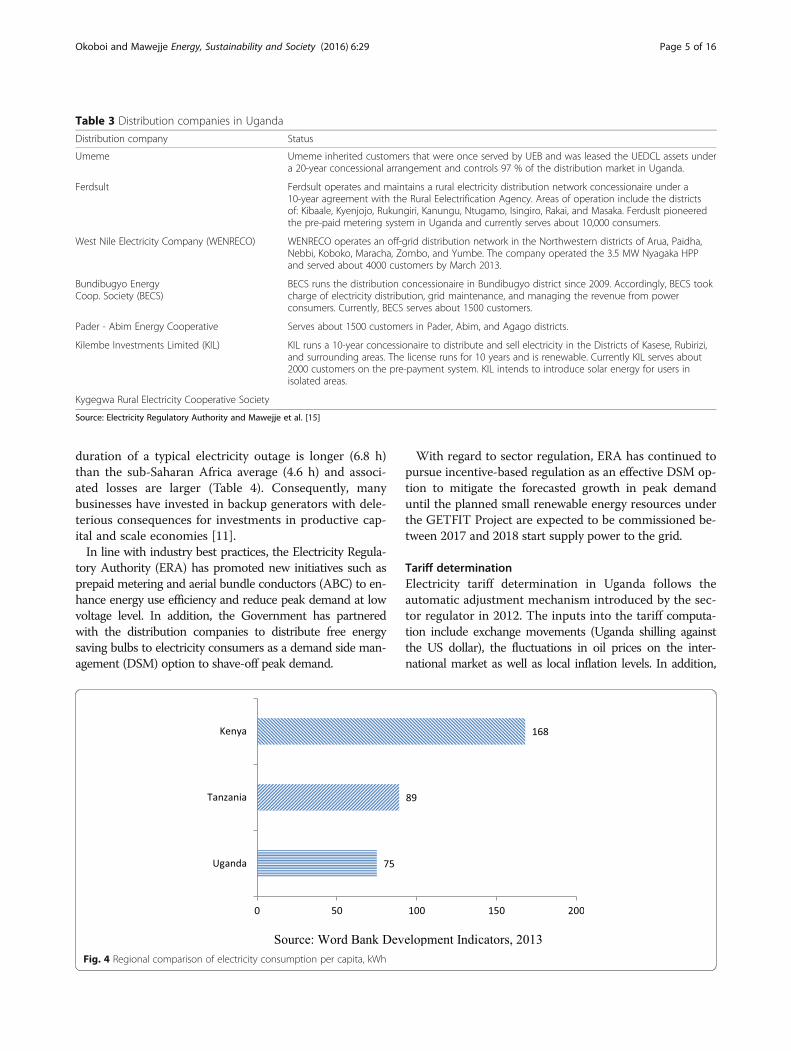
Electricity access and consumptionDespite the developments in the electricity industry,Uganda has recorded slow progress in ensuring that ma-jority of rural Ugandan households have access to elec-tricity. Per capita electricity consumption is estimated at
75 kWh and is one of lowest in the world with unequalaccess rates for rural and urban households [23]. Figure 4shows the regional comparison of electricity consump-tion per capita.At the national level, 14 % of all households have ac-
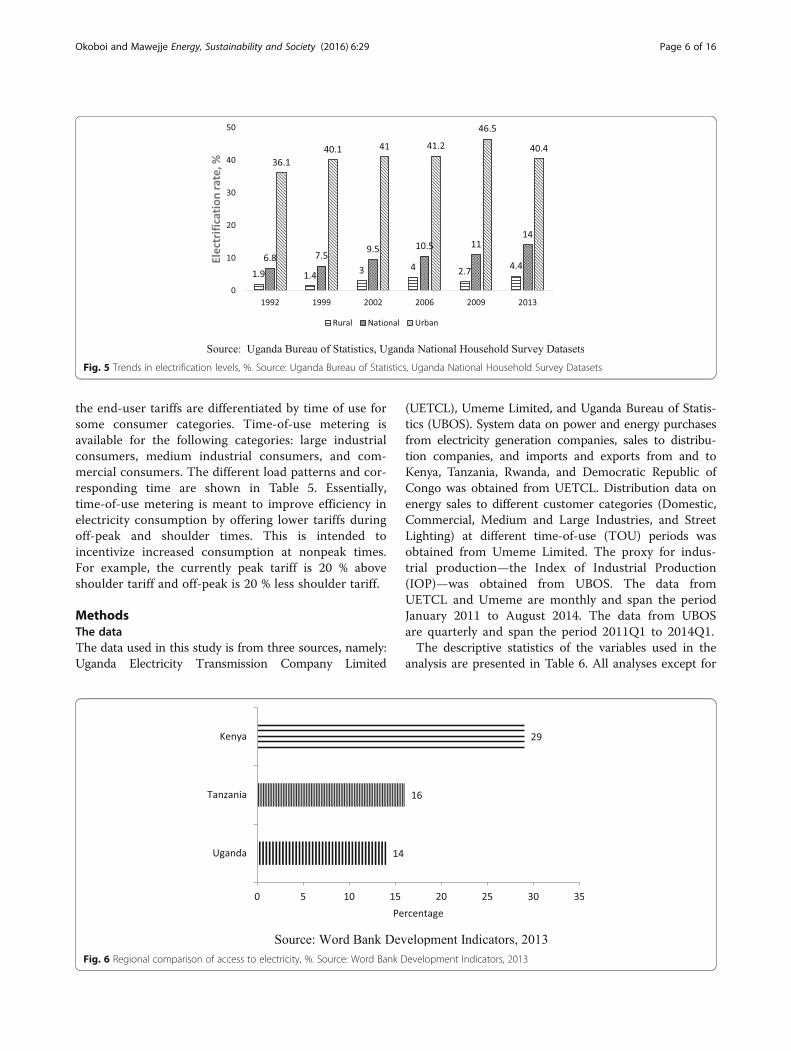
cess to electricity. This represents a remarkable im-provement from 7.5 % in 1999 when the reforms started.However, while the urban electrification rate is 40 %, therural electrification rate is much lower: in 2014, a whop-ping 95.6 % of all rural households did not have accessto electricity on the national grid (Fig. 5).In addition, consumption per connection is not only
low but declining with new connections and the com-mercial and financial performance of rural electricitydistribution companies is, therefore, not sustainable(Fig. 6).In addition to social and cultural barriers, the major
constraints to rural electrification are problems with ruralisolation, power theft, insufficient supply, and the highcosts that have inhibited rural communities from gainingaccess to electricity. Consequently, Uganda still comparesunfavorably with its region neighbors with regard tohousehold access to electricity. Indeed, Uganda’s electrifi-cation rate of 14 % is lower than that of Kenya whichstands at 29 % and Tanzania which is 16 % (Fig. 6).
Reliability of electricity supplyThe provision of reliable and affordable electricity is veryimportant for economic growth and business competi-tiveness. As discussed earlier, Uganda has made someprogress towards ensuring the adequate availability ofelectricity. However, many businesses continue to reportthe reliability of electricity supply as the top obstacle fordoing business in Uganda [24]. Data from the WorldBank (2013) enterprise surveys shows that the average
Fig. 3 Regional comparison of peak demand, MW
Okoboi and Mawejje Energy, Sustainability and Society (2016) 6:29 Page 4 of 16
duration of a typical electricity outage is longer (6.8 h)than the sub-Saharan Africa average (4.6 h) and associ-ated losses are larger (Table 4). Consequently, manybusinesses have invested in backup generators with dele-terious consequences for investments in productive cap-ital and scale economies [11].In line with industry best practices, the Electricity Regula-
tory Authority (ERA) has promoted new initiatives such asprepaid metering and aerial bundle conductors (ABC) to en-hance energy use efficiency and reduce peak demand at lowvoltage level. In addition, the Government has partneredwith the distribution companies to distribute free energysaving bulbs to electricity consumers as a demand side man-agement (DSM) option to shave-off peak demand.
With regard to sector regulation, ERA has continued topursue incentive-based regulation as an effective DSM op-tion to mitigate the forecasted growth in peak demanduntil the planned small renewable energy resources underthe GETFIT Project are expected to be commissioned be-tween 2017 and 2018 start supply power to the grid.
Tariff determinationElectricity tariff determination in Uganda follows theautomatic adjustment mechanism introduced by the sec-tor regulator in 2012. The inputs into the tariff computa-tion include exchange movements (Uganda shilling againstthe US dollar), the fluctuations in oil prices on the inter-national market as well as local inflation levels. In addition,
Table 3 Distribution companies in Uganda
Distribution company Status
Umeme Umeme inherited customers that were once served by UEB and was leased the UEDCL assets undera 20-year concessional arrangement and controls 97 % of the distribution market in Uganda.
Ferdsult Ferdsult operates and maintains a rural electricity distribution network concessionaire under a10-year agreement with the Rural Eelectrification Agency. Areas of operation include the districtsof: Kibaale, Kyenjojo, Rukungiri, Kanungu, Ntugamo, Isingiro, Rakai, and Masaka. Ferduslt pioneeredthe pre-paid metering system in Uganda and currently serves about 10,000 consumers.
West Nile Electricity Company (WENRECO) WENRECO operates an off-grid distribution network in the Northwestern districts of Arua, Paidha,Nebbi, Koboko, Maracha, Zombo, and Yumbe. The company operated the 3.5 MW Nyagaka HPPand served about 4000 customers by March 2013.
Bundibugyo EnergyCoop. Society (BECS)
BECS runs the distribution concessionaire in Bundibugyo district since 2009. Accordingly, BECS tookcharge of electricity distribution, grid maintenance, and managing the revenue from powerconsumers. Currently, BECS serves about 1500 customers.
Pader - Abim Energy Cooperative Serves about 1500 customers in Pader, Abim, and Agago districts.
Kilembe Investments Limited (KIL) KIL runs a 10-year concessionaire to distribute and sell electricity in the Districts of Kasese, Rubirizi,and surrounding areas. The license runs for 10 years and is renewable. Currently KIL serves about2000 customers on the pre-payment system. KIL intends to introduce solar energy for users inisolated areas.
Kygegwa Rural Electricity Cooperative Society
Source: Electricity Regulatory Authority and Mawejje et al. [15]
Fig. 4 Regional comparison of electricity consumption per capita, kWh
Okoboi and Mawejje Energy, Sustainability and Society (2016) 6:29 Page 5 of 16
the end-user tariffs are differentiated by time of use forsome consumer categories. Time-of-use metering isavailable for the following categories: large industrialconsumers, medium industrial consumers, and com-mercial consumers. The different load patterns and cor-responding time are shown in Table 5. Essentially,time-of-use metering is meant to improve efficiency inelectricity consumption by offering lower tariffs duringoff-peak and shoulder times. This is intended toincentivize increased consumption at nonpeak times.For example, the currently peak tariff is 20 % aboveshoulder tariff and off-peak is 20 % less shoulder tariff.
MethodsThe dataThe data used in this study is from three sources, namely:Uganda Electricity Transmission Company Limited
(UETCL), Umeme Limited, and Uganda Bureau of Statis-tics (UBOS). System data on power and energy purchasesfrom electricity generation companies, sales to distribu-tion companies, and imports and exports from and toKenya, Tanzania, Rwanda, and Democratic Republic ofCongo was obtained from UETCL. Distribution data onenergy sales to different customer categories (Domestic,Commercial, Medium and Large Industries, and StreetLighting) at different time-of-use (TOU) periods wasobtained from Umeme Limited. The proxy for indus-trial production—the Index of Industrial Production(IOP)—was obtained from UBOS. The data fromUETCL and Umeme are monthly and span the periodJanuary 2011 to August 2014. The data from UBOSare quarterly and span the period 2011Q1 to 2014Q1.The descriptive statistics of the variables used in the
analysis are presented in Table 6. All analyses except for
Fig. 5 Trends in electrification levels, %. Source: Uganda Bureau of Statistics, Uganda National Household Survey Datasets
Fig. 6 Regional comparison of access to electricity, %. Source: Word Bank Development Indicators, 2013
Okoboi and Mawejje Energy, Sustainability and Society (2016) 6:29 Page 6 of 16

objective 4 are based on 45 monthly data points (January2011 to August 2014) observations. The analysis for ob-jective 4 is based on 13 quarterly (Q1 2011 to Q1 2014)data observations.The descriptive statistics indicate that between January
2011 and August 2014, the registered system electricitypeak demand has ranged between 428 and 550 MWwith average peak demand of 482 MW. The energylosses average 3.6 % of total purchases at transmissionsystem level while at distribution level (Umeme Lim-ited), energy losses average 26 % of purchases from thesystem operator.To improve the efficiency of the results from the ana-
lysis, the data were transformed into natural logarithmsand the econometric analysis involved robust and boot-strapped standard errors where applicable.
Estimation methodsThe study adopted a number of estimation methods forthe analysis as detailed below:
a) Trend and descriptive statistical analyses were usedto examine the trends of peak demand;
b) Bootstrapped linear regression models were used toassess the significance of electricity exports in totalpeak demand. Bootstrapped methods were adoptedbecause they basically replicate the observations tothe desired level and improve the efficiency of theestimates especially where the sample is relativelysmall [25].
With regard to bootstrapped linear regression model-ing, Eqs. (1) and (2) below were estimated.
tpi ¼ β0 þ β1exi þ β2umemei þ β3otheriþ β4lossi þ εi ð1Þ
tpi ¼ β0 þ β1exi þ β2upki þ β3uopi þ β4ushiþ β5otheri þ β6lossi þ εi ð2Þ
Wherebytp = total peak demand, measured in megawatt (MW);ex = total electricity exports demand, measured in
gigawatt hours (GWh);umeme = UETCL energy sales (GWh) to Umeme that
distributes up to 96 % of electricity generated in Uganda;other = UETCL energy (GWh) sales to other electricity
distribution companies in Uganda that include UgandaElectricity Distribution Company Limited (UEDCL),Ferdsult Engineering Services Limited (FESL), KilembeInvestment Limited (KIL), Bundibugyo Electricity Co-operative Society (BECS), Pader-Abim Community Multi-purpose Coperative Society (PACMECS), and KyegegwaRural Electricity Cooperative Society (KRECS);loss = energy losses (as a percentage total energy sales
by UETCL—the system operator) experienced at trans-mission level;upk = UETCL energy sales to Umeme at peak (18:00–
23:00 h) TOU zone;opk = UETCL energy sales to Umeme at off-peak
(23:00–05:00 h) TOU zone;ush = UETCL energy sales to Umeme at shoulder
(05:00–18:00 h) TOU zone;ε = error term representing any other factors not in-
cluded in the equation but may have an impact of peakdemand; andβ = parameters to be estimated while i = 1, 2,…, n is
the number of observations from first to the last (n).UETCL energy sales to Umeme are disaggregated into
peak, off-peak, and shoulder TOU zone sales in Eq. (2).The disaggregated data was included to examine the dif-ferentiated effects of individual TOU sales—particularlypeak sales—on total peak demand.
Table 4 Extent of electricity challenges in Uganda
Indicator Uganda Sub-Saharan Africa All countries
Number of electrical outages in a typical month 6.3 8.3 6.3
Duration of a typical electrical outage (hours) 6.8 4.6 2.6
Losses due to electrical outages (% of annual sales) 6.3 4.4 2.6
Average losses due to electrical outages (% of annual sales) 11.2 7.3 4.7
Percentage of firms owning or sharing a generator 52.2 48.0 34
Proportion of electricity from generator, % 8.4 14.2 8.1
Days to obtain an electrical connection (upon application) 18.1 29.0 30.9
Percentage of firms identifying electricity as a major obstacle 26.8 43.6 34.0
Source: World Bank Enterprise Survey Data
Table 5 Time-of-use patterns
Load pattern Time (h)
Peak 18.00–24.00
Shoulder 06.00–18.00
Off-peak 24.00–06.00
Okoboi and Mawejje Energy, Sustainability and Society (2016) 6:29 Page 7 of 16

c) Fractional polynomial functions were estimated todetermine the likely shift in domestic electricityconsumption from peak to other (shoulder and off-peak) time-of-use (TOU) zones. The advantage withfractional polynomial functions is that they use thefull information and search for the optimal func-tional form within a flexible class of functions [26].
To confirm the robustness of the graphical resultsfrom the first method, structural break models stated inEq. (3) were estimated.
pki ¼ α0 þ α1npi þ α2di þ α3 npi � dið Þ þ εi ð3aÞ
pki ¼ γ0 þ γ1npiþzi ; for the period January 2011 to December 2012
ð3bÞ
pki ¼ δ0 þ δ1npiþwi ; for the period January 2013 to August 2014
ð3cÞ
Whereby
pk = system peak demand, measured in gigawatt hours(GWh);np = system nonpeak (shoulder and off-peak) demand
(GWh);d = the dummy variable; d = 1 if time period is January
2011 to December 2012, and d = 0 if time period is Janu-ary 2013 to December 2014.np*d = interaction term between the explanatory vari-
able (np) and the dummy variable (d);ε, z, and w = errors terms for the respective equation
specifications above; andα, γ and δ = parameters to be estimated while i = 1,
2,…, n is number of observation from first to the last (n).When the coefficients of dummy variable α2ð Þ and
interaction term (α3) in Eq. (3a) are statistically signifi-cant, it implies that the magnitude of the peak-nonpeakslope (change in peak demand arising from a unitchange nonpeak demand) for the period January 2011 toDecember 2012 and the January 2013 to August 2014period is different. The actual magnitudes of the slopesare reflected in the coefficients γ1 and δ1 of Eqs. (3b)and (3c), respectively. To verify that the slopes of Eqs.(3b) and (3c) are different and hence there may be a shift
Table 6 Descriptive statistics of the variables
Variable Unit of measure Obs Mean Std. dev. Min Max
Total peak demand MW 44 482.00 36.82 428.35 549.63
Domestic peak demand MW 44 462.45 26.30 417.37 497.20
Total energy purchases GWh 44 241.93 21.50 198.93 283.58
Total generation GWh 44 238.78 21.76 194.94 282.05
Total imports GWh 44 3.15 1.02 1.53 5.99
System peak demand GWh 44 65.18 6.81 45.99 73.55
Shoulder demand GWh 44 113.48 8.23 93.27 128.04
Off-peak demand GWh 44 47.14 3.61 36.52 53.44
System nonpeak demand GWh 44 160.62 11.64 129.79 181.48
Umeme purchases GWh 44 221.43 18.98 175.78 252.53
Other distributor purchases GWh 44 2.05 0.52 1.13 2.91
Total purchases by distributors GWh 44 223.48 19.39 177.31 254.97
Total exports GWh 44 9.78 3.99 6.38 24.92
UETCL total sales GWh 44 233.26 21.89 184.66 273.54
System energy loss % 44 3.62 1.15 0.16 7.17
Umeme offpeak sales GWh 40 25.61 2.50 20.33 30.80
Umeme shoulder sales GWh 40 64.89 6.09 50.28 76.63
Umeme peak sales GWh 40 28.59 3.08 22.86 33.44
Umeme domestic sales GWh 40 42.79 4.90 32.68 51.70
Umeme total sales GWh 40 161.88 15.94 126.16 188.50
Umeme energy losses % 40 26.47 5.28 15.51 39.98
Index of industrial production % 13 195.00 10.82 174.75 218.42
Average domestic system peak MW 13 460.95 25.98 419.08 490.67
Maximum domestic system peak MW 13 465.58 27.84 420.05 497.20
Okoboi and Mawejje Energy, Sustainability and Society (2016) 6:29 Page 8 of 16

in peak demand, the Hausman F test of equality of coef-ficient of two regression models [27] has been estimated.
d) GLM and fractional polynomials were used toestimate the relationship between industrialproduction and domestic electricity peak demand.With respect to the GLM, the estimated model isstated in Eq. 4.
dpki ¼ μ0 þ μ1iopi þ εi ð4Þ
Wherebydpk = domestic average or maximum peak demand,
measured in GWh;iop = index of industrial production, which measures
(as percentage) performance of the industrial sector incurrent quarter compared to previous quarter given thebase period.μ = parameters to be estimated while i = 1, 2,…, n is
number of observations from first to the last (n).ε = error term representing any other factors not in-
cluded in the equation but may have an impact of peakdemand; andunder the graphical fractional polynomials method, a
scatter and predicted trend of average and maximumdomestic peak demand against index of industrial pro-duction (IOP) are plotted using quarterly data trans-formed into natural logarithms.
e) The double exponential smoothing methods wereapplied to the predicted values of total peak demandderived from the estimated Eq. (1) to predict themedium term path of electricity peak demand.
Following the Holt-Winters formulation, in this paper,the double exponential forecasting model used to fore-cast total peak demand is stated as in Eqs. (5a)–(5c).
Ct ¼ αyt þ 1−αð Þ Ct−1 þ Tt−1ð Þ ð5aÞ
Tt ¼ β Ct−Ct−1ð Þ þ 1−βð ÞTt−1 ð5bÞ
Ftþ1 ¼ Ct þ Tt ð5cÞ
Wherebyyt = actual total peak in time t;α = constant-process smoothing constant;β = trend-smoothing constant;Ct = smoothed constant-process value for period t;Tt = smoothed trend of total peak demand for period t;Ft = forecast total peak demand for period t + 1;t = current time period; andt − 1 = previous time period.
Results and discussionTrends in electricity peak demandFollowing the relatively stable electricity peak de-mand in 2013, many stakeholders in Uganda’s ESI ex-pected the trend of peak demand to remain stable oreven decline in 2014. These expectations were basedon a 2014 review of end-user TOU tariff weightingfactors that were increased from 10 to 15 % duringpeak TOU zone and downwards from −10 to −15 %during off-peak TOU zone compared to shoulderTOU zone.Results from the 9-month trend of the peak demand
in 2014 show that peak demand has consistently in-creased in 2014 compared to 2013 as indicated in Fig. 1.In May 2014, peak demand reached 550 MW therebysurpassing the highest record of 544 MW attained inDecember 2012. A comparison of the total peak de-mand to domestic demand suggests that the recent up-surge of total peak demand may be associated withincreased exports of energy by UETCL given that2014 domestic peak demand remained fairly and com-parable to that of 2013.
Effect of electricity exports on total peak demandIn a bid to understand the drivers of peak demand,some stakeholders have pointed at the possibility ofUganda’s power exports to Kenya, Tanzania, Rwanda,and Democratic Republic Congo as being a key drivergiven that most of the exports are at peak TOU zone.That is, the time at which UETCL dispatches most ofenergy exports is largely in the evening, between 18to 23 h, which coincides with Uganda’s peak TOUzone (Fig. 7).As stated in the background, one of our objectives of
this study was to examine the magnitude and impact ofenergy exports on the peak demand. The results of thisanalysis are contained in Table 6.Table 6 presents the bootstrapped regression of
total peak demand against UETCL disaggregated en-ergy sales to domestic and export markets. In thefirst regression, domestic sales are disaggregated intosales to Umeme Limited, that is, the major distribu-tor with about 96 % share of the domestic markets;other distributors; and UETCL technical losses. Inthe second regression, energy sales to Umeme arefurther disaggregated by TOU—that is, peak, shoul-der, and off-peak sales.Starting with the robustness of the results, Wald chi2
results in Table 7 for both regressions 1 and regression 2are robust and the models explain up to 78 % (adjusted R2)of relationships between the total peak demand and the ex-planatory variables.Increase in energy exports, sales to Umeme and sales
to other distributors by UETCL, has a statistically
Okoboi and Mawejje Energy, Sustainability and Society (2016) 6:29 Page 9 of 16

significant (p < 0.01) impact on peak demand. Inaddition, an increase in total net exports by 10 GWhhas 0.8 % impact on peak demand whereas 10 GWh in-crease in energy sales to Umeme leads up to 3.5 % in-crease in peak demand and 10 GWh increase in energysales to other electricity distributors leads up to 0.9 %increase in peak demand.To understand the most likely underlying relationship
between peak demand and energy exports and sales toUmeme, two polynomial graphs of the estimated relation-ships are presented in Fig. 8. The polynomial in Fig. 8a
(peak demand–export sales) is convex upwards (or con-cave downwards) given the dotted line that connects thetwo ends of graph is below the graph while the polynomialin Fig. 8b (peak demand–Umeme sales) is convex down-wards (or concave upwards) given the dotted line thatconnects the two ends of graph is above the graph. Theimplication of convex upward graphs in Fig. 8a is thatmore export sales will be required for a unit increase inpeak demand compared to the concave upward graph(sales to Umeme) in Fig. 8b. This therefore validatesreliability of the results in Table 6.In the second regression in Table 6, the results indicate
that when UETCL energy sales to Umeme are disaggre-gated into peak, shoulder, and off-peak sales, there is a posi-tive relationship with peak demand but the relationshipsare not statistically significant. In the same regression, thecoefficients of UETCL energy exports and sales to otherdistributors have the same magnitude, impact, and statis-tical significance on peak demand as that in regression 1.
Relationships between electricity peak to nonpeak demandIn an effort to understand the likely causes of the relativelystable peak demand in 2013—which was expected to con-tinue in 2014, some stakeholders in the ESI pointed to thepossible shift in energy consumption from peak TOUzone to other (shoulder and off-peak) TOU zones. Whenthere is a shift in energy consumption from peak to non-peak TOU zones, this implies that on the one hand therewould be a decrease in the growth of energy sales at peakTOU and on the other hand an increase in growth of en-ergy sales at nonpeak TOU zone. This change in patternof peak vis-à-vis nonpeak demand can be observed eitherat transmission and/or distribution level.At the transmission level, a change in the pattern of
energy sales can be analyzed using the estimated
Table 7 Bootstrapped regression results
Dependent variable = total peak demand
Regression 1 Regression 2
Variables Coefficient z value Coefficient z value
Exports (log) 0.08*** 4.15 0.08*** 4.00
Sales to Umeme (log) 0.35*** 3.66
Peak Sales Umeme (log) 0.13 0.95
Off-Peak Sales Umeme (log) 0.28 1.14
Shoulder Sales Umeme (log) 0.03 0.15
Sales to other dist. (log) 0.09*** 3.26 0.08*** 2.99
TX energy loss (log) 0.02 1.01 0.02 1.33
Constant 4.03*** 8.03 4.13*** 7.54
Obs. 44 44
Replications 105 105
Wald chi2 249.13*** 330.72***
R-squared 0.82 0.86
Adj. R-squared 0.80 0.84
Root MSE 0.03 0.03
Notes: 1) z values based on bootstrapped standard errors; 2) significancelevels: *** = significant at the 1% level, ** = significant at the 5% level, *=significant at the 10% level
Fig. 7 Load profile of total demand and total net export demand on 1st July 2014. Data source: UETCL systems data
Okoboi and Mawejje Energy, Sustainability and Society (2016) 6:29 Page 10 of 16

fractional graphs for both peak and nonpeak demand(Fig. 9). An alternative method involves examining thechange in peak and nonpeak demand patterns by com-paring the coefficients from estimated equations relatingpeak to nonpeak demand before and after the year 2013.In order to make the robust comparisons, in Fig. 8,
actual peak demand data has been multiplied by ascale of 2. The depiction of the graphs in Fig. 8 sug-gests that in 2011, peak demand declined faster andlikewise increased faster in 2012 and for nonpeakdemand on the other hand in 2011, declined mildlyand as well increased mildly in 2012, leading tosome sort of catch-up by peak demand. In the case
of peak demand growth in 2013 and 2014, the graphindicates that it was generally linear, positive, andlow. On the other hand, growth in nonpeak demandis also linear, positive, and low in 2013 but some-what doubled in 2014.Arising from the foregoing explanation of the
graphical depiction of the relationship between peakand nonpeak demand before and after January 2013,one can conclude that in 2013 and 2014, there issome observed slight shift in energy demand frompeak to nonpeak TOU. To establish reliability of thisconclusion, we test if there is a statistically significantdifference in the slopes of the curves in Fig. 8 by
A B
Fig. 8 Polynomials of electricity total peak demand and exports and Umeme sales. a Polynomial graph of electricity total peak demand andexport sales. b Polynomial graph of electricity total peak demand and Umeme sales
Fig. 9 Fractional polynomials of electricity peak to nonpeak demand
Okoboi and Mawejje Energy, Sustainability and Society (2016) 6:29 Page 11 of 16

performing an ordinary least square (OLS) estimatethe relationship between peak and nonpeak demandincluding the dummy variable and an interaction termbetween dummy and explanatory variable to controlfor the situation before and after January 2013. Thisregression is presented in Table 8.Results in Table 8 indicate a strong relationship (ad-
justed R square = 87 %) between peak and nonpeak de-mand. The dummy and interaction terms are statisticallysignificant (p < 0.01), thereby suggesting that there is a sta-tistically significant difference in the magnitude of the co-efficients of the individual regression results that areshown in the lower panel of Table 8.The coefficient for the first regression is 1.3 while
that for the second regression is 0.51. This impliesthat in the period January 2011 to December 2012, aunit (1 GWh) increase in nonpeak demand wasmatched by 1.3 GWh increase in peak demand. Onthe other hand, in the period January 2013 to August2014, a unit (1 GWh) increase in nonpeak demandwas matched only 0.51 GWh increase in peak de-mand. This therefore suggests that there might be a
decline in peak demand in the later period—whichdemand has shifted to nonpeak TOU zones, given thefact total energy demand has consistently increased inthe reference period.To conclude that the coefficients 1.30 and 0.51
from the first (M1) and second (M2) regressions, re-spectively, are statistically different and hence a shiftin peak demand to nonpeak TOU zone in 2013 and2014, an F-test was performed, with the null hypoth-esis that coefficients of the dummy variable (D) andthe interaction term (NP*D) were jointly zero. That isD = 0 and (NP*D) = 0. The results of the test areshown in Table 4, and the statistic is statistically sig-nificant at less than 5 % level (Table 9).The slight shift in electricity consumption from
peak to nonpeak TOU zone may be due to theincentive-based regulatory regime offered by the Elec-tricity Regulatory Authority (ERA) to industrial con-sumers. The incentive regime involves lower tariffs atoff-peak TOU and high tariffs at peak TOU. Theother incentives and disincentives to industrial con-sumers of electricity involve Reactive Energy Rewardto industrial consumers with efficient energy usingequipment and Reactive Energy Charge to industrial-ists with inefficient power using equipment. The in-centives and disincentive above are besides themaximum demand charges2 that ERA has set forindustrialists.
Relationship between industrial production and domesticpeak demandIn Uganda, the industrial sector is the largest con-sumer of electricity, accounting for up to 65 % oftotal electricity sales (Fig. 1). Accordingly, outputgrowth in the industrial sector has the largest effecton electricity consumption in Uganda [28]. In linewith this proposition, a regression of the relationshipbetween the index of industrial production (IOP) anddomestic peak demand is presented in Fig. 8 andTable 10.The polynomial functions in Fig. 10 suggest that there
is a somewhat one-to-one relationship between changein IOP and domestic electricity peak demand, much asthe deviation of the observations from their mean—asindicated by the scatter seems to be high.The GLM estimates in Table 10 indicate that the
IOP correlates fairly well with average domestic peakdemand than with maximum domestic peak demand.
Table 8 Structural break regression of relationship betweensystem peak and nonpeak demand
Dependent variable = peak energy sales
Coef. Std. err. T
Nonpeak energy sales (NP) 1.30*** 0.12 10.72
Dummy (D) 130.11*** 44.74 2.91
Interaction (NP*D) −0.79*** 0.27 −2.95
Constant −75.66*** 18.38 −4.12
Obs. 44
F(3, 41) 103.59***
R-squared 0.88
Adj. R-squared 0.87
Individual results
M1_Before Jan 2013(Jan 2011–Dec 2012)
Coef. Robust std. err. Z
Nonpeak energy sales (NP) 1.30*** 0.10 12.88
Constant −75.66*** 16.01 -4.73
M1_log variance
Constant 3.65*** 0.22 16.88
M2_After Jan 2013(Jan 2013–Sept 2014)
Nonpeak energy sales (NP) 0.51*** 0.08 6.11
Constant 54.44*** 14.06 3.87
M2_log variance
Constant 1.60*** 0.20 7.84
Significance levels: *** = significant at the 1% level, ** = significant at the 5%level, *= significant at the 10% level
Table 9 F test results that D = 0 and (NP*D) = 0
F(2, 41) 4.56**
Prob > F 0.016
Significance levels: *** = significant at the 1% level, ** = significant at the 5%level, *= significant at the 10% level
Okoboi and Mawejje Energy, Sustainability and Society (2016) 6:29 Page 12 of 16

In terms of impact, the results indicate that a 10 %increase in the index of industrial production is as-sociated with 6.6 % increase in average domesticpeak demand and 5.8 % maximum domestic peakdemand spikes in the country. The results are statis-tically significant at less than 5 % level. Based onthis statistical relationship, we can conclude that in-dustrial production is an important driver of peakelectricity demand.
Medium term forecast of total peak demand in UgandaWe forecast Uganda’s medium term electricity de-mand based on predicted values from Eq. 1. The fore-cast of total peak demand based on predicted peakdemand was performed using the double exponential
smoothing regime given that the predicted valuesfollowed a similar trend (Fig. 11).The forecast considered three scenarios of Uganda’s
medium term peak demand as follows: normalgrowth, accelerated growth that is 5 % above theforecasted normal growth, and suboptimal growththat is 2 % below the forecasted normal growth(Fig. 9). The forecasted normal growth in total elec-tricity peak demand is based on the historical datawhile the forecasted accelerated growth scenario isbased on Uganda Investment Authority (UIA) projec-tions3 of growth in industries by both local and/orforeign investors in agriculture, construction, andmining especially as the country gears into the devel-opment stage of the oil and gas industry.In the medium term, suboptimal growth in electri-
city peak demand may materialize if there are signifi-cant regional geopolitical risks that may curtail exportdemand for industrial products. In addition, the com-pletion of energy projects in Uganda’s neighboringcountries, such as Kenya’s Olkaria-Lessos-KisumuTransmission Lines, may lead a decline in the recentupsurge in Uganda’s electricity exports to Kenya(Figure 12 in Appendix). This may to lead to a reductionin electricity peak demand given the previously observedclose relationship between electricity exports and peakdemand.Results in Fig. 10 indicate that under the normal
growth scenario, electricity peak demand is forecastto rise to 900 MW by January 2021. Under the accel-erated growth scenario, our model predicts peak de-mand to reach an average of 950 MW by January2021. Finally, under the suboptimal growth scenario,
Fig. 10 Relationship between IOP and domestic peak demand
Table 10 GLM estimates of the relationship between IOP anddomestic peak demand
Dependent variable
Parameters Av. peak (log) Max. peak (log)
IOP (log) 0.66*** 0.58**
Bootstrap std. err. 0.17 0.26
T 3.82 2.21
Number of obs. 13 13
Replications 105 105
Wald chi2 (1) 14.62*** 4.89**
Prob > chi2 0.00 0.03
R-squared 0.42 0.28
Adj. R-squared 0.36 0.22
Significance levels: *** = significant at the 1% level, ** = significant at the 5%level, *= significant at the 10% level
Okoboi and Mawejje Energy, Sustainability and Society (2016) 6:29 Page 13 of 16
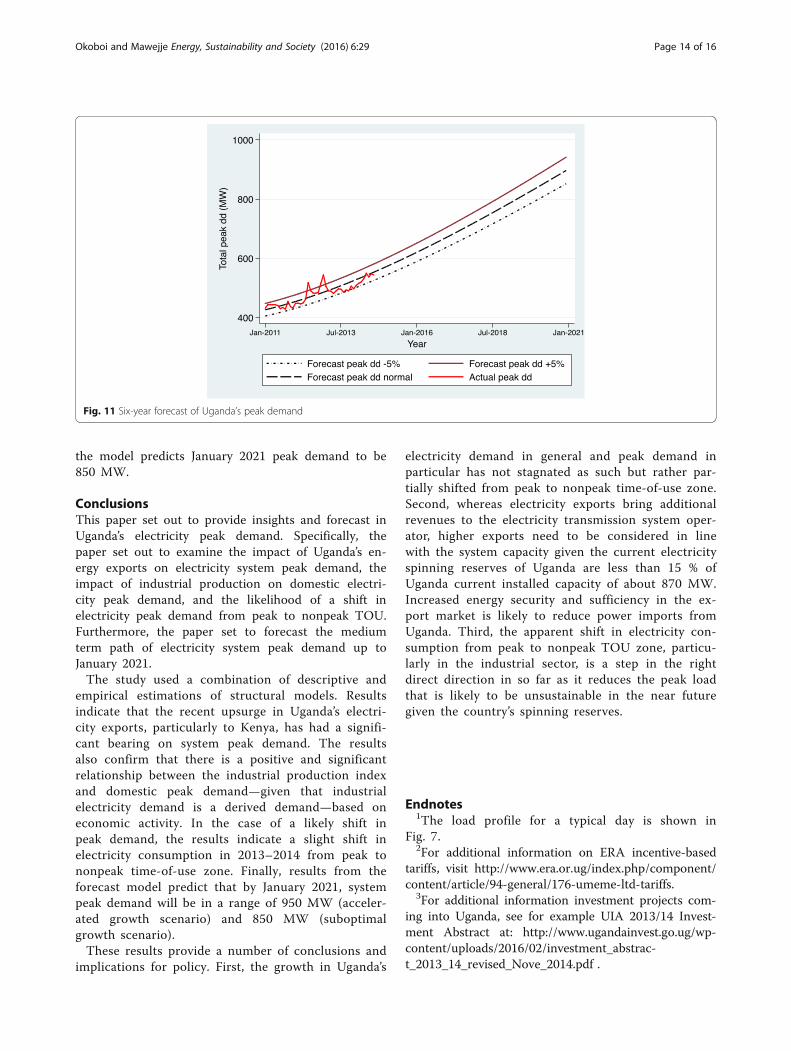
the model predicts January 2021 peak demand to be850 MW.
ConclusionsThis paper set out to provide insights and forecast inUganda’s electricity peak demand. Specifically, thepaper set out to examine the impact of Uganda’s en-ergy exports on electricity system peak demand, theimpact of industrial production on domestic electri-city peak demand, and the likelihood of a shift inelectricity peak demand from peak to nonpeak TOU.Furthermore, the paper set to forecast the mediumterm path of electricity system peak demand up toJanuary 2021.The study used a combination of descriptive and
empirical estimations of structural models. Resultsindicate that the recent upsurge in Uganda’s electri-city exports, particularly to Kenya, has had a signifi-cant bearing on system peak demand. The resultsalso confirm that there is a positive and significantrelationship between the industrial production indexand domestic peak demand—given that industrialelectricity demand is a derived demand—based oneconomic activity. In the case of a likely shift inpeak demand, the results indicate a slight shift inelectricity consumption in 2013–2014 from peak tononpeak time-of-use zone. Finally, results from theforecast model predict that by January 2021, systempeak demand will be in a range of 950 MW (acceler-ated growth scenario) and 850 MW (suboptimalgrowth scenario).These results provide a number of conclusions and
implications for policy. First, the growth in Uganda’s
electricity demand in general and peak demand inparticular has not stagnated as such but rather par-tially shifted from peak to nonpeak time-of-use zone.Second, whereas electricity exports bring additionalrevenues to the electricity transmission system oper-ator, higher exports need to be considered in linewith the system capacity given the current electricityspinning reserves of Uganda are less than 15 % ofUganda current installed capacity of about 870 MW.Increased energy security and sufficiency in the ex-port market is likely to reduce power imports fromUganda. Third, the apparent shift in electricity con-sumption from peak to nonpeak TOU zone, particu-larly in the industrial sector, is a step in the rightdirect direction in so far as it reduces the peak loadthat is likely to be unsustainable in the near futuregiven the country’s spinning reserves.
Endnotes1The load profile for a typical day is shown in
Fig. 7.2For additional information on ERA incentive-based
tariffs, visit http://www.era.or.ug/index.php/component/content/article/94-general/176-umeme-ltd-tariffs.
3For additional information investment projects com-ing into Uganda, see for example UIA 2013/14 Invest-ment Abstract at: http://www.ugandainvest.go.ug/wp-content/uploads/2016/02/investment_abstrac-t_2013_14_revised_Nove_2014.pdf .
Fig. 11 Six-year forecast of Uganda’s peak demand
Okoboi and Mawejje Energy, Sustainability and Society (2016) 6:29 Page 14 of 16

Appendix
AcknowledgementsThis study benefited from insightful discussions and comments fromcolleagues at the Electricity Regulatory Authority and the Economic PolicyResearch Centre. We are grateful to two anonymous referees for usefulcomments.
Authors’ contributionsGO conceptualized the study and contributed towards the data analysis. JMcontributed towards the drafting of the manuscript and refining the paper.All authors read and approved the final manuscript.
Authors’ informationGO is the Director of Economic Regulation at the Electricity RegulatoryAuthority. JM is a Research Analyst at the Economic Policy Research Centrewith research interests in development, macroeconomics, and naturalresources.
Competing interestsThe authors declare that they have no competing interests.
Author details1Electricity Regulatory Authority, Plot 15 Shimon Road, P.O. Box 10332,Nakasero, Kampala, Uganda. 2Economic Policy Research Centre, MakerereUniversity Campus, 51 Pool Road, P.O. Box 7841, Kampala, Uganda.
Received: 6 February 2016 Accepted: 19 September 2016
References1. Oyedepo SO (2012) Energy and sustainable development in Nigeria: the
way forward, Energy. Sustainability and Society 2(1):1–172. Payne JE (2010) A survey of the electricity consumption-growth literature.
Applied energy 87(3):723–7313. Rögnvaldur H (2009) Energy and GDP growth. International Journal of
Energy Sector Management 3(2):157–1704. Calderon C (2008) Infrastructure and growth in Africa. Africa Infrastructure
Country Diagnostic, Working Paper 3, World Bank, Washington, DC5. Alfares HK, Nazeeruddin M (2002) Electric load forecasting: literature survey
and classification of methods. International Journal of Systems Science33(1):23–34
6. Stern F (2013) Peak demand and time-differentiated energy savings cross-cutting protocols, subcontract report no. NREL/SR-7A30-53827, in “TheUniform Methods Project: Methods for Determining Energy Efficiency
Savings for Specific Measures”. National Renewable Laboratory. http://energy.gov/sites/prod/files/2013/11/f5/53827-10.pdf. Accessed 15 Nov 2014.
7. Gross G, Galiana FD (1987) Short-term load forecasting. Proceedings of theIEEE 75(12):1558–1573
8. Chao H (1983) Peak load pricing and capacity planning with demand andsupply uncertainty. The Bell Journal of Economics 14(1):179–190
9. Anderson R, Taylor L (1986) The social cost of unsupplied electricity: acritical review. Energy Economics 8(3):139–146
10. Lee KS, Anas A, Oh GT (1999) Costs of infrastructure deficiencies formanufacturing in Nigerian, Indonesian and Thai cities. Urban Studies36(12):2135–2149
11. Reinikka R, Svensson J (2002) Coping with poor public capital. Journal ofdevelopment economics 69(1):51–69
12. Kateregga E (2009) The welfare costs of electricity outages: acontingent valuation analysis of households in the suburbs of Kampala,Jinja and Entebbe. Journal of Development and Agricultural Economics1(1):1–11
13. Allcott H, Collard-Wexler A, O’Connell SD (2014) How do electricityshortages affect productivity? Evidence from India, National Bureau ofEconomic Research, Working Papers, No. 19977
14. Fisher-Vanden K, Mansur ET, Wang QJ (2015) Electricity shortages and firmproductivity: evidence from China’s industrial firms. Journal of DevelopmentEconomics 114:172–188
15. Mawejje J, Munyambonera E, Bategeka L (2013) Powering ahead: the reformof the electricity sector in Uganda. Energy and Environment Research 3(2):126–138
16. Okoboi G, Mawejje J (2016) The impact of adoption of power factorcorrection technology on electricity peak demand in Uganda. Journal ofEconomic Structures 5(1):1–14
17. Twaha S, Ramli MA, Murphy PM, Mukhtiar MU, Nsamba HK (2016)Renewable based distributed generation in Uganda: resource potentialand status of exploitation. Renewable and Sustainable Energy Reviews57:786–798
18. Twaha S, Idris MH, Anwari M, Khairuddin A (2012) Applying grid-connected photovoltaic system as alternative source of electricity tosupplement hydro power instead of using diesel in Uganda. Energy37(1):185–194
19. Government of Uganda (2015) Second National Development Plan 2015/16–2019/20. National Planning Authority, Republic of Uganda
20. Engurait SP (2005) Power sector reforms in Uganda: status andachievements. International Journal of Global Energy Issues 23(2):110–118
21. Karekezi S, Kimani J, Mutiga A, Amenya S (2004). Energy services for thepoor in Eastern Africa Sub Region: energy access study of East Africa. Global
8.1
5.0
0.3 0.2
Kenya Tanzania Rwanda Dem. Rep. Congo
Ele
ctri
city
Exp
ort
(Gw
h)
Fig. 12 Uganda’s electricity exports to other countries in August 2014
Okoboi and Mawejje Energy, Sustainability and Society (2016) 6:29 Page 15 of 16

Network on Energy for Sustainable Development. African Energy ResearchNetwork.
22. Mawejje J, Munyambonera E, Bategeka L (2012) Uganda’s electricity sectorreforms and institutional restructuring. EPRC Research Series No. 89,Kampala: Economic Policy Research Centre
23. Mawejje J (2014) Improving electricity access in Uganda. Kampala:Economic Policy Research Centre. Policy Brief No. 43
24. Mawejje J, Nampewo D (2012) Perceptions of Ugandan business executiveson the current and expected business economic conditions, EPRC BusinessClimate Index Issue 1. Economic Policy Research Centre, Kampala
25. Efron B (1979) Bootstrap methods: another look at the jacknife. The Annalsof Statistics 7(1):1–26
26. Royston P, Sauerbrei W (2008) Multivariable model-building—a pragmaticapproach to regression analysis based on fractional polynomials forcontinuous variables volume 777. John Wiley & Sons Ltd, Chichester
27. Clogg CC, Petkova E, Haritou A (1995) Statistical methods for comparingregression coefficients between models. American Journal of Sociology100(5):1261–1293
28. Mawejje J, Mawejje ND (2016) Electricity consumption and sectoral outputin Uganda: an empirical investigation. Journal of Economic Structures5(21):1–16
Submit your manuscript to a journal and benefi t from:
7 Convenient online submission
7 Rigorous peer review
7 Immediate publication on acceptance
7 Open access: articles freely available online
7 High visibility within the fi eld
7 Retaining the copyright to your article
Submit your next manuscript at 7 springeropen.com
Okoboi and Mawejje Energy, Sustainability and Society (2016) 6:29 Page 16 of 16