Countess Wear Waste Water Treatment Works (new electricity ...
International Journal of Advanced Engineering and Nano Technology (IJAENT) ISSN: 2347-6389, Volume-1, Issue-5, April 2014
29
Published By: Blue Eyes Intelligence Engineering & Sciences Publication Pvt. Ltd.
Abstract— Now a days height of buildings (flats) are too much
high and urbanization is happening all around the world. Simultaneously, power crisis is a very big problem. Local residents were trained to maintain the hydro schemes. The Pico hydro sites in Kenya won Ashden Awards for Sustainable Energy. In this paper it has explained that how the potential energy of waste water from washroom can generate electric power through Hydraulic Turbine and generator.
Index Terms—hydel power plant,head, flow, axialturbine, francis turbine, pelton turbines
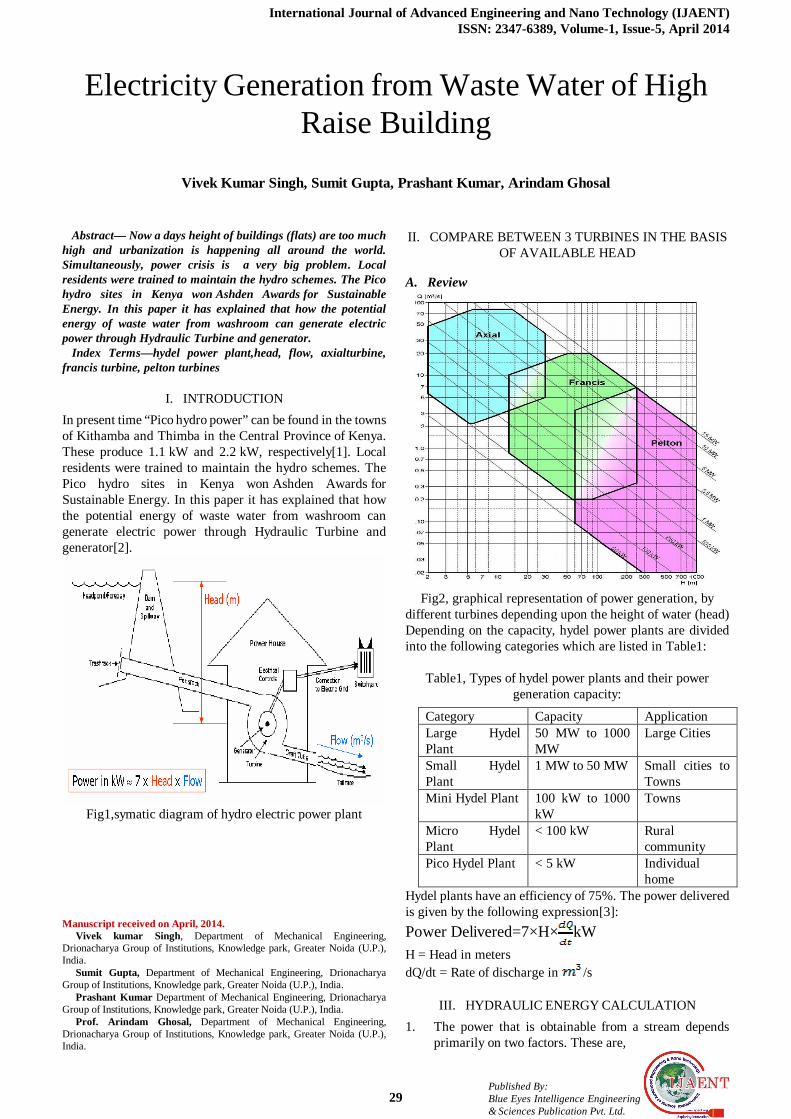
I. INTRODUCTION In present time “Pico hydro power” can be found in the towns of Kithamba and Thimba in the Central Province of Kenya. These produce 1.1 kW and 2.2 kW, respectively[1]. Local residents were trained to maintain the hydro schemes. The Pico hydro sites in Kenya won Ashden Awards for Sustainable Energy. In this paper it has explained that how the potential energy of waste water from washroom can generate electric power through Hydraulic Turbine and generator[2].
Fig1,symatic diagram of hydro electric power plant
Manuscript received on April, 2014.
Vivek kumar Singh, Department of Mechanical Engineering, Drionacharya Group of Institutions, Knowledge park, Greater Noida (U.P.), India.
Sumit Gupta, Department of Mechanical Engineering, Drionacharya Group of Institutions, Knowledge park, Greater Noida (U.P.), India.
Prashant Kumar Department of Mechanical Engineering, Drionacharya Group of Institutions, Knowledge park, Greater Noida (U.P.), India.
Prof. Arindam Ghosal, Department of Mechanical Engineering, Drionacharya Group of Institutions, Knowledge park, Greater Noida (U.P.), India.
II. COMPARE BETWEEN 3 TURBINES IN THE BASIS OF AVAILABLE HEAD
A. Review
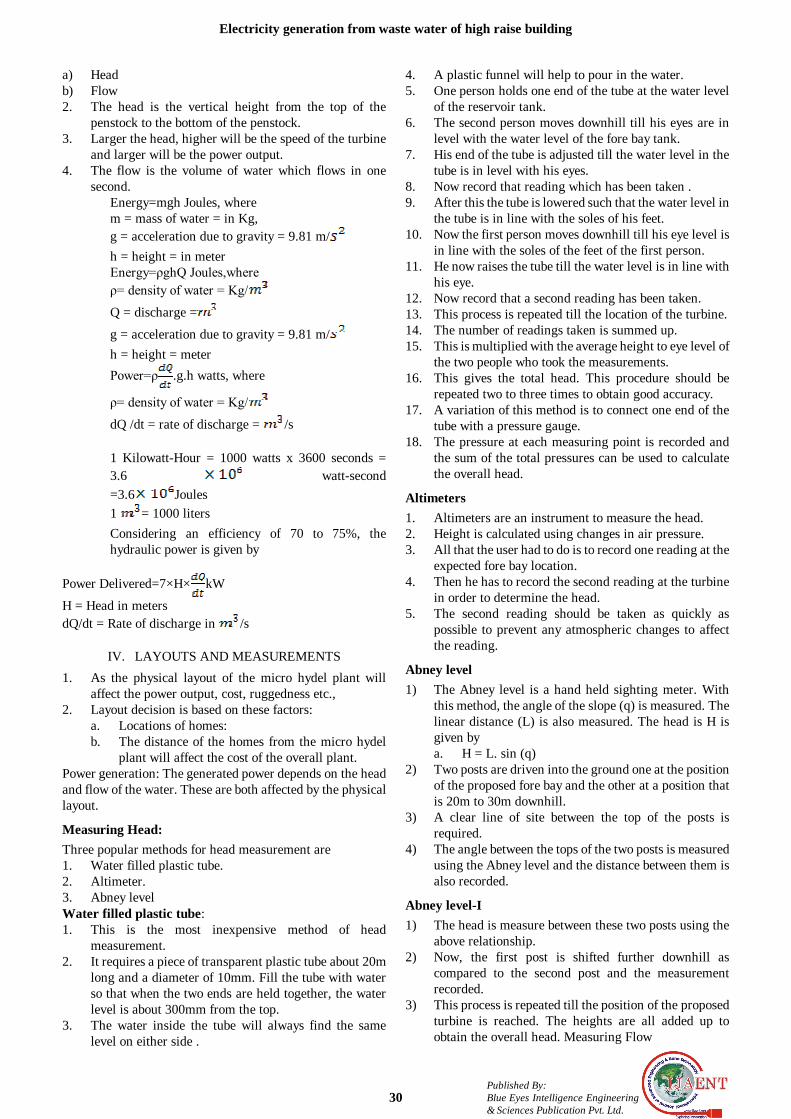
Fig2, graphical representation of power generation, by
different turbines depending upon the height of water (head) Depending on the capacity, hydel power plants are divided into the following categories which are listed in Table1:
Table1, Types of hydel power plants and their power generation capacity:
Hydel plants have an efficiency of 75%. The power delivered is given by the following expression[3]: Power Delivered=7×H× kW H = Head in meters dQ/dt = Rate of discharge in /s
III. HYDRAULIC ENERGY CALCULATION 1. The power that is obtainable from a stream depends
primarily on two factors. These are,
Electricity Generation from Waste Water of High Raise Building
Vivek Kumar Singh, Sumit Gupta, Prashant Kumar, Arindam Ghosal
Category Capacity Application Large Hydel Plant
50 MW to 1000 MW
Large Cities
Small Hydel Plant
1 MW to 50 MW Small cities to Towns
Mini Hydel Plant 100 kW to 1000 kW
Towns
Micro Hydel Plant
< 100 kW Rural community
Pico Hydel Plant < 5 kW Individual home
Electricity generation from waste water of high raise building
30 Published By: Blue Eyes Intelligence Engineering & Sciences Publication Pvt. Ltd.
a) Head b) Flow 2. The head is the vertical height from the top of the
penstock to the bottom of the penstock. 3. Larger the head, higher will be the speed of the turbine
and larger will be the power output. 4. The flow is the volume of water which flows in one
second. Energy=mgh Joules, where m = mass of water = in Kg, g = acceleration due to gravity = 9.81 m/ h = height = in meter Energy=ρghQ Joules,where ρ= density of water = Kg/
Q = discharge =
g = acceleration due to gravity = 9.81 m/ h = height = meter Power=ρ .g.h watts, where
ρ= density of water = Kg/
dQ /dt = rate of discharge = /s
1 Kilowatt-Hour = 1000 watts x 3600 seconds = 3.6 watt-second =3.6 Joules 1 = 1000 liters Considering an efficiency of 70 to 75%, the hydraulic power is given by
Power Delivered=7×H× kW
H = Head in meters dQ/dt = Rate of discharge in /s
IV. LAYOUTS AND MEASUREMENTS 1. As the physical layout of the micro hydel plant will
affect the power output, cost, ruggedness etc., 2. Layout decision is based on these factors:
a. Locations of homes: b. The distance of the homes from the micro hydel
plant will affect the cost of the overall plant. Power generation: The generated power depends on the head and flow of the water. These are both affected by the physical layout.
Measuring Head: Three popular methods for head measurement are 1. Water filled plastic tube. 2. Altimeter. 3. Abney level Water filled plastic tube: 1. This is the most inexpensive method of head
measurement. 2. It requires a piece of transparent plastic tube about 20m
long and a diameter of 10mm. Fill the tube with water so that when the two ends are held together, the water level is about 300mm from the top.
3. The water inside the tube will always find the same level on either side .
4. A plastic funnel will help to pour in the water. 5. One person holds one end of the tube at the water level
of the reservoir tank. 6. The second person moves downhill till his eyes are in
level with the water level of the fore bay tank. 7. His end of the tube is adjusted till the water level in the
tube is in level with his eyes. 8. Now record that reading which has been taken . 9. After this the tube is lowered such that the water level in
the tube is in line with the soles of his feet. 10. Now the first person moves downhill till his eye level is
in line with the soles of the feet of the first person. 11. He now raises the tube till the water level is in line with
his eye. 12. Now record that a second reading has been taken. 13. This process is repeated till the location of the turbine. 14. The number of readings taken is summed up. 15. This is multiplied with the average height to eye level of
the two people who took the measurements. 16. This gives the total head. This procedure should be
repeated two to three times to obtain good accuracy. 17. A variation of this method is to connect one end of the
tube with a pressure gauge. 18. The pressure at each measuring point is recorded and
the sum of the total pressures can be used to calculate the overall head.
Altimeters 1. Altimeters are an instrument to measure the head. 2. Height is calculated using changes in air pressure. 3. All that the user had to do is to record one reading at the
expected fore bay location. 4. Then he has to record the second reading at the turbine
in order to determine the head. 5. The second reading should be taken as quickly as
possible to prevent any atmospheric changes to affect the reading.
Abney level 1) The Abney level is a hand held sighting meter. With
this method, the angle of the slope (q) is measured. The linear distance (L) is also measured. The head is H is given by a. H = L. sin (q)
2) Two posts are driven into the ground one at the position of the proposed fore bay and the other at a position that is 20m to 30m downhill.
3) A clear line of site between the top of the posts is required.
4) The angle between the tops of the two posts is measured using the Abney level and the distance between them is also recorded.
Abney level-I 1) The head is measure between these two posts using the
above relationship. 2) Now, the first post is shifted further downhill as
compared to the second post and the measurement recorded.
3) This process is repeated till the position of the proposed turbine is reached. The heights are all added up to obtain the overall head. Measuring Flow

International Journal of Advanced Engineering and Nano Technology (IJAENT) ISSN: 2347-6389, Volume-1, Issue-5, April 2014
31
Published By: Blue Eyes Intelligence Engineering & Sciences Publication Pvt. Ltd.
4) The flow should be measured during the worst case condition.
5) During the rainy season, the flow will be high and will provide high power output.
6) However, during the dry season, the flow will be low. 7) It should be estimated whether the load requirement
will be met even during the worst case dry seasons. 8) Therefore, the flow measurement should be done during
the dry seasons. Bucket Method: 9) Take a 15 liter bucket or any container with known
volume. 10) If the volume of the container is not known then it can
be found out by filling the container with water from a 1litre bottle.
11) Count the number of liter that has been added. This is giving the volume of the container.
Measuring Flow-2 1. The most challenging task in this method is to find a
location in the stream where the water can be directed into the bucket.
2. This is done by placing the bucket at the bottom of a natural narrow fall in the stream path or by building a simple weir by using a wooden channel or a corrugated sheet such that the stream water flows through this weir during measurement.
3. Now, using a stopwatch, record the time it takes to fill the bucket.
4. Repeat the experiment three times and take the average. 5. The volume of the bucket divided by the average time it
takes to fill the bucket gives the flow rate of the water. Float method 1) This method works well in canals and channels because
this method requires the knowledge of the cross sectional area of water flowing.
2) The speed of the water flowing is found out by using a float and timing its travel between two points in the stream.
3) Estimating the cross sectional area of a channel or canal is relatively easy as the cross sectional geometry is known.
4) But in the case of a river or stream it is much more difficult to calculate the cross sectional area.
5) To estimate the area at a particular section, measure the width of the stream at that point. FloTurbine
6) The turbine is a device which converts the hydraulic power from the water to rotating mechanical energy.
There are several turbines that have been developed for specific purposes. Turbines are classified into a) Impulse turbines for high heads. b) Reaction turbines for low heads. c) Submersible propeller turbines. Some of the turbines are Elton, cross flow, turbo, Francis, Harris etc.
V. EQUIPMENT USED IN THE RESEARCH WORK
Generator Generally, induction generators and synchronous generators are used to produce the power.
Induction generators are especially suited for providing electricity in remote areas because they are rugged and reliable. However, synchronous generators and dc generators have also been used for some applications. The three phase induction motors can be used as generators. These are easily available and quite inexpensive. For most home applications, a single phase supply is required. It is required to produce a single phase supply from a three phase motor. Load Control The speed of the turbine changes when the load connected to the generator changes. Since this change of speed affects the voltage and frequency, the load on the generator must be kept constant or the flow of water through the nozzle must be adjusted. The most reliable method of controlling the load and keeping the voltage and frequency constant is by using an electronic load controller. The unused power of the induction generator is sent to a ballast or dummy load so that the total load on the generator remains constant.
VI. CALCULATION (FOR 18 FLOORS FLATS) Let the water storage tank has been installed at a height of 6m from the turbine. Person living per floor might be 20 person. Water consumption per person = 150 Lt Thus total water consumed =150×20 (no. of floor)=45000Lt. 1 =1000Lt, thus 45000Lt=45 Capacity of each tank = 15 Let the time to empty the reservoir is 20m=20 sec=120sec. Power Delivered=7×H× kw=7×6× kw=0.525kw.
Same power is generated thrice a day as total waste water available is 45 . Thus, total power generated = 0.525×3kw=1.57kw.
Fig3, Working Model of turbine which producing electricity
from wash room waste water.

Electricity generation from waste water of high raise building
32 Published By: Blue Eyes Intelligence Engineering & Sciences Publication Pvt. Ltd.
REFERENCES [1] http://hydrovolts.blogspot.in/2010/05/distributed-hydropower-
from-wastewater.html [2] http://bigthink.com/design-for-good/hydro-power-turning-
toilet-wastewater-into-electricity [3] http://www.sustainability.mottmac.com/sustainabilityprojects
/?mode=type&id=262430
Vivek kumar Singh, Department of Mechanical Engineering, Drionacharya Group of Institutions, Knowledge park, Greater Noida (U.P.), India.
Sumit Gupta Department of Mechanical Engineering, Drionacharya Group
of Institutions, Knowledge park, Greater Noida (U.P.), India. Prashant Kumar Department of Mechanical Engineering, Drionacharya
Group of Institutions, Knowledge park, Greater Noida (U.P.), India. Prof. Arindam Ghosal, Department of Mechanical Engineering,
Drionacharya Group of Institutions, Knowledge park, Greater Noida (U.P.), [email protected],Mobile:(+91)8826356956