Elasticity and Buoyancy of Major Tax Categories:...
34
49 Elasticity and Buoyancy of Major Tax Categories: Evidence from Bangladesh and Its Policy Implications Research Study Series No. – FDRS 03/2013 Mohammed Yousuf and S M Jakaria Huq 1 Abstract- In Public finance, two important measures that have been used to assess the efficiency of any tax system in terms of its mobilization capacity are tax buoyancy – total response of tax revenue to change in national income and discretionary change in tax policy over time; and tax elasticity – automatic response of tax revenue to GDP changes less the discretionary tax changes. In this study, we used Exponential Smoothing Method and Slope Dummy to address the big policy changes for eliminating the effects of the Discretionary Tax Measures (DTM) on historical Time Series Data for the period 1980- 2011 to estimate the elasticity of the Bangladesh tax system. The study reveals that estimates of elasticity and buoyancy are higher for Direct Taxes followed by Sales Tax and VAT. However, Customs Duties appear to be rigid, due to which the overall tax elasticity is relatively low. Further, the estimate of buoyancy is higher than their corresponding elasticities for all the taxes, confirming thereof that most of the growth in revenues has been achieved due to discretionary changes instead of automatic growth. 1 Authors: 1. Mohammed Yousuf, Joint Secretary, E-mail-[email protected] 2. S M Jakaria Huq, Deputy Secretary, E-mail-[email protected] Macroeconomic Wing, Finance Division, Ministry of Finance, Bangladesh Secretariat, Dhaka-1000, Bangladesh. *This paper was written during in June 2012.
Transcript of Elasticity and Buoyancy of Major Tax Categories:...
49
Elasticity and Buoyancy of Major Tax Categories: Evidence from Bangladesh and Its
Policy Implications
Research Study Series No. – FDRS 03/2013
Mohammed Yousuf and S M Jakaria Huq1
Abstract- In Public finance, two important measures that have been used to assess the
efficiency of any tax system in terms of its mobilization capacity are tax buoyancy – total
response of tax revenue to change in national income and discretionary change in tax
policy over time; and tax elasticity – automatic response of tax revenue to GDP changes
less the discretionary tax changes. In this study, we used Exponential Smoothing Method
and Slope Dummy to address the big policy changes for eliminating the effects of the
Discretionary Tax Measures (DTM) on historical Time Series Data for the period 1980-
2011 to estimate the elasticity of the Bangladesh tax system. The study reveals that
estimates of elasticity and buoyancy are higher for Direct Taxes followed by Sales Tax
and VAT. However, Customs Duties appear to be rigid, due to which the overall tax
elasticity is relatively low. Further, the estimate of buoyancy is higher than their
corresponding elasticities for all the taxes, confirming thereof that most of the growth in
revenues has been achieved due to discretionary changes instead of automatic growth.
1Authors: 1. Mohammed Yousuf, Joint Secretary, [email protected]
2. S M Jakaria Huq, Deputy Secretary, [email protected]
Macroeconomic Wing, Finance Division, Ministry of Finance, Bangladesh Secretariat, Dhaka-1000, Bangladesh.
*This paper was written during in June 2012.

50
I. Introduction
Resource mobilization, to achieve high growth, is a major constraint in Bangladesh. In the
present global context, access to concessionary external funds is difficult to obtain as it has
become increasingly competitive. Too much reliance on foreign assistance has
macroeconomic and inter-generational consequences as well. Bank borrowing has also its
limit; going beyond a certain threshold level exerts inflationary pressure and crowds-out
private sector investment. Moreover, due to various supply constraints of the economy,
capital inflow has yet not been at the desired level. In this respect, to meet the growing
needs of the economy while keeping budget deficit at a sustainable level, enhanced
domestic resource mobilization is considered more desirable.
As an outcome of multi-faceted economic reforms, efforts to collect revenue have
considerably been improved in the last few years. Revenue-GDP ratio which was 8.9 per
cent in FY 98-99, rose to 10.9 per cent in FY 2009-10, moving further up to 11.8 per cent in
2010-11. Even then, in terms of revenue mobilization, the country still lags well behind
than most of its regional peers (Figure1).In the medium term projection, government sets
a revenue target of 15.2 per cent of GDP. Against this backdrop, assessing existing revenue
performance of the country is essential as it will help understand the effectiveness of the
existing revenue system and give directives to the mapping of future revenue strategies.
Figure 1: Revenue GDP Ratio (excl. Grant): A Regional Comparison
Source: National Board of Revenue, Ministry of Finance, Bangladesh.
Revenu GDP Ratio (Excluding Grants) : A Regioanl
Comparison
11.4 10.1
22.9 24.0
14.9 13.8 15.212.1 11.9
15.6
0.0
5.0
10.0
15.0
20.0
25.0
30.0
India (2
010)
Afghanist
an (2010)
Bhutan (2
009)
Maldive
s (2009)
Srilanka (2
008)
Pakistan (2
010)
Nepal (2010)
Bangladesh (2
011)
China (2
009)
South A
sia
51
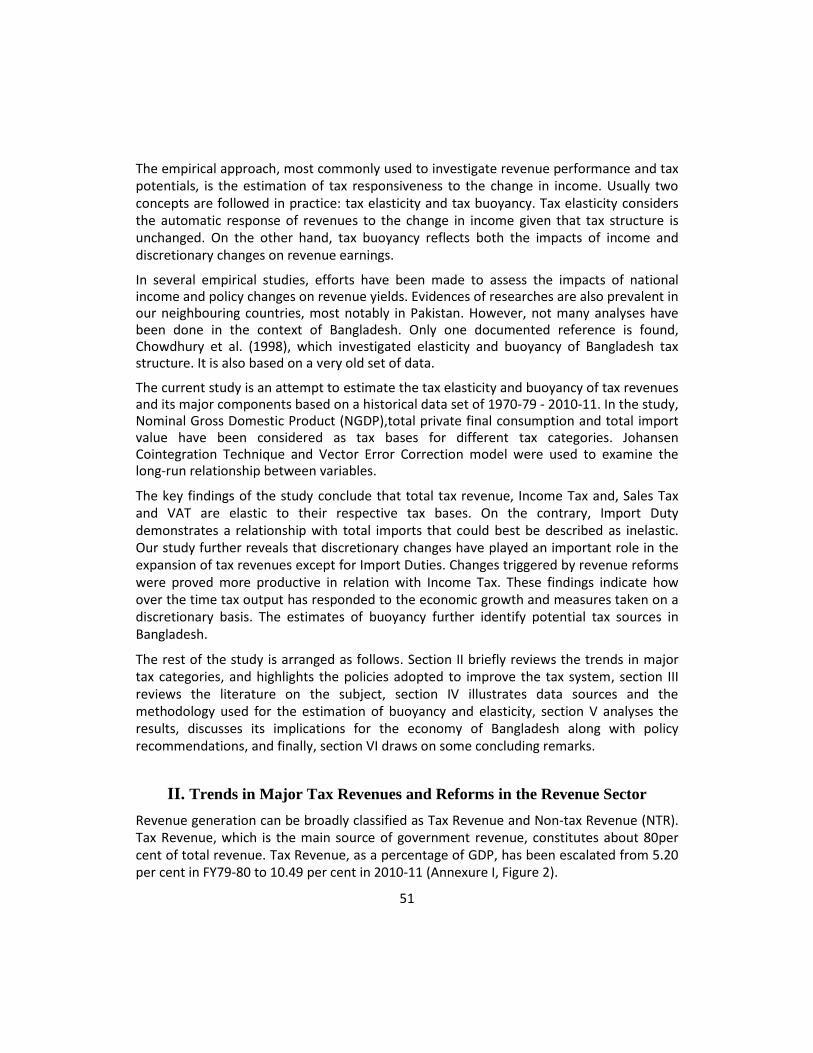
The empirical approach, most commonly used to investigate revenue performance and tax potentials, is the estimation of tax responsiveness to the change in income. Usually two concepts are followed in practice: tax elasticity and tax buoyancy. Tax elasticity considers the automatic response of revenues to the change in income given that tax structure is unchanged. On the other hand, tax buoyancy reflects both the impacts of income and discretionary changes on revenue earnings.
In several empirical studies, efforts have been made to assess the impacts of national income and policy changes on revenue yields. Evidences of researches are also prevalent in our neighbouring countries, most notably in Pakistan. However, not many analyses have been done in the context of Bangladesh. Only one documented reference is found, Chowdhury et al. (1998), which investigated elasticity and buoyancy of Bangladesh tax structure. It is also based on a very old set of data.
The current study is an attempt to estimate the tax elasticity and buoyancy of tax revenues and its major components based on a historical data set of 1970-79 - 2010-11. In the study, Nominal Gross Domestic Product (NGDP),total private final consumption and total import value have been considered as tax bases for different tax categories. Johansen Cointegration Technique and Vector Error Correction model were used to examine the long-run relationship between variables.
The key findings of the study conclude that total tax revenue, Income Tax and, Sales Tax and VAT are elastic to their respective tax bases. On the contrary, Import Duty demonstrates a relationship with total imports that could best be described as inelastic. Our study further reveals that discretionary changes have played an important role in the expansion of tax revenues except for Import Duties. Changes triggered by revenue reforms were proved more productive in relation with Income Tax. These findings indicate how over the time tax output has responded to the economic growth and measures taken on a discretionary basis. The estimates of buoyancy further identify potential tax sources in Bangladesh.
The rest of the study is arranged as follows. Section II briefly reviews the trends in major tax categories, and highlights the policies adopted to improve the tax system, section III reviews the literature on the subject, section IV illustrates data sources and the methodology used for the estimation of buoyancy and elasticity, section V analyses the results, discusses its implications for the economy of Bangladesh along with policy recommendations, and finally, section VI draws on some concluding remarks.
II. Trends in Major Tax Revenues and Reforms in the Revenue Sector
Revenue generation can be broadly classified as Tax Revenue and Non-tax Revenue (NTR). Tax Revenue, which is the main source of government revenue, constitutes about 80per cent of total revenue. Tax Revenue, as a percentage of GDP, has been escalated from 5.20 per cent in FY79-80 to 10.49 per cent in 2010-11 (Annexure I, Figure 2).

52
Figure 2: Various Tax Categories as % of GDP
Source: National board of Revenue; Finance Division, Ministry of Finance, Bangladesh.
Tax revenue is realized through different sub-heads: Value Added Tax (VAT), Taxes on
Income and Profits, Import Duties, Excise Duties, Supplementary Duties and other taxes
and duties. Over the years, as a percentage of GDP, Sales tax and VAT has grown more
vigorously than other categories of tax revenues. In FY 1979-80, Sales Tax and VAT was
2.03 percent of GDP which has now risen to 3.90 percent in 2010-11. It will be worth
mentioning that VAT was introduced in FY 1991-92; before that, sales tax used to be
applied. Income Tax has also manifested an increasing trend through the years. It was only
0.65 per cent of GDP in FY1979-80, which peaked to 1.10 percent in FY2010-11. As a result
of trade liberalization, Customs Duties as a share of GDP have decreased from 2.23 percent
of GDP in FY79-80 to 1.79 percent in FY2010-11 (Figure 2).
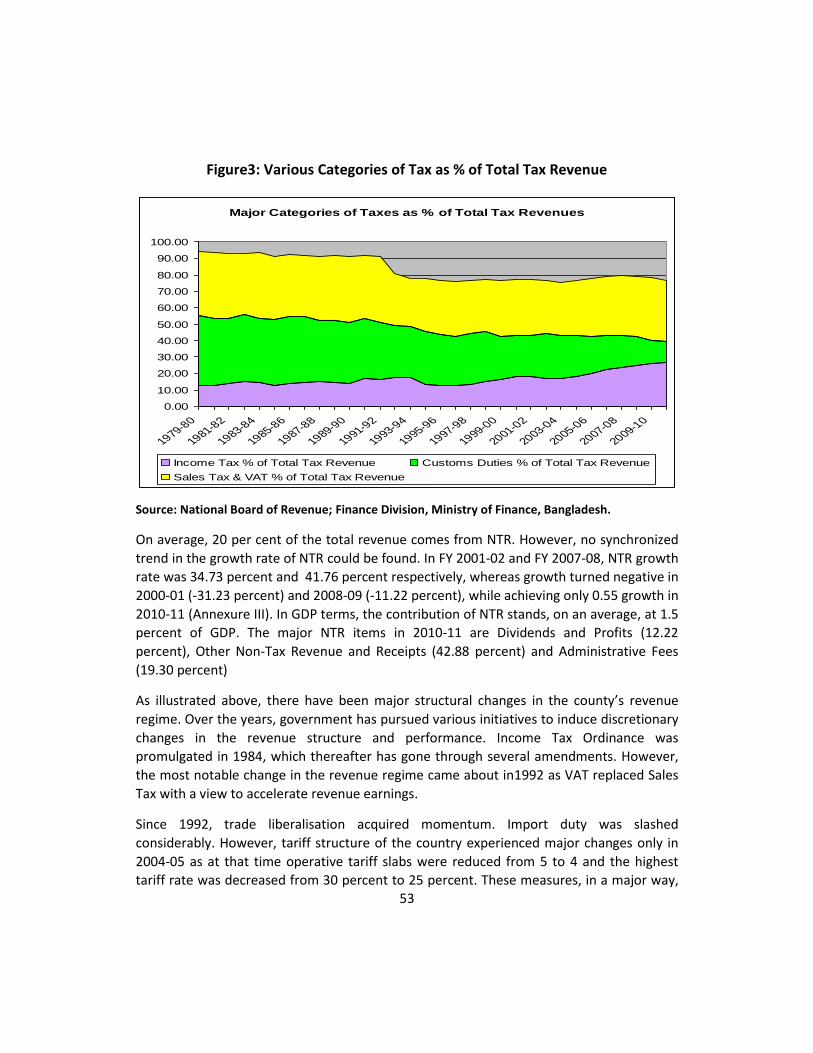
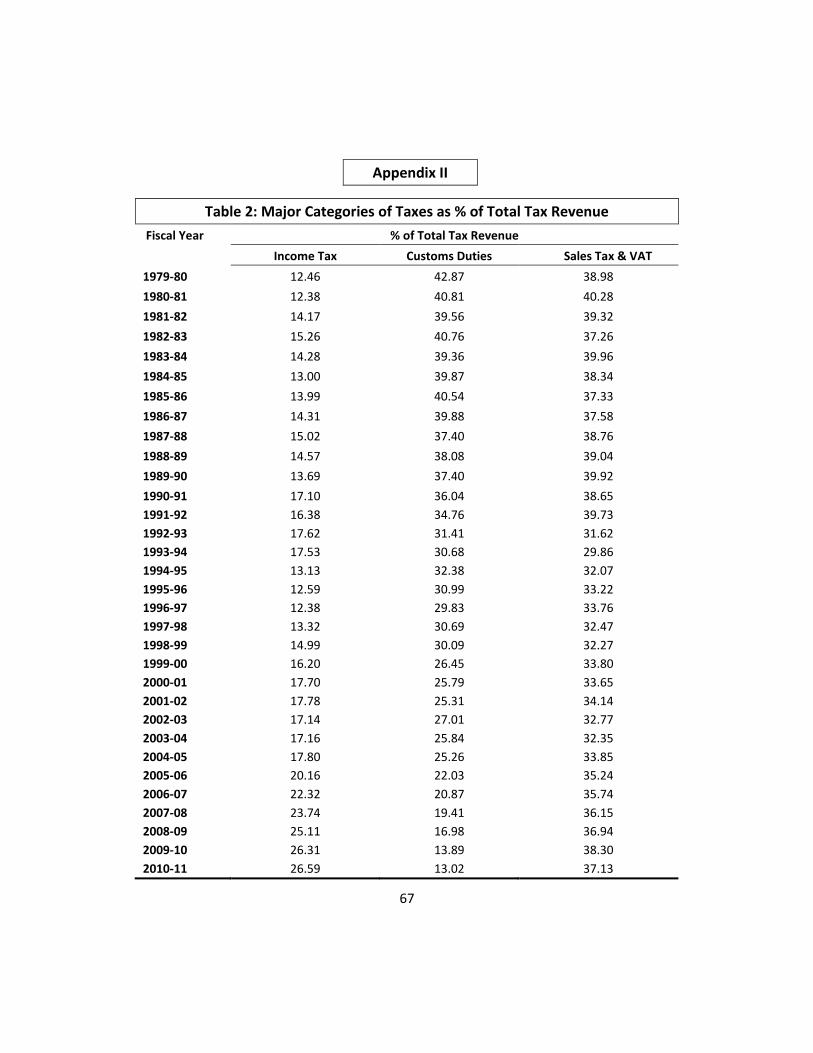
VAT, on an average, stayed around 36 percent of total tax revenue. The share of Income
Tax in the total tax revenue has more than doubled- now second largest contributor to the
tax revenue. However, Customs Duties, once a major component of the total tax revenue,
have lost its position both to Income Tax and VAT which is a positive development of
economic reforms. Now it is merely 13.02 per cent (FY 2010-11) of the total tax revenue as
compared to its early share of 42.87 percentage of total tax revenue in FY 1979-80
(Annexure II, Figure 3).
0
2
4
6
8
10
12
1979
-80
1981
-82
1983
-84
1985
-86
1987
-88
1989
-90
1991
-92
1993
-94
1995
-96
1997
-98
1999
-00
2001
-02
2003
-04
2005
-06
2007
-08
2009
-10
Total Tax % of NGDP Income Tax as % of NGDP
Customs Duties as % of NGDP Sales Tax & VAT as % of NGDP
53
Figure3: Various Categories of Tax as % of Total Tax Revenue
Source: National Board of Revenue; Finance Division, Ministry of Finance, Bangladesh.
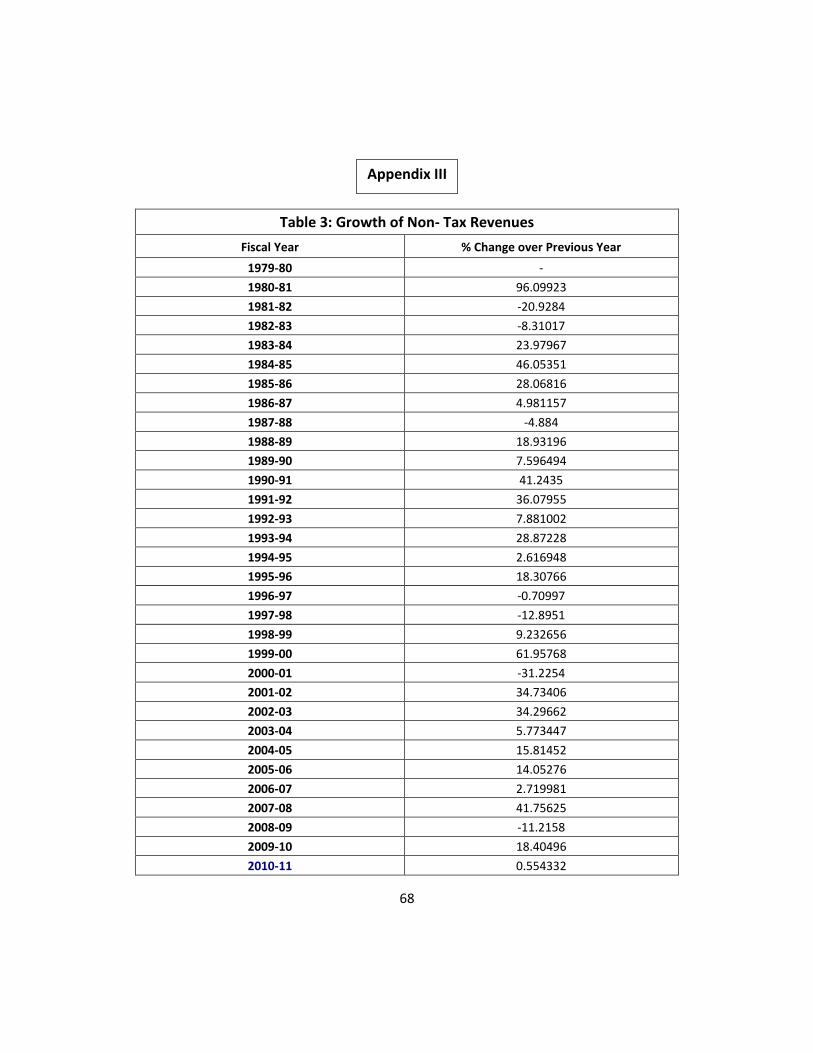
On average, 20 per cent of the total revenue comes from NTR. However, no synchronized
trend in the growth rate of NTR could be found. In FY 2001-02 and FY 2007-08, NTR growth
rate was 34.73 percent and 41.76 percent respectively, whereas growth turned negative in
2000-01 (-31.23 percent) and 2008-09 (-11.22 percent), while achieving only 0.55 growth in
2010-11 (Annexure III). In GDP terms, the contribution of NTR stands, on an average, at 1.5
percent of GDP. The major NTR items in 2010-11 are Dividends and Profits (12.22
percent), Other Non-Tax Revenue and Receipts (42.88 percent) and Administrative Fees
(19.30 percent)
As illustrated above, there have been major structural changes in the county’s revenue
regime. Over the years, government has pursued various initiatives to induce discretionary
changes in the revenue structure and performance. Income Tax Ordinance was
promulgated in 1984, which thereafter has gone through several amendments. However,
the most notable change in the revenue regime came about in1992 as VAT replaced Sales
Tax with a view to accelerate revenue earnings.
Since 1992, trade liberalisation acquired momentum. Import duty was slashed
considerably. However, tariff structure of the country experienced major changes only in
2004-05 as at that time operative tariff slabs were reduced from 5 to 4 and the highest
tariff rate was decreased from 30 percent to 25 percent. These measures, in a major way,
Major Categories of Taxes as % of Total Tax Revenues
0.00
10.00
20.00
30.00
40.00
50.00
60.00
70.00
80.00
90.00
100.00
1979-80
1981-82
1983-84
1985-86
1987-88
1989-90
1991-92
1993-94
1995-96
1997-98
1999-00
2001-02
2003-04
2005-06
2007-08
2009-10
Income Tax % of Total Tax Revenue Customs Duties % of Total Tax Revenue
Sales Tax & VAT % of Total Tax Revenue

54
influenced dependency on the tax collection at the import stage. In FY 2007-08, NBR took
some extraordinary measures to gear up revenue mobilization.
In the recent past, tax regime of Bangladesh has undergone some other notable
administrative reforms:
– Mandatory provision for Tax Identification Number (TIN) for registration of assets and business (land, vehicle etc.) in FY1991
– Introduction of ‘initial exemption limit’ (tax-base as ‘total income’) instead of ‘filing threshold system’ (tax-base as ‘taxable income’) in FY1993
– Provision of outsourcing of external auditing professional since 1993-94
– Customs, Excise and VAT Appellate Tribunal established from October 1, 1995
– Introduction of Large Taxpayers Unit (LTU) for income tax in FY1999
– Introduction of withholding tax being final discharge of tax liability in FY1999
– Introduction of Central Intelligence Cell (CIC) in FY2004
Reform in the revenue sector, which for quite a long time attempted on a piecemeal basis, is now following a more comprehensive approach. In recent times, initiatives have been taken at various structural, legal and administrative reforms in a synchronized manner. A draft VAT law now waits vetting of the Law and Parliamentarian Affairs Division. At the same time, Ministry of Finance has already given consent to the VAT implementation plan, and new organizational structure of the NBR. Custom houses are being brought under the ASYCUDA-World system. Moreover, under NBR modernization plan(2011-16), with a focus on building Digital NBR by December 2013 following areas are given priority:
– Introduction of a new Income Tax Act, Customs Tariff rationalization and modernization of the Customs Act
– Significant growth in revenue performance through widening and deepening of the existing tax base across all the three taxes
– Exemplary customer service to all taxpayers through a web enabled tax administration from e-registration, e-filing of tax returns to e-payments/refunds by 2016
– Redefining the status and regulatory power of the NBR
– Strategic communication and taxpayer outreach, education and assistance
– Enforcement improvement program including strengthening of tax evasion detecting unit like Central Intelligence Cell (CIC) and other intelligence units.
– Human Resources and Institutional Development Program

55
III. Literature Review
Choudhry (1979) examined the elasticity of tax revenue in the United States, United Kingdom, Malaysia and Kenya. As for the case of United States and United Kingdom, estimated elasticities were 1.04 and 1.24 respectively. However, the elasticities were found higher for Malaysia (1.57) and Kenya (1.32). Discretionary changes in the United States and the United Kingdom resulted in the reduction of revenues and thus contributed to low buoyancy and elasticity. On the other hand, in Malaysia and Kenya, discretionary measures resulted in a comparatively higher buoyancy and elasticity.
Osoro (1993) studied tax reforms and its impacts on the revenue growth in Tanzania for
the period 1979 to 1989. In his study, tax buoyancy was measured by using double log
form equation, and for the estimation of tax elasticity, Proportional Adjustment Method
was used. The result revealed an overall elasticity of 0.76 and a buoyancy of 1.06. It
concludes that tax reforms in Tanzania had failed to bring out desired revenue
enhancement. Numerous tax exemptions and poor tax administration were mainly liable
for limited impacts of Tanzania’s tax reforms. Osoro (1995) by using another data set of
1970-1980, found the elasticity of the overall tax system declined from 0.85 in 1970 to
0.782 in 1980. Income tax which was elastic in the 1970s became inelastic in the 1980s. On
the other hand, import duty which was in elastic in the 1970s, turned to elastic in the
1980s. The study explains that these changes were obvious due to reduction in import duty
rates and subsequent rise in imports and rapid changes in the tax base resulted from sharp
depreciation of exchange rate.
Chipeta (1998) for the period 1970 to 1994 studied the relationship between tax reforms
and tax productivity in Malawi. Estimated buoyancy and elasticity were respectively 0.95
and 0.6, which confirmed that the tax base had grown less rapidly in Malawi than GDP.
Kusi (1998) studied the impacts of Ghana’s tax reform on tax yields over the period 1970 to
1993. He found post-reform buoyancy (1.29) and elasticity (1.22) much larger as compared
to pre-reform buoyancy of 0.72 and elasticity 0.71. The low buoyancy and elasticity during
the pre-reform period was mainly attributed to smuggling, unrecorded trade, tax evasion
and laxity in tax collection. In this study, proportional adjustment method was used for
netting out effects of the discretionary tax measures reflected in the data series. Daniel
Kwabena Twerefou et al. (2010), unlike Kusi (1998), estimated the elasticity of Ghanaian
tax system using Dummy Variable Technique. This study uses a historical time series data
for the period of 1970-2007. The study found overall tax system was buoyant and elastic in
the long run, buoyancy being higher than elasticity. However, in the short run, the scenario
turned to be the reverse. The researchers used Engle-Granger Two Steps Co-integration
procedure to establish the long run relationship between the relevant variables and
generate Error Correction term for the aggregate and individual tax functions.

56
Skeete et al (2004) focused on the performance of the Barbados’s fiscal system over the period 1977 to 1999. Initially, the Engle Granger procedure was used to examine co-integration between the variables. Then, Error Correction Models (ECM) were used to estimate all of the elasticity and buoyancy values. In assessing tax elasticity, Prest’s (1962) method of netting out discretionary changes from the annual tax revenue series was employed. The study observed that elasticity of the tax regime was more responsive to changes in gross domestic product in the short run than that of the long run. Also, discretionary changes to the tax system were found stronger as buoyancies were generally higher than the elasticity coefficients.
Mukarram (2001) illustrated the elasticity and buoyancy of major taxes in Pakistan over the period 1981-2001. Chain Indexing Technique was used for removing the effects of discretionary changes. The study reveals that estimates of elasticity and buoyancy are higher for direct taxes followed by sales taxes. However, for relative rigidity of customs and excise duties, overall tax elasticity appeared low. Moreover, the higher coefficients of buoyancy compared to corresponding coefficients of elasticity for all the taxes, confirm that most of the revenue growth was affordable because of enhanced tax rates and broadened tax bases instead of automatic growth. In a separate study, Bilquees (2004) examined the elasticity and buoyancy of Pakistan tax system over the period 1974-75 to 2003-04. In the paper, Divisia Index method was applied to eliminate the effects of discretionary changes as required for estimating the built-inelasticity. The study found elasticity of total tax revenue both with respect to the total GDP and non-agricultural GDP base less than unity. Sales tax was identified as the most potential source to gear up overall revenue. Sales tax with respect to imports and manufacturing also compensated the loss of revenue derived from lowering of tariff and excise duties. Coefficient of income tax inclusive of withholding tax, which is an indirect tax, was found high whereas without withholding tax coefficient turns low. The coefficients of buoyancy indicated that revenue reforms did not lead to significant revenue expansion in Pakistan.
Ayoki et al (2005) found positive impacts of reforms on both direct and indirect taxes in Uganda. Tax-to-income elasticity index for direct taxes rose from 0.706 to 1.082, while for indirect taxes it moved from 1.037 to 1.306.
Kabbashi (2005) looked at the impact of trade liberalization on revenue mobilization in Sudanby using the dummy variable method. Overall, elasticity in the study indicates an index of 0.82 while divergent elasticities were found in the individual taxes: import duty - 0.83, Excise tax - 0.82, income tax - 1.26 and profit tax - 1.57. The less buoyancy and elasticity provides an explanation for the low tax efforts and the relatively low and declining government spending in Sudan.
Based on a data series of 1975/76-1984/85, Chowdhury et al. (1988) studied the buoyancy and elasticity of major tax categories in Bangladesh. The study used a regression technique, where regression equations were specified in the log linear form. It also
57
adopted proportional adjustment method to calculate elasticity for the various tax components. In the study, the value of buoyancy was found greater than unity for all the major tax heads except for taxes on domestic goods and services and its component excise duty (which is almost unitary at 0.99). The highest value of buoyancy (1.11) rested with import duties and the lowest (0.90) to taxes on domestic goods and services. An average buoyancy of 1.03 for the whole tax system indicates that if the historical pattern of discretionary changes is reproduced over the future, then for 1 per cent change of growth in GDP would result in a very marginal growth in tax revenue. All the major heads of Bangladesh tax structure excepting sales tax on import were found inelastic with respect to national income. On the other hand, all the tax bases are quite elastic with respect to national income. Hence, a very low tax yield to base elasticity of all taxes is the primary cause of low income elasticity of Bangladesh tax structure.
IV. Data Sources and Methodology
a) Data Sources
Relevant data for this study over the period 1979-80 to 2010-11 are derived from the
Annual Publication of National Board of Revenue, Bangladesh Bureau of Statistics
Yearbook, Bangladesh Bank and the Finance Division.
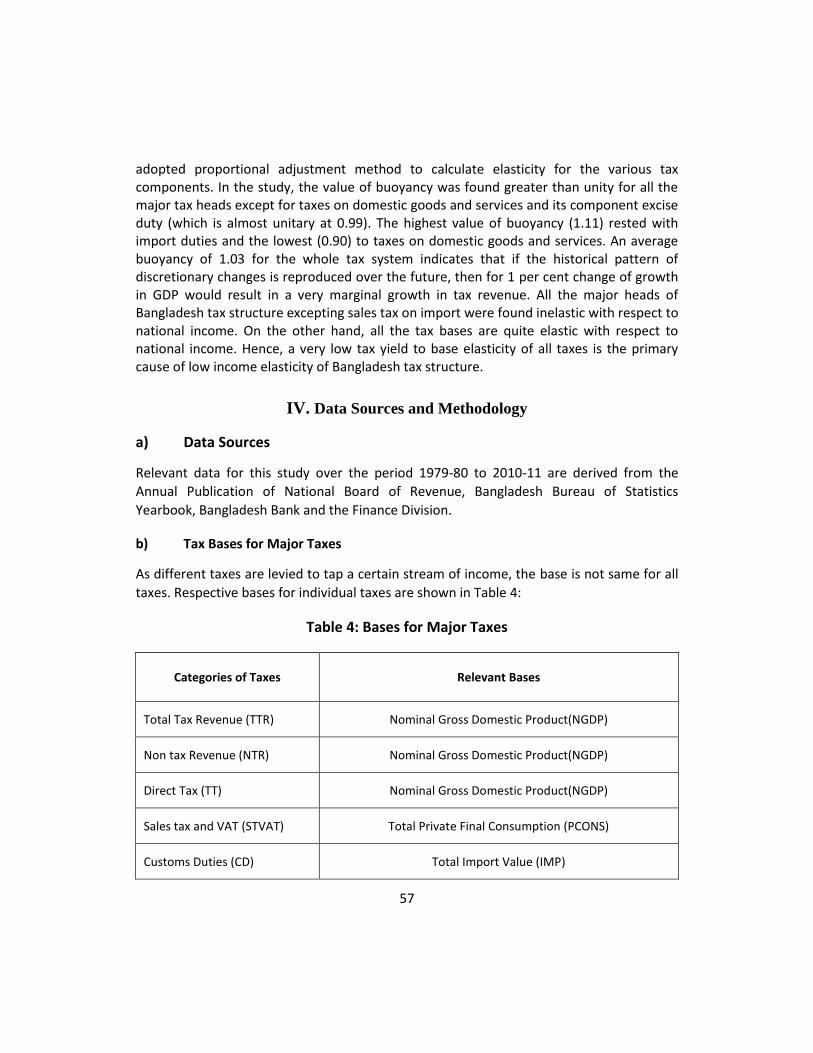
b) Tax Bases for Major Taxes
As different taxes are levied to tap a certain stream of income, the base is not same for all
taxes. Respective bases for individual taxes are shown in Table 4:
Table 4: Bases for Major Taxes
Categories of Taxes Relevant Bases
Total Tax Revenue (TTR) Nominal Gross Domestic Product(NGDP)
Non tax Revenue (NTR) Nominal Gross Domestic Product(NGDP)
Direct Tax (TT) Nominal Gross Domestic Product(NGDP)
Sales tax and VAT (STVAT) Total Private Final Consumption (PCONS)
Customs Duties (CD) Total Import Value (IMP)

58
c) Methodology
The methodology adopted in this study for estimating the elasticity of major taxes in
Bangladesh consists of the following steps:
i. To remove the effects of discretionary changes from the actual tax yields;
ii. To specify and estimate an econometric model, which correlates the series of adjusted tax revenues to relevant tax bases.
In practice, various techniques are available for removing the effects of discretionary
changes. We have used Exponential Smoothing Method and Slope Dummy approach to
address the big policy changes for eliminating the effects of Discretionary Tax Measures
(DTM) on historical Time Series Data. This method involves the adjustment of the tax yield
series by smoothing the fluctuations as to represent the tax revenues that would have
been obtained in each year if the rates applicable in the reference year had prevailed
throughout the period.
d) The Model
Johansen Co-integration technique was used to establish the long run relationship
between the variables. The empirical model can be expressed as:
ln iRT = 10 In iiTB
Elasticity = 1
iRT = Rate adjusted tax series of the ith tax
iTB = Tax base of the ith tax
I = Total Tax Revenue, Direct Taxes, Value Added Tax, Customs
Duties and Non Tax Revenue.
The method for measuring the buoyancy is simpler; the actual tax receipts have
been regressed on tax bases. In notation form this becomes:
In iAT = 10 iTB + i
iAT = Actual tax collection of the ith tax
To check whether the elasticity and buoyancy of taxes have changed in the years due to
tax reforms, the following time dummy has been included:

59
In iRT = 10 In iTB + 2 * (D * In iTB ) + i
D = in the case of total tax revenue, 1 for the year 1992 and onwards, and 0
otherwise, 1 for the year 2006 and onwards, and 0 otherwise, 1 for the year
2008 and onwards, and 0 otherwise.
= in the case of direct tax, 1 for the year 1992 and onwards, and 0 otherwise,
1 for the year 2008 and onwards, and 0 otherwise
= in the case of Customs Duties, 1 for the year 2006 and onwards, and 0
otherwise.
= in the case of Value Added Tax, 1 for the year 1992 and onwards, and 0
otherwise, 1 for the year 2006and onwards, and 0 otherwise, 1 for the year
2008 and onwards, and 0 otherwise.
e) Unit Root Test
We used Augmented Dicky Fuller (ADF) test to identify the time series properties of the
data. We found that all the variables are non-stationary at level, but they become
stationary in its first differenced form. Therefore, the variables are integrated with order
one, i.e., variables are I (1). The details of the requisite data transformation/adjustments
and the outcomes are reported in appendix IV.
f) Johansen Co-integration Test
The details of this test and the outcomes are reported in appendix V. Trace Statistics and
Max-Eigen value supports that there is 1 cointegration relationship in the tax revenue and
GDP, Direct tax and GDP, Value Added Tax and private consumption, Customs Duties and
total import value, Non tax revenue and GDP estimation equations.
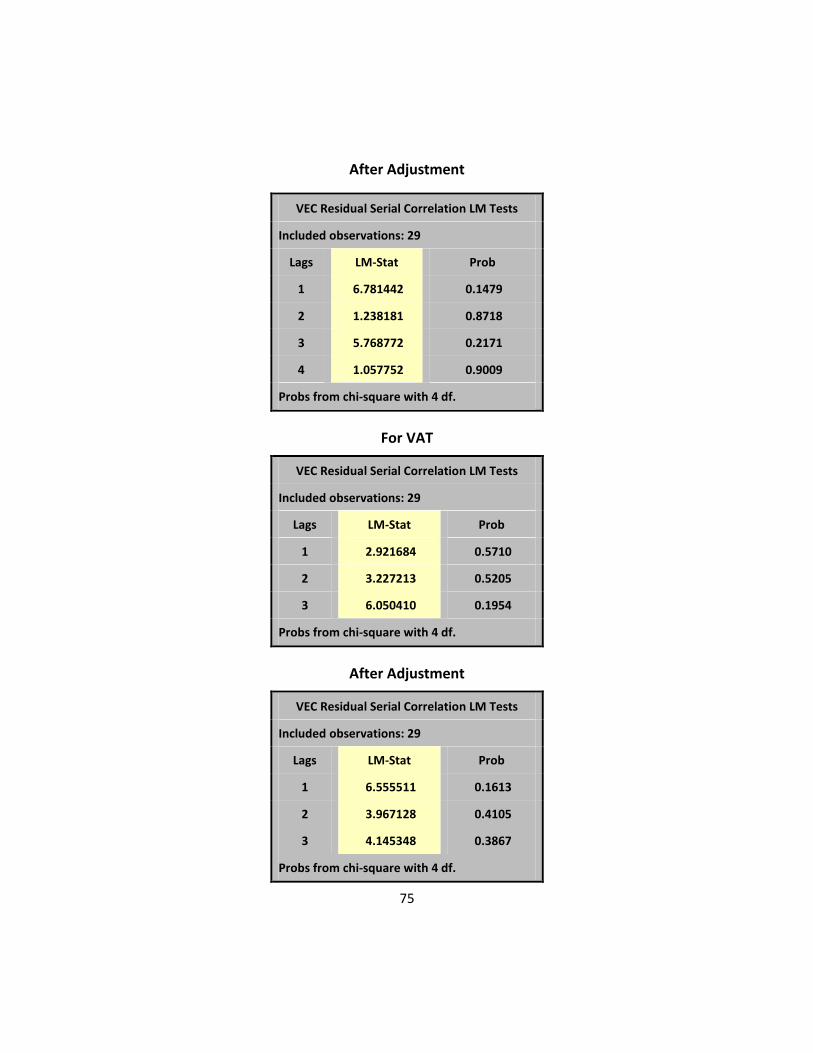
g) VEC Residual Correlation LM Test
The result of the VEC Residual Correlation LM Test may be seen in Appendix VI. It shows
that there exists no auto-correlation or serial correlation.
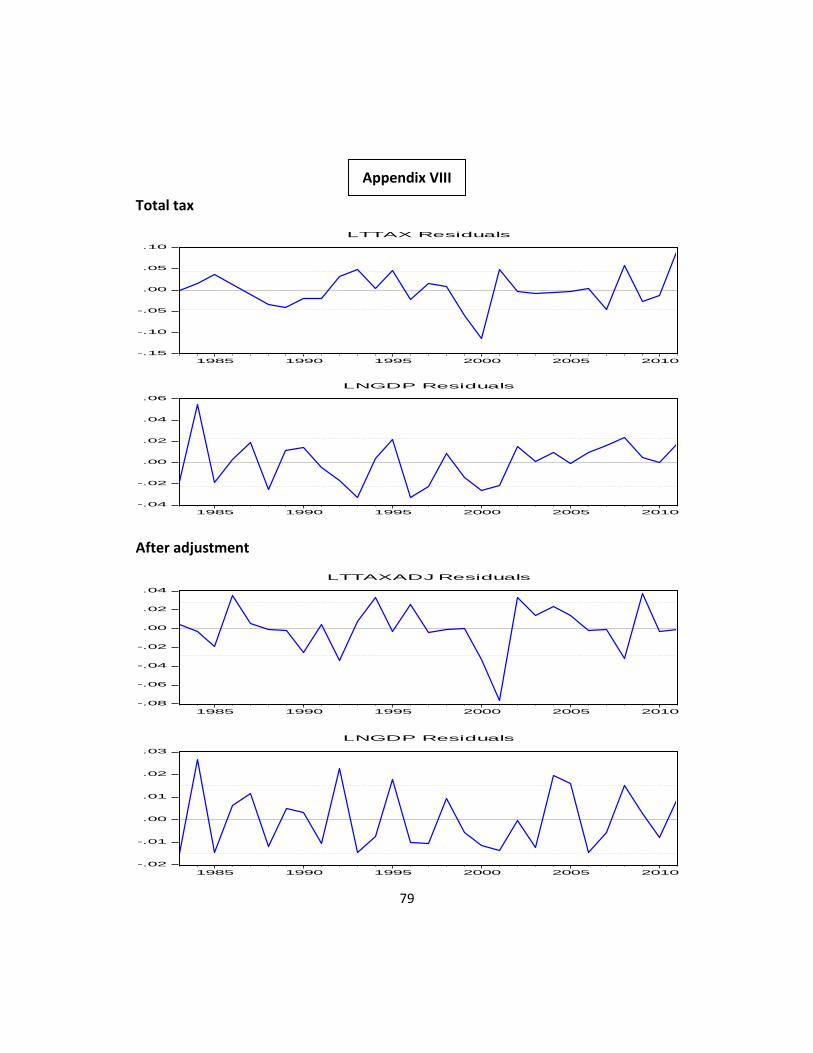
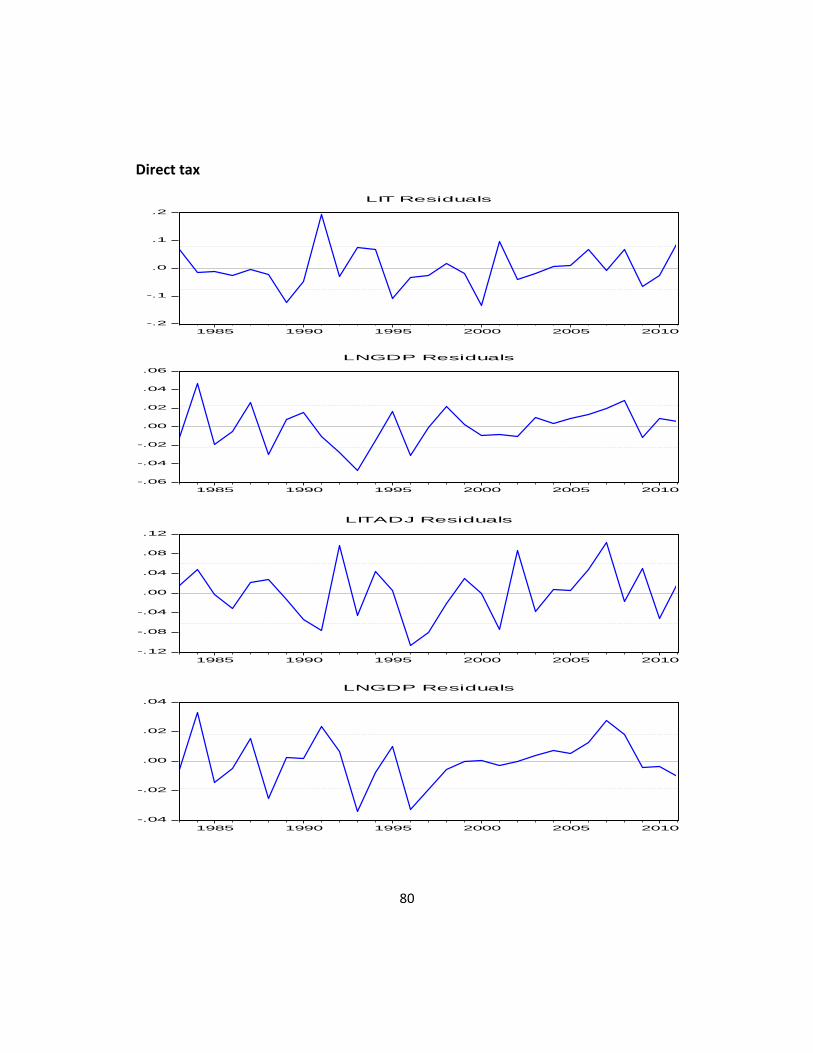
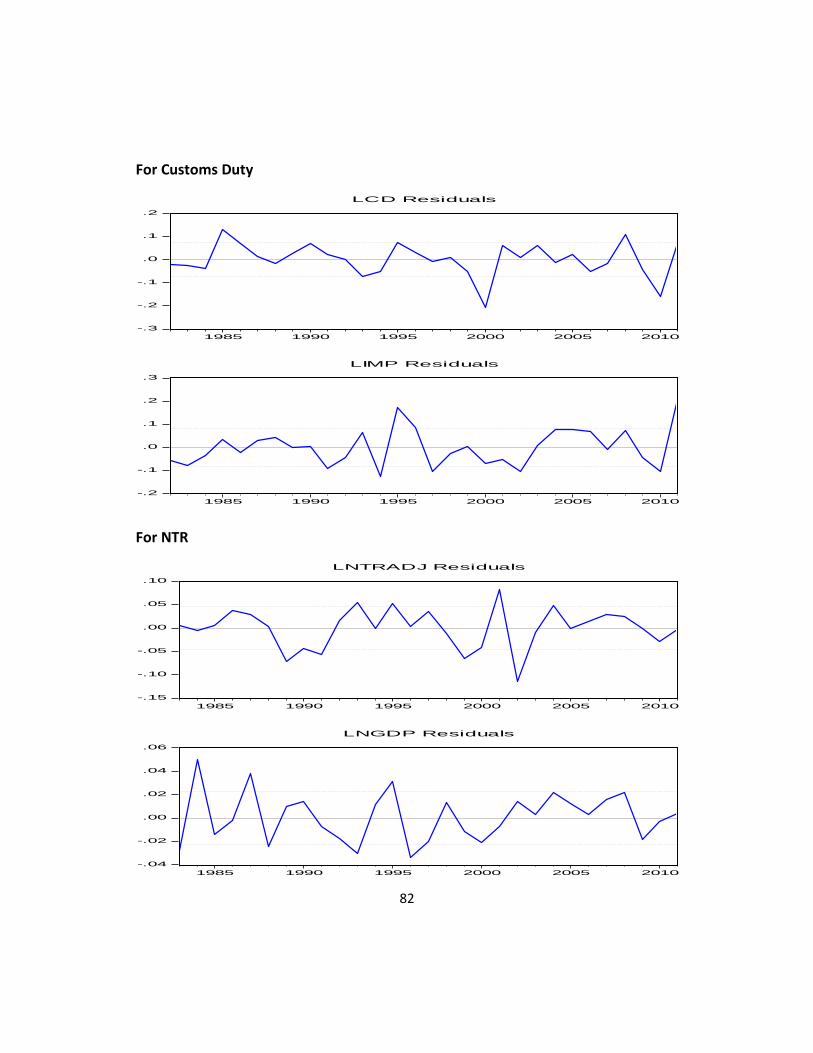
h) VEC Residual Normality Test
The Jarque-Bera statistics showed that the residuals were normally distributed and stable
as indicated by the graphs of the Residuals which may be seen in Appendix VII.

60
V. Result Analysis and Recommendations
The study finds elasticity coefficient for total tax revenue more than unity (1.14). Thus, it
rejects the null hypothesis that in the long run total tax revenue is inelastic to GDP. This
outcome is different from an earlier study by Chowdhury & Hossain(1988) where the
estimation of tax revenue showedan inelastic relationship with national income. Over the
years, sustained economic growth has certainly accelerated tax revenue earnings.
Moreover, a higher coefficient for buoyancy (1.24) refers to the fact that other than GDP,
discretionary changes had strong influences over resource mobilization from tax sources.
Since FY1979-80, tax revenue-GDP ratio has doubled, indicating that various reform
initiatives have contributed significantly to the overall tax performance.
Table 6: Results
Taxes Elasticity Buoyancy
Total Tax Revenue 1.14 (0.03 )*** 1.24 (0.01 )***
Direct Taxes 1.24 (0.06 )*** 1.48 (0.04)***
Customs Duties 0.70 (0.06 )*** 0.78 (0.01 )***
Sales Tax & Value added Tax 1.18 ( 0.06 )*** 1.28 (0.24)***
Non Tax Revenue 1.21( 0.07 )***
Note: Figures in parentheses are standard error
*** shows that coefficients are significant at 1% level
Let us now look at the disaggregated results of major tax components. Both the
coefficients of elasticity and buoyancy for Customs Duties with respect to total imports are
less than unity (0.78 and 0.70 respectively). It means despite increase in imports, revenue
was not generated accordingly. Customs Duties, both as percentage of GDP and share of
total tax revenue, have remarkably decreased over the study period. This was primarily
due to the trade liberalization and structural adjustment policy of the government. The
result further illustrates that government policy directives in the revenue reform are
progressing on the right track as the focus is now more concentrated on Direct Tax and
VAT than the Customs Duties.

61
However, the higher coefficient of buoyancy for Customs Duties as compared to the elasticity indicates that there is still room to increase revenue from the Customs Duties. Presumably, further rationalization of the tariff structure and modernization of the Customs ACT, along with the operationalization of ASYCUDA World System in all customs offices will be adding to the productivity of Customs Duties. As Trade liberalization continues to influence the growth prospects of the country positively, it is expected that increased revenue generation from other tax categories will more than offset revenue losses from Customs Duties.
Sales Tax and VAT confirms an elastic relationship with total private consumption, i.e., 1.0 percent increase in consumption is translated into 1.18 percent increase in Sales and VAT revenue. Through the years, the country’s GDP has consistently grown up. Even in the middle of global financial crisis, Bangladesh has been able to maintain considerable GDP growth. Persistent expansion in exports and remittances, the emergence of a middle class along with wide coverage of social safety networks have kept domestic demand robust throughout. Since 1999-2000, overall consumption of the country, on an average, stayed around 80 percent of GDP. Moreover, the vision of high growth promotes booming economic activities inside the country. VAT, therefore, remains as a potential source of government’s revenue.
During our study period, VAT has represented a steady share in the total tax revenue. After
the introduction of VAT in 1992, various efforts have been undertaken to maximize outlays
from this tax category. Provision of tariff value for VAT since FY1993, introduction of VAT
refund system since FY1998, compulsory registration irrespective of annual turnover since
FY2000, advance trade VAT (ATV) on commercial importers since 2004, establishment of
Customs, Excise and VAT Appellate Tribunal in 1995 and LTU-VAT with effect from 1
October 2000, and recent inclusion of a uniform 15 percent VAT rate are some of the
major initiatives that have prompted up contribution from the VAT. Nevertheless, so far
gains from VAT is still at the sub-optimum level. In our study, buoyancy for Sales tax and
VAT was estimated 1.28, which is comparatively lower than that of Income Tax.
High number of exemptions is one of the major causes behind less productivity of VAT.
VAT compliance rate is also very low (just 7 percent). Moreover, sustained economic
growth and effects of globalization have seen to the growth of myriad new types of
businesses and services, which is still beyond the reach of VAT administration. Because of
centralized structure of the VAT offices, growth centres beyond the cities cannot be
monitored. A new VAT law consistent with tax modernization plan and medium term
revenue targets now awaits the approval of the parliament. In addition, the Ministry of
Finance has already given approval to the VAT action plan and new organizational
structure of NBR. It is assumed that these initiatives will surely speed up revenue earnings
from the VAT.

62
The contribution of income tax in the total tax revenue has gradually escalated from 12.46 percent in 1979-80 to 26.59 per cent in 2010-11. Our study also establishes Income Tax as the most potential revenue source of the country. Both in terms of elasticity and buoyancy, the coefficients of Income Tax were found highest among three tax revenue categories. 1 per cent growth in GDP induces 1.24 per cent increase in income tax. Whenever discretionary changes are included, an additional 0.24 per cent income tax is generated. Various reformative steps, including introduction of ‘initial exemption limit’ (tax-base as ‘total income’), establishment of Large Tax Payer Unit, mandatory provision for Tax Identification Number (TIN) for registration of assets and business (land, vehicle etc.), provision of tax deduction at sources helped gear up revenue mobilization from the Income Tax.
There are still ample opportunities to increase revenue collection from the Income Tax. Until now, only less than one per cent of the population pays income tax. Salaried professionals and the corporate sector share most of the income and profit taxes. A large number of small and medium type businesses, services and farms manage to escape the tax net without much effort. According to the Annual Report of the National Board of Revenue (NBR), income tax earning from the ‘Large Taxpayer Unit’ (LTU) was 6291 crore Taka in FY09-10, which was also 36.85 per cent of total income tax realization for that fiscal year. The report also revealed that this amount of revenue was collected from only 0.05 per cent of total taxpayers.
Tax evasion is also enormous. TIB 2011 report discloses that loss incurred through evasion of taxes was about 34 percent of total tax collected and 3 percent of GDP in FY 2009-10. Moreover, the extensive use of exemptions, incentives and special provisions limits revenue collection in Bangladesh as the tax base is much narrower than the standard tax regime. In FY 2009-10, total revenue losses derived from tax holidays and tax exemptions (under Section 45, 46, 46A and S. O. R.) were 460.92 crore taka, being 2.7 percent of total income tax (2009-10 NBR Annual Report).
Reform has significantly contributed to the increase of revenue earnings from Income Tax and VAT. However, some areas as indicated above need special attention to enhance revenue performance of these two tax categories.
Reform activities have got renewed focus in Bangladesh in recent times. The new VAT Act has got approval from the cabinet. In the next budget session, it will be presented before the Parliament for ratification. An Alternative Dispute Resolution (ADR) mechanism is now in operation for out of court disposal of revenue litigations. Moreover, NBR has broadly outlined its reform strategies in the Modernization Plan (2011-16) which will be executed gradually. In implementing NBR Modernization plan, proper sequencing, prioritization and comprehensiveness will be very important. The study further recommends prioritized action in the following areas to expedite revenue mobilization, mostly from Income Tax and VAT:

63
Ensuring a client-friendly environment in NBR and focusing on:
simplification of forms and procedures;
clear identification of business processes where there are scopes of reducing unnecessary paper works and contacts between tax administration and taxpayers;
conveniently accessible face-to-face assisting services for the taxpayers;
Complete digitization.
To minimize tax evasion and expand tax/VAT base, important steps comprise:
Decentralization of tax/VAT offices to have institutional access to existing and evolving growth centres;
Introduction of Electronic Cash Register System in relevant business enterprises/service provider centres;
Assigning the proposed research wing in the modernization plan responsibilities for detecting sprouting businesses/services which are not yet under tax/VAT regime;
Getting secondary information instead of physical monitoring of businesses (including use of regular market surveys and intelligence gathering);
Effective operationalization of the Central Intelligence Cell (CIC) and other intelligence units.
Making a shift from the traditional subjective audit selection approach to a computer assisted intelligent audit selection approach and
Expediting the issuance of automated tax payer identification number, including links to the national identification number system.
In the study, the estimated coefficient of elasticity for NTR is 1.21 which indicates that NTR is increasing at a larger rate than the economic growth. Although a synchronized trend of growth could not be found for NTR, it remains a major source of revenue. The medium term government’s strategy is to maintain NTR, on average, at 19.3 per cent of total tax

64
revenue. At present, a lion share of NTR is coming from the profits of State Owned Enterprises (SOEs). With the improvement of SOE performance, profit of the SOEs will increase and so will NTR. Government’s efforts, therefore, need to continue emphasizing on the qualitative changes of internal management of SOEs combined with deepening external oversight. The creation of a separate SOE Wing under the Finance Division has surely strengthened supervision and monitoring of SOE activities. Administrative fee is another important source of NTR which could also be revenue enhancing provided that various prevailing rates are revised rationally. Finally, the expansion of telecommunication industries has opened up extended opportunities for revenue generation from NTR.
VI. Conclusion
The current study sheds light on the revenue performance of the country. The estimation
of elasticities and buoyancies for the major taxes and NTR identifies tax sources that have
highest revenue generating potentials. The study further indicates that with uninterrupted
economic growth and changes triggered by the discretionary measures, revenue structure
of the country experience da structural shift where the role of Income Tax and VAT has
become more prominent than that of the Customs Duties. In this context, Government
needs to design its reform programs, especially focusing on these two revenue categories.
In parallel, extended efforts could be fruitful to extract consistent revenue earnings from
the NTR, whose share in the total revenue stays around 20 per cent of GDP.

65
References
Akber, Mohammad and Ahmed, Qazi Masood (1997), “Elasticity and Buoyancy of revenues
and expenditure of Federal Government”, Pakistan Economic and Social Review, Volume
35, No. (Summer), pp. 43-56.
Gillani, Syeda Fizza (1986), “Elasticity and Buoyancy of Federal taxes in Pakistan”, The
Pakistan Development Review, Volume XXV, No.2 (Summer), pp. 163-174.
Jeetun, Azad (1978), “Buoyancy and Elasticity of taxes in Pakistan”, Research Report No. 11
(May), Applied Economics Research Centre, University of Karachi, Karachi.
Jeetun, Azad (1978), Elasticity of Income Taxes in Pakistan. An Alternative Approach,
Discussion Paper No. 27 (May). Applied Economics Research Centre, University of Karachi,
Karachi.
Jeetun, Azad (1978), Elasticity and Buoyancy of Excise Duties and Import Duties: A
Disaggregated Study, Discussion Paper No. 28 (August). Applied Economics Research
Centre, University of Karachi, Karachi.
Sury, M.M. (1985), “Buoyancy and Elasticity of union excise revenue in India: 1950-51 to
1980-81” Margin, volume 18, No. 9october), pp. 40-68.
Mansfield, charles Y. (1972) “Elasticity and Buoyancy of a tax system: A method applied to
Paraguay”, International Monetary Fund Staff Papers, Volume 19, No. 2 (July), pp. 425-46.
Prest, Alan R. (1962), “The sensitivity of the yield of personal income tax in the united
Kingdom”, The Economic Journal, Volume LXXII, No. 287 (September), pp. 576-596.

66
Appendix I
Table 1: Major Tax and Non-Tax Categories as % of GDP
Fiscal Year As % of GDP
Total Tax Income Tax Customs Duties Sales TAX & VAT Non Tax
1979-80 5.20 0.65 2.23 2.03 0.84
1980-81 5.69 0.70 2.32 2.29 1.44
1981-82 5.47 0.78 2.16 2.15 1.01
1982-83 5.23 0.80 2.13 1.95 0.82
1983-84 4.84 0.69 1.91 1.94 0.85
1984-85 5.28 0.69 2.11 2.02 1.08
1985-86 5.22 0.73 2.12 1.95 1.23
1986-87 5.31 0.76 2.12 2.00 1.13
1987-88 5.53 0.83 2.07 2.14 0.97
1988-89 5.44 0.79 2.07 2.12 1.04
1989-90 5.70 0.78 2.13 2.27 0.99
1990-91 5.96 1.02 2.15 2.30 1.27
1991-92 6.61 1.08 2.30 2.63 1.60
1992-93 7.30 1.29 2.29 2.31 1.65
1993-94 7.18 1.26 2.20 2.14 1.97
1994-95 7.42 0.97 2.40 2.38 1.79
1995-96 7.32 0.92 2.27 2.43 1.94
1996-97 7.44 0.92 2.22 2.51 1.78
1997-98 7.39 0.98 2.27 2.40 1.40
1998-99 7.17 1.07 2.16 2.31 1.39
1999-00 6.78 1.10 1.79 2.29 2.09
2000-01 7.80 1.38 2.01 2.62 1.34
2001-02 7.80 1.39 1.97 2.66 1.68
2002-03 8.22 1.41 2.22 2.69 2.05
2003-04 8.24 1.41 2.13 2.66 1.96
2004-05 8.45 1.50 2.13 2.86 2.03
2005-06 8.55 1.72 1.88 3.01 2.07
2006-07 8.27 1.85 1.73 2.96 1.87
2007-08 9.06 2.15 1.76 3.28 2.30
2008-09 8.98 2.25 1.52 3.32 1.81
2009-10 9.33 2.45 1.30 3.57 1.90
2010-11 10.49 2.79 1.37 3.90 1.68
67
Appendix II
Table 2: Major Categories of Taxes as % of Total Tax Revenue
Fiscal Year
% of Total Tax Revenue
Income Tax Customs Duties Sales Tax & VAT
1979-80 12.46 42.87 38.98
1980-81 12.38 40.81 40.28
1981-82 14.17 39.56 39.32
1982-83 15.26 40.76 37.26
1983-84 14.28 39.36 39.96
1984-85 13.00 39.87 38.34
1985-86 13.99 40.54 37.33
1986-87 14.31 39.88 37.58
1987-88 15.02 37.40 38.76
1988-89 14.57 38.08 39.04
1989-90 13.69 37.40 39.92
1990-91 17.10 36.04 38.65
1991-92 16.38 34.76 39.73
1992-93 17.62 31.41 31.62
1993-94 17.53 30.68 29.86
1994-95 13.13 32.38 32.07
1995-96 12.59 30.99 33.22
1996-97 12.38 29.83 33.76
1997-98 13.32 30.69 32.47
1998-99 14.99 30.09 32.27
1999-00 16.20 26.45 33.80
2000-01 17.70 25.79 33.65
2001-02 17.78 25.31 34.14
2002-03 17.14 27.01 32.77
2003-04 17.16 25.84 32.35
2004-05 17.80 25.26 33.85
2005-06 20.16 22.03 35.24
2006-07 22.32 20.87 35.74
2007-08 23.74 19.41 36.15
2008-09 25.11 16.98 36.94
2009-10 26.31 13.89 38.30
2010-11 26.59 13.02 37.13
68
Appendix III
Table 3: Growth of Non- Tax Revenues
Fiscal Year % Change over Previous Year
1979-80 -
1980-81 96.09923
1981-82 -20.9284
1982-83 -8.31017
1983-84 23.97967
1984-85 46.05351
1985-86 28.06816
1986-87 4.981157
1987-88 -4.884
1988-89 18.93196
1989-90 7.596494
1990-91 41.2435
1991-92 36.07955
1992-93 7.881002
1993-94 28.87228
1994-95 2.616948
1995-96 18.30766
1996-97 -0.70997
1997-98 -12.8951
1998-99 9.232656
1999-00 61.95768
2000-01 -31.2254
2001-02 34.73406
2002-03 34.29662
2003-04 5.773447
2004-05 15.81452
2005-06 14.05276
2006-07 2.719981
2007-08 41.75625
2008-09 -11.2158
2009-10 18.40496
2010-11 0.554332

69
Appendix IV
Table 5: Unit Root Test
Variable Definition of
Variables
Level 1st
difference
Constant Constant Linear trend
Constant Constant Linear trend
LTTAX Total Tax Revenue
0.23 -1.65 -6.20*** -6.12***
LTTAXADJ 1.60 -2.48 -5.54*** -5.61***
LNGDP Nominal GDP
-0.08 -2.03 2.79* 2.66
LNTR ADJ Non Tax Revenue
-0.72 -3.16 -6.56*** -6.45***
LDT Direct Tax
0.82
-0.81
-4.08***
-4.19***
LDTADJ 1.37 -2.55 -3.37** -3.64**
LVAT ST Sales Tax and VAT
0.63 -1.27 -5.80*** 6.01***
LVATSTADJ .036 -2.01 -4.16*** -4.40***
LCD Customs Duties
-2.08 -1.93 -6.62*** -7.15***
LCD ADJ -2.93** -0.66** -3.19 -3.97
Note: * shows that coefficients are significant at 10%
** shows that coefficients are significant at 5%
*** shows that coefficients are significant at 1%

70
Appendix V
Johansen Co-integration Test
Total Tax Revenue after adjustment
Hypothesized Trace 0.05
No. of CE(s) Eigenvalue Statistic Critical Value Prob.**
None * 0.722973 37.27405 15.49471 0.0000
At most 1 0.001672 0.048522 3.841466 0.8256
Hypothesized Max-Eigen 0.05
No. of CE(s) Eigenvalue Statistic Critical Value Prob.**
None * 0.722973 37.22552 14.26460 0.0000
At most 1 0.001672 0.048522 3.841466 0.8256
NTR after adjustment
Hypothesized Trace 0.05
No. of CE(s) Eigenvalue Statistic Critical Value Prob.**
None * 0.399063 20.66483 20.26184 0.0440
At most 1 0.183979 5.896156 9.164546 0.1989
Hypothesized Max-Eigen 0.05
No. of CE(s) Eigenvalue Statistic Critical Value Prob.**
None 0.399063 14.76867 15.89210 0.0744
At most 1 0.183979 5.896156 9.164546 0.1989

71
Income tax
Hypothesized Trace 0.05
No. of CE(s) Eigenvalue Statistic Critical Value Prob.**
None * 0.424963 17.54037 15.49471 0.0243
At most 1 0.050214 1.494044 3.841466 0.2216
Hypothesized Max-Eigen 0.05
No. of CE(s) Eigenvalue Statistic Critical Value Prob.**
None * 0.424963 16.04633 14.26460 0.0259
At most 1 0.050214 1.494044 3.841466 0.2216
Income tax after adjustment
Hypothesized Trace 0.05
No. of CE(s) Eigenvalue Statistic Critical Value Prob.**
None * 0.540494 23.95730 15.49471 0.0021
At most 1 0.047352 1.406780 3.841466 0.2356
Hypothesized Max-Eigen 0.05
No. of CE(s) Eigenvalue Statistic Critical Value Prob.**
None * 0.540494 22.55052 14.26460 0.0020
At most 1 0.047352 1.406780 3.841466 0.2356

72
Value added tax
Hypothesized Trace 0.05
No. of CE(s) Eigenvalue Statistic Critical Value Prob.**
None * 0.676202 35.31996 15.49471 0.0000
At most 1 0.048480 1.490852 3.841466 0.2221
Hypothesized Max-Eigen 0.05
No. of CE(s) Eigenvalue Statistic Critical Value Prob.**
None * 0.676202 33.82911 14.26460 0.0000
At most 1 0.048480 1.490852 3.841466 0.2221
Value added tax after adjustment
Hypothesized Trace 0.05
No. of CE(s) Eigenvalue Statistic Critical Value Prob.**
None * 0.486373 19.60843 15.49471 0.0113
At most 1 0.009846 0.286942 3.841466 0.5922
Hypothesized Max-Eigen 0.05
No. of CE(s) Eigenvalue Statistic Critical Value Prob.**
None * 0.486373 19.32149 14.26460 0.0073
At most 1 0.009846 0.286942 3.841466 0.5922

73
Custom duties
Hypothesized Trace 0.05
No. of CE(s) Eigenvalue Statistic Critical Value Prob.**
None * 0.608824 34.95528 20.26184 0.0002
At most 1 0.202744 6.797366 9.164546 0.1375
Hypothesized Max-Eigen 0.05
No. of CE(s) Eigenvalue Statistic Critical Value Prob.**
None * 0.608824 28.15791 15.89210 0.0004
At most 1 0.202744 6.797366 9.164546 0.1375
Custom duties after adjustment
Hypothesized Trace 0.05
No. of CE(s) Eigenvalue Statistic Critical Value Prob.**
None * 0.441509 21.02036 20.26184 0.0393
At most 1 0.111448 3.544861 9.164546 0.4841
Hypothesized Max-Eigen 0.05
No. of CE(s) Eigenvalue Statistic Critical Value Prob.**
None * 0.441509 17.47550 15.89210 0.0280
At most 1 0.111448 3.544861 9.164546 0.4841

74
Appendix VI
VEC Residual Serial Correlation LM Tests
For Total Tax
VEC Residual Serial Correlation LM Tests
Included observations: 29
Lags L5-7M-Stat Prob
1 6.864478 0.1432
2 1.063488 0.9000
3 5.292469 0.2586
Probs from chi-square with 4 df.
After Adjustment
VEC Residual Serial Correlation LM Tests
Included observations: 29
Lags LM-Stat Prob
1 8.438049 0.0768
2 3.993598 0.4069
3 11.05534 0.0259
4 8.247414 0.0829
For Income Tax
VEC Residual Serial Correlation LM Tests
Included observations: 29
Lags LM-Stat Prob
1 4.240463 0.3744
2 3.123566 0.5374
3 4.202810 0.3793
4 10.03538 0.0398
Probs from chi-square with 4 df.
75
After Adjustment
VEC Residual Serial Correlation LM Tests
Included observations: 29
Lags LM-Stat Prob
1 6.781442 0.1479
2 1.238181 0.8718
3 5.768772 0.2171
4 1.057752 0.9009
Probs from chi-square with 4 df.
For VAT
VEC Residual Serial Correlation LM Tests
Included observations: 29
Lags LM-Stat Prob
1 2.921684 0.5710
2 3.227213 0.5205
3 6.050410 0.1954
Probs from chi-square with 4 df.
After Adjustment
VEC Residual Serial Correlation LM Tests
Included observations: 29
Lags LM-Stat Prob
1 6.555511 0.1613
2 3.967128 0.4105
3 4.145348 0.3867
Probs from chi-square with 4 df.

76
For Customs Duties
VEC Residual Serial Correlation LM Tests
Null Hypothesis: no serial correlation at lag order h
Date: 04/24/12 Time: 12:50
Sample: 1980 2011
Included observations: 30
Lags LM-Stat Prob
1 3.976531 0.4092
2 4.878826 0.3000
Probs from chi-square with 4 df.
Customs Duties after Adjustment
VEC Residual Serial Correlation LM Tests
Included observations: 30
Lags LM-Stat Prob
1 3.434029 0.4880
2 7.656348 0.1050
Probs from chi-square with 4 df.
NTR
VEC Residual Serial Correlation LM Tests
Null Hypothesis: no serial correlation at lag order h
Date: 04/25/12 Time: 11:42
Sample: 1980 2011
Included observations: 29
Lags LM-Stat Prob
1 7.684454 0.1038
2 2.438107 0.6558
3 4.389899 0.3558
4 4.034999 0.4013
Probs from chi-square with 4 df.

77
Appendix VII
VEC Residual Normality Test
Total Tax
Component Jarque-Bera df Prob.
1 1.680949 2 0.4315
2 0.143365 2 0.9308
Joint 1.824314 4 0.7680
Component Jarque-Bera df Prob.
1 7.621635 2 0.0221
2 2.711364 2 0.2578
Joint 10.33300 4 0.0352
Direct tax
VEC Residual Normality Test
Component Jarque-Bera df Prob.
1 1.519443 2 0.4678
2 0.040939 2 0.9797
Joint 1.560382 4 0.8159
After adjustment
Component Jarque-Bera df Prob.
1 0.342762 2 0.8425
2 0.040187 2 0.9801
Joint 0.382948 4 0.9838

78
VAT
Component Jarque-Bera df Prob.
1 0.367514 2 0.8321
2 0.315426 2 0.8541
Joint 0.682939 4 0.9534
After adjustment
Component Jarque-Bera df Prob.
1 0.325034 2 0.8500
2 1.373358 2 0.5032
Joint 1.698392 4 0.7910
Customs duties
Component Jarque-Bera df Prob.
1 5.683288 2 0.0583
2 1.421218 2 0.4913
Joint 7.104506 4 0.1305
After adjustment
Component Jarque-Bera df Prob.
1 0.781024 2 0.6767
2 0.674028 2 0.7139
Joint 1.455052 4 0.8346
NTR
Component Jarque-Bera df Prob.
1 1.982493 2 0.3711
2 0.760605 2 0.6837
Joint 2.743098 4 0.6017
79
Total tax
After adjustment
-.15
-.10
-.05
.00
.05
.10
1985 1990 1995 2000 2005 2010
LTTAX Residuals
-.04
-.02
.00
.02
.04
.06
1985 1990 1995 2000 2005 2010
LNGDP Residuals
-.08
-.06
-.04
-.02
.00
.02
.04
1985 1990 1995 2000 2005 2010
LTTAXADJ Residuals
-.02
-.01
.00
.01
.02
.03
1985 1990 1995 2000 2005 2010
LNGDP Residuals
Appendix VIII
80
Direct tax
-.2
-.1
.0
.1
.2
1985 1990 1995 2000 2005 2010
LIT Residuals
-.06
-.04
-.02
.00
.02
.04
.06
1985 1990 1995 2000 2005 2010
LNGDP Residuals
-.12
-.08
-.04
.00
.04
.08
.12
1985 1990 1995 2000 2005 2010
LITADJ Residuals
-.04
-.02
.00
.02
.04
1985 1990 1995 2000 2005 2010
LNGDP Residuals

81
VAT
After adjustment
-.12
-.08
-.04
.00
.04
.08
.12
1985 1990 1995 2000 2005 2010
LVATST Residuals
-.06
-.04
-.02
.00
.02
.04
.06
1985 1990 1995 2000 2005 2010
LPCONS Residuals
-.08
-.04
.00
.04
.08
1985 1990 1995 2000 2005 2010
LVATSTADJ Residuals
-.04
-.02
.00
.02
.04
.06
1985 1990 1995 2000 2005 2010
LPCONS Residuals
82
For Customs Duty
For NTR
-.3
-.2
-.1
.0
.1
.2
1985 1990 1995 2000 2005 2010
LCD Residuals
-.2
-.1
.0
.1
.2
.3
1985 1990 1995 2000 2005 2010
LIMP Residuals
-.15
-.10
-.05
.00
.05
.10
1985 1990 1995 2000 2005 2010
LNTRADJ Residuals
-.04
-.02
.00
.02
.04
.06
1985 1990 1995 2000 2005 2010
LNGDP Residuals