Tax Statistics – Highlights Stats/Tax... · Tax revenue collections, GDP and CAGR, 2013/14 -...
46
National Treasury Department: REPUBLIC OF SOUTH AFRICA national treasury 2018 Tax Statistics – Highlights A joint publication between National Treasury and the South African Revenue Service ISBN: 978-0-621-46927-1
Transcript of Tax Statistics – Highlights Stats/Tax... · Tax revenue collections, GDP and CAGR, 2013/14 -...

National TreasuryDepartment:
REPUBLIC OF SOUTH AFRICA
national treasury
2018Tax Statistics – Highlights
A joint publication between National Treasury and the South African Revenue Service
ISBN: 978-0-621-46927-1

2018 Tax StatisticsII
Highlights
The 2018 Tax Statistics publication is compiled with the latest available data from the South African Revenue Service (SARS) and National Treasury. Some of the
data may be incomplete and subject to revision in later editions.
Published by National Treasury and SARS
To obtain copies please contact:
ECONOMIC TAX ANALYSIS CHIEF DIRECTORATENational TreasuryPrivate Bag X115Pretoria0001South AfricaTel: +27 12 315 5111Fax: +27 12 315 5516email: [email protected]://www.treasury.gov.za/publications/tax%20statistics/default.aspx
TAX, CUSTOMS AND EXCISE INSTITUTESouth African Revenue ServicePrivate Bag X923Pretoria0001South AfricaTel: +27 12 422 6554email: [email protected]/about/sataxsystem/pages/tax-statistics.aspx
December 2018

12018 Tax Statistics
Highlights
BOUT THIS PUBLICATION
The 2018 edition of the Tax Statistics publication provides an overview of tax revenue collections and tax return information for the 2014 to 2017 tax years as well as the 2013/14 to 2017/18 fiscal years.
The objective of this publication is to present comprehensive tax revenue data in a manner that will complement and help contextualise economic and demographic data provided by other publications. It contains more detailed and varied tax revenue data that complements publications such as the National Treasury’s Budget Reviews and SARS’ Annual Reports. It contains more detailed and varied tax revenue data that complements publications such as the National Treasury’s Budget Reviews and SARS’ Annual Reports. The aim is to improve and expand on the data made available in the Tax Statistics. The publication is available for download at the websites of the South African Revenue Service (SARS) (www.sars.gov.za/About/SATaxSystem/Pages/Tax-Statistics.aspx) and that of National Treasury (www.treasury.gov.za/publications/ tax%20statistics).
We welcome comments and suggestions that would enhance the value of the publication for policy evaluation and provide further insights into South Africa’s social and economic contexts. Please email such comments and suggestions to [email protected].
A
2018 Tax Statistics2
Highlights

32018 Tax Statistics
Highlights
CHAPTER 1: REVENUE COLLECTIONS
• This chapter provides a summary of aggregate revenue collections trends for the period 2013/14 to 2017/18.
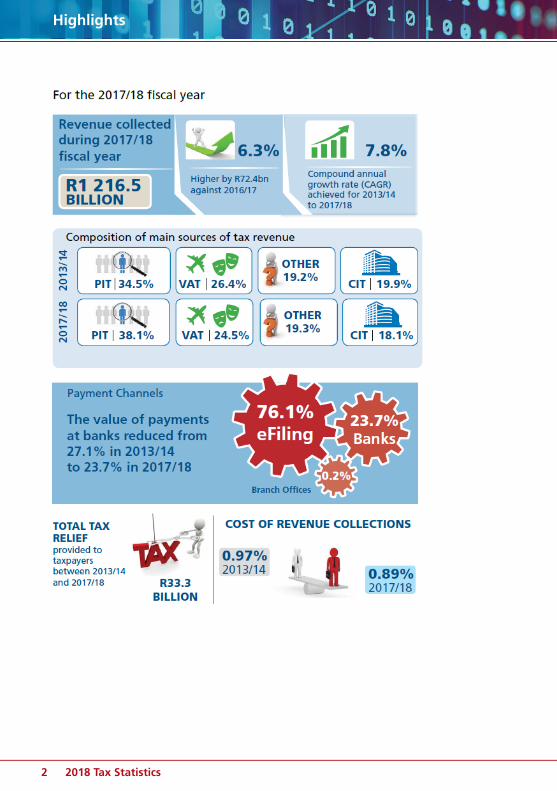
In the 2017/18 fiscal year: • Tax revenue collected amounted to R1 216.5 billion, growing year-on-
year by R72.4 billion (6.3%), mainly supported by Personal Income Tax (PIT) which grew by R37.0 billion (8.7%);
• The number of individuals registered for Income Tax increased to 21.0 million on 31 March 2018 from 20.0 million in the previous year;
• On 31 March 2018 there were 3.1 million registered companies and 773 7835 registered Value-Added Tax (VAT) vendors of which 434 981 (56.2%) were active; and
• Despite a continuation of tough economic conditions which saw a small increase in GDP growth from 1.0% in 2016/17 to 1.3%1, the Tax-to-GDP ratio increased from 25.5% in 2014/15 to 25.9% in 2015/16 and 2016/17, before decreasing slightly to 25.8% in 2017/18.
SARS continues to broaden the tax base and expand its taxpayer and trader register through the pillars of the compliance model, namely: education, service and enforcement programmes. The growth of the tax register is influenced by socio-economic conditions, tax policy and legislative amendments. SARS has increased registration compliance by introducing bulk registration at places of employment and providing an online facility that enables employers to register staff when submitting their monthly Pay-As-You-Earn (PAYE) returns.
1 As announced in the Medium Term Budget Policy Statement, 2018

2018 Tax Statistics4
Highlights
Tax register, 31 March 2014 – 31 March 2018
National budget revenue includes all revenue streams into the fiscus, both tax revenue and non-tax revenue. However this is reduced by payments made to Botswana, eSwatini, Lesotho and, Namibia (BELN) in terms of the Southern African Customs Union (SACU) agreement.
Consolidated revenue also includes revenue collected by the provinces and selected public entities as well as social security contributions. In addition to tax revenue, SARS collects Mineral and Petroleum Resources Royalties (MPRR) as well as Mining Leases and Ownership which are included in non-tax revenue. SARS also collects revenue on behalf of the Road Accident Fund (RAF) and the Unemployment Insurance Fund (UIF).

52018 Tax Statistics
Highlights
Total budget revenue and consolidated revenue, 2013/14 – 2017/18
The South African Tax-to-GDP ratio showed a general upward trend during the past 22 years from a low of 22.6% in 1996/97 to 25.8% in 2017/18.
Tax revenue collections, GDP and CAGR, 2013/14 - 2017/18
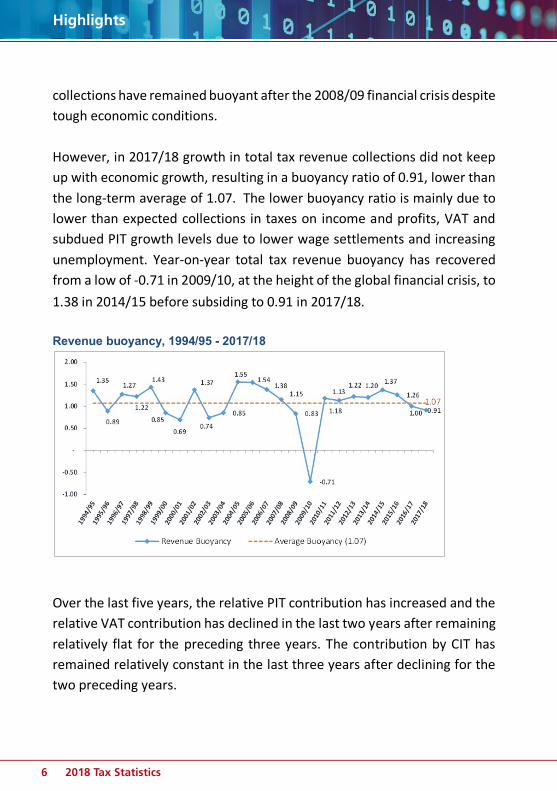
An important indicator of tax revenue performance is the tax buoyancy ratio. This indicator measures the sensitivity of tax revenues to changes in economic growth. A buoyancy ratio greater than unity (one) over the long-term supports the sustainability of fiscal policy. South African tax revenue
2018 Tax Statistics6
Highlights
collections have remained buoyant after the 2008/09 financial crisis despite tough economic conditions. However, in 2017/18 growth in total tax revenue collections did not keep up with economic growth, resulting in a buoyancy ratio of 0.91, lower than the long-term average of 1.07. The lower buoyancy ratio is mainly due to lower than expected collections in taxes on income and profits, VAT and subdued PIT growth levels due to lower wage settlements and increasing unemployment. Year-on-year total tax revenue buoyancy has recovered from a low of -0.71 in 2009/10, at the height of the global financial crisis, to 1.38 in 2014/15 before subsiding to 0.91 in 2017/18. Revenue buoyancy, 1994/95 - 2017/18
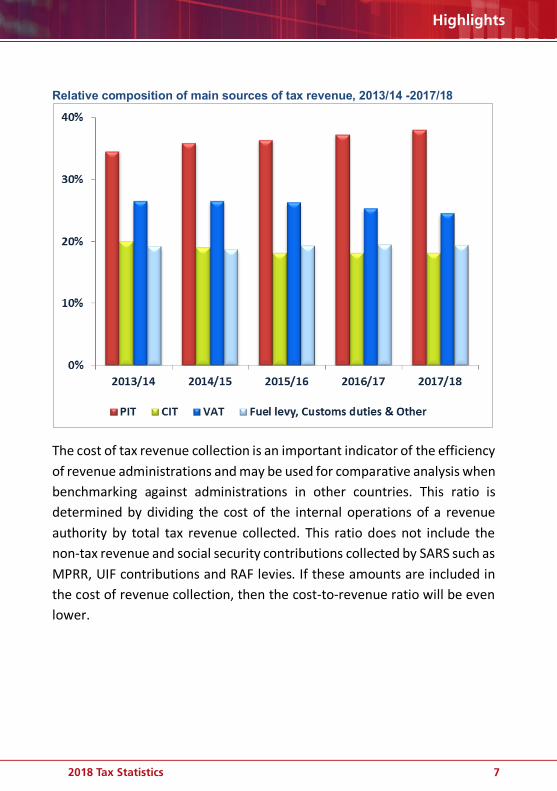
Over the last five years, the relative PIT contribution has increased and the relative VAT contribution has declined in the last two years after remaining relatively flat for the preceding three years. The contribution by CIT has remained relatively constant in the last three years after declining for the two preceding years.
72018 Tax Statistics
Highlights
Relative composition of main sources of tax revenue, 2013/14 -2017/18
The cost of tax revenue collection is an important indicator of the efficiency of revenue administrations and may be used for comparative analysis when benchmarking against administrations in other countries. This ratio is determined by dividing the cost of the internal operations of a revenue authority by total tax revenue collected. This ratio does not include the non-tax revenue and social security contributions collected by SARS such as MPRR, UIF contributions and RAF levies. If these amounts are included in the cost of revenue collection, then the cost-to-revenue ratio will be even lower.
2018 Tax Statistics8
Highlights
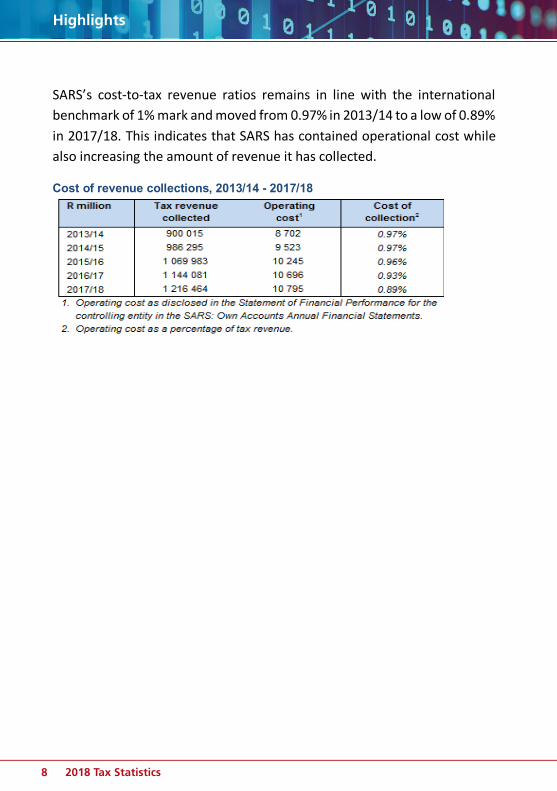
SARS’s cost-to-tax revenue ratios remains in line with the international benchmark of 1% mark and moved from 0.97% in 2013/14 to a low of 0.89% in 2017/18. This indicates that SARS has contained operational cost while also increasing the amount of revenue it has collected.
Cost of revenue collections, 2013/14 - 2017/18

92018 Tax Statistics
Highlights

2018 Tax Statistics10
Highlights
Chapter3:Corporateincometax

112018 Tax Statistics
Highlights
Chapter 3: Corporate income tax
CHAPTER 2: PERSONAL INCOME TAX This chapter gives an overview of Personal Income Tax (PIT) revenues of registered individual taxpayers. It also provides information on assessed individual taxpayers, taxable income and tax assessed by taxable income group, sector, province, age, gender and source of income, as well as fringe benefits, allowances and deductions.
The Budget presented in February 2016 included the following proposals that had a potential impact on the 2017 tax year: • An increase in the threshold for the top PIT bracket to R701 300; • Increases of 11.8%, 9.7% and 9.6% respectively in the primary,
secondary and tertiary rebates to R13 500, R7 407 and R2 466 respectively. This increased the tax thresholds for taxpayers below the age of 65 to R75 000, for those 65-74 years to R116 150 and 75 years and older to R129 850;
• SARS received more than 18.0 million employees' tax certificates (IRP5s) that could be linked to just over 12.7 million individuals.
Data shows the distribution of assessed individual taxpayers, taxable income and tax assessed across major taxable income groups. The table shows that for 2017, 72.8% of the assessed individual taxpayers had a taxable income below R350 000, i.e. most of the taxpayers fell below the return submission threshold. These taxpayers earned 38.6% of the total taxable income and contributed 19.2% of the tax assessed. A further 12.8% of the taxpayer earned between R35 001 and R500 000 in 2017 and were liable for 15.2% of the tax assessed.

2018 Tax Statistics12
Highlights
Chapter3:Corporateincometax
Distribution of assessed individual taxpayers in taxable income group, 2017
The tax burden aggregated across all taxpayers, as indicated by the tax assessed as a percentage of taxable income, remained fairly stable at around 20% for the period under review. This indicates the effectiveness of using tax relief to combat fiscal drag. The extent of tax relief, including “fiscal drag relief”, illustrates the impact of tax relief over a period of 22 years. (1) An individual with taxable income of R100 000 in 1995 (2) was paying tax at an effective tax rate of 33.8%. (3) If the taxpayer’s taxable income had only kept pace with inflation (4) the effective tax rate would have increased to 40.5% in 2017 if there had been no adjustments to the income tax brackets. The impact of the actual tax rate adjustments from 1995 for the same example (5) lowers the effective tax rate to only 19.0%. Note that real tax relief occurred in the period 2000 to 2010 after broadening of the taxable income base.

132018 Tax Statistics
Highlights
Chapter 3: Corporate income tax
Example of tax relief granted to an individual with taxable income of R100 000 in 1995
The table below page illustrates the distribution of income and the granting of deductions in income groups (rather than taxable income groups). The largest portion of the R76.5 billion allowed as deductions in 2015 was granted to taxpayers in the R500 000 + income bracket. Of their income, 6.1% was granted as a deduction.

2018 Tax Statistics14
Highlights
Chapter3:Corporateincometax
Assessed taxpayers by income group, deductions granted & taxable income, 2017
There are many taxpayers currently submitting returns who are below the compulsory submission threshold. These taxpayers are therefore not liable to submit a return but they may still elect to submit a return, possibly to recover allowed deductions. The number of returns expected to be submitted is therefore a more prudent gauge of the proportion of returns that are likely to be received by SARS.
Expected submission counts for each tax year now include all taxpayers who have been assessed for a tax year as well as taxpayers with an “active” status who were assessed in any of the two previous years but who do not have an assessment for the tax year in question.
Number of individual taxpayers, 2014 – 2017
2014 5 991 934 1 400 976 233 810 273 841 45 702 19.5%
2015 5 672 322 1 516 303 267 316 301 014 53 067 19.9%
2016 5 365 552 1 566 428 291 942 321 732 59 962 20.5%
2017 4 898 565 1 546 811 315 768 321 353 65 601 20.8%
Tax assessed as % of taxable
incomeTax year
Number of taxpayers assessed
Taxable income
(R million)
Average taxable income
(R)
Tax assessed
(R million)
Average tax assessed
(R)

152018 Tax Statistics
Highlights
Chapter 3: Corporate income tax
To track the fluctuations in taxable income of taxpayers over a 10 year tax period, all taxpayers who were assessed every year since 2005, were isolated and their taxable income and assessed tax analysed.
The average taxable income of taxpayers who have been assessed every year since 2007, increased by a compound annual growth rate of 11.2%. There were 4 318 512 taxpayers assessed in 2007. Of these, 2 522 436 taxpayers (58.4%) had been assessed for each of the subsequent nine years (2008 to 2016).
The graph below shows how taxpayers shifted across the tax brackets due to increases in taxable income.
Proportion of the 2.2 million 10 year taxpayers by marginal tax rates, 2007 - 2016
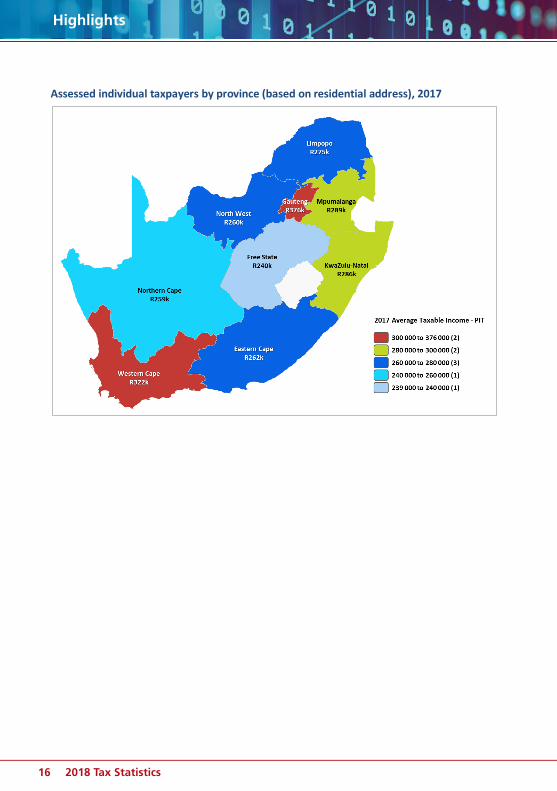
The distribution of taxpayers, taxable income and tax assessed by province and municipality, is determined using the residential address declared by taxpayers on their returns. The analysis of the assessments by municipality shows that most assessed taxpayers are based in Gauteng and they also have the highest average taxable income at R375 996 while the Free State indicates the lowest average taxable income at R239 741.
2018 Tax Statistics16
Highlights
Chapter3:Corporateincometax
Assessed individual taxpayers by province (based on residential address), 2017

172018 Tax Statistics
Highlights

2018 Tax Statistics18
Highlights

192018 Tax Statistics
Highlights
CHAPTER 3: COMPANY INCOME TAX
This chapter is an overview of Company Income Tax (CIT) revenues. It provides information on provisional payments, assessed companies taxable income and tax assessed by taxable income group, sector and assessed losses. It also provides information on Small Business Corporations (SBCs).
Analysis of Company Income Tax (CIT) returns assessed for the 2016 tax year and CIT collections in the 2017/18 fiscal year shows:
• At 18.1%, CIT has remained in 2017/18 the third largest contributor to total tax revenue collected. This is well below the peak of 26.7% achieved prior to the 2008/09 global financial crisis. The 2008/09 standout performance was driven mainly by elevated levels in the global demand for commodities in the prior years as well as by high commodity prices in 2008/09. The effects of the recession on CIT collections were felt in 2009/10 as the effects of lower corporate profits filtered through;
• Just over 24.2% of the 768687 companies assessed as at 30 June 2018 for tax year 2016 had positive taxable income. A further 48.3% had taxable income equal to zero and the remaining 27.5% reported an assessed loss;
• The concentrated nature of the South African economy is evident as only 370 large companies (0.2% of the companies with positive taxable income) had taxable income of more than R200 million and were liable for 58.6% of the CIT assessed for this subgroup;
• The Financial intermediation, insurance, real-estate and business services sector accounted for 189 066 (24.6%) of the assessed companies and was liable for 39.6% of the CIT assessed, contributing the most of all sectors;
2018 Tax Statistics20
Highlights
• There were over 3.7million companies registered for CIT as at 31March2017. Of these, 993 069 companies were expected to submit income tax returns for the tax year 2016;
• As at 30 June 2018, 768 687 companies had been assessed for the 2016 tax year, with 143 768 being assessed as Small Business Corporations (SBCs), taxed at the applicable graduated income tax rates, and the remainder taxed at the fixed company tax rate of 28%; and
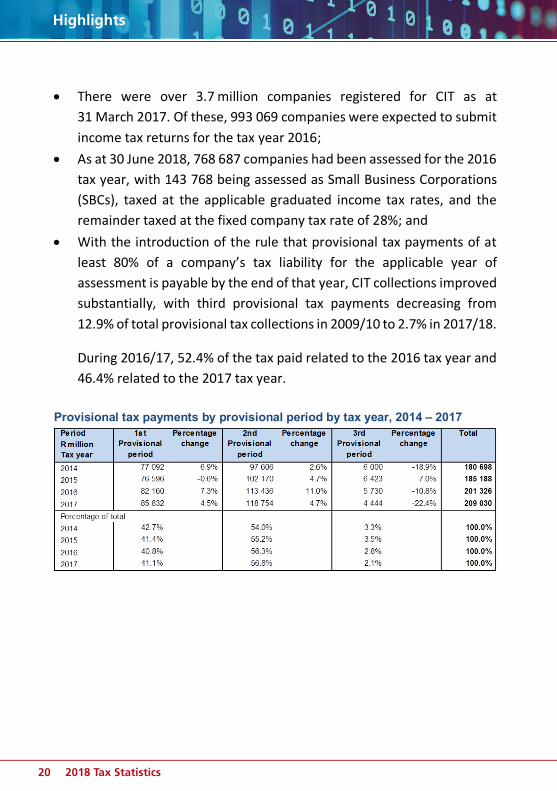
• With the introduction of the rule that provisional tax payments of at least 80% of a company’s tax liability for the applicable year of assessment is payable by the end of that year, CIT collections improved substantially, with third provisional tax payments decreasing from 12.9% of total provisional tax collections in 2009/10 to 2.7% in 2017/18.
During 2016/17, 52.4% of the tax paid related to the 2016 tax year and 46.4% related to the 2017 tax year.
Provisional tax payments by provisional period by tax year, 2014 – 2017

212018 Tax Statistics
Highlights
Provisional tax payments by companies financial year end, 2016
The value of provisional tax collections for previous tax years (2014 to 2016 tax years) have been close to 100% of the value of the final liability as reflected in issued assessments. Provisional tax collections for a specific tax year are known by SARS well before assessments for a specific tax year are raised and this enables extrapolations of tax collections and resulting analysis that are more reliable. Tax assessed as a percentage of provisional tax payments received for a relevant tax year is, therefore, a good gauge of the completeness of the issued assessments.
2018 Tax Statistics22
Highlights
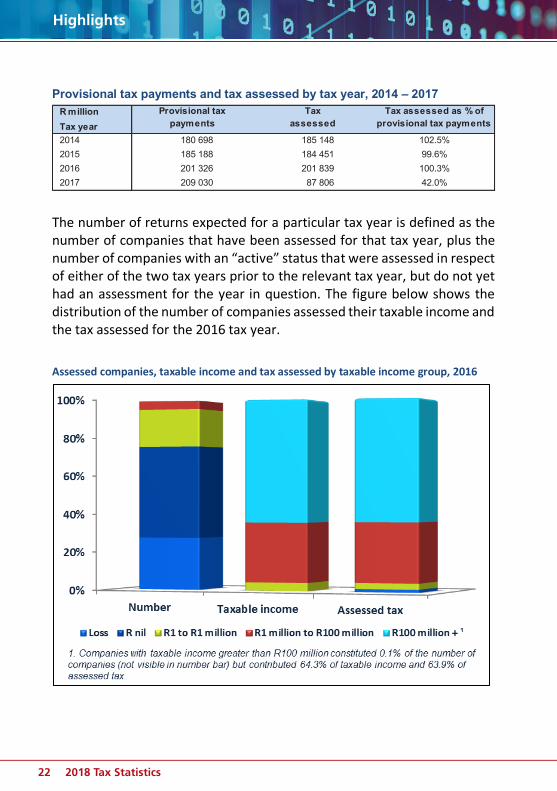
Provisional tax payments and tax assessed by tax year, 2014 – 2017
The number of returns expected for a particular tax year is defined as the number of companies that have been assessed for that tax year, plus the number of companies with an “active” status that were assessed in respect of either of the two tax years prior to the relevant tax year, but do not yet had an assessment for the year in question. The figure below shows the distribution of the number of companies assessed their taxable income and the tax assessed for the 2016 tax year. Assessed companies, taxable income and tax assessed by taxable income group, 2016
R millionTax year2014 180 698 185 148 102.5%2015 185 188 184 451 99.6%2016 201 326 201 839 100.3%2017 209 030 87 806 42.0%
Provisional tax payments
Tax assessed
Tax assessed as % of provisional tax payments

232018 Tax Statistics
Highlights
Distribution by sector
The Financial intermediation, insurance, real-estate & business services was the sector, with the highest number of taxpayers (24.6% assessed) in respect of the 2016 tax year. This sector accounted for 39.6% of the tax assessed in respect of 2016.
Companies’ tax assessed by economic activity, 2016
Small Business Corporations (SBCs)
Small business corporations (SBCs) with a gross income of not more than R20 million for a particular year of assessment qualify for a special tax dispensation in the form of graduated income tax rates instead of the fixed rate. SBCs benefit from graduated income tax rates (progressive taxation) rather than the fixed tax rate of 28%.

2018 Tax Statistics24
Highlights
The table below shows the increase in the SBC taxable income brackets from the 2014 to the 2017 tax years. The threshold of the first SBC bracket increased by 11.8% from R67 111 in respect of tax year 2014 to R75 000 for the 2017 tax year.
SBCs can also immediately write-off all plant or machinery used in a process of manufacture and are eligible for an accelerated write-off of certain other depreciable assets (at a rate of 50%, 30% and 20%).
Small Business Corporations’ tax rates, 2014 and 2017
In any calendar year, SBCs could be taxed by applying two different tax year rates. In 2016 they could be taxed on either 2015/2016 tax rates or 2016/2017 tax rates. This would occur because:
• 2015/2016 tax rates (rates in effect from 1 April 2015 to 31 March 2016) are applicable to SBCs with years of assessment ending between 1 January 2016 and 31 March 2016; and
• 2016/2017 tax rates (rates in effect from 1 April 2016 to 31 March 2017) are applicable to SBCs with years of assessment ending between 1 April 2016 and 31 December 2016.
0 – 67 111 0% 0 – 75 000 0% 11.8%
67 112 – 365 000 7% 75 001 – 365 000 7% –
365 001 – 550 000 21% 365 001 – 550 000 21% – 550 001 – and over 28% 550 001 – and over 28% –
Taxable income brackets
Percentage increase in
bracket
Tax year SBC rate for 2017
SBC rate for 2014
2014 2017
Rand Rand

252018 Tax Statistics
Highlights

2018 Tax Statistics26
Highlights
Chapter3:Corporateincometax
272018 Tax Statistics
Highlights
Chapter 3: Corporate income tax
CHAPTER 4: VALUE-ADDED TAX This chapter gives an overview of Value-Added Tax (VAT) and provides a breakdown of VAT payments and refunds by sector, payment category and type of enterprise. It also includes data on input and output tax as derived from VAT returns submitted by vendors as well as a distribution of VAT vendors by turnover group.
In the 2017/18 fiscal year:
• Net VAT collections totalled R298.0 billion and grew by 3.1% compared to the previous year. Domestic VAT, which amounted to R336.3 billion and grew by 4.6%, was the key driver for the aggregate growth in net VAT. This growth was moderated by the collection of R152.8 billion in Import VAT which grew by only 2.4% compared to the prior year and VAT refunds which totalled R191.1 billion and grew by 5.2%;
• The subdued household consumption expenditure curtailed the growth in Domestic VAT payments. Consumption was constrained by low consumer confidence and high debt levels, high costs of servicing debt as well as slow growth in employment. The main sectors that contributed to nominal Domestic VAT growth were Financial intermediation, insurance, real estate & business services; Manufacturing and Wholesale and retail trade, catering and accommodation;
• VAT refunds increased the most in the Mining & quarrying; Manufacturing; as well as Agriculture, forestry & fishing sectors; and

2018 Tax Statistics28
Highlights
Chapter3:Corporateincometax
• As at 31 March 2018, there were 773 783 registered vendors, of which 434 981 (56.2%) were active. A vendor is regarded as active if a VAT payment was received from or a VAT refund was made to the vendor during the fiscal year.
• The number of vendors registered for VAT has been steadily increasing since 2014/15. Slight increases in the number of active vendors were recorded since 2015/16. A vendor is regarded as active if a payment was received from or a refund made to the vendor during the fiscal year, regardless of the registration status. In 2017/18, there were 773 783 registered VAT vendors of which 434 981 were active.
Number of registered VAT vendors, 2014/15 -2017/18
• The Financial intermediation, insurance, real estate & business services sector contributed R142.0 billion (42.1%) to Domestic VAT in 2017/18, the largest contribution among all sectors. This sector received the second largest proportion of VAT refunds for the year amounting to R37.3 billion(19.6%).
• The Mining & quarrying sector had the second lowest number of active vendors at only 0.7% in 2017/18 and contributed R10.9 billion (3.2%) of the total Domestic VAT payments during the period. However, these vendors received the largest proportion of VAT refunds, namely R39.8 billion (20.9%). The large volume of zero-rated mineral exports makes the Mining & quarrying sector a negative contributor to net VAT.
2014/15 679 274 2.6% 420 940 -0.9% 62.0%
2015/16 706 874 4.1% 425 225 1.0% 60.2%
2016/17 742 388 5.0% 432 072 1.6% 58.2%
2017/18 773 783 4.2% 434 981 0.7% 56.2%1.
Active percentage of register
As per register at 31 March of each year. Excludes coded cases where status is in suspense or estate oraddress unknown.
Percentage growth ratesFiscal year
Registered1 Percentage growth rates
Active vendors

292018 Tax Statistics
Highlights
Chapter 3: Corporate income tax
VAT payments by economic activity, 2017/18
VAT refunds by economic activity, 2017/18
Since 2014/15, the supply of standard-rated goods and services has contributed more than 96.0% to total output tax. Over the same period, the contribution of the supply of capital goods was below 3.0%; this is in line

2018 Tax Statistics30
Highlights
Chapter3:Corporateincometax
with subdued business confidence levels that have led to low capital investments.
Output tax by class of supply, 2014/15 - 2017/18
Composition of Domestic VAT payments (output/input), 2014/15 – 2017/18
Fiscal year
2014/15 1 111 283 29 042 2 338 11 987 1 154 650
2015/16 1 173 226 32 020 2 540 11 363 1 219 150
2016/17 1 263 976 36 909 2 836 12 034 1 315 756
2017/18 1 320 499 36 697 3 026 11 646 1 371 867
2014/15 96.2% 2.5% 0.2% 1.0% 100.0%
2015/16 96.2% 2.6% 0.2% 0.9% 100.0%
2016/17 96.1% 2.8% 0.2% 0.9% 100.0%
2017/18 96.3% 2.7% 0.2% 0.8% 100.0%1. Comprises VAT of Change in use and export of second-hand goods, as well as VAT of Other and imported services.
Percentage of total
R million
Total output tax
Standard rate (excl. capital goods and
services and accommodation)
Standard rate (only capital goods and
services)
Supply of accommodation
Adjustments1

312018 Tax Statistics
Highlights
Chapter 3: Corporate income tax
In 2017/18, 35.5% of vendors had a turnover of R1 million or less i.e. below the mandatory VAT registration threshold. However, these vendors accounted for only 1.8% of Domestic VAT payments and 4.7% of VAT refunds. In contrast, 3.1% of VAT vendors who had an annual turnover greater than R100 million accounted for 63.7% of Domestic VAT payments and 78.2% of VAT refunds.
Distribution of VAT vendors by turnover group, 2017/18
Vendors per annualised turnover (payments and refunds), 2014/15 – 2017/18
2014/15 2015/16 2016/17 2017/18Number of vendors 420 940 425 225 432 072 434 981
Turnover (R million) 11 192 846 11 700 998 12 613 531 13 308 025
Payments (R million) 285 485 296 348 320 759 336 964
Refunds (R million) -162 021 -166 760 -180 912 -190 969
Nett VAT 123 463 129 588 139 847 145 995 Nett VAT as % turnorver 1.1% 1.1% 1.1% 1.1%

2018 Tax Statistics32
Highlights
1 2018 TAX STATISTICS

332018 Tax Statistics
Highlights
2 2018 TAX STATISTICS
CHAPTER 5: IMPORT VAT AND CUSTOMS DUTIES
This chapter provides information on the Customs value, Import VAT, Customs Duties and Total Import Tax revenues by Harmonised System (HS), world zone, customs port of entry, country of origin as well as for selected trade blocs.
For the 2017/18 fiscal year: • Import VAT collections totalled R152.8 billion and grew year-on-year
(y/y) by 2.4% compared to the 1.0% decline recorded in 2016/17.
• Collections of Customs Duties totalled R49.2 billion and experienced a y/y improvement of 7.8%, on the back of a 1.5% contraction in 2016/17. Revenue from two of the sub-categories of Customs Duties, namely Specific Excise Duties and Ad valorem Duties (referencing Section A and B respectively of Part 2 of Schedule 1 to the Customs and Excise Act, 1964), contributed R5.8 billion (11.9%) and R8.9 billion (18.1%) respectively to the year’s total Duty collection with the remaining majority of R34.4 billion (70.0%) comprising all other Customs Duties levied, predominantly General Duties (Part 1 of Schedule 1 to the Customs and Excise Act, 1964).
• The largest driver of the year’s Import VAT was Machinery and Electronics at 26.6%, down from 26.9% in 2016/17; while Vehicles, Aircraft and Vessels accounted the most for Customs Duties at 26.8%, up from 24.8% in the prior year.
• Imports from the world zones of Asia and Europe accounted for 82.5% of the combined Total Import Tax contribution, a similar rate to 2016/17.

2018 Tax Statistics34
Highlights
3 2018 TAX STATISTICS
• On a country basis, China at 25.9% and Germany at 12.1% remain the principal suppliers of taxable goods to the Total Import Tax contribution for 2017/18.
• Import VAT for 2017/18 was mostly collected from the importation of Machinery and Electronics (26.6%); Chemical Products (12.4%); Vehicles, Aircraft and Vessels (12.2%); Special Provisions (9.1%); Base Metals (6.0%); Plastics and Rubber (5.3%) as well as Textiles and Clothing (4.9%). The All Other sections grouping (23.4%) comprises the remaining 15 HS sections.
Import VAT by HS section, 2017/18
The largest contributing HS sections to Customs Duties in 2017/18 were Vehicles, Aircraft and Vessels (26.8%); Textiles and Clothing (16.9%); Food, Beverages and Tobacco (13.7%); and Machinery and Electronics (10.2%).

352018 Tax Statistics
Highlights
4 2018 TAX STATISTICS
Customs Duties by HS section, 2017/18
Machinery and Electronics; Vehicles, Aircraft and Vessels; Chemical Products as well as Textiles and Clothing – combined, made up more than half (56.1%) of the Total Import Tax for 2017/18.
Customs Duties by HS section, 2017/18
2018 Tax Statistics36
Highlights
5 2018 TAX STATISTICS
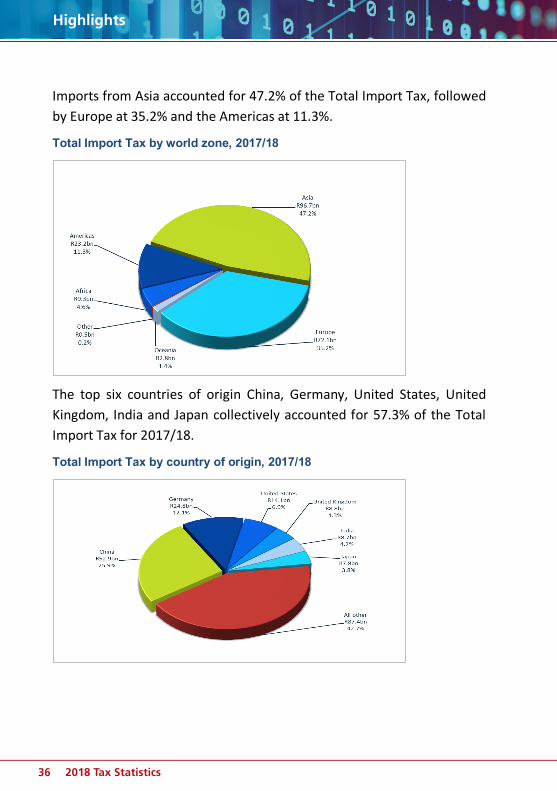
Imports from Asia accounted for 47.2% of the Total Import Tax, followed by Europe at 35.2% and the Americas at 11.3%.
Total Import Tax by world zone, 2017/18
The top six countries of origin China, Germany, United States, United Kingdom, India and Japan collectively accounted for 57.3% of the Total Import Tax for 2017/18.
Total Import Tax by country of origin, 2017/18

372018 Tax Statistics
Highlights
6 2018 TAX STATISTICS
The contribution of the top six offices – Durban Harbour, OR Tambo International Airport, Cape Town Harbour, Port Elizabeth Harbour, Johannesburg Customs Office and East London Customs accounted for 88.9% of the Total Import Tax for 2017/18.
Total Import Tax by customs port of entry, 2017/18
2018 Tax Statistics38
Highlights
1

392018 Tax Statistics
Highlights
2
CHAPTER 6: OTHER TAXES AND COLLECTIONS
This chapter focuses on revenue collection trends that provide insight into specific aspects of economic activity during 2017/18. It gives an overview of:
• Capital Gains Tax; • Transfer Duty; • Diesel Refunds; • Mineral and Petroleum Resources Royalty; and • The Southern African Customs Union.
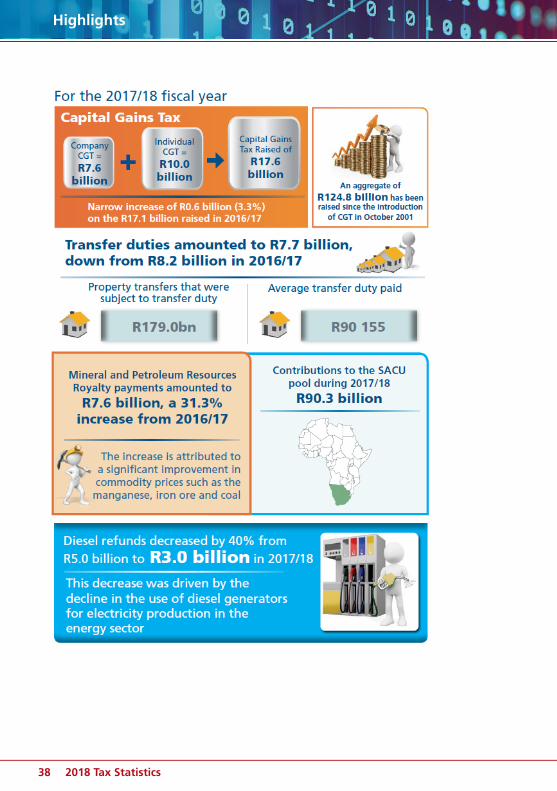
For the 2017/18 fiscal year: • CGT of R17.6 billion was raised of which R10.0 billion was attributable
to individuals and trusts and R7.6 billion to companies. This shows a narrow increase of R0.6 billion (3.3%) on the R17.1 billion raised in 2016/17. An aggregate of R124.8 billion has been raised since the introduction of CGT in October 2001;
• Collections of Transfer Duty amounted to R7.7 billion, down from R8.2 billion in 2016/17, a contraction of 5.9% year-on-year.

2018 Tax Statistics40
Highlights
3
Distribution of Transfer Duty collected by property value, 2017/18
• Diesel refunds decreased from R5.0 billion in 2016/17 to R3.0 billion in
2017/18, a decrease of 40%. This decrease was driven by the decline in the use of diesel generators for electricity production in the energy sector.
• Mineral and Petroleum Resources Royalty (MPRR) payments by extractors grew by R1.8 billion (31.3%) to R7.6 billion due to a significant improvement in the prices of commodities such as the manganese, iron ore and coal. This growth, however, was still at a lower rate compared to 2016/17 growth of R2.1bn (56.5%).
• Total contributions to the SACU pool amounted to R90.3 billion, up by 6.5% on the contributions from the previous year.
412018 Tax Statistics
Highlights
NOTES
2018 Tax Statistics42
Highlights
NOTES

432018 Tax Statistics
Highlights
NOTES

2018 Tax Statistics44
Highlights
NOTES