Elara Securities - Strategy - India Economics
8
Ashish Kumar • [email protected] • +91 22 3032 8536 G l o b a l M a r k e t s R e s e a r c h Elara Securities (India) Private Limited Story needs more support Quick comment: Inflation falls on base; real recovery clouded Sustainability of growth momentum post robust Q1FY15 GDP figures was clouded in the first place and the current round of macro data distinctly signals that. Waiting for the economy to self-correct could take longer-than-expected as India’s macro stability indicator s continue to have traces of latent stagflation pressures. We remain cautious of the short-term recovery prospects, and, accordingly, retain our FY15E for real GDP at 5.4%. A slow pickup in the economy could lend a downward bias to our FY16E for real GDP at 6.7%. Elevated levels of headline inflation in 2014 have induced a strong “base effect”. Coupled with easing vegetable prices and moderation in crude, the headline CPI inflation at 6.5% in September 2014 suddenly looks benign. Inflation readings for the next three months could continue to look benign on these counts. Along with a normalization of base in January 2014, the dynamics of food prices and bottomed core inflation are key risks for the inflation trajectory in Q4FY15. On a YoY basis, the pace of resurrection of headline inflation in Q4FY15 could turn out to much sharper than anticipated. Factory output Deseasonalized movement in overall factory output, as measured by 3mma SAAR, has shown a sizeable loss in the sequential momentum – contraction of 9.2% – the largest since July 2013. Most manufacturing momentum gains in Q1FY15 on account of strong exports demand seem to be over now. In the manufacturing sector, 11 out of 22 industry groups contracted during August 2014. For detailed classification, see page 2. Contraction in consumer goods production at 6.9% YoY and 19.5% 3mma SAAR, centered on durables, indicates a long wait for broad-based revival in the consumption cycle. Retail inflation CPI inflation has responded well to an across-the-board high base, supported by almost zero sequential momentum growth on a MoM basis. For a detailed CPI inflation breakdown, please refer to page 3. Monetary policy preview We remain bearish on the structural supply-side bottlenecks that continue to pose upside risks to inflation targets set by the Central Bank (CB). In the last monetary policy statement, the CB underlined it will “look through the base effect” of the inflation trajectory. Of the key assumptions in our base case outlook on inflation, namely 1) disappointment in the spatial distribution of the Monsoon, affecting farm productivity and distorting retail price regimes, and 2) a growth revival without supply-side response stoking pricing power, constitutes a major risk to the 200bp disinflation target set by the CB during 2015. And, that leave s real chances of further rate hikes by the CB. Broad collapse in f actory output (4) (2) 0 2 4 6 8 A u g 1 3 S e p - 1 3 O c t 1 3 N o v 1 3 D e c 1 3 J a n - 1 4 F e b 1 4 M a r 1 4 A p r 1 4 M a y - 1 4 J u n - 1 4 J u l 1 4 A u g 1 4 1 2 m o n t h c h a n g e ( % ) IP Ex-capital goods Source: CSO, MOSPI and Elara Securities Research Trends in YoY growth of IP Y-o-Y ( ) Apr-14 May-14 Jun-14 Jul-14 Aug-14 General 3.7 5.6 3.9 0.4 0.4 Mining 1.7 2.5 4.5 1.2 2.6 Manufacturing 3.0 5.9 2.5 (1.0) (1.4) Electricity 11.9 6.7 15.7 11.7 12.9 Basic goods 8.6 7.5 10.0 7.4 9.6 Capital goods 13.4 4.2 23.3 (3.9) (11.3) Intermediate goods 3.0 3.5 2.4 3.0 0.3 Consumer goods (4.8) 4.6 (9.7) (7.7) (6.9) Durables (7.7) 3.6 (23.4) (20.9) (15.0) Non-durables (2.7) 5.2 0.6 2.4 (0.9) Source: CSO, MOSPI and Elara Securities Research Trends in sequential growth of IP 3mma saar( ) Apr-14 May-14 Jun-14 Jul-14 Aug-14 General 5.5 13.7 3.9 (6.3) (9.2) Mining (8.1) (3.0) 4.5 0.6 9.5 Manufacturing 5.4 17.5 0.9 (8.8) (15.2) Electricity 22.6 26.7 34.6 6.3 12.3 Basic goods 16.3 10.0 14.3 1.7 12.1 Capital goods 38.1 35.9 86.5 5.6 4.2 Intermediate goods (4.6) 3.1 3.4 4.0 (2.8) Consumer goods (16.7) 6.5 (14.3) (18.0) (19.5) Source: CSO, MOSPI and Elara Securities Research Revision patterns in IP for July 2014 RE QE Mining 1.2 2.1 Manufacturing (1.0) (1.0) Electricity 11.7 11.7 Basic goods 7.4 7.6 Capital goods (3.9) (3.8) Intermediate goods 3.0 2.6 Consumer goods (7.7) (7.4) General 0.4 0.5 Source: CSO, MOSPI and Elara Securities Research Trends in India CPI inflation (%) Weights Jun-14 Jul-14 Aug-14 Sep-14 Headline 100.0 7.5 8.0 7.7 6.5 Rural 43.0 7.9 8.4 8.3 6.7 Urban 57.0 6.8 7.9 8.5 9.4 Food, beverages & tobacco 49.7 8.0 9.1 9.1 7.6 Rural 37.2 8.6 9.6 9.5 8.0 Urban 59.3 6.6 8.3 8.3 7.6 Fuel and light 9.5 4.7 4.5 4.2 3.5 Housing 9.8 9.1 8.9 8.5 8.1 Clothing, bedding & footwear 4.7 8.6 8.7 8.4 7.6 Miscellaneous 26.3 6.5 6.6 5.9 4.7 Ex food 50.3 6.9 6.7 6.2 5.2 Core (ex-food ex-fuel) 40.8 7.4 7.4 6.8 5.9 Source: CSO, MOSPI and Elara Securities Research India | Strategy 13 October 2014 India Economics
-
Upload
girishrajs -
Category
Documents
-
view
234 -
download
0
Transcript of Elara Securities - Strategy - India Economics

8/10/2019 Elara Securities - Strategy - India Economics
http://slidepdf.com/reader/full/elara-securities-strategy-india-economics 1/7
Ashish Kumar • [email protected] • +91 22 3032 8536
G l o b a l M a r k e t s R e s e a r c h
Elara Securities (India) Private Limited
Story needs more support
Quick comment: Inflation falls on base; real recovery clouded
Sustainability of growth momentum post robust Q1FY15 GDP figureswas clouded in the first place and the current round of macro datadistinctly signals that. Waiting for the economy to self-correct couldtake longer-than- expected as India’s macro stability indicator scontinue to have traces of latent stagflation pressures.
We remain cautious of the short-term recovery prospects, and,accordingly, retain our FY15E for real GDP at 5.4%. A slow pickup inthe economy could lend a downward bias to our FY16E for real GDPat 6.7%.
Elevated levels of headline inflation in 2014 have induced a strong“base effect”. Coupled with easing vegetable prices and moderation in
crude, the headline CPI inflation at 6.5% in September 2014 suddenlylooks benign. Inflation readings for the next three months couldcontinue to look benign on these counts.
Along with a normalization of base in January 2014, the dynamics offood prices and bottomed core inflation are key risks for the inflationtrajectory in Q4FY15. On a YoY basis, the pace of resurrection ofheadline inflation in Q4FY15 could turn out to much sharper thananticipated.
Factory output Deseasonalized movement in overall factory output, as measured
by 3mma SAAR, has shown a sizeable loss in the sequentialmomentum – contraction of 9.2% – the largest since July 2013.
Most manufacturing momentum gains in Q1FY15 on account ofstrong exports demand seem to be over now. In themanufacturing sector, 11 out of 22 industry groups contractedduring August 2014. For detailed classification, see page 2.
Contraction in consumer goods production at 6.9% YoY and19.5% 3mma SAAR, centered on durables, indicates a long waitfor broad-based revival in the consumption cycle.
Retail inflation
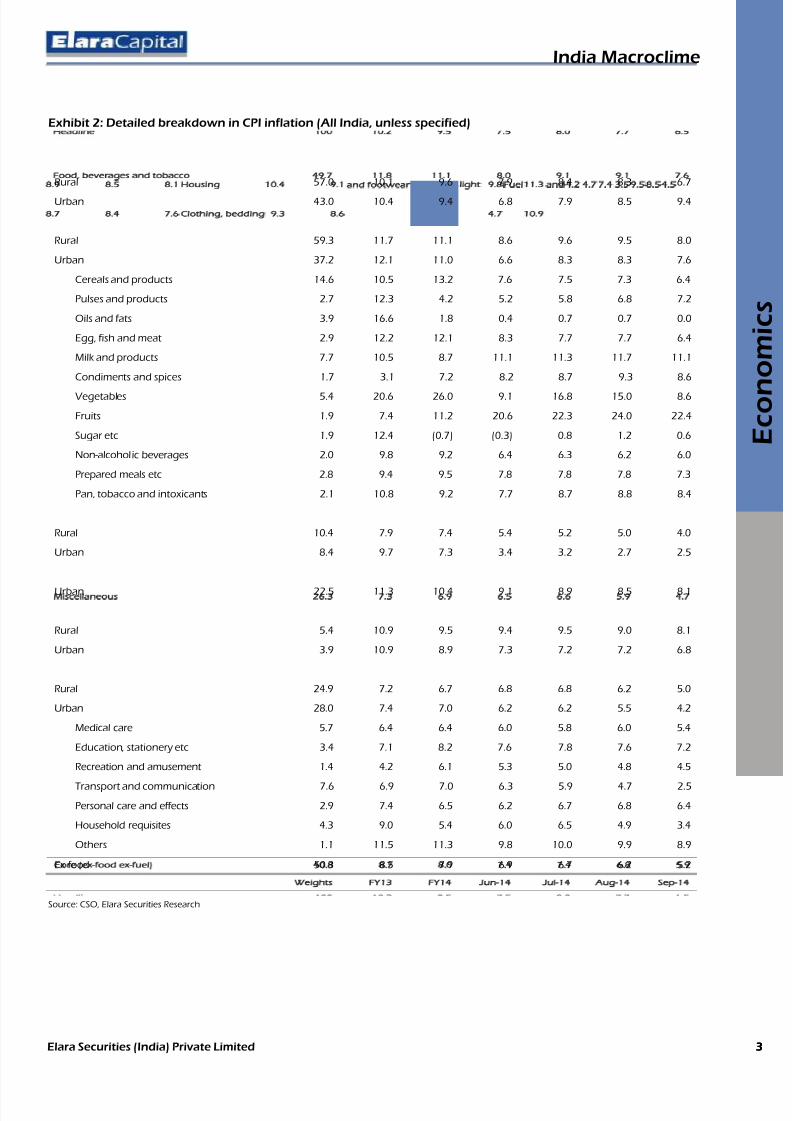
CPI inflation has responded well to an across-the-board high base,supported by almost zero sequential momentum growth on a MoMbasis. For a detailed CPI inflation breakdown, please refer to page 3.
Monetary policy preview
We remain bearish on the structural supply-sidebottlenecks that continue to pose upside risks to inflation targets setby the Central Bank (CB). In the last monetary policy statement, the CBunderlined it will “look through the base effect” of the inflationtrajectory.
Of the key assumptions in our base case outlook on inflation, namely1) disappointment in the spatial distribution of the Monsoon, affecting
farm productivity and distorting retail price regimes, and 2) a growthrevival without supply-side response stoking pricing power, constitutesa major risk to the 200bp disinflation target set by the CB during 2015.
And, that leaves real chances of further rate hikes by the CB.
Broad collapse in factory output
(4)
(2)
0
2
4
6
8
A u
g - 1
3
S e p - 1
3
O c t - 1 3
N o v - 1
3
D e c - 1 3
J a n - 1
4
F e b - 1
4
M a r - 1 4
A p r - 1 4
M a y - 1
4
J u n - 1
4
J u l - 1 4
A u
g - 1
4 1 2 m o n t h c h a n g e ( % )
IP Ex-capital goods
Source: CSO, MOSPI and Elara Securities Research
Trends in YoY growth of IPY-o-Y ( ) Apr-14 May-14 Jun-14 Jul-14 Aug-14
General 3.7 5.6 3.9 0.4 0.4Mining 1.7 2.5 4.5 1.2 2.6
Manufacturing 3.0 5.9 2.5 (1.0) (1.4)Electricity 11.9 6.7 15.7 11.7 12.9Basic goods 8.6 7.5 10.0 7.4 9.6Capital goods 13.4 4.2 23.3 (3.9) (11.3)Intermediate goods 3.0 3.5 2.4 3.0 0.3Consumer goods (4.8) 4.6 (9.7) (7.7) (6.9)
Durables (7.7) 3.6 (23.4) (20.9) (15.0)Non-durables (2.7) 5.2 0.6 2.4 (0.9)
Source: CSO, MOSPI and Elara Securities Research
Trends in sequential growth of IP3mma saar( ) Apr-14 May-14 Jun-14 Jul-14 Aug-14General 5.5 13.7 3.9 (6.3) (9.2) Mining (8.1) (3.0) 4.5 0.6 9.5Manufacturing 5.4 17.5 0.9 (8.8) (15.2) Electricity 22.6 26.7 34.6 6.3 12.3Basic goods 16.3 10.0 14.3 1.7 12.1Capital goods 38.1 35.9 86.5 5.6 4.2Intermediate goods (4.6) 3.1 3.4 4.0 (2.8) Consumer goods (16.7) 6.5 (14.3) (18.0) (19.5)
Source: CSO, MOSPI and Elara Securities Research
Revision patterns in IP for July 2014RE QE
Mining 1.2 2.1Manufacturing (1.0) (1.0)Electricity 11.7 11.7Basic goods 7.4 7.6Capital goods (3.9) (3.8)Intermediate goods 3.0 2.6
Consumer goods (7.7) (7.4)General 0.4 0.5
Source: CSO, MOSPI and Elara Securities Research
Trends in India CPI inflation (%)
Weights Jun-14 Jul-14 Aug-14 Sep-14Headline 100.0 7.5 8.0 7.7 6.5
Rural 43.0 7.9 8.4 8.3 6.7Urban 57.0 6.8 7.9 8.5 9.4
Food, beverages &tobacco 49.7 8.0 9.1 9.1 7.6
Rural 37.2 8.6 9.6 9.5 8.0Urban 59.3 6.6 8.3 8.3 7.6
Fuel and light 9.5 4.7 4.5 4.2 3.5Housing 9.8 9.1 8.9 8.5 8.1Clothing, bedding &footwear 4.7 8.6 8.7 8.4 7.6
Miscellaneous 26.3 6.5 6.6 5.9 4.7Ex food 50.3 6.9 6.7 6.2 5.2Core (ex-food ex-fuel) 40.8 7.4 7.4 6.8 5.9
Source: CSO, MOSPI and Elara Securities Research
India | Strategy 13 October 2014
India Economics

8/10/2019 Elara Securities - Strategy - India Economics
http://slidepdf.com/reader/full/elara-securities-strategy-india-economics 2/7
India Macroclime
2 Elara Securities (India) Private Limited
Exhibit 1: Consolidated industrial breakdown (% YoY)
Description Weight FY13 FY14 Apr-14 May-14 Jun-14 Jul-14 Aug-14
General 100.0 1.1 (0.1) 3.7 5.6 3.9 0.4 0.4
Use based classification
Basic goods 45.7 2.5 2.0 8.6 7.5 10.0 7.4 9.6
Capital goods 8.8 (6.0) (3.7) 13.4 4.2 23.3 (3.9) (11.3)
Intermediate goods 15.7 1.6 3.0 3.0 3.5 2.4 3.0 0.3
Consumer goods 29.8 2.4 (2.6) (4.8) 4.6 (9.7) (7.7) (6.9)
Durables 8.5 2.0 (12.2) (7.7) 3.6 (23.4) (20.9) (15.0)
Non-durables 21.3 2.8 5.2 (2.7) 5.2 0.6 2.4 (0.9)
Sectoral classification
Mining 14.2 (2.3) (0.8) 1.7 2.5 4.5 1.2 2.6
Electricity 10.3 4.0 6.1 11.9 6.7 15.7 11.7 12.9
Manufacturing 75.5 1.3 (0.8) 3.0 5.9 2.5 (1.0) (1.4)
Food products and beverages 7.3 2.9 (1.4) 10.2 9.2 1.8 4.1 8.5Tobacco products 1.6 (0.4) 1.6 7.9 35.3 (0.9) (11.9) 5.6
Textiles 6.2 5.9 4.1 6.0 7.2 1.5 2.1 (1.7)
Wearing apparel etc. 2.8 10.4 22.6 (22.4) 9.9 (5.8) (7.4) (10.1)
Leather and leather products 0.6 7.3 5.0 5.0 11.3 10.6 4.8 10.9
Wood and products of wood 1.1 (7.1) (2.1) (1.8) 1.6 (6.1) 5.9 4.2
Paper and paper products 1.0 0.5 0.0 1.9 1.3 3.2 (2.1) 4.4
Publishing, printing etc. 1.1 (5.1) 0.3 (5.3) (5.9) (4.9) (6.9) (6.1)
Coke, refined petroleum products & nuclear fuel 6.7 8.5 5.2 1.4 (3.3) 1.3 (5.0) (4.6)
Chemicals and chemical products 10.1 3.8 8.9 (4.6) 3.9 2.2 6.1 (5.3)
Rubber and plastics products 2.0 0.2 (2.3) (0.8) 1.8 3.6 7.5 5.3
Other non-metallic mineral products 4.3 1.9 1.0 6.3 7.2 9.5 12.0 4.6
Basic metals 11.3 1.9 0.3 14.2 11.8 11.7 12.5 19.1
Fabricated metal products 3.1 (4.7) (7.2) 5.8 4.0 (0.5) (2.2) (9.7)
Machinery and equipment n.e.c. 3.8 (4.7) (4.8) 4.7 8.7 4.7 4.8 5.1
Office, accounting and computing machinery 0.3 (13.9) (15.8) (21.1) (31.5) (60.5) (31.1) (43.9)
Electrical machinery and apparatus n.e.c. 2.0 0.6 14.3 65.5 35.0 69.1 (6.2) (17.8)
Radio, TV and communication equipment 1.0 5.6 (27.3) (31.8) (40.3) (62.9) (58.3) (48.8)
Medical, precision and optical instruments 0.6 (2.0) (5.0) (5.5) (0.4) 3.5 (0.8) 1.8
Motor vehicles, trailers and semi-trailers 4.1 (5.3) (9.6) (14.6) (7.3) 7.3 0.4 (2.1)
Other transport equipment 1.8 (0.1) 5.6 6.6 13.9 7.7 17.1 14.3
Furniture; manufacturing n.e.c. 3.0 (5.1) (13.8) (7.6) 61.5 (13.4) (17.3) (0.5)
Source: CSO, MOSPI and Elara Securities Research
8/10/2019 Elara Securities - Strategy - India Economics
http://slidepdf.com/reader/full/elara-securities-strategy-india-economics 3/7
India Macroclime
E c o n o m i c s
33Elara Securities (India) Private Limited
Exhibit 2: Detailed breakdown in CPI inflation (All India, unless specified)
Weights FY13 FY14 Jun-14 Jul-14 Aug-14 Sep-14
Headline 100 10.2 9.5 7.5 8.0 7.7 6.5
Rural 57.0 10.1 9.6 7.9 8.4 8.3 6.7
Urban 43.0 10.4 9.4 6.8 7.9 8.5 9.4
Food, beverages and tobacco 49.7 11.8 11.1 8.0 9.1 9.1 7.6
Rural 59.3 11.7 11.1 8.6 9.6 9.5 8.0
Urban 37.2 12.1 11.0 6.6 8.3 8.3 7.6
Cereals and products 14.6 10.5 13.2 7.6 7.5 7.3 6.4
Pulses and products 2.7 12.3 4.2 5.2 5.8 6.8 7.2
Oils and fats 3.9 16.6 1.8 0.4 0.7 0.7 0.0
Egg, fish and meat 2.9 12.2 12.1 8.3 7.7 7.7 6.4
Milk and products 7.7 10.5 8.7 11.1 11.3 11.7 11.1
Condiments and spices 1.7 3.1 7.2 8.2 8.7 9.3 8.6
Vegetables 5.4 20.6 26.0 9.1 16.8 15.0 8.6
Fruits 1.9 7.4 11.2 20.6 22.3 24.0 22.4
Sugar etc 1.9 12.4 (0.7) (0.3) 0.8 1.2 0.6
Non-alcoholic beverages 2.0 9.8 9.2 6.4 6.3 6.2 6.0
Prepared meals etc 2.8 9.4 9.5 7.8 7.8 7.8 7.3
Pan, tobacco and intoxicants 2.1 10.8 9.2 7.7 8.7 8.8 8.4
Fuel and light 9.5 8.5 7.4 4.7 4.5 4.2 3.5
Rural 10.4 7.9 7.4 5.4 5.2 5.0 4.0
Urban 8.4 9.7 7.3 3.4 3.2 2.7 2.5
Housing 9.8 11.3 10.4 9.1 8.9 8.5 8.1
Urban 22.5 11.3 10.4 9.1 8.9 8.5 8.1
Clothing, bedding and footwear 4.7 10.9 9.3 8.6 8.7 8.4 7.6
Rural 5.4 10.9 9.5 9.4 9.5 9.0 8.1
Urban 3.9 10.9 8.9 7.3 7.2 7.2 6.8
Miscellaneous 26.3 7.3 6.9 6.5 6.6 5.9 4.7
Rural 24.9 7.2 6.7 6.8 6.8 6.2 5.0
Urban 28.0 7.4 7.0 6.2 6.2 5.5 4.2
Medical care 5.7 6.4 6.4 6.0 5.8 6.0 5.4
Education, stationery etc 3.4 7.1 8.2 7.6 7.8 7.6 7.2
Recreation and amusement 1.4 4.2 6.1 5.3 5.0 4.8 4.5Transport and communication 7.6 6.9 7.0 6.3 5.9 4.7 2.5
Personal care and effects 2.9 7.4 6.5 6.2 6.7 6.8 6.4
Household requisites 4.3 9.0 5.4 6.0 6.5 4.9 3.4
Others 1.1 11.5 11.3 9.8 10.0 9.9 8.9
Ex food 50.3 8.5 7.9 6.9 6.7 6.2 5.2
Core (ex-food ex-fuel) 40.8 8.7 8.0 7.4 7.4 6.8 5.9
Source: CSO, Elara Securities Research

8/10/2019 Elara Securities - Strategy - India Economics
http://slidepdf.com/reader/full/elara-securities-strategy-india-economics 4/7
India Macroclime
4 Elara Securities (India) Private Limited
Industrial Production Chart Book
Exhibit 3: Trends in General IP
(25)(20)(15)(10)(5)0510152025
(10)
(5)
0
5
10
15
20
D e c - 0 8
F e b - 0
9
A p r - 0 9
J u n - 0
9
A u
g - 0
9
O c t - 0 9
D e c - 0 9
F e b - 1
0
A p r - 1 0
J u n - 1
0
A u
g - 1
0
O c t - 1 0
D e c - 1 0
F e b - 1
1
A p r - 1 1
J u n - 1
1
A u
g - 1
1
O c t - 1 1
D e c - 1 1
F e b - 1
2
A p r - 1 2
J u n - 1
2
A u
g - 1
2
O c t - 1 2
D e c - 1 2
F e b - 1
3
A p r - 1 3
J u n - 1
3
A u
g - 1
3
O c t - 1 3
D e c - 1 3
F e b - 1
4
A
r - 1 4
J u n - 1
4
A u - 1
4
( % )
( % )
12 mo nt h change (LHS) 3mma saar (RHS)
Exhibit 4: Trends in Mining (%) Exhibit 5: Trends in Electricity Production (%)
(20)(15)(10)(5)051015
(10)
(5)
0
5
10
15
D e c - 0 9
A
r - 1 0
A u g - 1
0
D e c - 1 0
A
r - 1 1
A u g - 1
1
D e c - 1 1
A p r - 1 2
A u
- 1 2
D e c - 1 2
A
r - 1 3
A u
- 1 3
D e c - 1 3
A
r - 1 4
A u
- 1 4
12 mo nt h change (LHS) 3mma saar (RHS)
(20)
(10)
0
10
20
3040
(10)
(5)
0
5
10
1520
D e c - 0 9
A p r - 1 0
A u
- 1 0
D e c - 1 0
A p r - 1 1
A u
- 1 1
D e c - 1 1
A
r - 1 2
A u
- 1 2
D e c - 1 2
A
r - 1 3
A u
- 1 3
D e c - 1 3
A
r - 1 4
A u
- 1 4
12 mo nt h change (LHS) 3mma saar (RHS)
Exhibit 6: Trends in Basic Goods (%) Exhibit 7: Trends in Capital Goods (%)
(10)
(5)
0
5
10
15
20
(4)(2)
02468
1012
D e c - 0 9
A
r - 1 0
A u
g - 1
0
D e c - 1 0
A
r - 1 1
A u
g - 1
1
D e c - 1 1
A p r - 1 2
A u - 1
2
D e c - 1 2
A
r - 1 3
A u - 1
3
D e c - 1 3
A
r - 1 4
A u - 1
4
12 mo nt h change (LHS) 3mma saar ( RHS)
(60)(40)(20)020406080100
(40)(30)(20)(10)
0102030405060
D e c - 0 9
A p r - 1 0
A u
g - 1
0
D e c - 1 0
A p r - 1 1
A u
g - 1
1
D e c - 1 1
A p r - 1 2
A u - 1
2
D e c - 1 2
A
r - 1 3
A u - 1
3
D e c - 1 3
A
r - 1 4
A u - 1
4
12 mo nt h change (LHS) 3mma saar ( RHS)
Exhibit 8: Trends in Intermediate Goods (%) Exhibit 9: Trends in Consumer Goods (%)
(15)(10)(5)05
10
15
20
(10)
(5)
0
5
10
15
20
D e c - 0 9
A
r - 1 0
A u
g - 1
0
D e c - 1 0
A
r - 1 1
A u
g - 1
1
D e c - 1 1
A p r - 1 2
A u - 1
2
D e c - 1 2
A
r - 1 3
A u - 1
3
D e c - 1 3
A
r - 1 4
A u - 1
4
12 mo nt h change (LHS) 3mma saar ( RHS)
(30)(20)(10)01020304050
(15)(10)
(5)05
10152025
D e c - 0 9
A p r - 1 0
A u - 1
0
D e c - 1 0
A p r - 1 1
A u - 1
1
D e c - 1 1
A
r - 1 2
A u - 1
2
D e c - 1 2
A
r - 1 3
A u - 1
3
D e c - 1 3
A
r - 1 4
A u - 1
4
12 mo nt h change (LHS) 3mma saar ( RHS) Source of all charts: CSO, MOSPI and Elara Securities Research

8/10/2019 Elara Securities - Strategy - India Economics
http://slidepdf.com/reader/full/elara-securities-strategy-india-economics 5/7
Elara Securities (India) Private Limited
55
G l o b a l M a r k e t s R e s e a r c h
Elara Securities (India) Private Limited
Disclosures & Confidentiality for non U.S. InvestorsThe Note is based on our estimates and is being provided to you (herein referred to as the “Recipient”) only for informationpurposes. The sole purpose of this Note is to provide preliminary information on the business activities of the company andthe projected financial statements in order to assist the recipient in understanding / evaluating the Proposal. Nothing in thisdocument should be construed as an advice to buy or sell or solicitation to buy or sell the securities of companies referred to
in this document. Each recipient of this document should make such investigations as it deems necessary to arrive at anindependent evaluation of an investment in the securities of companies referred to in this document (including the merits andrisks involved) and should consult its own advisors to determine the merits and risks of such an investment. Nevertheless, Elaraor any of its affiliates is committed to provide independent and transparent recommendation to its client and would be happyto provide any information in response to specific client queries. Elara or any of its affiliates have not independently verified allthe information given in this Note and expressly disclaim all liability for any errors and/or omissions, representations orwarranties, expressed or implied as contained in this Note. The user assumes the entire risk of any use made of thisinformation. Elara or any of its affiliates, their directors and the employees may from time to time, effect or have effected anown account transaction in or deal as principal or agent in or for the securities mentioned in this document. They mayperform or seek to perform investment banking or other services for or solicit investment banking or other business from anycompany referred to in this Note. Each of these entities functions as a separate, distinct and independent of each other. ThisNote is strictly confidential and is being furnished to you solely for your information. This Note should not be reproduced orredistributed or passed on directly or indirectly in any form to any other person or published, copied, in whole or in part, forany purpose. This Note is not directed or intended for distribution to, or use by, any person or entity who is a citizen orresident of or located in any locality, state, country or other jurisdiction, where such distribution, publication, availability or usewould be contrary to law, regulation or which would subject Elara or any of its affiliates to any registration or licensingrequirements within such jurisdiction. The distribution of this document in certain jurisdictions may be restricted by law, andpersons in whose possession this document comes, should inform themselves about and observe, any such restrictions. Uponrequest, the Recipient will promptly return all material received from the company and/or the Advisors without retaining anycopies thereof. The Information given in this document is as of the date of this report and there can be no assurance thatfuture results or events will be consistent with this information. This Information is subject to change without any prior notice.Elara or any of its affiliates reserves the right to make modifications and alterations to this statement as may be required fromtime to time. However, Elara is under no obligation to update or keep the information current. Neither Elara nor any of itsaffiliates, group companies, directors, employees, agents or representatives shall be liable for any damages whether direct,indirect, special or consequential including lost revenue or lost profits that may arise from or in connection with the use of the
information. This Note should not be deemed an indication of the state of affairs of the company nor shall it constitute anindication that there has been no change in the business or state of affairs of the company since the date of publication of thisNote. The disclosures of interest statements incorporated in this document are provided solely to enhance the transparencyand should not be treated as endorsement of the views expressed in the report. Elara Securities (India) Private Limitedgenerally prohibits its analysts, persons reporting to analysts and their family members from maintaining a financial interest inthe securities or derivatives of any companies that the analysts cover. The analyst for this report certifies that all of the viewsexpressed in this report accurately reflect his or her personal views about the subject company or companies and its or theirsecurities, and no part of his or her compensation was, is or will be, directly or indirectly related to specific recommendationsor views expressed in this report.
Any clarifications / queries on the proposal as well as any future communication regarding the proposal should be addressedto Elara Securities (India) Private Limited / the company.
Disclaimer for non U.S. Investors
The information contained in this note is of a general nature and is not intended to address the circumstances of anyparticular individual or entity. Although we endeavor to provide accurate and timely information, there can be noguarantee that such information is accurate as of the date it is received or that it will continue to be accurate in the future.No one should act on such information without appropriate professional advice after a thorough examination of theparticular situation.
8/10/2019 Elara Securities - Strategy - India Economics
http://slidepdf.com/reader/full/elara-securities-strategy-india-economics 6/7
Elara Securities (India) Private Limited
6
Disclaimer for U.S. Investors
This material is based upon information that we consider to be reliable, but Elara Capital Inc. does not warrant itscompleteness, accuracy or adequacy and it should not be relied upon as such.
This material is not intended as an offer or solicitation for the purchase or sale of any security or other financial instrument.
Securities, financial instruments or strategies mentioned herein may not be suitable for all investors. Any opinions expressedherein are given in good faith, are subject to change without notice, and are only correct as of the stated date of their issue.Prices, values or income from any securities or investments mentioned in this report may fall against the interests of theinvestor and the investor may get back less than the amount invested. Where an investment is described as being likely to
yield income, please note that the amount of income that the investor will receive from such an investment may fluctuate.Where an investment or security is denominated in a different currency to the investor’s currency of reference, changes inrates of exchange may have an adverse effect on the value, price or income of or from that investment to the investor. Theinformation contained in this report does not constitute advice on the tax consequences of making any particularinvestment decision. This material does not take into account your particular investment objectives, financial situations orneeds and is not intended as a recommendation of particular securities, financial instruments or strategies to you. Beforeacting on any recommendation in this material, you should consider whether it is suitable for your particular circumstancesand, if necessary, seek professional advice.
Certain statements in this report, including any financial projections, may constitute “forward -looking statements.” These“forward -looking statements” are not guarantees of future performance and are based on numerous current assumptions that are subject to significant uncertainties and contingencies. Actual future performance could differ materially from these“forward -looking statements” and financial information.

8/10/2019 Elara Securities - Strategy - India Economics
http://slidepdf.com/reader/full/elara-securities-strategy-india-economics 7/7
Elara Securities (India) Private Limited
77
G l o b a l M a r k e t s R e s e a r c h
Elara Securities (India) Private Limited
IndiaElara Securities (India) Pvt. Ltd.Indiabulls Finance Centre,Tower 3, 21st Floor,Senapati Bapat Marg,Elphinstone Road (West)Mumbai – 400 013, IndiaTel : +91 22 3032 8500
EuropeElara Capital Plc.29 Marylebone Road,London NW1 5JX,United KingdomTel : +4420 7486 9733
USAElara Securities Inc.36W 44th Street, 803,New York, NY 10036,USATel :+1- 212-430-5870
Asia / PacificElara Capital (Singapore) Pte.Ltd.30 Raffles Place#20-03, Chevron HouseSingapore 048622Tel : +65 6536 6267
Harendra Kumar Managing Director [email protected] +91 22 3032 8571
Vishal Purohit Co-Head Institutional Equities vishal.purohit@elaracapital .com +91 22 3032 8572
Sales
Amit Mamgain India [email protected] +91 22 3032 8543
Kalpesh Parekh India [email protected] +91 22 3032 8513
Nishit Master India nishit.master@elaracapital .com +91 22 3032 8521
Prashin Lalvani India [email protected] +91 22 3032 8544
Sushil Bhojwani India sushil.bhojwani@elaracapital .com +91 22 3032 8512
Sales Trading & Dealing Manan Joshi India [email protected] +91 22 3032 8555
Manoj Murarka India [email protected] +91 22 3032 8551
Vishal Thakkar India [email protected] +91 22 3032 8552
Research
Aarthisundari Jayakumar Analyst Pharmaceuticals [email protected] +91 22 3032 8510
Abhinav Bhandari Analyst Construction, Infrastructure [email protected] +91 22 3032 8507
Aliasgar Shakir Analyst Mid caps, Telecom [email protected] +91 22 3032 8516
Ashish Kejriwal Analyst Metals & Mining [email protected] +91 22 3032 8505
Ashish Kumar Economist [email protected] +91 22 3032 8536
Aashish Upganlawar Analyst FMCG [email protected] +91 22 3032 8546Deepak Agrawala Analyst Power, Capital Goods [email protected] +91 22 3032 8523
Mohan Lal Analyst Media , Auto & Auto Ancillaries [email protected] +91 22 3032 8502
Rakesh Kumar Analyst Banking & Financials [email protected] +91 22 3032 8559
Ravi Sodah Analyst Cement [email protected] +91 22 3032 8517
Sumant Kumar Analyst Agri, Travel & Hospitality, Paper [email protected] +91 22 3032 8503
Swarnendu Bhushan Analyst Oil and gas [email protected] +91 22 3032 8504
Gaurant Dadwal Sr. Associate Auto & Auto Ancillaries [email protected] +91 22 3032 8519
Manuj Oberoi Sr. Associate Banking & Financials [email protected] +91 22 3032 8535
Durgesh Poyekar Associate Oil and gas [email protected] +91 22 3032 8541
Harshit Kapadia Associate Power, Capital Goods [email protected] +91 22 3032 8542
Saiprasad Prabhu Associate FMCG saiprasad.prabhu@elaracapital .com +91 22 3032 8518
Priyanka Sheth Editor [email protected] +91 22 3032 8568
Gurunath Parab Production [email protected] +91 22 3032 8515
Jinesh Bhansali Production [email protected] +91 22 3032 8537
Access our reports on Bloomberg: Type ESEC <GO>
Also available on Thomson & Reuters
Elara Securities (India) Private LimitedCIN: U74992MH2007PTC172297
Member (BSE, NSE)Regn Nos: CAPITAL MARKET SEBI REGN. NO.: BSE: INB 011289833, NSE: INB231289837 DERIVATIVES SEBI REGN. NO.: NSE: INF 231289837
CLEARING CODE: M51449.
Website: www.elaracapital.com Investor Grievance Email ID: [email protected]