Efficient model-based quantification of left ventricular ...
10
IEEE TRANSACTIONS ON MEDICAL IMAGING, VOL. 21, NO. 9, SEPTEMBER 2002 1059 Efficient Model-Based Quantification of Left Ventricular Function in 3-D Echocardiography Olivier Gérard*, Antoine Collet Billon, Jean-Michel Rouet, Marie Jacob, Maxim Fradkin, and Cyril Allouche Abstract—Quantitative functional analysis of the left ventricle plays a very important role in the diagnosis of heart diseases. While in standard two-dimensional echocardiography this quantification is limited to rather crude volume estimation, three-dimensional (3-D) echocardiography not only significantly improves its accu- racy but also makes it possible to derive valuable additional infor- mation, like various wall-motion measurements. In this paper, we present a new efficient method for the functional evaluation of the left ventricle from 3-D echographic sequences. It comprises a seg- mentation step that is based on the integration of 3-D deformable surfaces and a four-dimensional statistical heart motion model. The segmentation results in an accurate 3-D time left ventricle discrete representation. Functional descriptors like local wall-mo- tion indexes are automatically derived from this representation. The method has been successfully tested both on electrocardiog- raphy-gated and real-time 3-D data. It has proven to be fast, accu- rate, and robust. Index Terms—Deformable surfaces, four-dimensional statistical modeling, left ventricle function quantification, three-dimensional echocardiography. I. INTRODUCTION E CHOCARDIOGRAPHY has become a major modality in the diagnosis of heart diseases due to its innocuousness, the relatively low cost and small size of equipment compared to other modalities, and its ability to reveal the anatomy and to give functional information in real-time. Current exams are based on the interpretation of a two-dimensional (2-D) image time series, obtained from standard orientations (between the ribs or through the esophagus). Today’s commercially avail- able three-dimensional (3-D) equipment performs the acquisi- tion of a series of 2-D image sequences at different angular positions, via small motor-driven rotations of the image plane over 180 . After image acquisition, a series of 3-D sets over one cardiac cycle is reconstructed, using the images’ echocar- diogram (ECG) tags and their angular positions. The whole pro- cedure typically requires several minutes, which makes it sub- ject to artifacts caused by heart motion and irregular heartbeat. Real-time 3-D, which overcomes these limitations, requires the development of 2-D piezomatrices with embedded electronics capable of parallel beamforming, which is a difficult techno- logical challenge. Yet one can expect that this technology will Manuscript received November 5, 2001; revised July 6, 2002. Asterisk indi- cates corresponding author. *O. Gérard is with the Medisys Group, Philips Research France, 51 rue Carnot, 92156 Suresnes, France (e-mail: [email protected]). A. Collet Billon, J.-M. Rouet, M. Jacob, and M. Fradkin are with the Medisys Group, Philips Research France, 92156 Suresnes, France. C. Allouche was with the Medisys Group, Philips Research France, 92156 Suresnes, France. Digital Object Identifier 10.1109/TMI.2002.804435 become ubiquitous soon. For instance, Philips Medical System Ultrasound—Andover has recently launched on the market a real-time 3-D system that does not compromise image quality. There is no doubt that 3-D increases the benefits of echocar- diography, in particular in the quantification of the heart func- tion [1]. A frequent indication for ultrasound examination in cardiology is the assessment of the left ventricle (LV), which is affected by coronary artery diseases and a number of car- diomyopathies. In standard 2-D echocardiography, this quan- tification is limited to a rather crude volume estimation derived from one or two images and a coarse model of the LV shape; clearly more accurate volume measurements can be expected from 3-D data [2]. Even more interesting are the new possibil- ities that 3-D opens in the estimation of the location and extent of ischemic damages, which can be derived from the quantifi- cation of the kinetics of the LV [3]. Another benefit is the better reproducibility of 3-D-based quantification, an area where 2-D echo is at deficit compared to the other modalities. A prerequisite to the quantification of the LV is the identifi- cation of the inner border of the LV (also known as the endo- cardium). Considering the large amount of data per exam pro- duced by real-time 3-D, manual outlining or other user-guided 2-D based techniques are not compatible with the clinical rou- tine and have to be discarded. Indeed, a fast and robust segmen- tation tool with a high degree of automation is required. This is a challenge because despite the improvements of image quality in the last few years, like tissue harmonic imaging, ultrasound data still exhibit some serious adverse characteristics. In particular, there are large variations of image quality between patients; for instance, the external wall of the LV is frequently hardly visible in the images. Also, the spatial resolution is not isotropic and varies with the position in the data. Among other artifacts, there is a strong speckle noise superimposed on tissues echoes. However, there is evidence that incorporating a priori infor- mation about cardiac anatomy, cardiac physiology, and data ac- quisition in the segmentation procedure can help a great deal in reaching a satisfactory level of robustness and speed of ex- ecution [3]–[5]. The 3-D size and shape characteristics of the LV, and its deformation over a cardiac cycle, are relatively con- sistent and can be fairly well characterized by specific models. Also, the accuracy that is required to properly assess its func- tion is known, as are the possibilities of the imaging modality. Lastly, the geometry of data acquisition relative to the heart pro- vides information about the local data characteristics. In this paper, we present an approach that takes advantage of this a priori knowledge. Fig. 1 shows a flowchart of the successive operations of our quantification tool. 0278-0062/02$17.00 © 2002 IEEE
Transcript of Efficient model-based quantification of left ventricular ...
IEEE TRANSACTIONS ON MEDICAL IMAGING, VOL. 21, NO. 9, SEPTEMBER 2002 1059
Efficient Model-Based Quantification of LeftVentricular Function in 3-D Echocardiography
Olivier Gérard*, Antoine Collet Billon, Jean-Michel Rouet, Marie Jacob, Maxim Fradkin, and Cyril Allouche
Abstract—Quantitative functional analysis of the left ventricleplays a very important role in the diagnosis of heart diseases. Whilein standard two-dimensional echocardiography this quantificationis limited to rather crude volume estimation, three-dimensional(3-D) echocardiography not only significantly improves its accu-racy but also makes it possible to derive valuable additional infor-mation, like various wall-motion measurements. In this paper, wepresent a new efficient method for the functional evaluation of theleft ventricle from 3-D echographic sequences. It comprises a seg-mentation step that is based on the integration of 3-D deformablesurfaces and a four-dimensional statistical heart motion model.The segmentation results in an accurate 3-D+ time left ventriclediscrete representation. Functional descriptors like local wall-mo-tion indexes are automatically derived from this representation.The method has been successfully tested both on electrocardiog-raphy-gated and real-time 3-D data. It has proven to be fast, accu-rate, and robust.
Index Terms—Deformable surfaces, four-dimensional statisticalmodeling, left ventricle function quantification, three-dimensionalechocardiography.
I. INTRODUCTION
ECHOCARDIOGRAPHY has become a major modality inthe diagnosis of heart diseases due to its innocuousness,
the relatively low cost and small size of equipment comparedto other modalities, and its ability to reveal the anatomy andto give functional information in real-time. Current exams arebased on the interpretation of a two-dimensional (2-D) imagetime series, obtained from standard orientations (between theribs or through the esophagus). Today’s commercially avail-able three-dimensional (3-D) equipment performs the acquisi-tion of a series of 2-D image sequences at different angularpositions, via small motor-driven rotations of the image planeover 180 . After image acquisition, a series of 3-D sets overone cardiac cycle is reconstructed, using the images’ echocar-diogram (ECG) tags and their angular positions. The whole pro-cedure typically requires several minutes, which makes it sub-ject to artifacts caused by heart motion and irregular heartbeat.Real-time 3-D, which overcomes these limitations, requires thedevelopment of 2-D piezomatrices with embedded electronicscapable of parallel beamforming, which is a difficult techno-logical challenge. Yet one can expect that this technology will
Manuscript received November 5, 2001; revised July 6, 2002.Asterisk indi-cates corresponding author.
*O. Gérard is with the Medisys Group, Philips Research France, 51 rueCarnot, 92156 Suresnes, France (e-mail: [email protected]).
A. Collet Billon, J.-M. Rouet, M. Jacob, and M. Fradkin are with the MedisysGroup, Philips Research France, 92156 Suresnes, France.
C. Allouche was with the Medisys Group, Philips Research France, 92156Suresnes, France.
Digital Object Identifier 10.1109/TMI.2002.804435
become ubiquitous soon. For instance, Philips Medical SystemUltrasound—Andover has recently launched on the market areal-time 3-D system that does not compromise image quality.
There is no doubt that 3-D increases the benefits of echocar-diography, in particular in the quantification of the heart func-tion [1]. A frequent indication for ultrasound examination incardiology is the assessment of the left ventricle (LV), whichis affected by coronary artery diseases and a number of car-diomyopathies. In standard 2-D echocardiography, this quan-tification is limited to a rather crude volume estimation derivedfrom one or two images and a coarse model of the LV shape;clearly more accurate volume measurements can be expectedfrom 3-D data [2]. Even more interesting are the new possibil-ities that 3-D opens in the estimation of the location and extentof ischemic damages, which can be derived from the quantifi-cation of the kinetics of the LV [3]. Another benefit is the betterreproducibility of 3-D-based quantification, an area where 2-Decho is at deficit compared to the other modalities.
A prerequisite to the quantification of the LV is the identifi-cation of the inner border of the LV (also known as the endo-cardium). Considering the large amount of data per exam pro-duced by real-time 3-D, manual outlining or other user-guided2-D based techniques are not compatible with the clinical rou-tine and have to be discarded. Indeed, a fast and robust segmen-tation tool with a high degree of automation is required. This is achallenge because despite the improvements of image quality inthe last few years, like tissue harmonic imaging, ultrasound datastill exhibit some serious adverse characteristics. In particular,there are large variations of image quality between patients; forinstance, the external wall of the LV is frequently hardly visiblein the images. Also, the spatial resolution is not isotropic andvaries with the position in the data. Among other artifacts, thereis a strong speckle noise superimposed on tissues echoes.
However, there is evidence that incorporating a priori infor-mation about cardiac anatomy, cardiac physiology, and data ac-quisition in the segmentation procedure can help a great dealin reaching a satisfactory level of robustness and speed of ex-ecution [3]–[5]. The 3-D size and shape characteristics of theLV, and its deformation over a cardiac cycle, are relatively con-sistent and can be fairly well characterized by specific models.Also, the accuracy that is required to properly assess its func-tion is known, as are the possibilities of the imaging modality.Lastly, the geometry of data acquisition relative to the heart pro-vides information about the local data characteristics. In thispaper, we present an approach that takes advantage of this apriori knowledge.
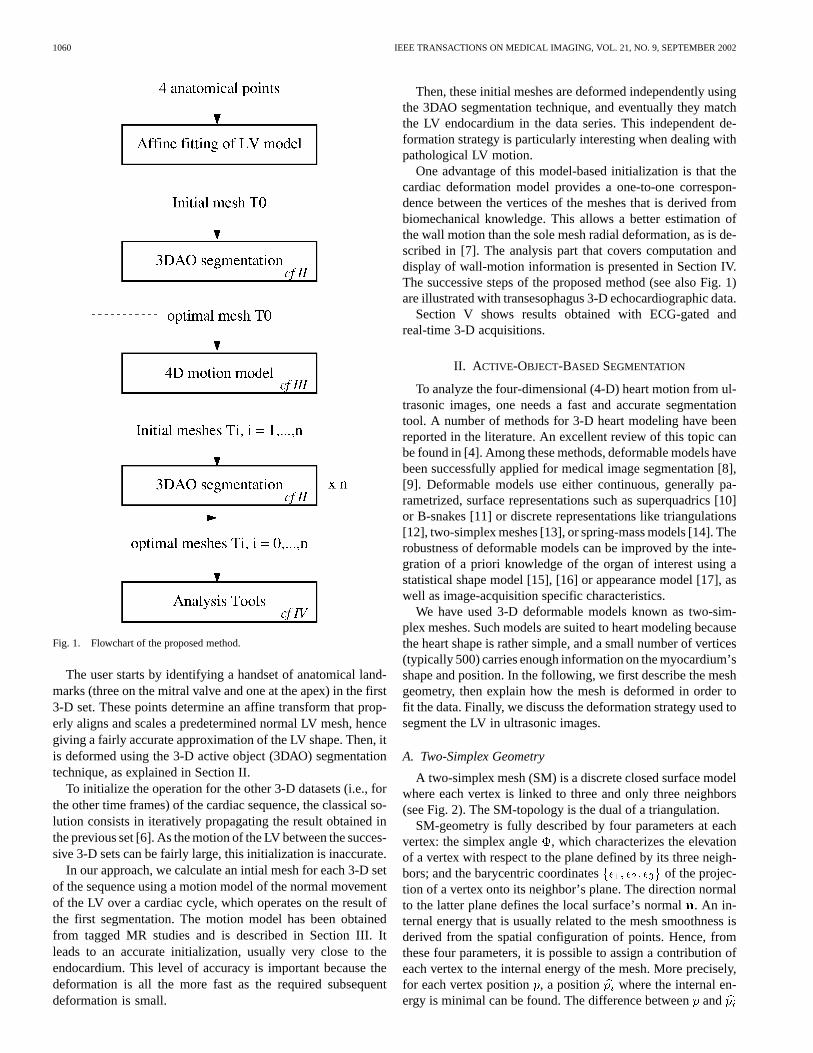
Fig. 1 shows a flowchart of the successive operations of ourquantification tool.
0278-0062/02$17.00 © 2002 IEEE
1060 IEEE TRANSACTIONS ON MEDICAL IMAGING, VOL. 21, NO. 9, SEPTEMBER 2002
Fig. 1. Flowchart of the proposed method.
The user starts by identifying a handset of anatomical land-marks (three on the mitral valve and one at the apex) in the first3-D set. These points determine an affine transform that prop-erly aligns and scales a predetermined normal LV mesh, hencegiving a fairly accurate approximation of the LV shape. Then, itis deformed using the 3-D active object (3DAO) segmentationtechnique, as explained in Section II.
To initialize the operation for the other 3-D datasets (i.e., forthe other time frames) of the cardiac sequence, the classical so-lution consists in iteratively propagating the result obtained inthe previous set [6]. As the motion of the LV between the succes-sive 3-D sets can be fairly large, this initialization is inaccurate.
In our approach, we calculate an intial mesh for each 3-D setof the sequence using a motion model of the normal movementof the LV over a cardiac cycle, which operates on the result ofthe first segmentation. The motion model has been obtainedfrom tagged MR studies and is described in Section III. Itleads to an accurate initialization, usually very close to theendocardium. This level of accuracy is important because thedeformation is all the more fast as the required subsequentdeformation is small.
Then, these initial meshes are deformed independently usingthe 3DAO segmentation technique, and eventually they matchthe LV endocardium in the data series. This independent de-formation strategy is particularly interesting when dealing withpathological LV motion.
One advantage of this model-based initialization is that thecardiac deformation model provides a one-to-one correspon-dence between the vertices of the meshes that is derived frombiomechanical knowledge. This allows a better estimation ofthe wall motion than the sole mesh radial deformation, as is de-scribed in [7]. The analysis part that covers computation anddisplay of wall-motion information is presented in Section IV.The successive steps of the proposed method (see also Fig. 1)are illustrated with transesophagus 3-D echocardiographic data.
Section V shows results obtained with ECG-gated andreal-time 3-D acquisitions.
II. A CTIVE-OBJECT-BASED SEGMENTATION
To analyze the four-dimensional (4-D) heart motion from ul-trasonic images, one needs a fast and accurate segmentationtool. A number of methods for 3-D heart modeling have beenreported in the literature. An excellent review of this topic canbe found in [4]. Among these methods, deformable models havebeen successfully applied for medical image segmentation [8],[9]. Deformable models use either continuous, generally pa-rametrized, surface representations such as superquadrics [10]or B-snakes [11] or discrete representations like triangulations[12], two-simplex meshes [13], or spring-mass models [14]. Therobustness of deformable models can be improved by the inte-gration of a priori knowledge of the organ of interest using astatistical shape model [15], [16] or appearance model [17], aswell as image-acquisition specific characteristics.
We have used 3-D deformable models known as two-sim-plex meshes. Such models are suited to heart modeling becausethe heart shape is rather simple, and a small number of vertices(typically 500) carries enough information on the myocardium’sshape and position. In the following, we first describe the meshgeometry, then explain how the mesh is deformed in order tofit the data. Finally, we discuss the deformation strategy used tosegment the LV in ultrasonic images.
A. Two-Simplex Geometry
A two-simplex mesh (SM) is a discrete closed surface modelwhere each vertex is linked to three and only three neighbors(see Fig. 2). The SM-topology is the dual of a triangulation.
SM-geometry is fully described by four parameters at eachvertex: the simplex angle , which characterizes the elevationof a vertex with respect to the plane defined by its three neigh-bors; and the barycentric coordinates of the projec-tion of a vertex onto its neighbor’s plane. The direction normalto the latter plane defines the local surface’s normal. An in-ternal energy that is usually related to the mesh smoothness isderived from the spatial configuration of points. Hence, fromthese four parameters, it is possible to assign a contribution ofeach vertex to the internal energy of the mesh. More precisely,for each vertex position, a position where the internal en-ergy is minimal can be found. The difference betweenand

GÉRARDet al.: MODEL-BASED QUANTIFICATION OF LEFT VENTRICULAR FUNCTION 1061
Fig. 2. Example of a two-simplex mesh (front and back view). This meshapproximates an LV and can be used as an initialization for the first segmentationprocess.
positions is then considered as an internal force, which islater used in the iterative evolution (5)
(1)
Different kinds of internal energies have been studied and dis-cussed in [13]. For LV segmentation, as the heart shape can beconsidered as smooth, we have chosen internal forces that min-imize the local mesh curvature.
The deformation process (segmentation) is preceded by amesh initialization step. For the segmentation of the LV, weusually start from an SM heart model, if available, or simplyfrom a sphere or an ellipsoid. This first mesh is manuallyoriented and positioned into the dataset.
Some basic operations allow one to modify, either locallyor globally, the mesh resolution (i.e., the mean area of thefacets). This includes face splitting (refinement) and merging(decimation). One original advantage of our implementation isthat the face resolution can be either manually controlled or au-tomatically adapted during the mesh deformation process. Thismethod is based on statistical analysis of the mesh resolutionand on its local adaptation to image features.
B. External Forces Computation
For each vertex, we want to find the location that best fits theimage. In practice, vertices are naturally dragged toward regionswhere the gradient of the image is high. As a search in 3-D istime consuming, we restrict the search along the direction ofthe vertex normal . Moreover, restricting the influence of theexternal forces to the normal direction leads to more reliablemesh deformations with respect to shape conservation and doesnot restrict the class of surface deformation [18]. A rangeonthe normal line controls the extent of the search space for theexternal forces calculation (see Fig. 3). For LV segmentationin ultrasound (US) images, a typical search range value is
mm, but it can be manually set as well, depending on thequality of the initialization.
We found that for US images, a simple approximation of thegradient along a line such as the difference step by step of thevoxel intensities greatly speeds up the process without any no-
Fig. 3. Search line and range definition for external forces on a vertex.
ticeable loss of segmentation accuracy. Hence the optimal posi-tion for a vertex on the search line is the one that satisfies
where (2)
given that the search range interval on the search line is decom-posed using a Bresenham-like algorithm (like the one used in[19]) with an index varying in [ 1], and a step vectorcollinear to the normal . represents then the intensitydifference in image , and
(3)
With this formulation, we look for a point with the largest in-crease of intensity (which corresponds to a black object with abright boundary, like a heart chamber in echography). For eachvertex, we assign a confidence coefficient ranged in [0, 1].Depending on the increase of intensity found, this coefficientis assigned from an S-curve; one corresponds to large intensityincreases, while is close to zero when corresponds to alocation where the intensity difference is too small, i.e., on theorder of the local noise. Moreover, as the inner part of the heartis dark in the US images, we also eliminate points where thegray value is too bright, thus preventing the meshfrom going toward the very bright regions of the image. In thiscase, the confidence coefficient is set to zero. Even if ourformulation may be sensitive to noise and particularly speckle,it is very fast since no global 3-D gradient computation is re-quired, and noise adverse effects are limited by internal forceregularization.
Finally, after the optimal positions have been found, the ex-ternal force can be expressed as
(4)
C. Deformation Strategy
A typical approach for mesh deformation, and thereforeimage segmentation, consists in applying a Newtonian me-chanical model using (1) and (4) with a damping factor
(5)
1062 IEEE TRANSACTIONS ON MEDICAL IMAGING, VOL. 21, NO. 9, SEPTEMBER 2002
In practice, the mass of the vertices is equal to one, as wellas the time step. This simplification is not restrictive as long aswe allow some scaling of external and internal forces [13]. Thusa discrete implementation of (5) results in a Lagrangian model
(6)
In a pure local deformation, this Lagrangian evolution equa-tion can be applied synchronously to all vertices, whereis theposition of a vertex at time, and and are the weighting fac-tors that control the balance between mesh regularity and datafitting.
To improve the segmentation robustness and convergencespeed, a coarse-to-fine strategy is implemented in three steps:
1) manual placement of a coarse mesh;2) mesh deformation with a few degrees of freedom that re-
stricts it to rigid body, similarity, or affine transforms;3) local deformations.In step 1), we start with a coarse heart model that is prop-
erly positioned by aligning the mitral valve plane and the apexdefined with four anatomical landmarks). Step 2) consists inconstraining the apparent motion of each vertex with a globaltransform ( rigid-body; similarity—translation, rotation, andisotropic scaling; or affine transform). The parameters of thistransform are derived from the minimization of the mean squareerror: . For the LV segmentation, we usu-ally use similarity and affine transforms. This step is very fast,and if the approximation looks good enough, the user can reducethe search rangeand therefore speed up the whole process.
Finally, step 3), which is a free deformation, correspondsto the evolution (6). This step can also be considered as acoarse-to-fine algorithm since it gradually increases the meshresolution as the deformation is iterated.
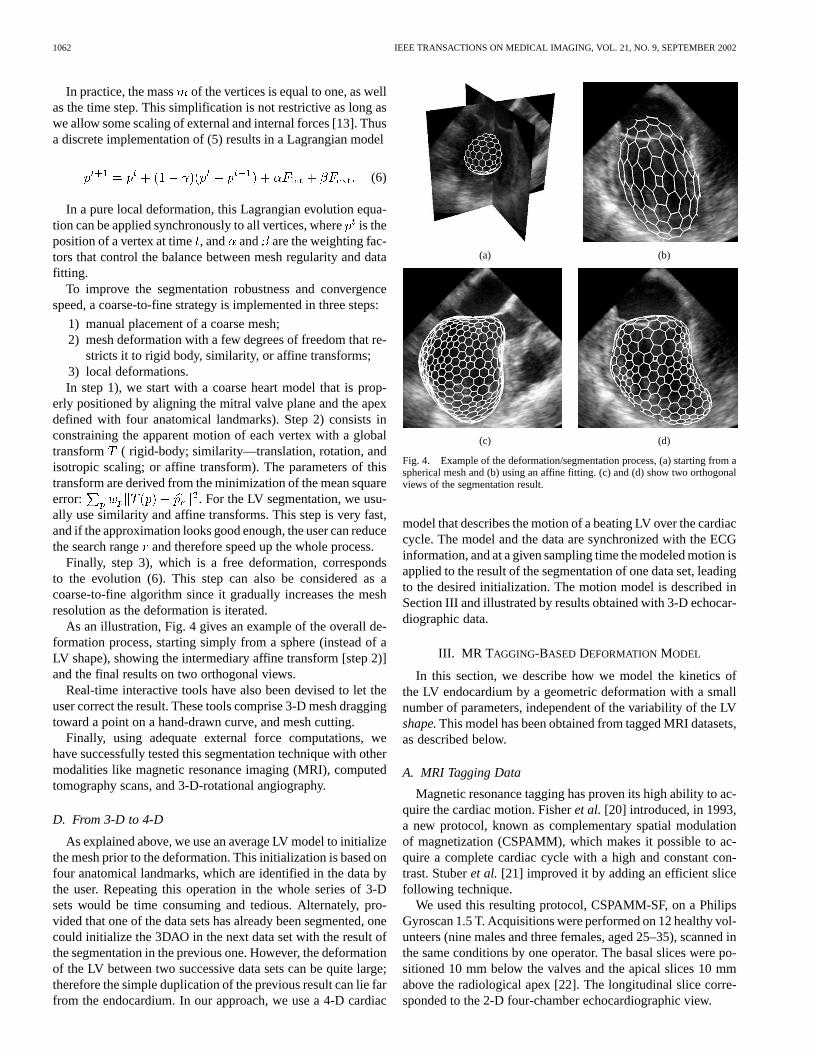
As an illustration, Fig. 4 gives an example of the overall de-formation process, starting simply from a sphere (instead of aLV shape), showing the intermediary affine transform [step 2)]and the final results on two orthogonal views.
Real-time interactive tools have also been devised to let theuser correct the result. These tools comprise 3-D mesh draggingtoward a point on a hand-drawn curve, and mesh cutting.
Finally, using adequate external force computations, wehave successfully tested this segmentation technique with othermodalities like magnetic resonance imaging (MRI), computedtomography scans, and 3-D-rotational angiography.
D. From 3-D to 4-D
As explained above, we use an average LV model to initializethe mesh prior to the deformation. This initialization is based onfour anatomical landmarks, which are identified in the data bythe user. Repeating this operation in the whole series of 3-Dsets would be time consuming and tedious. Alternately, pro-vided that one of the data sets has already been segmented, onecould initialize the 3DAO in the next data set with the result ofthe segmentation in the previous one. However, the deformationof the LV between two successive data sets can be quite large;therefore the simple duplication of the previous result can lie farfrom the endocardium. In our approach, we use a 4-D cardiac
(a) (b)
(c) (d)
Fig. 4. Example of the deformation/segmentation process, (a) starting from aspherical mesh and (b) using an affine fitting. (c) and (d) show two orthogonalviews of the segmentation result.
model that describes the motion of a beating LV over the cardiaccycle. The model and the data are synchronized with the ECGinformation, and at a given sampling time the modeled motion isapplied to the result of the segmentation of one data set, leadingto the desired initialization. The motion model is described inSection III and illustrated by results obtained with 3-D echocar-diographic data.
III. MR T AGGING-BASED DEFORMATION MODEL
In this section, we describe how we model the kinetics ofthe LV endocardium by a geometric deformation with a smallnumber of parameters, independent of the variability of the LVshape.This model has been obtained from tagged MRI datasets,as described below.
A. MRI Tagging Data
Magnetic resonance tagging has proven its high ability to ac-quire the cardiac motion. Fisheret al. [20] introduced, in 1993,a new protocol, known as complementary spatial modulationof magnetization (CSPAMM), which makes it possible to ac-quire a complete cardiac cycle with a high and constant con-trast. Stuberet al. [21] improved it by adding an efficient slicefollowing technique.
We used this resulting protocol, CSPAMM-SF, on a PhilipsGyroscan 1.5 T. Acquisitions were performed on 12 healthy vol-unteers (nine males and three females, aged 25–35), scanned inthe same conditions by one operator. The basal slices were po-sitioned 10 mm below the valves and the apical slices 10 mmabove the radiological apex [22]. The longitudinal slice corre-sponded to the 2-D four-chamber echocardiographic view.

GÉRARDet al.: MODEL-BASED QUANTIFICATION OF LEFT VENTRICULAR FUNCTION 1063
Fig. 5. Referential system for the left ventricle.Z is along the long axis, andXY planes are short axis.
B. Data Processing
In those 2-D slices, the tagging grids and the resulting motionare extracted with a new fully automatic method [23]–[25]. Forthe 3-D motion, in the classical reference system defined by the“short axis” and “long axis” planes (see Fig. 5), our model canbe decomposed in these two directions.
1) In the short-axis plane, we suppose a contraction/dilationand a rotation around the barycenter. Their amplitudes de-pend on . We suppose a linear variation of the modelparameters, between a reference basal slice, where no ro-tation is supposed,1 and an apical slice.
2) In the long-axis plane, we suppose a homogeneous affinedeformation, which lets the radiological apex still.
Then, the deformation is controlled by four temporal parame-ters: the apical contraction , the basal contraction , thelongitudinal contraction , and the apical rotation . Toeliminate the variation of the heartbeats between patients, sometemporal resampling is done between end-diastole (ED, )and end-systole (ES, , characterized by a minimal innervolume). Because of tag contrast dropout during the sequencein some cases, the curves are only computed for the first partof the diastolic relaxation. As the amplitude of the motion alsovaries between patients, each curve is normalized by its valueat end-systole, and then the amplitudes and the normalized tem-poral curves are averaged separately. Figs. 6 and 7 show the fournormalized motion curves of , , , and .
C. Model Application
Let be the -coordinate of the radiological apex, that ofthe apical slice, and that of the basal slice. Then, the expres-sion of the transformation of a vertex at cylindrical coordinates
in the LV referential is
(7)
1Studies show a maximal rotation angle of 3[22], which is negligible forour application.
Fig. 6. Contraction curves for the mean model.
Fig. 7. Apical rotation (or twist) for the mean model.
This procedure is applied individually to all the mesh ver-tices, keeping its topology and the one-to-one correspondenceover the cardiac cycle. Note also that this model can be appliedbetween arbitrary phases of the cardiac cycle. In [26], we showthat, although very compact, this model is quite realistic.
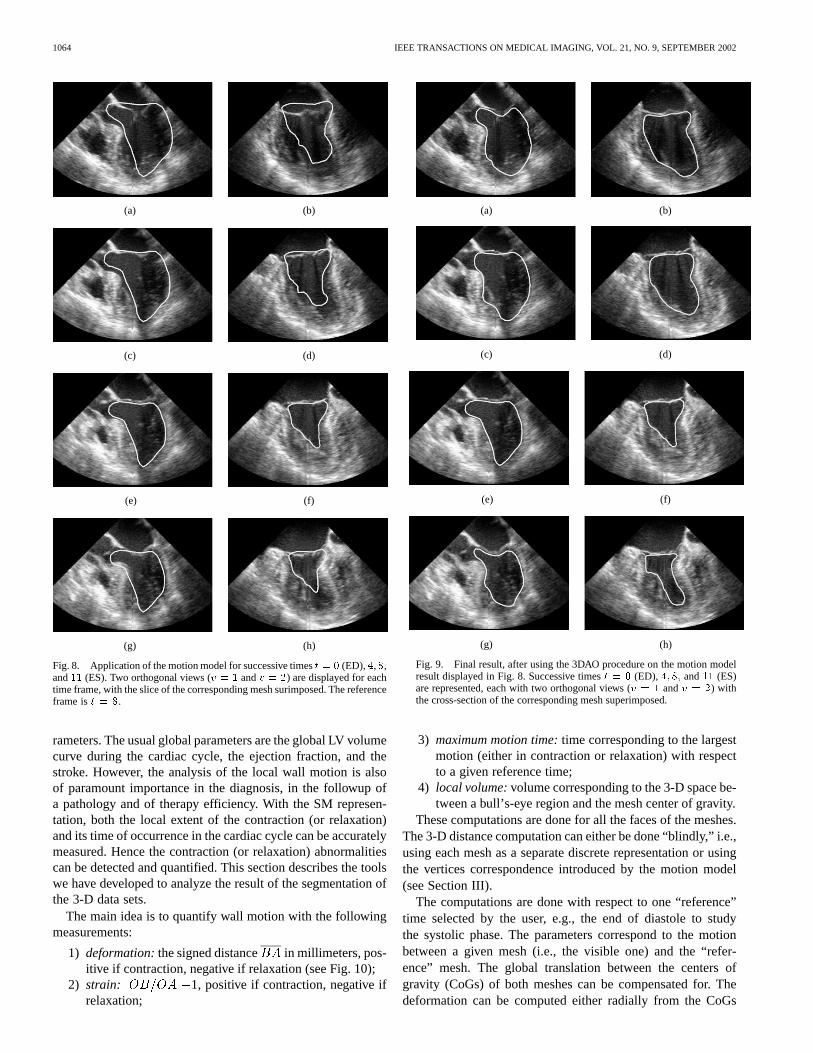
Fig. 8 shows the direct application of the motion model tothe initial mesh, which is the end-diastolic one , alreadypresented in Fig. 4. This figure clearly shows the usefulness ofthe proposed motion model, as the output meshes are close tothe inner wall of the LV.
IV. A NALYSIS TOOLS
As presented in the introduction (and on Fig. 1), the meshesderived from the motion model are further deformed using the3DAO procedure of Section II in order to adapt to the imagedata.
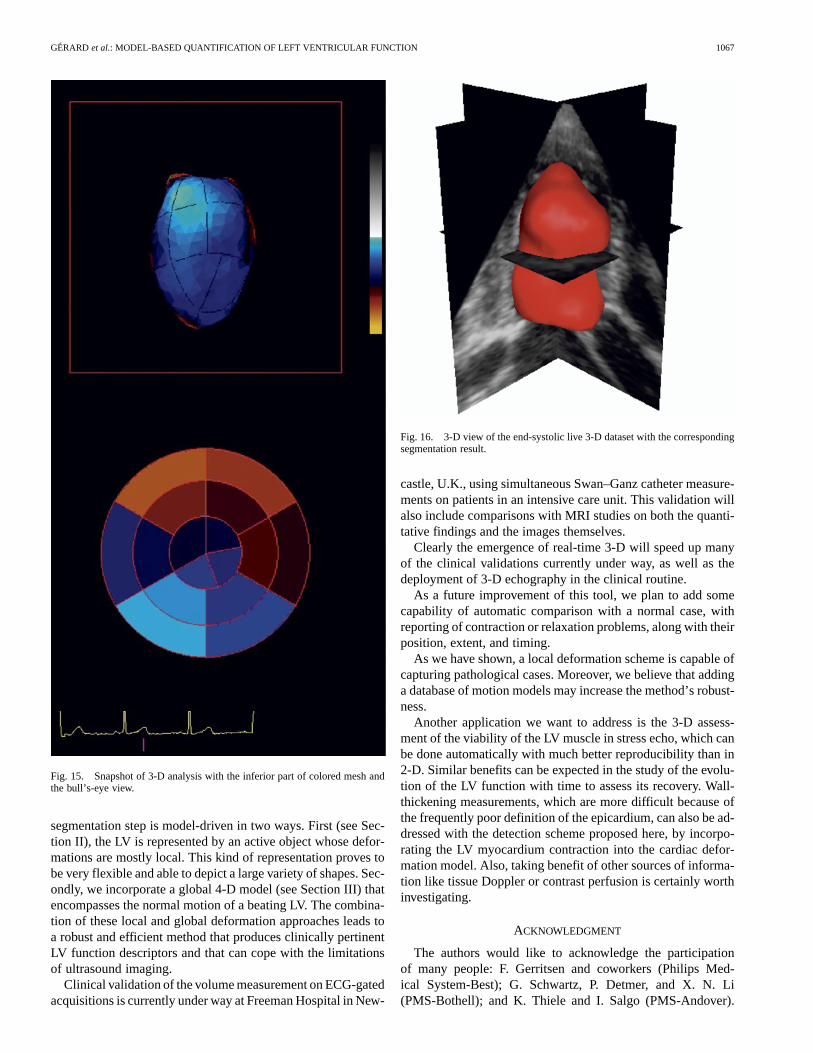
Fig. 9 presents the final results, based on the meshes resultingfrom the motion model presented in Fig. 8. Since the “initial”meshes are close to the endocardium, the segmentation processis fast. Note that the 3DAO segmentation procedure is able toaccurately capture the mitral valve plane, although the motionmodel overestimated its moving [compare views Fig. 9(a) and(b) with corresponding views Fig. 8(a) and (b)].
The resulting series of meshes is a discrete representation ofa complex moving organ. One of the key advantages of this rep-resentation is the ease of computation of quantitative motion pa-
1064 IEEE TRANSACTIONS ON MEDICAL IMAGING, VOL. 21, NO. 9, SEPTEMBER 2002
(a) (b)
(c) (d)
(e) (f)
(g) (h)
Fig. 8. Application of the motion model for successive timest = 0 (ED),4,8,and11 (ES). Two orthogonal views (v = 1 andv = 2) are displayed for eachtime frame, with the slice of the corresponding mesh surimposed. The referenceframe ist = 8.
rameters. The usual global parameters are the global LV volumecurve during the cardiac cycle, the ejection fraction, and thestroke. However, the analysis of the local wall motion is alsoof paramount importance in the diagnosis, in the followup ofa pathology and of therapy efficiency. With the SM represen-tation, both the local extent of the contraction (or relaxation)and its time of occurrence in the cardiac cycle can be accuratelymeasured. Hence the contraction (or relaxation) abnormalitiescan be detected and quantified. This section describes the toolswe have developed to analyze the result of the segmentation ofthe 3-D data sets.
The main idea is to quantify wall motion with the followingmeasurements:
1) deformation:the signed distance in millimeters, pos-itive if contraction, negative if relaxation (see Fig. 10);
2) strain: 1, positive if contraction, negative ifrelaxation;
(a) (b)
(c) (d)
(e) (f)
(g) (h)
Fig. 9. Final result, after using the 3DAO procedure on the motion modelresult displayed in Fig. 8. Successive timest = 0 (ED), 4; 8; and11 (ES)are represented, each with two orthogonal views (v = 1 andv = 2) withthe cross-section of the corresponding mesh superimposed.
3) maximum motion time:time corresponding to the largestmotion (either in contraction or relaxation) with respectto a given reference time;
4) local volume:volume corresponding to the 3-D space be-tween a bull’s-eye region and the mesh center of gravity.
These computations are done for all the faces of the meshes.The 3-D distance computation can either be done “blindly,” i.e.,using each mesh as a separate discrete representation or usingthe vertices correspondence introduced by the motion model(see Section III).
The computations are done with respect to one “reference”time selected by the user, e.g., the end of diastole to studythe systolic phase. The parameters correspond to the motionbetween a given mesh (i.e., the visible one) and the “refer-ence” mesh. The global translation between the centers ofgravity (CoGs) of both meshes can be compensated for. Thedeformation can be computed either radially from the CoGs

GÉRARDet al.: MODEL-BASED QUANTIFICATION OF LEFT VENTRICULAR FUNCTION 1065
Fig. 10. 2-D view of the deformation computation (as in X-ray ventricu-lography). PointO is the center of gravity of the “reference” mesh (or of bothmeshes; see below).
or perpendicularly to the mesh surface (similar to Bolson andSheehan “Centerline” and “CenterSurface” [27]). In practice,the combination of global translation compensation and CoGcentered deformation leads to the most robust results.
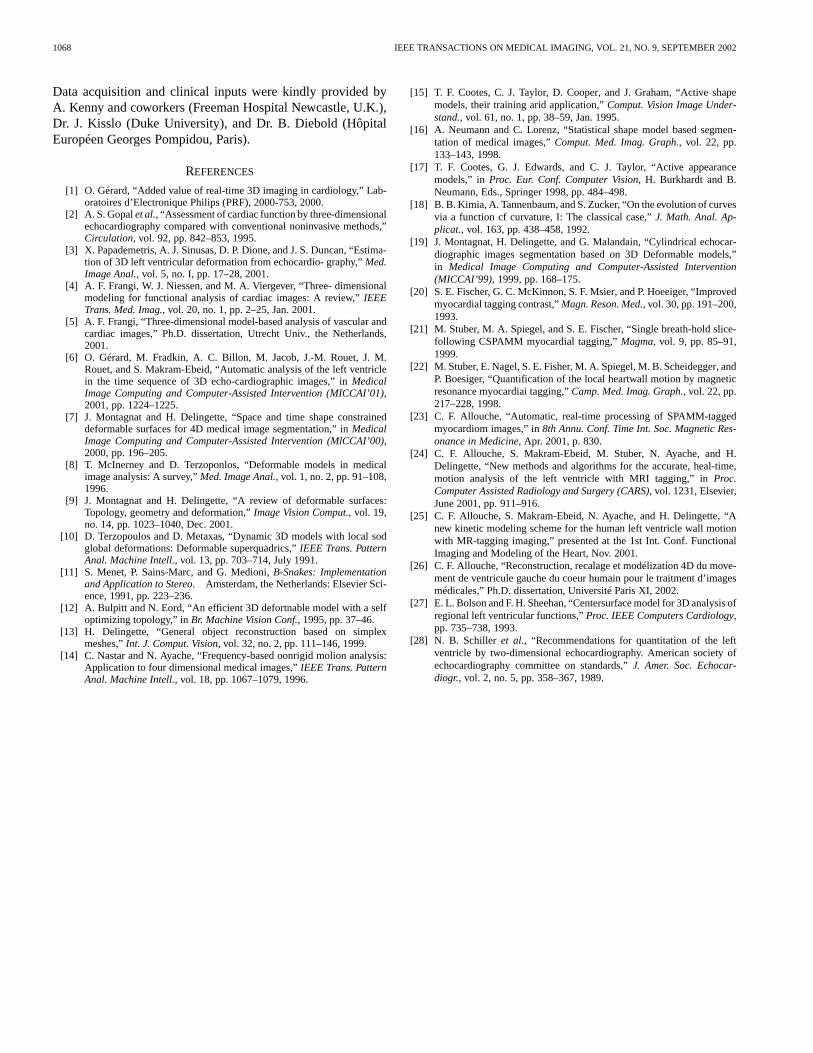
The wall-motion measurements are averaged in each bull’s-eye region. In the average process, each face is weighted byits surface. Then these values are converted into colors, usinga color map that can be adjusted by the user, and displayed si-multaneously on the visible mesh and on the bull’s-eye repre-sentation [28], as shown in Fig. 15. The definition of the 16 polarregions of a bull’s-eye view is determined by the four key pointsalready selected by the user to initialize the SM (see Section II),plus two points corresponding to the anterior and inferior partof the insertion of the right ventricle on the left ventricle. Theselast two points only define the septal regions of the bull’s eyeand do not need to be accurately localized.
The deformation curves of a selected region over a cardiaccycle can also be displayed and compared. The contraction wavepropagation can be assessed.
Fig. 15 shows a view of the wall-motion analysis tool.
V. RESULTS
To validate the 3DAO segmentation procedure,in vitro vol-umetric experiments have been conducted using a beating bal-loon-in-balloon phantom [6]. This validation shows a volumemeasurement error of about 3%, always inferior to the pro-tocol setup precision (5 ml), and a standard deviation inferiorto 1.2 ml.
The results presented hereafter were obtained by using thefollowing procedure (also depicted in Fig. 1).
1) For a given dataset, the segmentation process is initializedusing one coarse LV mesh.
2) The 3DAO segmentation is applied (with the possibilityfor some user correction).
3) This segmentation is “propagated” to the rest of the se-quence, using the motion model presented in Section III.
4) The 3DAO procedure is applied independently to eachvolume of the sequence under the user control.
Fig. 11. Short-axis view of a 3-D gated-TEE dataset. The motion artifacts areclearly visible but are smoothed out by the 3DAO procedure.
To precisely capture the endocardium in one or several timeframes, the user may find it necessary to modify the vertex den-sity of the corresponding meshes. Then, the one-to-one corre-spondence introduced by the motion model is lost but our anal-ysis tool (see Section IV) still works in this case.
All of Sections II and III are illustrated with one trans-esophageal echographic (TEE) datum, acquired using aECG-gated mechanical scanhead, with an angular spacingof 4 . In the following, results obtained with two other TEEdatasets are presented, followed by a recent result with thenew Live 3-D system (Philips Medical System). The presentedresults are segmentation images with cross-sections of themesh superimposed, because the segmentation is the criticalpart, whereas the subsequent quantitative analysis is ratherstraightforward.
A. Results on ECG-Gated Data
First, two partial results are shown on another 3-D ECG-gatedtransesophageal echocardiography.
The first partial result, in Fig. 11, shows that the 3DAO pro-cedure (Section II) is not disrupted by the clearly visible ar-tifacts due to breathing and probe motion during the lengthyECG-gated acquisition. These complex movements lead to arti-facts in the 3-D reconstructed data that are very difficult to cor-rect. Of course, these artifacts are best visible in reconstructedplanes, i.e., the short-axis views in this example.
The second partial result, as shown in Fig. 12 on the samedataset, proves the usability of the motion model described inSection III, even in this very severe case of mitral regurgitationand LV remodeling.
Fig. 13 displays the segmentation results obtained withtransthoracic data. Like TEE datasets, this dataset has beenacquired using a motor-controlled scanhead, gated on theECG. Note that the proposed approach is able to detect theendocardium on these low-quality data that exhibit severe echodropout in the LV free wall part.

1066 IEEE TRANSACTIONS ON MEDICAL IMAGING, VOL. 21, NO. 9, SEPTEMBER 2002
(a) (b)
(c) (d)
Fig. 12. Motion model applied to another TEE ECG-gated acquisition in asevere case of mitral valve regurgitation, between ED (reference) and ES, withthe cross-section of the corresponding mesh superimposed.
(a) (b)
(c) (d)
Fig. 13. Result on a very low-gain 3-D transthoracic acquisition, between EDand ES, with the cross-section of the corresponding mesh.
B. Result on Live 3-D Data
Philips Medical System Andover has recently released theLive 3-D system,2 based on a fully populated matrix array that isable to acquire 3-D volumes in real time without compromisingthe image quality. We present in Fig. 14 preliminary results ob-tained with this new image-acquisition protocol.3
Note that in the example, the papillary muscles are excludedfrom the inner volume of LV, whereas in the current practice,which relies on the adjustment of a crude model in one or two
2First presented during ASE’01 (Conference of the American Society ofEchography), Seattle, WA, June 2001.
3Data reproduced with permission from Duke University by courtesy of Dr.J. Kisslo.
(a) (b)
(c) (d)
(e) (f)
Fig. 14. Result on live 3-D dataset. Short-axis view at mid-LV level betweenED and ES.
images, they are usually included in the LV. Although still de-bated, this choice seems to make more sense for the estimationof blood volumes. With our method, the papillary muscles couldbe included in the segmentation as well by increasing the globalsmoothness constraint (the internal forces of the 3 DAO proce-dure; see Section II). Fig. 12 shows a 3-D view of the segmen-tation result on this live 3-D data set.
VI. CONCLUSION AND DISCUSSION
In this paper, we present a new and efficient method to quan-tify the LV function in 3-D echocardiography.
A method addressing the same problem has been recentlyproposed in [3], based on the tracking of the local echoespatterns in the myocardium. However, the results are obtainedwith open-chest dog heart data, which provide a level ofimage quality that is much better than that usually achieved inthe transthoracic exams. Also the segmentation procedure iscomputationally intensive (3–4 h per dog).
Our method is fast: the whole procedure—including user in-teraction—takes less than 4 min on standard PC hardware. The
GÉRARDet al.: MODEL-BASED QUANTIFICATION OF LEFT VENTRICULAR FUNCTION 1067
Fig. 15. Snapshot of 3-D analysis with the inferior part of colored mesh andthe bull’s-eye view.
segmentation step is model-driven in two ways. First (see Sec-tion II), the LV is represented by an active object whose defor-mations are mostly local. This kind of representation proves tobe very flexible and able to depict a large variety of shapes. Sec-ondly, we incorporate a global 4-D model (see Section III) thatencompasses the normal motion of a beating LV. The combina-tion of these local and global deformation approaches leads toa robust and efficient method that produces clinically pertinentLV function descriptors and that can cope with the limitationsof ultrasound imaging.
Clinical validation of the volume measurement on ECG-gatedacquisitions is currently under way at Freeman Hospital in New-
Fig. 16. 3-D view of the end-systolic live 3-D dataset with the correspondingsegmentation result.
castle, U.K., using simultaneous Swan–Ganz catheter measure-ments on patients in an intensive care unit. This validation willalso include comparisons with MRI studies on both the quanti-tative findings and the images themselves.
Clearly the emergence of real-time 3-D will speed up manyof the clinical validations currently under way, as well as thedeployment of 3-D echography in the clinical routine.
As a future improvement of this tool, we plan to add somecapability of automatic comparison with a normal case, withreporting of contraction or relaxation problems, along with theirposition, extent, and timing.
As we have shown, a local deformation scheme is capable ofcapturing pathological cases. Moreover, we believe that addinga database of motion models may increase the method’s robust-ness.
Another application we want to address is the 3-D assess-ment of the viability of the LV muscle in stress echo, which canbe done automatically with much better reproducibility than in2-D. Similar benefits can be expected in the study of the evolu-tion of the LV function with time to assess its recovery. Wall-thickening measurements, which are more difficult because ofthe frequently poor definition of the epicardium, can also be ad-dressed with the detection scheme proposed here, by incorpo-rating the LV myocardium contraction into the cardiac defor-mation model. Also, taking benefit of other sources of informa-tion like tissue Doppler or contrast perfusion is certainly worthinvestigating.
ACKNOWLEDGMENT
The authors would like to acknowledge the participationof many people: F. Gerritsen and coworkers (Philips Med-ical System-Best); G. Schwartz, P. Detmer, and X. N. Li(PMS-Bothell); and K. Thiele and I. Salgo (PMS-Andover).
1068 IEEE TRANSACTIONS ON MEDICAL IMAGING, VOL. 21, NO. 9, SEPTEMBER 2002
Data acquisition and clinical inputs were kindly provided byA. Kenny and coworkers (Freeman Hospital Newcastle, U.K.),Dr. J. Kisslo (Duke University), and Dr. B. Diebold (HôpitalEuropéen Georges Pompidou, Paris).
REFERENCES
[1] O. Gérard, “Added value of real-time 3D imaging in cardiology,” Lab-oratoires d’Electronique Philips (PRF), 2000-753, 2000.
[2] A. S. Gopalet al., “Assessment of cardiac function by three-dimensionalechocardiography compared with conventional noninvasive methods,”Circulation, vol. 92, pp. 842–853, 1995.
[3] X. Papademetris, A. J. Sinusas, D. P. Dione, and J. S. Duncan, “Estima-tion of 3D left ventricular deformation from echocardio- graphy,”Med.Image Anal., vol. 5, no. I, pp. 17–28, 2001.
[4] A. F. Frangi, W. J. Niessen, and M. A. Viergever, “Three- dimensionalmodeling for functional analysis of cardiac images: A review,”IEEETrans. Med. Imag., vol. 20, no. 1, pp. 2–25, Jan. 2001.
[5] A. F. Frangi, “Three-dimensional model-based analysis of vascular andcardiac images,” Ph.D. dissertation, Utrecht Univ., the Netherlands,2001.
[6] O. Gérard, M. Fradkin, A. C. Billon, M. Jacob, J.-M. Rouet, J. M.Rouet, and S. Makram-Ebeid, “Automatic analysis of the left ventriclein the time sequence of 3D echo-cardiographic images,” inMedicalImage Computing and Computer-Assisted Intervention (MICCAI’01),2001, pp. 1224–1225.
[7] J. Montagnat and H. Delingette, “Space and time shape constraineddeformable surfaces for 4D medical image segmentation,” inMedicalImage Computing and Computer-Assisted Intervention (MlCCAI’00),2000, pp. 196–205.
[8] T. McInerney and D. Terzoponlos, “Deformable models in medicalimage analysis: A survey,”Med. Image Anal., vol. 1, no. 2, pp. 91–108,1996.
[9] J. Montagnat and H. Delingette, “A review of deformable surfaces:Topology, geometry and deformation,”Image Vision Comput., vol. 19,no. 14, pp. 1023–1040, Dec. 2001.
[10] D. Terzopoulos and D. Metaxas, “Dynamic 3D models with local sodglobal deformations: Deformable superquadrics,”IEEE Trans. PatternAnal. Machine Intell., vol. 13, pp. 703–714, July 1991.
[11] S. Menet, P. Sains-Marc, and G. Medioni,B-Snakes: Implementationand Application to Stereo. Amsterdam, the Netherlands: Elsevier Sci-ence, 1991, pp. 223–236.
[12] A. Bulpitt and N. Eord, “An efficient 3D defortnable model with a selfoptimizing topology,” inBr. Machine Vision Conf., 1995, pp. 37–46.
[13] H. Delingette, “General object reconstruction based on simplexmeshes,”Int. J. Comput. Vision, vol. 32, no. 2, pp. 111–146, 1999.
[14] C. Nastar and N. Ayache, “Frequency-based oonrigid molion analysis:Application to four dimensional medical images,”IEEE Trans. PatternAnal. Machine Intell., vol. 18, pp. 1067–1079, 1996.
[15] T. F. Cootes, C. J. Taylor, D. Cooper, and J. Graham, “Active shapemodels, their training arid application,”Comput. Vision Image Under-stand., vol. 61, no. 1, pp. 38–59, Jan. 1995.
[16] A. Neumann and C. Lorenz, “Statistical shape model based segmen-tation of medical images,”Comput. Med. Imag. Graph., vol. 22, pp.133–143, 1998.
[17] T. F. Cootes, G. J. Edwards, and C. J. Taylor, “Active appearancemodels,” in Proc. Eur. Conf. Computer Vision, H. Burkhardt and B.Neumann, Eds., Springer 1998, pp. 484–498.
[18] B. B. Kimia, A. Tannenbaum, and S. Zucker, “On the evolution of curvesvia a function cf curvature, I: The classical case,”J. Math. Anal. Ap-plicat., vol. 163, pp. 438–458, 1992.
[19] J. Montagnat, H. Delingette, and G. Malandain, “Cylindrical echocar-diographic images segmentation based on 3D Deformable models,”in Medical Image Computing and Computer-Assisted Intervention(MICCAI’99), 1999, pp. 168–175.
[20] S. E. Fischer, G. C. McKinnon, S. F. Msier, and P. Hoeeiger, “Improvedmyocardial tagging contrast,”Magn. Reson. Med., vol. 30, pp. 191–200,1993.
[21] M. Stuber, M. A. Spiegel, and S. E. Fischer, “Single breath-hold slice-following CSPAMM myocardial tagging,”Magma, vol. 9, pp. 85–91,1999.
[22] M. Stuber, E. Nagel, S. E. Fisher, M. A. Spiegel, M. B. Scheidegger, andP. Boesiger, “Quantification of the local heartwall motion by magneticresonance myocardiai tagging,”Camp. Med. Imag. Graph., vol. 22, pp.217–228, 1998.
[23] C. F. Allouche, “Automatic, real-time processing of SPAMM-taggedmyocardiom images,” in8th Annu. Conf. Time Int. Soc. Magnetic Res-onance in Medicine, Apr. 2001, p. 830.
[24] C. F. Allouche, S. Makram-Ebeid, M. Stuber, N. Ayache, and H.Delingette, “New methods and algorithms for the accurate, heal-time,motion analysis of the left ventricle with MRI tagging,” inProc.Computer Assisted Radiology and Surgery (CARS), vol. 1231, Elsevier,June 2001, pp. 911–916.
[25] C. F. Allouche, S. Makram-Ebeid, N. Ayache, and H. Delingette, “Anew kinetic modeling scheme for the human left ventricle wall motionwith MR-tagging imaging,” presented at the 1st Int. Conf. FunctionalImaging and Modeling of the Heart, Nov. 2001.
[26] C. F. Allouche, “Reconstruction, recalage et modélization 4D du move-ment de ventricule gauche du coeur humain pour le traitment d’imagesmédicales,” Ph.D. dissertation, Université Paris XI, 2002.
[27] E. L. Bolson and F. H. Sheehan, “Centersurface model for 3D analysis ofregional left ventricular functions,”Proc. IEEE Computers Cardiology,pp. 735–738, 1993.
[28] N. B. Schiller et al., “Recommendations for quantitation of the leftventricle by two-dimensional echocardiography. American society ofechocardiography committee on standards,”J. Amer. Soc. Echocar-diogr., vol. 2, no. 5, pp. 358–367, 1989.