Effects of Thermal Treatment on Mineral Composition and ...
14
Research Article Effects of Thermal Treatment on Mineral Composition and Pore Structure of Coal Bin Liu , 1,2 Teng Teng , 1,2 Zhenhua Jiao , 2 and Shaobo Li 2 1 Key Laboratory of Safety and High-Efficiency Coal Mining, Ministry of Education (Anhui University of Science and Technology), Huainan 232001, China 2 State Key Laboratory of Mining Response and Disaster Prevention and Control in Deep Coal Mines, Anhui University of Science and Technology, Huainan 232001, China Correspondence should be addressed to Bin Liu; [email protected] and Teng Teng; [email protected] Received 25 May 2021; Accepted 22 July 2021; Published 12 August 2021 Academic Editor: Wei Zhao Copyright © 2021 Bin Liu et al. This is an open access article distributed under the Creative Commons Attribution License, which permits unrestricted use, distribution, and reproduction in any medium, provided the original work is properly cited. With the increasing depth of coalbed methane (CBM) exploitation, temperature becomes the main factor affecting the efficiency of CBM exploitation. The change of temperature has significant influence on the mineral composition and pore structure of coal. To study the effects of thermal treatment on mineral composition and pore structure of coal, X-ray diffraction (XRD) test, scanning electron microscopy (SEM) test, and mercury intrusion test were carried out for three groups of coal. The mineral composition and pore structure of coal specimens after thermal treatment (25, 50, 75, and 100 ° C) were analyzed. The results show that the main mineral compositions of three groups of coal specimens after different temperatures are basically unchanged, and the maximum diffracted intensity after different temperature treatments decreases first and then increases with the increasing temperature. The count of fissures decreases first and then increases with temperature, and the count of pores increases first and then decreases with the increasing temperature. The velocity of mercury injection in high pressure (100~400 MPa) of coal specimens increases first and then decreases with temperature. The porosity, pore area, median pore diameter, and average pore diameter increase with the increasing temperatures. The volume of microfracture decreases, then increases, and finally decreases. The volume of macropore and mesopore increases slowly, and that of transition pore decreases slowly with the increasing temperature. Meanwhile, the volume of micropore increases first and then decreases during the process of thermal treatment. The fractal dimension of pore size ranges from 2.6 to 2.9 and increases linearly with the increasing temperature. 1. Introduction With the depletion of shallow coal resources, more and more coal mines are entering the deep mining stages. The high ground stress, high temperature, and high water pressure restrict the safe and efficient mining of deep coal resources [1–3]. Coalbed methane (CBM) is a form of low-carbon clean energy, which is important for optimizing energy production and achieving carbon neutrality goals [4–6]. The temperature has significant influence on permeability and porosity of coal, which is important for the efficiency of CBM exploitation [7– 9]. Therefore, it is urgent to study the evolution of mineral composition and microstructure of coal after different tem- perature treatments. Previous studies have proved that rocks and rock-like materials have significant thermal effects, and the physical and mechanical properties change significantly after thermal treatment. The physical and mechanical properties of granite after temperature treatments have been a research hotspot for underground nuclear waste disposal, and many scholars have analyzed its physical and mechanical properties, such as fracture toughness [10], rockburst proneness [11], uniaxial compressive strength [12, 13], elastic modulus [13], longitu- dinal wave velocity [13], mechanical behavior [14, 15], tensile strength [12, 16, 17], acoustic emission characteristics [18, 19], mineral composition [20], pore structure [16, 20, 21], and permeability [22]. The physical and mechanical proper- ties of sandstone after temperature treatments have also Hindawi Geofluids Volume 2021, Article ID 5939690, 14 pages https://doi.org/10.1155/2021/5939690
Transcript of Effects of Thermal Treatment on Mineral Composition and ...

Research ArticleEffects of Thermal Treatment on Mineral Composition and PoreStructure of Coal
Bin Liu ,1,2 Teng Teng ,1,2 Zhenhua Jiao ,2 and Shaobo Li2
1Key Laboratory of Safety and High-Efficiency Coal Mining, Ministry of Education (Anhui University of Science and Technology),Huainan 232001, China2State Key Laboratory of Mining Response and Disaster Prevention and Control in Deep Coal Mines, Anhui University of Scienceand Technology, Huainan 232001, China
Correspondence should be addressed to Bin Liu; [email protected] and Teng Teng; [email protected]
Received 25 May 2021; Accepted 22 July 2021; Published 12 August 2021
Academic Editor: Wei Zhao
Copyright © 2021 Bin Liu et al. This is an open access article distributed under the Creative Commons Attribution License, whichpermits unrestricted use, distribution, and reproduction in any medium, provided the original work is properly cited.
With the increasing depth of coalbed methane (CBM) exploitation, temperature becomes the main factor affecting the efficiency ofCBM exploitation. The change of temperature has significant influence on the mineral composition and pore structure of coal. Tostudy the effects of thermal treatment on mineral composition and pore structure of coal, X-ray diffraction (XRD) test, scanningelectron microscopy (SEM) test, and mercury intrusion test were carried out for three groups of coal. The mineral compositionand pore structure of coal specimens after thermal treatment (25, 50, 75, and 100°C) were analyzed. The results show that themain mineral compositions of three groups of coal specimens after different temperatures are basically unchanged, and themaximum diffracted intensity after different temperature treatments decreases first and then increases with the increasingtemperature. The count of fissures decreases first and then increases with temperature, and the count of pores increases first andthen decreases with the increasing temperature. The velocity of mercury injection in high pressure (100~400MPa) of coalspecimens increases first and then decreases with temperature. The porosity, pore area, median pore diameter, and average porediameter increase with the increasing temperatures. The volume of microfracture decreases, then increases, and finally decreases.The volume of macropore and mesopore increases slowly, and that of transition pore decreases slowly with the increasingtemperature. Meanwhile, the volume of micropore increases first and then decreases during the process of thermal treatment.The fractal dimension of pore size ranges from 2.6 to 2.9 and increases linearly with the increasing temperature.
1. Introduction
With the depletion of shallow coal resources, more and morecoal mines are entering the deep mining stages. The highground stress, high temperature, and high water pressurerestrict the safe and efficient mining of deep coal resources[1–3]. Coalbed methane (CBM) is a form of low-carbon cleanenergy, which is important for optimizing energy productionand achieving carbon neutrality goals [4–6]. The temperaturehas significant influence on permeability and porosity of coal,which is important for the efficiency of CBM exploitation [7–9]. Therefore, it is urgent to study the evolution of mineralcomposition and microstructure of coal after different tem-perature treatments.
Previous studies have proved that rocks and rock-likematerials have significant thermal effects, and the physicaland mechanical properties change significantly after thermaltreatment. The physical and mechanical properties of graniteafter temperature treatments have been a research hotspotfor underground nuclear waste disposal, and many scholarshave analyzed its physical and mechanical properties, suchas fracture toughness [10], rockburst proneness [11], uniaxialcompressive strength [12, 13], elastic modulus [13], longitu-dinal wave velocity [13], mechanical behavior [14, 15], tensilestrength [12, 16, 17], acoustic emission characteristics [18,19], mineral composition [20], pore structure [16, 20, 21],and permeability [22]. The physical and mechanical proper-ties of sandstone after temperature treatments have also
HindawiGeofluidsVolume 2021, Article ID 5939690, 14 pageshttps://doi.org/10.1155/2021/5939690

attracted a lot of attention; the properties such as thermalcracking process [23], peak strength [24], mechanical behav-ior in unloading conditions [25], wave velocity [26, 27],porosity [27], triaxial mechanical behavior [28], permeabilitybehavior [28], microstructure [26], pore characteristics [29,30], elastic modulus [29], tensile strength [31], energy evolu-tion [32], microstructure deterioration [33], and morpholog-ical properties [34] have been investigated in depth. Thephysical property and tensile strength of shale have been alsoanalyzed [35, 36]. Peng et al. and Rong et al. analyzed thephysical andmechanical behaviors of thermal-damagedmar-ble [37, 38]. The microstructure characteristic, mechanicalbehaviors, pore distribution, and AE characteristic of lime-stone have been investigated [39–41]. Yavuz et al. [42] inves-tigated the changes of physical properties of five carbonaterocks (two marbles and three limestones) after different heat-ing temperatures. The unconfined compressive strength andelastic moduli of gabbro after thermal loading have beenstudied by Keshavarz et al. [43]. Brotóns et al. [44] investi-gated the effect of thermal treatment on physical andmechanical properties of calcarenite. Ugur et al. [45] studiedthe changes in porosity features of natural stones after ther-mal treatment. The effect of thermal treatment on petro-graphic and mineralogical composition of coal miningwastes was analyzed by Nowak [46]. Tian et al. [47] investi-gated the changes of physical and mechanical behavior ofclaystone due to the thermal treatment, such as uniaxial com-pressive strength, triaxial compressive strength, and density.The grain size distribution and mineral composition of fluxcalcined porcelanites after thermal treatment have been stud-ied by Saidi et al. [48]. Ersoy et al. [49] analyzed the mineral-ogical and geomechanical properties of volcanic rockssubjected to high temperatures. The effect of temperatureon pore structure and mechanical properties of shotcretewas studied by Liu et al. [50]. Miao et al. investigated the evo-lution of coal pore-fracture during the thermal damage pro-cess [51]. The above studies mainly focus on physical and
mechanical properties of dense hard rocks (granite, sand-stone, marble, shale, and gabbro). The main reason is thatthese dense rock strata are often at high temperatures whenstoring nuclear waste. Meanwhile, the high temperature inthose studies generally exceeds 500°C. However, the geother-mal temperature increases by 25~30°C with an increase of1000m in mining depth, and the geothermal temperature isgenerally below 100°C in deep coal mining. Therefore, thetemperature of thermal treatment ranges from 25 to 100°Cin this study.
Coal, as an anisotropic medium, is highly sensitive totemperature. The structure and mechanical properties of coalwill change significantly when the temperature changes, thusaffecting the permeability and porosity of coal. To analyze thechanges of physical and mechanical properties from a micro-scopic point of view, the X-ray diffraction (XRD) tests, mer-cury intrusion tests, and scanning electron microscopy(SEM) tests were carried out for three groups of coal afterthermal treatment at different temperatures (25, 50, 75, and100°C). The mineral composition and microstructure of coalspecimens after thermal treatment were analyzed, and veloc-ity of mercury injection, pore parameters, and distribution ofpore size for three groups of coal were investigated based onthe mercury intrusion tests. The result is significance forCBM exploitation and gas extraction.
2. Experimental Scheme
2.1. Specimen Preparation. As shown in Figure 1, the coalblocks were collected from Jingjia Coal Mine, Changzhi CoalMine, and Pingdingshan Coal Mine, respectively. Jingjia CoalMine is located in southwest of Guizhou Province, China.Changzhi Coal Mine is located in the southeast of ShanxiProvince, China. Pingdingshan Coal Mine is located in themiddle of Henan Province, China. The coal blocks werecrushed into coal lumps with the dimension less than30mm in length, width, and height (Figure 1), and the coal
Changzhi
Pingdingshan
Jingjia
Jingjia
Changzhi
Pingdingshan
Figure 1: Location of the study areas and coal specimens.
2 Geofluids

0
400
800
1200
1600
0
400
800
1200
0400800
12001600
10 20 30 40
2θ (º)
50 60 700
400800
12001600
K
Ca KCa
Cl
K K KK K K
Inte
nsity
(a)
C K
K
K Q
K KK
0400800
12001600
0
400
800
1200
0
400
800
1200
10 20 30 40
2θ (º)
50 60 700
400
800
1200
Inte
nsity
(b)
Figure 2: Continued.
3Geofluids

0400800
12001600
0400800
1200
400
8001200
10 20 30 40 50 60 700
400800
12001600
C KK
K
M K K K
25 ºC50 ºC
75 ºC100 ºC
K M K
C: ClairiteCl: ClinochloreCa: Calcium phosphateK: KaoliniteM: MontmorilloniteQ: Quartz
Inte
nsity
2θ (º)
(c)
Figure 2: XRD patterns of three groups of coal specimens after different temperature treatments: (a) JJ coal specimen, (b) CZ coal specimen,and (c) PDS coal specimen.
Fissure
Fissure
Fissure
Pore Pore
Pore
Pore
spot3.0
WD13.8 mm
mag1000×
HV30.00 kv
vac modehigh vacuum
detETD
100 μmQuanta 250
spot3.0
WD18.0 mm
mag1000×
HV30.00 kv
vac modehigh vacuum
detETD
100 μmQuanta 250
spot3.0
WD19.3 mm
mag1000×
HV30.00 kv
vac modehigh vacuum
detETD
100 μmQuanta 250
HV25.00 kv
WD18.5 mm
mag1000×
HFW298 μm
modeSE
spot3.0
detETD
100 μmAACC
50 ºC25 ºC
75 ºC 100 ºC
Figure 3: The SEM images of JJ coal specimens after different temperature treatments.
4 Geofluids

lumps with smooth surface were selected for the mercuryintrusion tests and SEM tests after thermal treatment. Thecoal lumps were milled to coal powder for XRD tests afterthermal treatment. The coal specimens from Jingjia CoalMine, Changzhi Coal Mine, and Pingdingshan Coal Minewere marked as JJ, CZ, and PDS, respectively.
2.2. Experimental Equipment and Process. Before the test, thethree groups of coal lumps were heated to target temperature(25, 50, 75, and 100°C) in the drying oven and kept at a targettemperature for 24 hours, and then, the coal lumps weresealed and cooled naturally to room temperature. The coallumps after thermal treatments were prepared for the XRD,SEM, and mercury intrusion tests to analyze the variationof mineral composition, microstructure, and pore structure.
The XRD test was performed on D8 ADVANCE X-rayDiffractometer (BRUKER Corporation, Germany). Theradius of goniometer is 250mm, divergence slit is 0.6mm,and antiscatter silt is 8mm. The coal powder was milledand sieved to pass through a 325 mesh sieve, and the massof each group of coal powder was not less than 0.5 g. The coalpowder was poured into the center of a clean sample tray andthen capped with a clean glass sheet to flatten the surface ofthe coal powder. Then, the mineral composition can be mea-sured. The next coal powder is measured after the coal pow-der measurement completed.
The mercury intrusion test was conducted on AutoporeIV 9510 Automatic Mercury Porosimeter. The working pres-sure ranges from 0 to 60000 psi (414MPa), and the measure-ment range of pore size is 0.003~1000μm. According to theprevious research [52], the contact angle was set to 130°,and the mercury (Hg) surface tension was set to 0.485N/m.The mercury intrusion tests were carried out on three groupsof coal specimens, and the related parameters such as poresize distribution, total pore volume, and total pore area canbe obtained after the test.
The specimens were scanned by Quanta 250™ SEM scan-ner (FEI, USA). The electron beam voltage ranges from 200Vto 30 kV, and the range of magnification is 6~1000000.Before the test, the sample is first placed in the sample binand then vacuumed. The region of interest (ROI) was magni-fied by 400, 1000, 3000, 10000, and 20000 times, respectively,and the SEM images were stored simultaneously.
3. Results and Discussions
3.1. Mineral Composition after Thermal Treatment. XRDtests are commonly used to investigate the mineral composi-tion of coal and rock materials [20, 39, 46, 53, 54]. Therefore,XRD tests were carried out on coal powder after different tem-perature treatments (25, 50, 75, and 100°C). As shown inFigure 2, the mainmineral composition of three groups of coal
Fissure
Pore
spot3.0
WD15.1 mm
HV30.00 kv
vac modehigh vacuum
detETD
100 μmQuanta 250
mag1000×
Pore
spot3.0
WD15.8 mm
HV30.00 kv
vac modehigh vacuum
detETD
100 μmQuanta 250
mag1000×
Porespot3.0
WD13.7 mm
HV25.00 kv
vac modehigh vacuum
detETD
100 μmQuanta 250
mag1000×
Fissure
Pore
spot3.0
WD16.8 mm
HV30.00 kv
vac modehigh vacuum
detETD
100 μmQuanta 250
mag1000×
50 ºC25 ºC
75 ºC 100 ºC
Figure 4: The SEM images of CZ coal specimens after different temperature treatments.
5Geofluids

specimens is basically unchanged; namely, no chemicalchanges occur after the thermal treatment. The result is con-sistent with that of granite [20]. As shown in Figure 2(a), themain mineral compositions of JJ coal specimens are kaolinite,calcium phosphate, and clinochlore. The maximum diffractedintensity is 1506 at 25°C, decreases at 50°C, and then increasesto the peak of 1605 at 100°C. As shown in Figure 2(b), themineral compositions are kaolinite, quartz, and clairite forCZ coal specimens. The maximum diffraction intensity is1575 at 25°C, decreases to 1250 at 75°C, and then increasesto 1323 at 100°C. As shown in Figure 2(c), the mineral compo-sitions of PDS coal specimens are kaolinite, clairite, and mont-morillonite. The maximum diffraction intensity is 1601 at25°C, decreases to 1264 at 75°C, and then increases to 1492at 100°C. Thus, the maximum diffracted intensity of threegroups of coal specimens after different temperature treat-ments decreases first and then increases with the increasingtemperature. The phenomena are mainly caused by thermaltreatment and the anisotropy of coal specimens. In summary,there is no change in the main mineral compositions, and themaximum diffracted intensity changes a little after heat treat-ment. The maximum diffracted intensity after different tem-perature treatments decreases first and then increases withthe increasing temperature.
3.2. Microstructure after Thermal Treatment. SEM tests arecommonly used to investigate the microstructure of cross-
sections of coal and rock materials [26, 33, 34, 39, 41, 51,55]. Therefore, SEM tests were carried out on coal samplesafter different temperature treatments (25, 50, 75, and100°C). The regions of interest (ROI) of coal specimens weremagnified by 400, 1000, 3000, 10000, and 20000 times,respectively. The SEM images of three groups of coal speci-mens after different temperature treatments are shown inFigures 3–5, which were magnified by 1000 times. As shownin Figure 3, the fissure width is large at the temperature of25°C, and there are no obvious fissures at the temperatureof 100°C. Thus, the fissure width decreases with the increas-ing temperature. Meanwhile, there are a few pores generatedafter thermal treatment. Similarly, it can be seen fromFigure 4 that the pores grow with the rise of temperature ofthermal treatment, and the fissure width decreases with theincreasing temperature. As shown in Figure 5, the fissurewidth decreases first and then increases with the rise of tem-perature of thermal treatment, and there are many pores gen-erated after thermal treatment. Thus, thermal treatment has asignificant effect on microstructure of coal specimens, whichis related to the permeability. In summary, the count of fis-sures decreases first and then increases with the increasingtemperature, which is mainly caused by thermal expansionand thermal cracking of coal matrix. Meanwhile, the countof pores increases first and then decreases with the increasingtemperature of thermal treatment, which is mainly due to thethermal shrinkage and thermal expansion of coal matrix.
Fissure
PorePore
Fissure
Pore
Fissure
Pore
spot3.0
WD14.5 mm
HV30.00 kv
vac modehigh vacuum
detETD
100 μmQuanta 250
mag1000×
spot3.0
WD17.3 mm
HV30.00 kv
vac modehigh vacuum
detETD
100 μmQuanta 250
mag1000×
spot3.0
WD15.1 mm
HV30.00 kv
vac modehigh vacuum
detETD
100 μmQuanta 250
mag1000×
spot3.0
WD19.2 mm
HV30.00 kv
vac modehigh vacuum
detETD
100 μmQuanta 250
mag1000×
50 ºC25 ºC
75 ºC 100 ºC
Figure 5: The SEM images of PDS coal specimens after different temperature treatments.
6 Geofluids

3.3. Pore and Fissure Distribution. Mercury intrusion testsare commonly used to investigate the pore and fissure char-acteristics of coal and rock [20, 50, 51, 56–58]. To obtain thepore and fissure characteristics of coal specimens after ther-mal treatment, mercury intrusion tests were carried out oncoal samples after different temperature treatment (25, 50,75, and 100°C). As shown in Figure 6, the mercury injectioncurve is S-shape, which can be divided into three stages,namely, initial injection stage, slow injection stage, and rapidinjection stage. The cumulative pore volume increases fast atthe initial injection stage, increases slowly during the slowinjection stage, and increases rapidly at the rapid injectionstage. There are significant differences in cumulative porevolume for different coal specimens. The cumulative porevolume is 0.03mL/g in PDS coal specimen, and the cumula-tive pore volume is 0.12mL/g in JJ coal specimen, which is 4times higher than that in PDS coal specimen. The main rea-
son is the differences in microstructure of coal specimens.Similarly, there also exist some differences in mercury injec-tion curve of coal specimens after different temperaturetreatment. The cumulative pore volume increases first andthen decreases with the increasing temperature for CZ coalspecimen. For JJ coal specimen, the cumulative pore volumeincreases first, then decreases, and finally increases with theincreasing temperature. The cumulative pore volumedecreases first and then increases with the increasing tem-perature for PDS coal specimen. These phenomena indicatethat the mineral composition and pore distribution have asignificant effect on the mercury injection curve.
To analyze the velocity of mercury injection of coal spec-imens after different temperatures, the velocity in high pres-sure (100~400MPa) is calculated using the least squaresmethod. As shown in Figure 7, the fitted curves fit well forthose data. The velocity of coal specimens after different
0.01 0.1 1 10 1000.00
0.02
0.04
0.06
0.08
0.10
0.12
0.14
Cum
ulat
ive v
olum
e (m
L/g)
Pressure (MPa)
Mercury ejection
Mercury injection
(a)
0.01 0.1 1 10 1000.00
0.01
0.02
0.03
0.04
0.05
Cum
ulat
ive v
olum
e (m
L/g)
Pressure (MPa)
Mercury ejection
Mercury injection
(b)
0.01 0.1 1 10 1000.000
0.005
0.010
0.015
0.020
0.025
0.030
0.035
Mercury ejection
25 ºC50 ºC
75 ºC100 ºC
Mercury injection
Cum
ulat
ive v
olum
e (m
L/g)
Pressure (MPa)
(c)
Figure 6: Curves of mercury injection and ejection in three groups of coal specimens after different temperature treatments: (a) JJ coalspecimen, (b) CZ coal specimen, and (c) PDS coal specimen.
7Geofluids

temperature treatment is shown in Figure 8. The velocity of JJcoal specimen is higher than 1:4 × 10⁻⁴mL/(g·MPa), and thatof CZ and PDS coal samples ranges from 4 × 10⁻⁵ to 6 × 10⁻⁵mL/(g·MPa), which is mainly caused by the differences inmicrostructure of coal specimens. Meanwhile, the velocityof JJ and CZ coal specimen increases first and then decreaseswith the increasing temperature. However, the velocity ofPDS coal specimen decreases first and then increases withthe rise of temperature. These phenomena are mainly causedby the mineral composition and pore structure.
The pore distribution of coal specimens can be measuredby the mercury intrusion tests, and the relationship betweenthe pore size and the applied pressure can be expressed asfollows [52]:
p rð Þ = −2γ cos θ
r, ð1Þ
where pðrÞ is the applied pressure, r is the radius of pore, θ isthe contact angle (130°), and γ is the Hg surface tension(0.485N/m).
0 100 200 300 4000.00
0.02
0.04
0.06
0.08
0.10
0.12
0.14Cu
mul
ativ
e vol
ume (
mL/
g)
Pressure (MPa)
y = 0.06406+0.00015884xR2 = 0.9464
y = 0.06179+0.00015881xR2 = 0.9701
y = 0.05899+0.00014012xR2 = 0.9503
y = 0.03662+0.00020298xR2 = 0.9478
(a)
0 100 200 300 4000.00
0.01
0.02
0.03
0.04
0.05
Cum
ulat
ive v
olum
e (m
L/g)
Pressure (MPa)
y = 0.01797+0.000042987xR2 = 0.9984
y = 0.01967+0.000054577xR2 = 0.9937
y = 0.0117+0.000057138xR2 = 0.9984
y = 0.01002+0.000052147xR2 = 0.9984
(b)
0 100 200 300 4000.000
0.005
0.010
0.015
0.020
0.025
0.030
0.035
25 ºC50 ºC
75 ºC100 ºC
Cum
ulat
ive v
olum
e (m
L/g)
Pressure (MPa)
y = 0.00961+0.000052104xR2 = 0.9983
y = 0.0096+0.000048932xR2 = 0.9964
y = 0.00993+0.000050582xR2 = 0.9976
y = 0.00914+0.000047475xR2 = 0.9976
(c)
Figure 7: Relationship between cumulative volume and pressure in three groups of coal specimens after different temperature treatments: (a)JJ coal specimen, (b) CZ coal specimen, and (c) PDS coal specimen.
20 30 40 50 60Temperature (ºC)
70 80 90 1004
14
16
18
20
JJCZPDS
Velo
city
(10–5
·mL·
g–1·M
Pa–1
)
Figure 8: Relationship between velocity and temperatures in threegroups of coal specimens after different temperature treatments.
8 Geofluids

Table 1: Pore parameters of the three groups of coal specimens after different temperature treatments.
Specimen source Temperature (°C) Porosity (%) Pore area (m2/g)Median porediameter (nm)
Bulk density(g/mL)
Average porediameter (nm)
Jingjia Coal Mine
25 12.52 36.57 23.4 1.12 12.2
50 13.70 41.05 21.0 1.11 12.1
75 12.45 50.61 10.1 1.10 8.9
100 13.92 41.11 23.5 1.14 11.9
Changzhi Coal Mine
25 3.98 14.06 11.0 1.27 8.9
50 4.35 15.51 11.6 1.24 9.0
75 5.34 14.36 27.4 1.29 11.6
100 4.71 11.59 63.7 1.33 12.2
Pingdingshan Coal Mine
25 3.80 13.98 10.9 1.24 8.8
50 3.63 13.00 11.4 1.24 9.0
75 3.61 12.63 11.2 1.27 9.0
100 3.79 13.45 11.4 1.25 9.0
1 10 100 1000 10000 100000
0.000
0.001
0.002
0.003
0.004
0.005
0.006
Pore
vol
ume (
mL/
g)
Pore diameter (nm)
(a)
1 10 100 1000 10000 100000
0.0000
0.0005
0.0010
0.0015
0.0020
0.0025
0.0030
0.0035
0.0040Po
re v
olum
e (m
L/g)
Pore diameter (nm)
(b)
1 10 100 1000 10000 100000
0.0000
0.0005
0.0010
0.0015
25 ºC50 ºC
75 ºC100 ºC
0.0020
Pore
vol
ume (
mL/
g)
Pore diameter (nm)
(c)
Figure 9: Relationship between pore volume and pore diameter in three groups of coal specimens after different temperature treatments: (a)JJ coal specimen, (b) CZ coal specimen, and (c) PDS coal specimen.
9Geofluids
The pore parameters of the three groups of coal speci-mens after different temperature treatments are listed inTable 1. The porosity, pore area, median pore diameter,and average pore diameter for JJ coal specimens are higherthan those for CZ and PDS coal specimens. However, thebulk density of JJ coal specimens is lower than that of CZand PDS coal specimens. In general, the porosity, pore area,median pore diameter, and average pore diameter increasewith the increasing temperatures. However, there are someexceptions. These phenomena are mainly caused by the min-eral composition and pore structure.
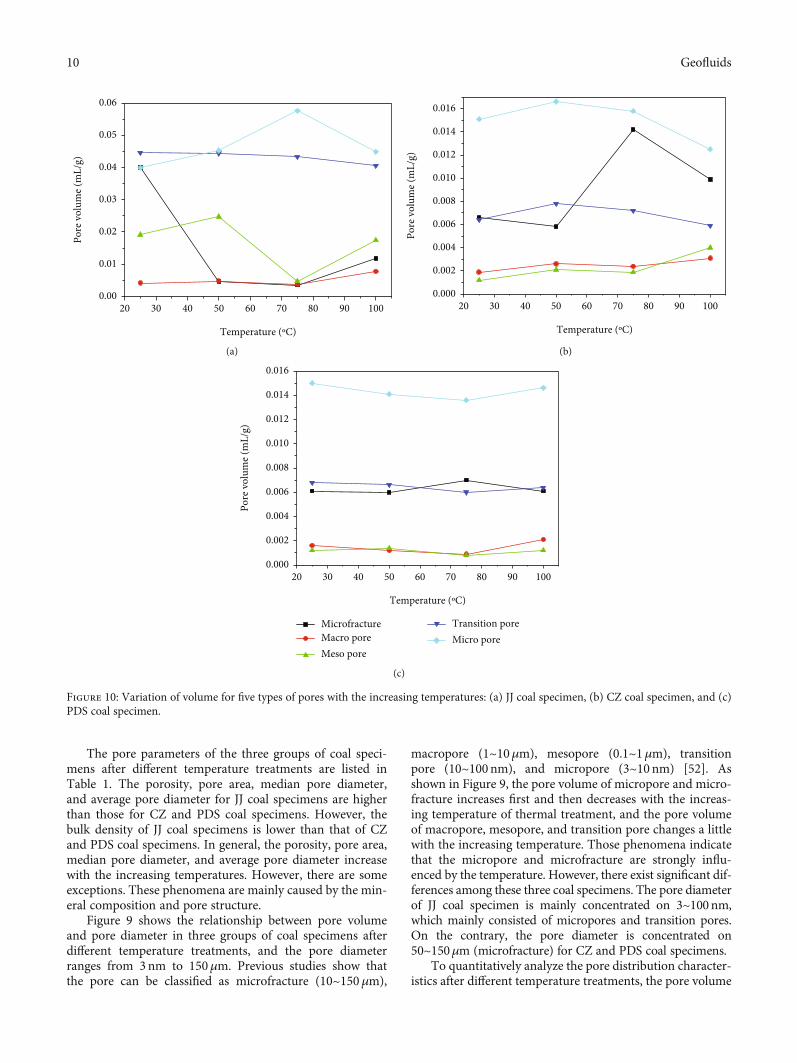
Figure 9 shows the relationship between pore volumeand pore diameter in three groups of coal specimens afterdifferent temperature treatments, and the pore diameterranges from 3nm to 150μm. Previous studies show thatthe pore can be classified as microfracture (10~150μm),
macropore (1~10μm), mesopore (0.1~1μm), transitionpore (10~100nm), and micropore (3~10 nm) [52]. Asshown in Figure 9, the pore volume of micropore and micro-fracture increases first and then decreases with the increas-ing temperature of thermal treatment, and the pore volumeof macropore, mesopore, and transition pore changes a littlewith the increasing temperature. Those phenomena indicatethat the micropore and microfracture are strongly influ-enced by the temperature. However, there exist significant dif-ferences among these three coal specimens. The pore diameterof JJ coal specimen is mainly concentrated on 3~100nm,which mainly consisted of micropores and transition pores.On the contrary, the pore diameter is concentrated on50~150μm (microfracture) for CZ and PDS coal specimens.
To quantitatively analyze the pore distribution character-istics after different temperature treatments, the pore volume
20 30 40 50 60
Temperature (ºC)
70 80 90 1000.00
0.01
0.02
0.03
0.04
0.05
0.06
Pore
vol
ume (
mL/
g)
(a)
20 30 40 50 60 70 80 90 1000.000
0.002
0.004
0.006
0.008
0.010
0.012
0.014
0.016
Pore
vol
ume (
mL/
g)
Temperature (ºC)
(b)
20 30 40 50 60 70 80 90 1000.000
0.002
0.004
0.006
0.008
0.010
0.012
0.014
0.016
Pore
vol
ume (
mL/
g)
MicrofractureMacro poreMeso pore
Transition poreMicro pore
Temperature (ºC)
(c)
Figure 10: Variation of volume for five types of pores with the increasing temperatures: (a) JJ coal specimen, (b) CZ coal specimen, and (c)PDS coal specimen.
10 Geofluids

with different diameters after the thermal treatments is cal-culated. As shown in Figure 10, the volume of microfracturedecreases at 50°C, which is mainly caused by thermal expan-sion of coal matrix; it increases at 75°C due to thermalshrinkage of coal matrix; it decreases at 100°C due to ther-mal expansion. The volume of macropore and mesoporeincreases slowly, and that of transition pore decreases slowlywith the increasing temperature. Meanwhile, the volume ofmicropore increases first and then decreases after the ther-mal treatment. These phenomena indicate that the micro-pore and microfracture are strongly influenced by thetemperature. However, there are some exceptions due tothe differences in mineral composition and pore structure.
Previous studies have demonstrated that the pore sizedistribution of coal and rock conforms to fractal characteris-tics [51, 59, 60]. Therefore, the effect of temperature on thepore structure of coal after different temperature treatmentscan be quantitatively analyzed based on fractal theory.According to the methods mentioned in previous studies[51, 59, 60],
lg dVdP
= k lg P + b, ð2Þ
where V is the pore volume, P is the applied pressure, k is thelinear slope, and b is the constant.
And the fractal dimension (D) of pore size can beobtained:
D = k + 4: ð3Þ
As shown in Figure 11, the fractal dimension ranges from2.6 to 2.9 and increases with the increasing temperature,which indicates that the pore surfaces is less and less smoothas the temperature rises. To analyze the evolution of fractal
dimension with temperature quantitatively, the least squaresmethod was used to fit the above data. As shown in Figure 11,the fractal dimension is nearly linearly related to the temper-ature. These phenomena indicate the pore surfaces of coalbecome rougher as the temperature rises.
In summary, thermal treatment has significant effects onmineral composition, microstructure, and pore structure ofcoal. The main mineral compositions after thermal treat-ment are basically unchanged, and the maximum diffractedintensity decreases first and then increases with the increas-ing temperature. The count of fissures decreases first andthen increases, and the count of pores increases first andthen decreases with the increasing temperature. The poros-ity, pore area, median pore diameter, and average porediameter increases with the increasing temperatures. Thefractal dimension of pore size ranges from 2.6 to 2.9 andincreases linearly with the increasing temperature. The porestructure varies with mineral composition and microstruc-ture due to the thermal shrinkage and thermal expansionof coal matrix. Meanwhile, the macroscopic mechanicalproperties are related to mineral composition, microstruc-ture, and pore structure.
4. Conclusions
The X-ray Diffraction (XRD) test, scanning electron micros-copy (SEM) test, and mercury intrusion test were carried outfor three groups of coal, and the mineral composition andpore structure of coal specimens after thermal treatment(25, 50, 75, and 100°C) were analyzed. The main conclusionsare as follows:
(1) The main mineral compositions of three groups ofcoal specimens after thermal treatment are basicallyunchanged, and the maximum diffracted intensity
20 30 40 50 60
Temperature (ºC)
70 80 90 100 110
2.65
2.70
2.75
2.80
2.85
2.90
JJCZPDS
Frac
tal d
imen
sion
of p
ore s
ize
D = 0.0018T+2.7135R2 = 0.90
D = 0.0007T+2.7205R2 = 0.89
D = 0.0008T+2.622R2 = 0.90
Figure 11: Relationship between fractal dimensions of pore size with different temperatures in three groups of coal specimens.
11Geofluids

changes a little after heat treatment. The maximumdiffracted intensity after different temperature treat-ments decreases first and then increases with theincreasing temperature
(2) The count of fissures decreases first and thenincreases with the increasing temperature, and thecount of pores increases first and then decreases withthe increasing temperature. Thermal treatment has asignificant effect on microstructure of coal specimens
(3) The velocity of mercury injection in high pressure(100~400MPa) of JJ and CZ coal specimens increasesfirst and then decreases with the increasing tempera-ture, but that of PDS coal specimen decreases firstand then increases with the increasing temperature.The porosity, pore area, median pore diameter, andaverage pore diameter increase with the increasingtemperatures
(4) The volume of microfracture decreases, thenincreases, and finally decreases. The volume ofmacropore and mesopore increases slowly, and thatof transition pore decreases slowly with the increas-ing temperature. Meanwhile, the volume of micro-pore increases first and then decreases during theprocess of thermal treatment. The fractal dimensionof pore size ranges from 2.6 to 2.9 and increases withthe increasing temperature. The fractal dimension isnearly linearly related to the temperature
Data Availability
The experimental data used to support the findings of thisstudy are included within the article.
Conflicts of Interest
The authors declare no conflict of interest.
Acknowledgments
This work was supported by the Open Fund of the KeyLaboratory of Safety and High-efficiency Coal Mining(JYBSYS2019101), the State Key Laboratory of MiningResponse and Disaster Prevention and Control in Deep CoalMines (SKLMRDPC19KF06 and SKLMRDPC20KF04), andthe Natural Science Foundation of Anhui Province(1908085QE184).
References
[1] H. Xie, M. Gao, R. Zhang, G. Peng, W.Wang, and A. Li, “Studyon the mechanical properties and mechanical response of coalmining at 1000 m or deeper,” Rock Mechanics and Rock Engi-neering, vol. 52, pp. 1475–1490, 2019.
[2] M. C. He, H. P. Xie, S. P. Peng, and Y. D. Jiang, “Study on rockmechanics in deep mining engineering,” Chinese Journal ofrock mechanics and engineering, vol. 24, pp. 2803–2813, 2005.
[3] Z. Zhang, H. Xie, R. Zhang et al., “Deformation damage andenergy evolution characteristics of coal at different depths,”
Rock Mechanics and Rock Engineering, vol. 52, no. 5,pp. 1491–1503, 2019.
[4] F. Du, K. Wang, X. Zhang, C. Xin, L. Shu, and G. Wang,“Experimental study of coal–gas outburst: insights fromcoal–rock structure, gas pressure and adsorptivity,” NaturalResources Research, vol. 29, pp. 2481–2493, 2020.
[5] H. Wang, X. Yang, F. Du et al., “Calculation of the diffusioncoefficient of gas diffusion in coal: the comparison of numeri-cal model and traditional analytical model,” Journal of Petro-leum Science and Engineering, vol. 205, p. 108931, 2021.
[6] W. Zhao, K. Wang, R. Zhang, H. Dong, Z. Lou, and F. An,“Influence of combination forms of intact sub-layer and tecton-ically deformed sub-layer of coal on the gas drainage perfor-mance of boreholes: a numerical study,” International Journalof Coal Science & Technology, vol. 7, pp. 571–580, 2020.
[7] W. C. Zhu, C. H. Wei, J. Liu, H. Y. Qu, and D. Elsworth, “Amodel of coal-gas interaction under variable temperatures,”International Journal of Coal Geology, vol. 86, no. 2-3,pp. 213–221, 2011.
[8] C. R. Clarkson and J. M. McGovern, “Optimization of CBMReservoir exploration and development strategies throughintegration of simulation and economics,” SPE Reservoir Eval-uation and Engineering, vol. 8, no. 6, pp. 502–519, 2005.
[9] M. E. Hossain, S. H. Mousavizadegan, and M. R. Islam, “Theeffects of thermal alterations on formation permeability andporosity,” Petroleum Science and Technology, vol. 26,pp. 1282–1302, 2008.
[10] M. H. B. Nasseri, B. S. A. Tatone, G. Grasselli, and R. P. Young,“Fracture toughness and fracture roughness interrelationshipin thermally treated westerly granite,” in Rock Physics and Nat-ural Hazards, pp. 801–822, Birkhäuser Basel, 2009.
[11] Z. Zhang, F. Gao, and Z. Liu, “Research on rockburst prone-ness and its microcosmic mechanism of granite consideringtemperature effect,” Chinese Journal of Rock Mechanics andEngineering, vol. 29, pp. 1591–1602, 2010.
[12] Z. Zhao, “Thermal influence onmechanical properties of gran-ite: a microcracking perspective,” Rock Mechanics and RockEngineering, vol. 49, no. 3, pp. 747–762, 2016.
[13] Z. Z. Zhang, F. Gao, and X. L. Xu, “Experimental study of tem-perature effect of mechanical properties of granite,” Rock andSoil Mechanics, vol. 32, pp. 2346–2352, 2011.
[14] S. Shao, P. G. Ranjith, P. L. P. Wasantha, and B. K. Chen,“Experimental and numerical studies on the mechanicalbehaviour of Australian Strathbogie granite at high tempera-tures: an application to geothermal energy,” Geothermics,vol. 54, pp. 96–108, 2015.
[15] S. Q. Yang, P. G. Ranjith, H.W. Jing,W. L. Tian, and Y. Ju, “Anexperimental investigation on thermal damage and failuremechanical behavior of granite after exposure to different hightemperature treatments,” Geothermics, vol. 65, pp. 180–197,2017.
[16] P. K. Gautam, A. K. Verma, M. K. Jha, P. Sharma, and T. N.Singh, “Effect of high temperature on physical and mechanicalproperties of Jalore granite,” Journal of Applied Geophysics,vol. 159, pp. 460–474, 2018.
[17] W. G. P. Kumari, D. M. Beaumont, P. G. Ranjith, M. S. A. Per-era, B. L. Avanthi Isaka, andM. Khandelwal, “An experimentalstudy on tensile characteristics of granite rocks exposed to dif-ferent high-temperature treatments,” Geomechanics and Geo-physics for Geo-Energy and Geo-Resources, vol. 5, pp. 47–64,2019.
12 Geofluids
[18] X. L. Xu and Z.-Z. Zhang, “Acoustic emission and damagecharacteristics of granite subjected to high temperature,”Advances in Materials Science and Engineering, vol. 2018, Arti-cle ID 8149870, 12 pages, 2018.
[19] Z.Wang, A. He, G. Shi, and G. Mei, “Temperature effect on AEenergy characteristics and damage mechanical behaviors ofgranite,” International Journal of Geomechanics, vol. 18,no. 3, p. 4017163, 2018.
[20] X. Shang, Z. Zhang, X. Xu, T. Liu, and Y. Xing, “Mineral com-position, pore structure, and mechanical characteristics ofpyroxene granite exposed to heat treatments,” Minerals,vol. 9, no. 9, p. 553, 2019.
[21] Z. Zhang, F. Gao, Y. Gao et al., “Fractal structure and model ofpore size distribution of granite under high temperatures,”Chinese Journal of Rock Mechanics and Engineering, vol. 35,pp. 2426–2438, 2016.
[22] B. Shu, R. Zhu, J. Tan, S. Zhang, and M. Liang, “Evolution ofpermeability in a single granite fracture at high temperature,”Fuel, vol. 242, pp. 12–22, 2019.
[23] Y. Zhang, X. Zhang, and Y. S. Zhao, “Process of sandstonethermal cracking,” Acta Geophysica Sinica, vol. 48, pp. 656–659, 2005.
[24] X. Mao, L. Zhang, R. Liu, and D. Ma, “Mechanical and thermaldamage properties of sandstone at high temperatures,” Elec-tronic Journal of Geotechnical Engineering, vol. 19, pp. 3137–3150, 2014.
[25] Q. Le Ding, F. Ju, X. B. Mao, D. Ma, B. Y. Yu, and S. B. Song,“Experimental investigation of the mechanical behavior inunloading conditions of sandstone after high-temperaturetreatment,” Rock Mechanics and Rock Engineering, vol. 49,pp. 2641–2653, 2016.
[26] H. Sun, Q. Sun, W. Deng, W. Zhang, and C. Lü, “Temperatureeffect on microstructure and P-wave propagation in Linyisandstone,” Applied Thermal Engineering, vol. 115, pp. 913–922, 2017.
[27] Q. Sun, W. Zhang, T. Su, and S. Zhu, “Variation of wave veloc-ity and porosity of sandstone after high temperature heating,”Acta Geophysica, vol. 64, pp. 633–648, 2016.
[28] S. Q. Yang, P. Xu, Y. B. Li, and Y. H. Huang, “Experimentalinvestigation on triaxial mechanical and permeability behaviorof sandstone after exposure to different high temperaturetreatments,” Geothermics, vol. 69, pp. 93–109, 2017.
[29] Y. Zhang, Q. Sun, H. He, L. Cao, W. Zhang, and B. Wang,“Pore characteristics and mechanical properties of sandstoneunder the influence of temperature,” Applied Thermal Engi-neering, vol. 113, pp. 537–543, 2017.
[30] N. N. Sirdesai, T. N. Singh, and R. Pathegama Gamage, “Ther-mal alterations in the poro-mechanical characteristic of anIndian sandstone – a comparative study,” Engineering Geology,vol. 226, pp. 208–220, 2017.
[31] N. N. Sirdesai, T. N. Singh, P. G. Ranjith, and R. Singh, “Effectof varied durations of thermal treatment on the tensilestrength of red sandstone,” Rock Mechanics and Rock Engi-neering, vol. 50, pp. 205–213, 2017.
[32] R. R. Zhang, L. W. Jing, and Q. Y. Ma, “Experimental study onthermal damage and energy evolution of sandstone after hightemperature treatment,” Shock and Vibration, vol. 2018, Arti-cle ID 3845353, 9 pages, 2018.
[33] Y. J. Shen, Y. L. Zhang, F. Gao, G. S. Yang, and X. P. Lai, “Influ-ence of temperature on the microstructure deterioration ofsandstone,” Energies, vol. 11, no. 7, p. 1753, 2018.
[34] N. N. Sirdesai, B. Mahanta, P. G. Ranjith, and T. N. Singh,“Effects of thermal treatment on physico-morphological prop-erties of Indian fine-grained sandstone,” Bulletin of Engineer-ing Geology and the Environment, vol. 78, pp. 883–897, 2019.
[35] L. J. You and Y. L. Kang, “Effects of thermal treatment onphysical property of tight rocks,” Progress in Geophysics,vol. 24, pp. 1850–1854, 2009.
[36] S. Yang, D. Yang, and Z. Kang, “Experimental investigation ofthe anisotropic evolution of tensile strength of oil shale underreal-time high-temperature conditions,” Natural ResourcesResearch, vol. 30, no. 3, pp. 2513–2528, 2021.
[37] J. Peng, G. Rong, M. Cai, M. Di Yao, and C. B. Zhou, “Physicaland mechanical behaviors of a thermal-damaged coarse mar-ble under uniaxial compression,” Engineering Geology,vol. 200, pp. 88–93, 2016.
[38] G. Rong, J. Peng, M. Yao, Q. Jiang, and L. N. Y. Wong, “Effectsof specimen size and thermal-damage on physical andmechanical behavior of a fine-grained marble,” EngineeringGeology, vol. 232, pp. 46–55, 2018.
[39] Y. Zhang, Q. Sun, and J. Geng, “Microstructural characteriza-tion of limestone exposed to heat with XRD, SEM and TG-DSC,”Materials Characterization, vol. 134, pp. 285–295, 2017.
[40] W. Zhang, Q. Sun, S. Zhu, and B. Wang, “Experimental studyon mechanical and porous characteristics of limestone affectedby high temperature,” Applied Thermal Engineering, vol. 110,pp. 356–362, 2017.
[41] Y. Zhang, Q. Sun, L. Cao, and J. Geng, “Pore, mechanics andacoustic emission characteristics of limestone under the influ-ence of temperature,” Applied Thermal Engineering, vol. 123,pp. 1237–1244, 2017.
[42] H. Yavuz, S. Demirdag, and S. Caran, “Thermal effect on thephysical properties of carbonate rocks,” International Journalof Rock Mechanics and Mining Sciences, vol. 47, pp. 94–103,2010.
[43] M. Keshavarz, F. L. Pellet, and B. Loret, “Damage and changesin mechanical properties of a gabbro thermally loaded up to1,000°C,” Pure and Applied Geophysics, vol. 167, pp. 1511–1523, 2010.
[44] V. Brotóns, R. Tomás, S. Ivorra, and J. C. Alarcón, “Tempera-ture influence on the physical and mechanical properties of aporous rock: San Julian’s calcarenite,” Engineering Geology,vol. 167, pp. 117–127, 2013.
[45] I. Ugur, N. Sengun, S. Demirdag, and R. Altindag, “Analysis ofthe alterations in porosity features of some natural stones dueto thermal effect,” Ultrasonics, vol. 54, pp. 1332–1336, 2014.
[46] J. Nowak, “The influence of thermal transformation of coalmining wastes on their petrographic and mineralogical com-position,” Gospodarka Surowcami Mineralnymi - MineralResources Management, vol. 30, no. 1, pp. 143–159, 2014.
[47] H. Tian, M. Ziegler, and T. Kempka, “Physical and mechanicalbehavior of claystone exposed to temperatures up to 1000°C,”International Journal of Rock Mechanics and Mining Sciences,vol. 70, pp. 144–153, 2014.
[48] R. Saidi, A. Tlili, and F. Jamoussi, “The effect of heating onmineral composition and grain size distribution of flux cal-cined porcelanites from the Gafsa-Metlaoui basin, southwest-ern Tunisia,” Journal of the African Earth Sciences, vol. 124,pp. 189–198, 2016.
[49] H. Ersoy, H. Kolaylı, M. Karahan, H. Harputlu Karahan, andM. O. Sünnetci, “Effect of thermal damage on mineralogicaland strength properties of basic volcanic rocks exposed to high
13Geofluids

temperatures,” Bulletin of Engineering Geology and the Envi-ronment, vol. 78, pp. 1515–1525, 2019.
[50] P. Liu, S. Cui, Z. Li, X. Xu, and C. Guo, “Influence of surround-ing rock temperature on mechanical property and pore struc-ture of concrete for shotcrete use in a hot-dry environment ofhigh-temperature geothermal tunnel,” Construction andBuilding Materials, vol. 207, pp. 329–337, 2019.
[51] G. Miao, Z. Li, L. Sun, and Y. Yang, “Experimental study onpore-fracture evolution law in the thermal damage process ofcoal,” Combustion Science and Technology, vol. 193, no. 4,pp. 677–701, 2021.
[52] Y. Li, Y. Jiang, B. Zhang, H. Song, W. Dong, and P. Wang,“Investigation on the pore characteristics of coal specimenswith bursting proneness,” Scientific Reports, vol. 9, no. 1,p. 16518, 2019.
[53] C. Sun, G. Li, M. E. Gomah, J. Xu, and H. Rong, “Experimentalinvestigation on the nanoindentation viscoelastic constitutivemodel of quartz and kaolinite in mudstone,” InternationalJournal of Coal Science & Technology, 2021.
[54] P. Boral, A. K. Varma, and S. Maity, “Nitration of Jharia basincoals, India: a study of structural modifications by XRD andFTIR techniques,” International Journal of Coal Science &Technology, 2021.
[55] X. Liu, S. Yuan, Y. Sieffert, S. Fityus, and O. Buzzi, “Changes inmineralogy, microstructure, compressive strength and intrin-sic permeability of two sedimentary rocks subjected to high-temperature heating,” Rock Mechanics and Rock Engineering,vol. 49, no. 8, pp. 2985–2998, 2016.
[56] T. Meng, R. Liu, X. Meng, D. Zhang, and Y. Hu, “Evolution ofthe permeability and pore structure of transversely isotropiccalcareous sediments subjected to triaxial pressure and hightemperature,” Engineering Geology, vol. 253, pp. 27–35, 2019.
[57] W. Zhao, K. Wang, L. Wang et al., “Influence of matrix sizeand pore damage path on the size dependence of gas adsorp-tion capacity of coal,” Fuel, vol. 283, p. 119289, 2021.
[58] W. Zhao, K. Wang, S. Liu et al., “Asynchronous difference indynamic characteristics of adsorption swelling and mechanicalcompression of coal: modeling and experiments,” Interna-tional Journal of Rock Mechanics and Mining Sciences,vol. 135, p. 104498, 2020.
[59] H. Jiang, Y. Cheng, L. Yuan, F. An, and K. Jin, “A fractal theorybased fractional diffusion model used for the fast desorptionprocess of methane in coal,” Chaos, vol. 23, no. 3, p. 33111,2013.
[60] Y. Chen, X. Wang, and R. He, “Modeling changes of fractalpore structures in coal pyrolysis,” Fuel, vol. 90, no. 2,pp. 499–504, 2011.
14 Geofluids