Analyzing the temperature and mineral composition … · Analyzing the temperature and mineral...
22
Analyzing the temperature and mineral composition of the Olympus Mons and the Valles Marineris Selene Introduction Mars is the Earth's outer neighbor; it is the fourth planet from the Sun. The first historical study of Mars was credited to Francisco Fontana, who rendered telescopic observations in 1638. Around 1877, Giovanni Virginio Schiaparelli described the “canali” or channel formations in the planet. But it was not until 1965 that the first close-up picture of Mars revealed a world strangely familiar, yet different enough to challenge our perceptions of what makes a planet work. Although spacecraft have shown us that Mars is rocky, cold, and sterile beneath its hazy, pink sky, scientists presume there was an early warm period and that the heat from inside Mars probably caused the volcano’s formation as well as the continental drift. In order to better understand the geological features, water resources, climate and biological aspects of the red planet several spacecrafts including orbiters, landers, and rovers have been sent by the Soviet Union, the United States, Europe, and Japan. The Mars 2001 Odyssey is an orbiter that was launched from Kennedy Space Center on 7 April 2001, it carries three main science instruments: The Gamma Ray Spectrometer (GRS), the Mars Radiation Environment Experiment (MARIE) and the Thermal Emission Imaging System (THEMIS). This last one combines a 5-band visual (VIS) spectral resolution imaging system with a 10-band spectral resolution infrared (IR) imaging system. The IR subsystem has a 100m/pixel spatial resolution while the VIS subsystem has a 19m/pixel resolution. THEMIS began observing the surface and atmosphere of Mars in February 2002 with the use of thermal infrared multispectral imaging between 6.5 and 15 µm and visible to near-IR images from 450 to 850 nm. Some researchers have exploited the unique aspect of investigating images of Martian temperatures at a resolution of 100 m. Not surprisingly, the 1
Transcript of Analyzing the temperature and mineral composition … · Analyzing the temperature and mineral...
Analyzing the temperature and mineral composition of the Olympus Mons and the
Valles Marineris
Selene
Introduction
Mars is the Earth's outer neighbor; it is the fourth planet from the Sun. The first historical
study of Mars was credited to Francisco Fontana, who rendered telescopic observations in
1638. Around 1877, Giovanni Virginio Schiaparelli described the “canali” or channel
formations in the planet. But it was not until 1965 that the first close-up picture of Mars
revealed a world strangely familiar, yet different enough to challenge our perceptions of what
makes a planet work. Although spacecraft have shown us that Mars is rocky, cold, and
sterile beneath its hazy, pink sky, scientists presume there was an early warm period and that
the heat from inside Mars probably caused the volcano’s formation as well as the continental
drift.
In order to better understand the geological features, water resources, climate and biological
aspects of the red planet several spacecrafts including orbiters, landers, and rovers have been
sent by the Soviet Union, the United States, Europe, and Japan.
The Mars 2001 Odyssey is an orbiter that was launched from Kennedy Space Center on 7
April 2001, it carries three main science instruments: The Gamma Ray Spectrometer (GRS),
the Mars Radiation Environment Experiment (MARIE) and the Thermal Emission Imaging
System (THEMIS). This last one combines a 5-band visual (VIS) spectral resolution
imaging system with a 10-band spectral resolution infrared (IR) imaging system. The IR
subsystem has a 100m/pixel spatial resolution while the VIS subsystem has a 19m/pixel
resolution. THEMIS began observing the surface and atmosphere of Mars in February 2002
with the use of thermal infrared multispectral imaging between 6.5 and 15 µm and visible to
near-IR images from 450 to 850 nm. Some researchers have exploited the unique aspect of
investigating images of Martian temperatures at a resolution of 100 m. Not surprisingly, the
1
temperatures are related to material properties, such as composition and structural integrity,
climate and topography, which indicate the origin, evolution and history of the planet.
For THEMIS IR a major result from the camera is the discovery that the physical and
compositional properties of these layers can vary, implying temporal changes in the
processes or environments that formed the different units. A key element of this discovery is
the exposure at the surface of materials that directly reflect the properties of the underlying
rock unit from which they were derived.
Statement of the Problem
In order to better understand Mars, the sites of Olympus Mons, and Valles Marineris were
studied by utilizing THEMIS remote sensing imaging:
1. It is believed that since Olympus Mons is an extinct volcano that measures 24 km (15
miles) high, and the top of it is 70 km (40 miles) wide; the base is about 600 km (375
miles) wide. It was originally hypothesized that basalt, pyroxene, granite and possibly
gneiss, schist, slalte, marble might be present at this site.
2. Valles Marineris is 4000 km (2500 mi) long and reaches depths of up to 7 km (4 mi) and
widths of up to 200 km (125 mi). Most researchers agree that Valles Marineris is a large
tectonic "crack" in the Martian crust, forming as the planet cooled, affected by the rising
crust in the Tharsis region to the west, and subsequently widened by erosional forces.
Due to these physical characteristics, the initial goal was to test for the presence of water
and minerals such as basalt, pyroxene and granite.
Objectives & Methodology
For the purposes of this project, the data used was derived from THEMIS to analyze the surface
temperatures of two Martian sites as well as mineral compositions. The spectral bands
scrutinized for this study involved the visible, ultraviolet (UV), and infrared (IR) ranges of the
spectrum. All of the data utilized ISIS to process the images in order to view all 10 spectral
bands. ENVI was used to analyze the range of spectral bands, once processing was complete. By
2
using ENVI’s spectral library, it was believed that Martian minerals could be identified from
inherent spectral signatures and correlated to minerals found on Earth.
Analysis
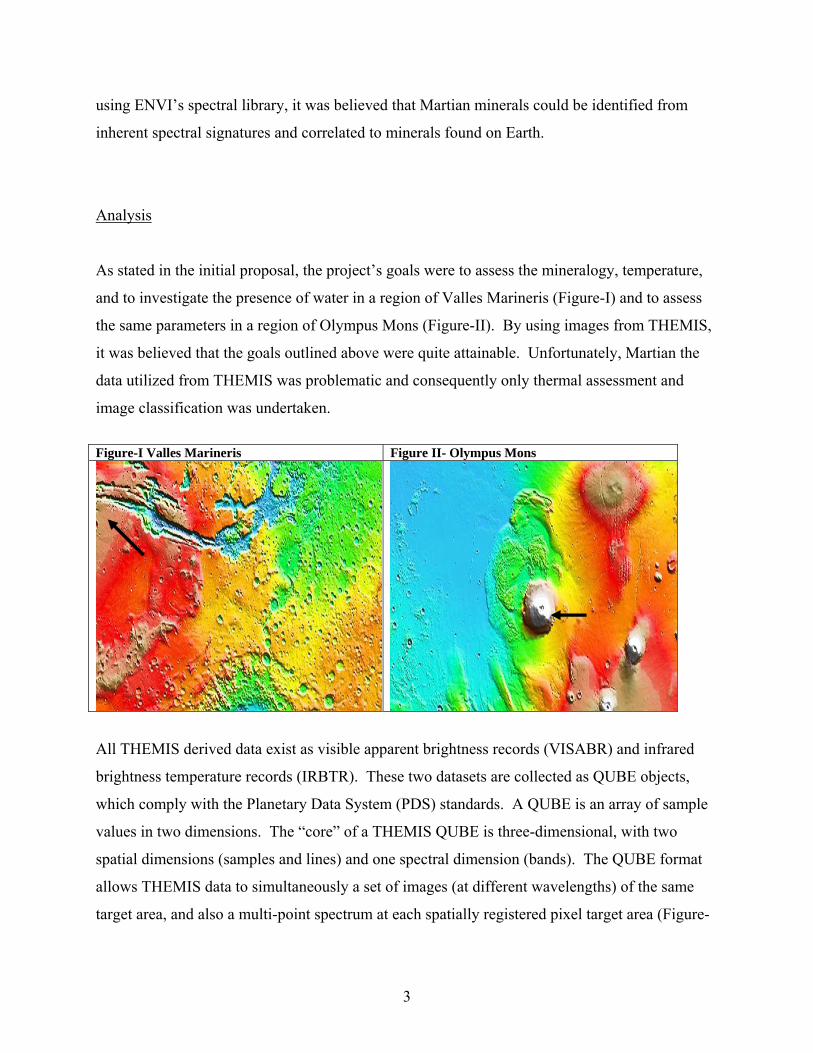
As stated in the initial proposal, the project’s goals were to assess the mineralogy, temperature,
and to investigate the presence of water in a region of Valles Marineris (Figure-I) and to assess
the same parameters in a region of Olympus Mons (Figure-II). By using images from THEMIS,
it was believed that the goals outlined above were quite attainable. Unfortunately, Martian the
data utilized from THEMIS was problematic and consequently only thermal assessment and
image classification was undertaken.
Figure-I Valles Marineris Figure II- Olympus Mons
All THEMIS derived data exist as visible apparent brightness records (VISABR) and infrared
brightness temperature records (IRBTR). These two datasets are collected as QUBE objects,
which comply with the Planetary Data System (PDS) standards. A QUBE is an array of sample
values in two dimensions. The “core” of a THEMIS QUBE is three-dimensional, with two
spatial dimensions (samples and lines) and one spectral dimension (bands). The QUBE format
allows THEMIS data to simultaneously a set of images (at different wavelengths) of the same
target area, and also a multi-point spectrum at each spatially registered pixel target area (Figure-
3
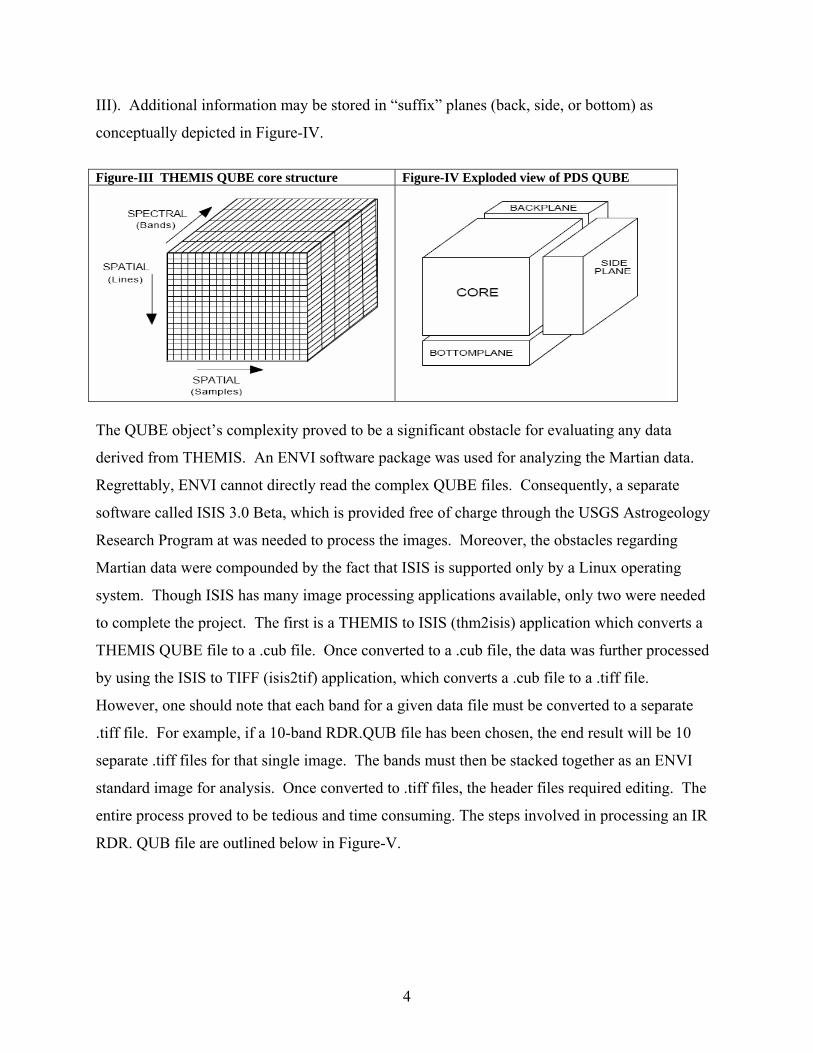
III). Additional information may be stored in “suffix” planes (back, side, or bottom) as
conceptually depicted in Figure-IV.
Figure-III THEMIS QUBE core structure Figure-IV Exploded view of PDS QUBE
The QUBE object’s complexity proved to be a significant obstacle for evaluating any data
derived from THEMIS. An ENVI software package was used for analyzing the Martian data.
Regrettably, ENVI cannot directly read the complex QUBE files. Consequently, a separate
software called ISIS 3.0 Beta, which is provided free of charge through the USGS Astrogeology
Research Program at was needed to process the images. Moreover, the obstacles regarding
Martian data were compounded by the fact that ISIS is supported only by a Linux operating
system. Though ISIS has many image processing applications available, only two were needed
to complete the project. The first is a THEMIS to ISIS (thm2isis) application which converts a
THEMIS QUBE file to a .cub file. Once converted to a .cub file, the data was further processed
by using the ISIS to TIFF (isis2tif) application, which converts a .cub file to a .tiff file.
However, one should note that each band for a given data file must be converted to a separate
.tiff file. For example, if a 10-band RDR.QUB file has been chosen, the end result will be 10
separate .tiff files for that single image. The bands must then be stacked together as an ENVI
standard image for analysis. Once converted to .tiff files, the header files required editing. The
entire process proved to be tedious and time consuming. The steps involved in processing an IR
RDR. QUB file are outlined below in Figure-V.
4

Figure-V (IR RDR.QUB data processing)
A
complex procedure in itself. The data for the visible images utilized a similar method except fo
two differences. To convert from Kelvin to Celsius the following formula was used: (B1*1.8-
459.637). The other formula used for the band math portion was: (B1*SF) + offset, where SF
the scaling factor.
s demonstrated in Figure-V, simply reaching a point where the data is in a useable form is a
r
is
Once the cumbersome image processing was completed, analysis of the images using ENVI was
o
f
performed on the two sites. The initial site evaluated was Olympus Mons (Figure-IV). The
volcano is nearly 27 km high; it is over 20 times wider than it is tall. Thus, most of the volcan
has a fairly gentle surface slope. The image also shows the distinct cliff which marks the base o
Olympus Mons. In places, this scarp is up to 6 km high. In other places, it is hidden under lava
flows cascading out into the surrounding lava plains. This cliff is unique among the giant shield
volcanoes on Mars. The rough, crinkly patches around Olympus Mons are also unusual and form
the Olympus Mons Aureole.
Acquire file from THEMIS
Covert to .cub file
Convert to .tiff file
Edit band widths
Edit band centers
Perform band math using ((band multiplier*B1)+Base)*1000
on each band
Stack bands as ENVI standard
Input band center
information again
Input band width
information again
Perform data
analysis
5
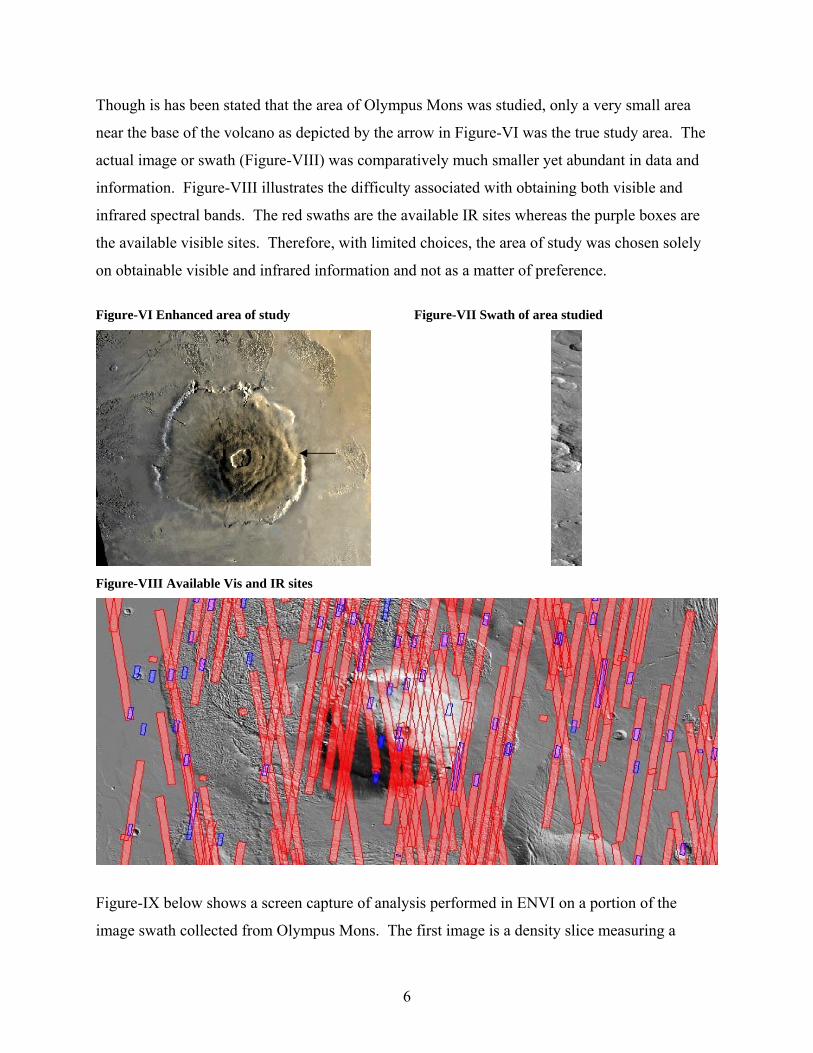
Though is has been stated that the area of Olympus Mons was studied, only a very small area
near the base of the volcano as depicted by the arrow in Figure-VI was the true study area. The
actual image or swath (Figure-VIII) was comparatively much smaller yet abundant in data and
information. Figure-VIII illustrates the difficulty associated with obtaining both visible and
infrared spectral bands. The red swaths are the available IR sites whereas the purple boxes are
the available visible sites. Therefore, with limited choices, the area of study was chosen solely
on obtainable visible and infrared information and not as a matter of preference.
Figure-VI Enhanced area of study Figure-VII Swath of area studied
Figure-VIII Available Vis and IR sites
Figure-IX below shows a screen capture of analysis performed in ENVI on a portion of the
image swath collected from Olympus Mons. The first image is a density slice measuring a
6
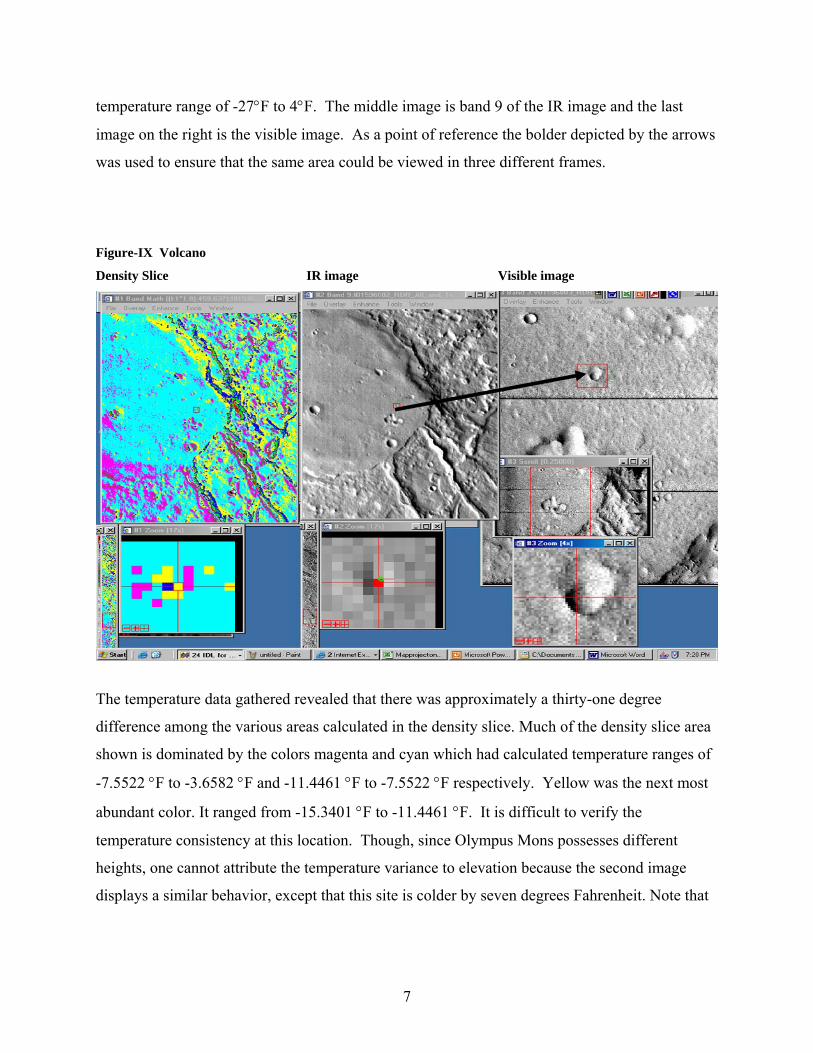
temperature range of -27°F to 4°F. The middle image is band 9 of the IR image and the last
image on the right is the visible image. As a point of reference the bolder depicted by the arrows
was used to ensure that the same area could be viewed in three different frames.
Figure-IX Volcano
Density Slice IR image Visible image
The temperature data gathered revealed that there was approximately a thirty-one degree
difference among the various areas calculated in the density slice. Much of the density slice area
shown is dominated by the colors magenta and cyan which had calculated temperature ranges of
-7.5522 °F to -3.6582 °F and -11.4461 °F to -7.5522 °F respectively. Yellow was the next most
abundant color. It ranged from -15.3401 °F to -11.4461 °F. It is difficult to verify the
temperature consistency at this location. Though, since Olympus Mons possesses different
heights, one cannot attribute the temperature variance to elevation because the second image
displays a similar behavior, except that this site is colder by seven degrees Fahrenheit. Note that
7
this image was collected on April 25, 2002 from 00:09-13.343 to 00:11:13.343 and additional
analysis by overlaying MOLA data could answer this question.
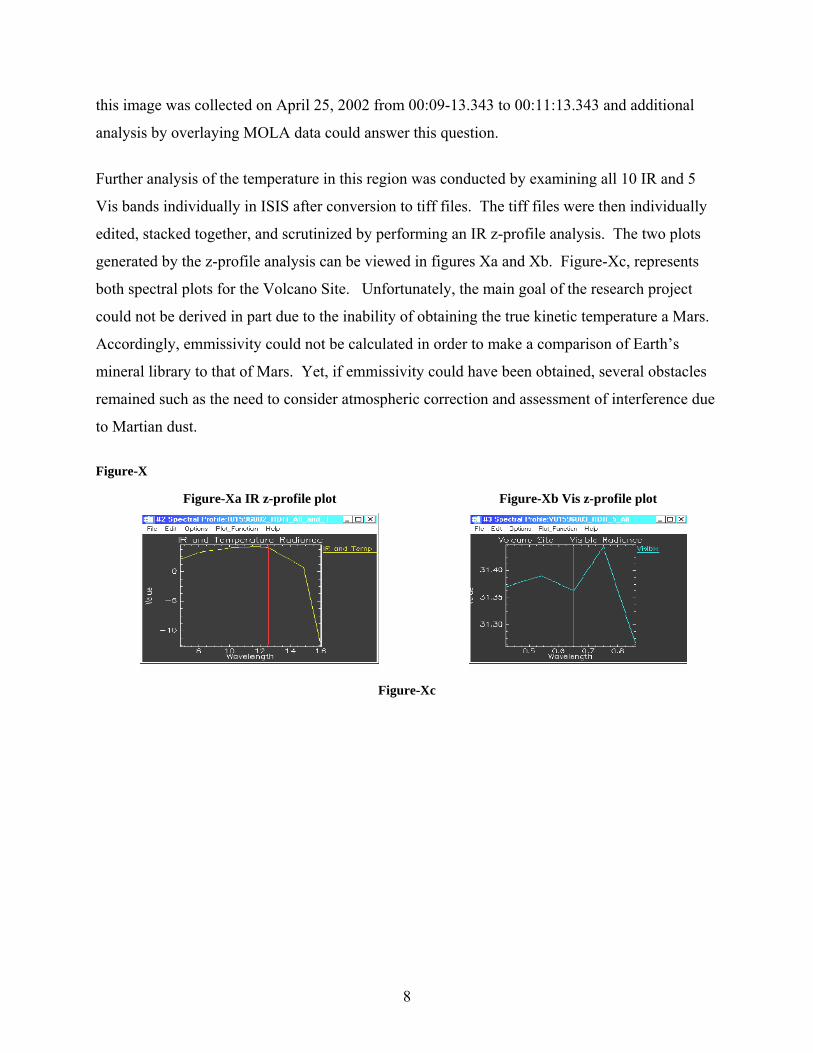
Further analysis of the temperature in this region was conducted by examining all 10 IR and 5
Vis bands individually in ISIS after conversion to tiff files. The tiff files were then individually
edited, stacked together, and scrutinized by performing an IR z-profile analysis. The two plots
generated by the z-profile analysis can be viewed in figures Xa and Xb. Figure-Xc, represents
both spectral plots for the Volcano Site. Unfortunately, the main goal of the research project
could not be derived in part due to the inability of obtaining the true kinetic temperature a Mars.
Accordingly, emmissivity could not be calculated in order to make a comparison of Earth’s
mineral library to that of Mars. Yet, if emmissivity could have been obtained, several obstacles
remained such as the need to consider atmospheric correction and assessment of interference due
to Martian dust.
Figure-X Figure-Xa IR z-profile plot Figure-Xb Vis z-profile plot
Figure-Xc
8
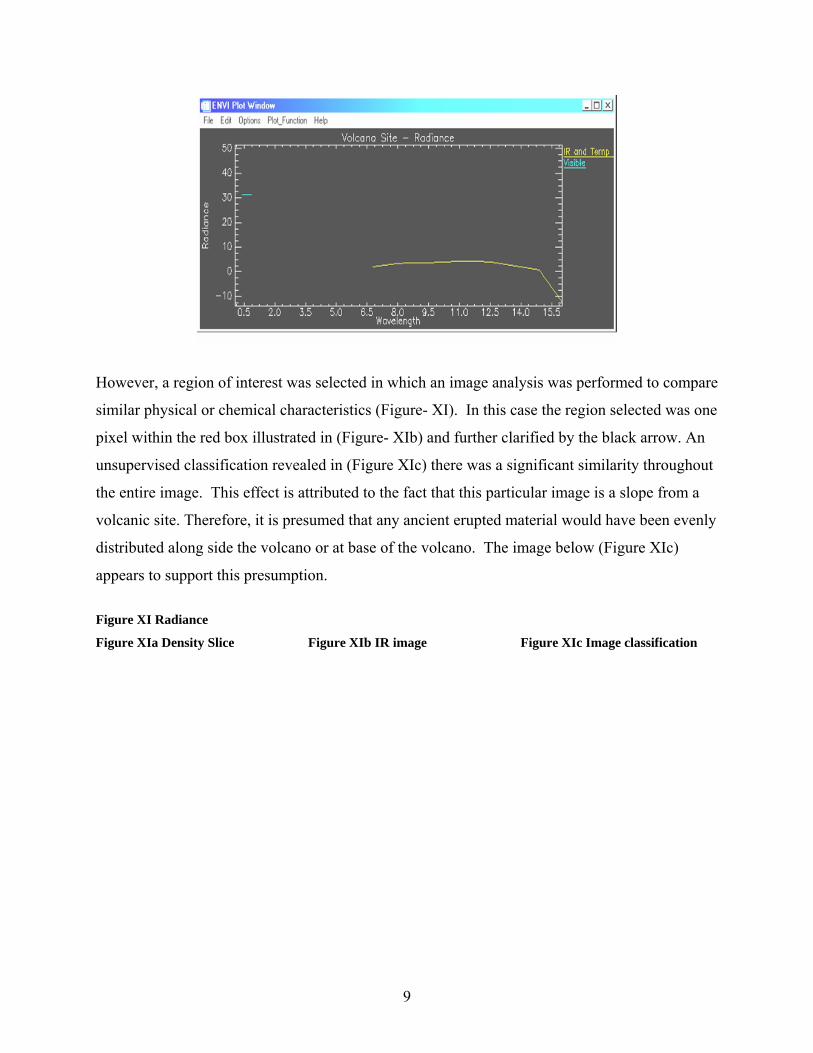
However, a region of interest was selected in which an image analysis was performed to compare
similar physical or chemical characteristics (Figure- XI). In this case the region selected was one
pixel within the red box illustrated in (Figure- XIb) and further clarified by the black arrow. An
unsupervised classification revealed in (Figure XIc) there was a significant similarity throughout
the entire image. This effect is attributed to the fact that this particular image is a slope from a
volcanic site. Therefore, it is presumed that any ancient erupted material would have been evenly
distributed along side the volcano or at base of the volcano. The image below (Figure XIc)
appears to support this presumption.
Figure XI Radiance
Figure XIa Density Slice Figure XIb IR image Figure XIc Image classification
9

Canyon Region (Valles Marineris)
The Valles Marineris is a system of canyons located just south of the Martian equator. The
system is about 4000 km long. Comparatively, the same canyon would extend all the way across
the United States. The central individual troughs, generally 50 to 100 km wide, merge into a
depression as much as 600 km wide. In places the canyon floor reaches a depth of about 7km,
which is 7 times deeper than the Grand Canyon at 1km. As with the Olympus Mons site, only a
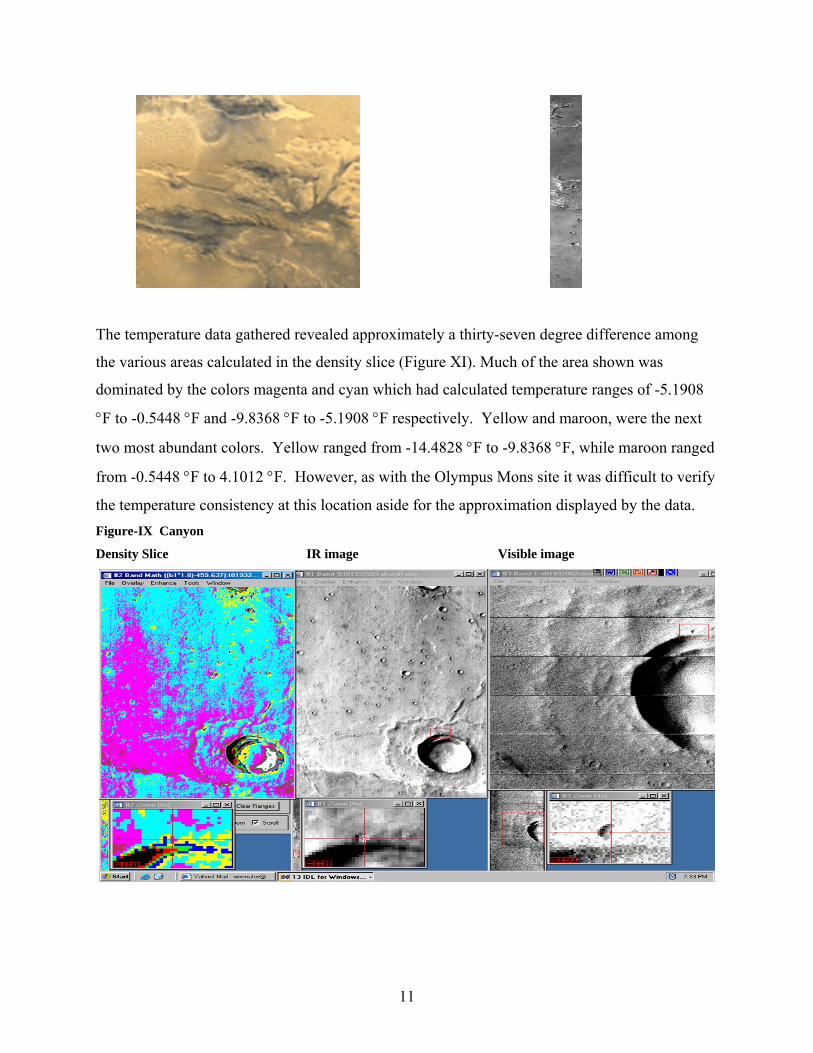
small area of Valles Marineris was studied. Figure-XII is an enhanced image of the region while
figure-XIII shows a swath of the actual study area. The same methodologies which were applied
the Olympus Mons site were applied to the Valles Marineris site and are discussed below.
Figure-XII Enhanced area of study Figure-XIII Swath of area studied
10
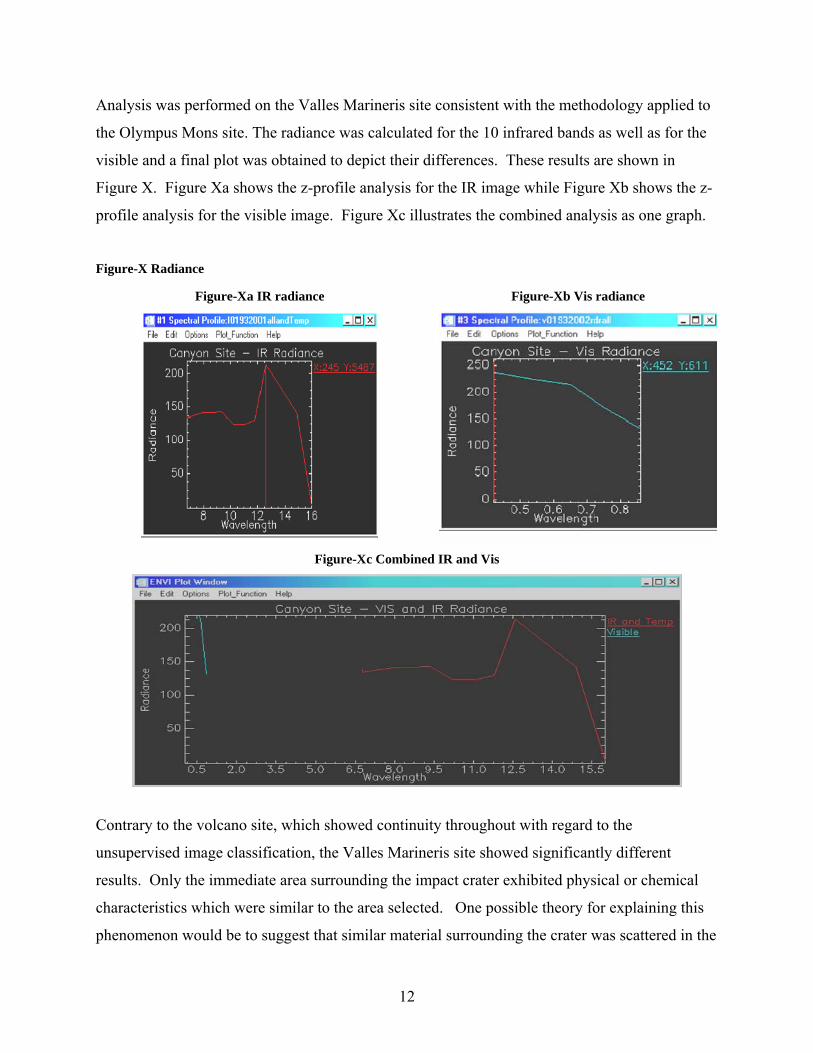
The temperature data gathered revealed approximately a thirty-seven degree difference among
the various areas calculated in the density slice (Figure XI). Much of the area shown was
dominated by the colors magenta and cyan which had calculated temperature ranges of -5.1908
°F to -0.5448 °F and -9.8368 °F to -5.1908 °F respectively. Yellow and maroon, were the next
two most abundant colors. Yellow ranged from -14.4828 °F to -9.8368 °F, while maroon ranged
from -0.5448 °F to 4.1012 °F. However, as with the Olympus Mons site it was difficult to verify
the temperature consistency at this location aside for the approximation displayed by the data. Figure-IX Canyon
Density Slice IR image Visible image
11
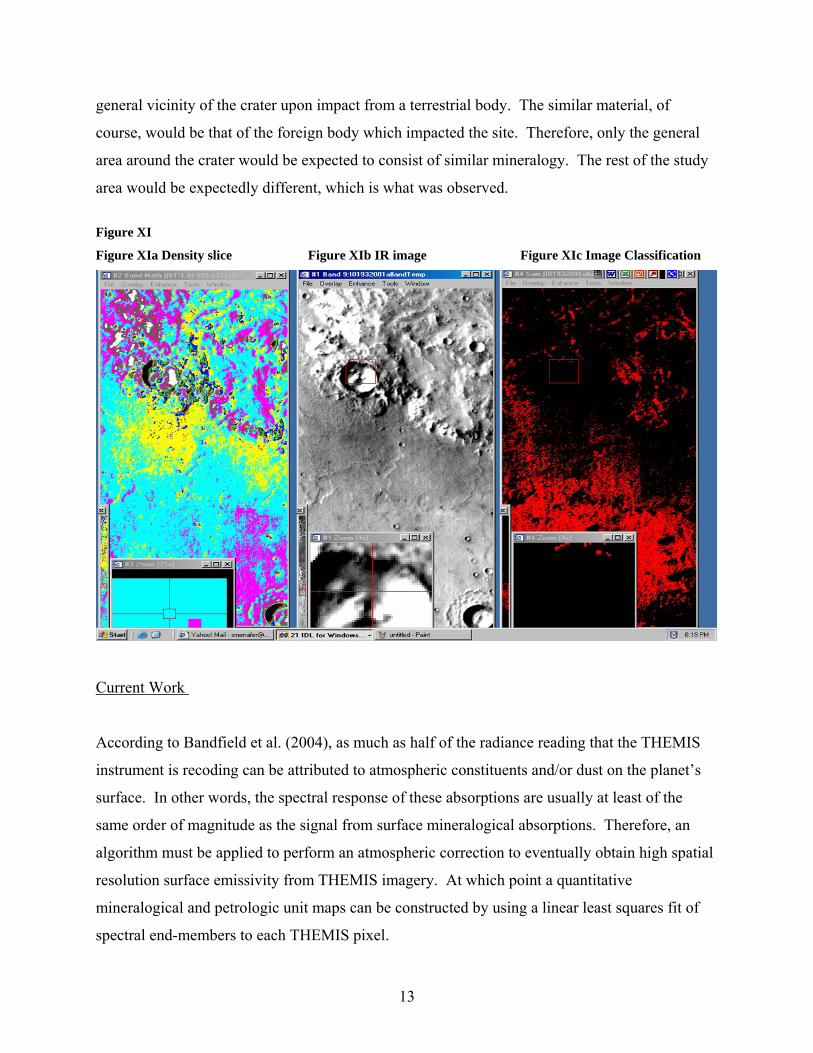
Analysis was performed on the Valles Marineris site consistent with the methodology applied to
the Olympus Mons site. The radiance was calculated for the 10 infrared bands as well as for the
visible and a final plot was obtained to depict their differences. These results are shown in
Figure X. Figure Xa shows the z-profile analysis for the IR image while Figure Xb shows the z-
profile analysis for the visible image. Figure Xc illustrates the combined analysis as one graph.
Figure-X Radiance
Figure-Xa IR radiance Figure-Xb Vis radiance
Figure-Xc Combined IR and Vis
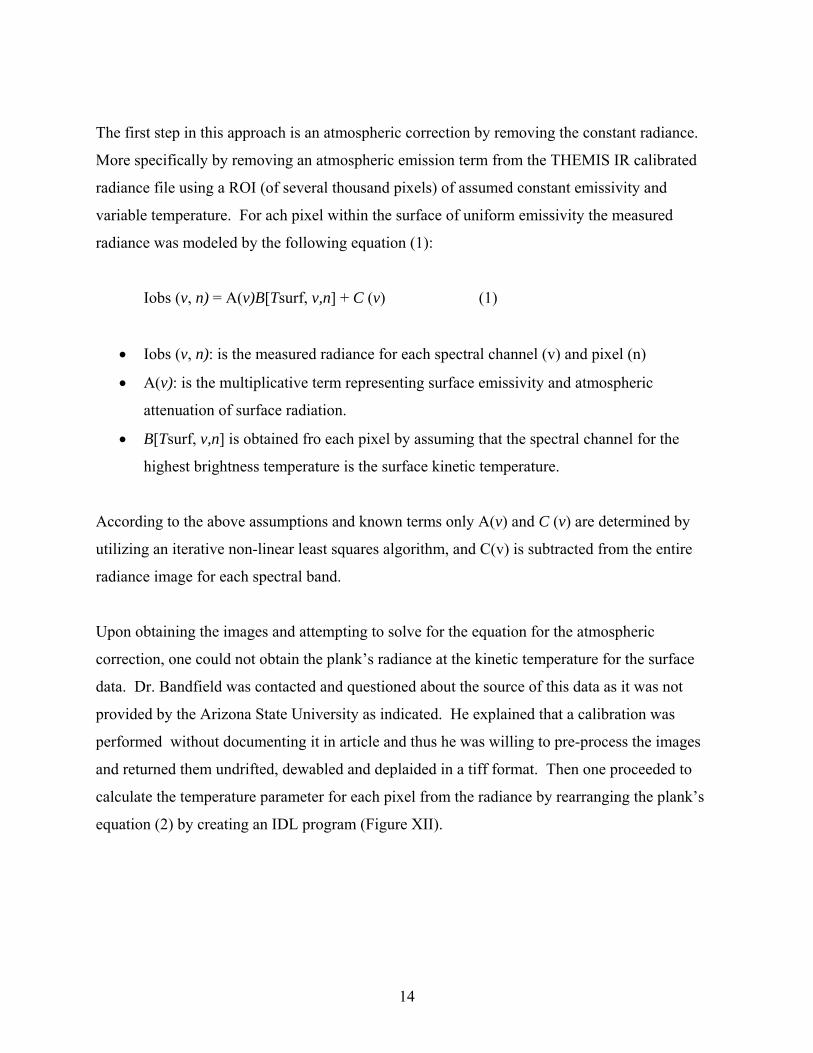
Contrary to the volcano site, which showed continuity throughout with regard to the
unsupervised image classification, the Valles Marineris site showed significantly different
results. Only the immediate area surrounding the impact crater exhibited physical or chemical
characteristics which were similar to the area selected. One possible theory for explaining this
phenomenon would be to suggest that similar material surrounding the crater was scattered in the
12
general vicinity of the crater upon impact from a terrestrial body. The similar material, of
course, would be that of the foreign body which impacted the site. Therefore, only the general
area around the crater would be expected to consist of similar mineralogy. The rest of the study
area would be expectedly different, which is what was observed.
Figure XI
Figure XIa Density slice Figure XIb IR image Figure XIc Image Classification
Current Work
According to Bandfield et al. (2004), as much as half of the radiance reading that the THEMIS
instrument is recoding can be attributed to atmospheric constituents and/or dust on the planet’s
surface. In other words, the spectral response of these absorptions are usually at least of the
same order of magnitude as the signal from surface mineralogical absorptions. Therefore, an
algorithm must be applied to perform an atmospheric correction to eventually obtain high spatial
resolution surface emissivity from THEMIS imagery. At which point a quantitative
mineralogical and petrologic unit maps can be constructed by using a linear least squares fit of
spectral end-members to each THEMIS pixel.
13
The first step in this approach is an atmospheric correction by removing the constant radiance.
More specifically by removing an atmospheric emission term from the THEMIS IR calibrated
radiance file using a ROI (of several thousand pixels) of assumed constant emissivity and
variable temperature. For ach pixel within the surface of uniform emissivity the measured
radiance was modeled by the following equation (1):
Iobs (v, n) = A(v)B[Tsurf, v,n] + C (v) (1)
• Iobs (v, n): is the measured radiance for each spectral channel (v) and pixel (n)
• A(v): is the multiplicative term representing surface emissivity and atmospheric
attenuation of surface radiation.
• B[Tsurf, v,n] is obtained fro each pixel by assuming that the spectral channel for the
highest brightness temperature is the surface kinetic temperature.
According to the above assumptions and known terms only A(v) and C (v) are determined by
utilizing an iterative non-linear least squares algorithm, and C(v) is subtracted from the entire
radiance image for each spectral band.
Upon obtaining the images and attempting to solve for the equation for the atmospheric
correction, one could not obtain the plank’s radiance at the kinetic temperature for the surface
data. Dr. Bandfield was contacted and questioned about the source of this data as it was not
provided by the Arizona State University as indicated. He explained that a calibration was
performed without documenting it in article and thus he was willing to pre-process the images
and returned them undrifted, dewabled and deplaided in a tiff format. Then one proceeded to
calculate the temperature parameter for each pixel from the radiance by rearranging the plank’s
equation (2) by creating an IDL program (Figure XII).
14

(2)
rad=READ_TIFF('D:\Mars\Data\I01932001.tif', CHANNELS=[0,1,2,3,4,5,6,7,8,9], geotiff=GTMODELTYPEGEOKEY) arrdim=size(rad, /dimensions)
cols=arrdim[1]
rows=arrdim[2]
T=fltarr(10,cols,rows)
hc=1.99E-19 ;JS.um.s^-1
s_hc=1.19E4 ;s_hc=2hc^2*1E8
k=1.38E-23
y1=6.78
y2=6.78
y3=7.93
y4=8.56
y5=9.35
y6=10.21
y7=11.04
y8=11.79
y9=12.57
y10=14.88
T(0,*,*)=temporary(hc/(y1*k*alog(s_hc/(y1^5*rad(0,*,*))+1)))
T(1,*,*)=temporary(hc/(y2*k*alog(s_hc/(y2^5*rad(1,*,*))+1)))
T(2,*,*)=temporary(hc/(y3*k*alog(s_hc/(y3^5*rad(2,*,*))+1)))
T(3,*,*)=temporary(hc/(y4*k*alog(s_hc/(y4^5*rad(3,*,*))+1)))
T(4,*,*)=temporary(hc/(y5*k*alog(s_hc/(y5^5*rad(4,*,*))+1)))
T(5,*,*)=temporary(hc/(y6*k*alog(s_hc/(y6^5*rad(5,*,*))+1)))
T(6,*,*)=temporary(hc/(y7*k*alog(s_hc/(y7^5*rad(6,*,*))+1)))
T(7,*,*)=temporary(hc/(y8*k*alog(s_hc/(y8^5*rad(7,*,*))+1)))
T(8,*,*)=temporary(hc/(y9*k*alog(s_hc/(y9^5*rad(8,*,*))+1)))
T(9,*,*)=temporary(hc/(y10*k*alog(s_hc/(y10^5*rad(9,*,*))+1)))
WRITE_TIFF,'D:\Mars\Data\T01932001b.tif', T, geotiff=GTMODELTYPEGEOKEY, /float
write the temperature to an image called reflec.tif
end
Figure XII. IDL for calculate the kinetic temperature from radiance file for each pixel in image.
Once the temperature tiff files were created, one defined a Mars’ sinusoidal planerocentric
projection in ENVI. Table 1 displays the specific parameters for each site from header file. The
15
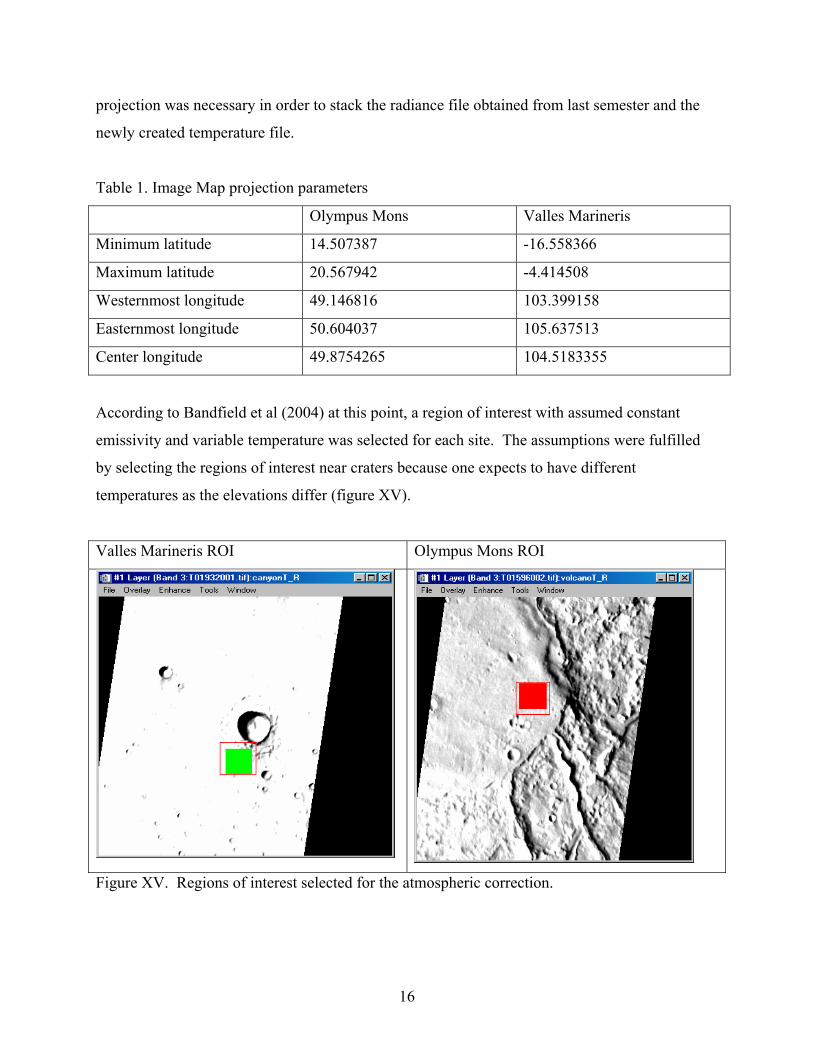
projection was necessary in order to stack the radiance file obtained from last semester and the
newly created temperature file.
Table 1. Image Map projection parameters
Olympus Mons Valles Marineris
Minimum latitude 14.507387 -16.558366
Maximum latitude 20.567942 -4.414508
Westernmost longitude 49.146816 103.399158
Easternmost longitude 50.604037 105.637513
Center longitude 49.8754265 104.5183355
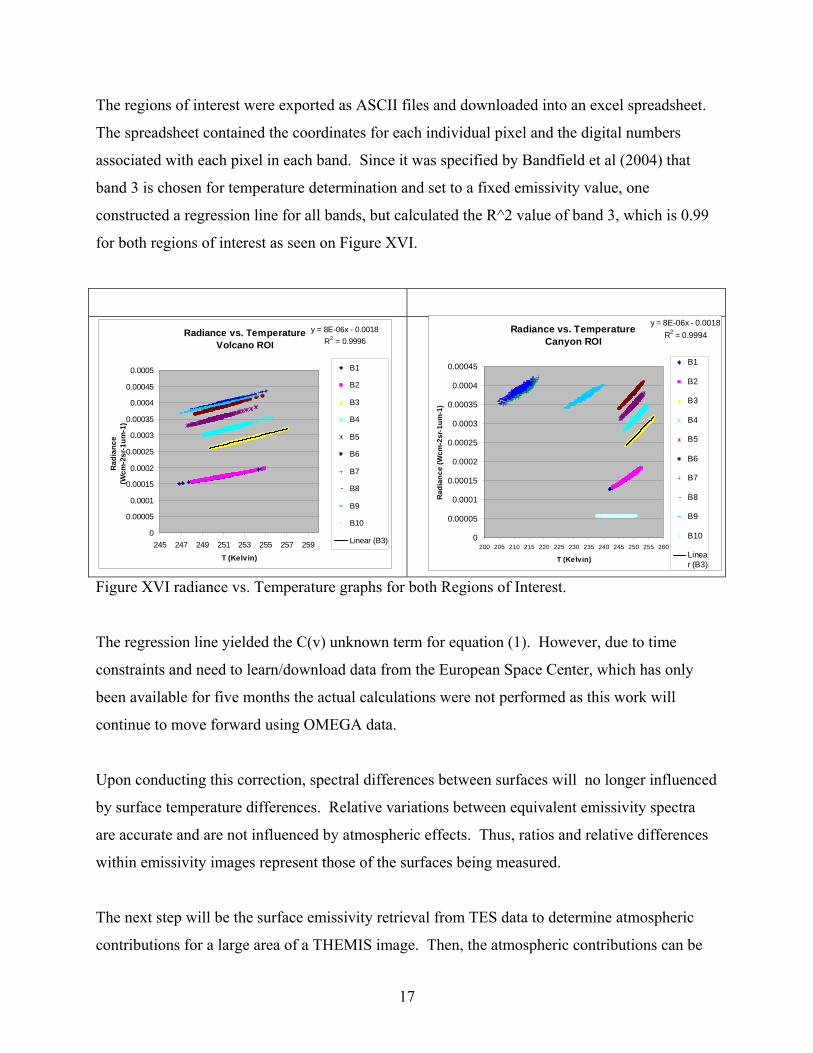
According to Bandfield et al (2004) at this point, a region of interest with assumed constant
emissivity and variable temperature was selected for each site. The assumptions were fulfilled
by selecting the regions of interest near craters because one expects to have different
temperatures as the elevations differ (figure XV).
Valles Marineris ROI Olympus Mons ROI
Figure XV. Regions of interest selected for the atmospheric correction.
16
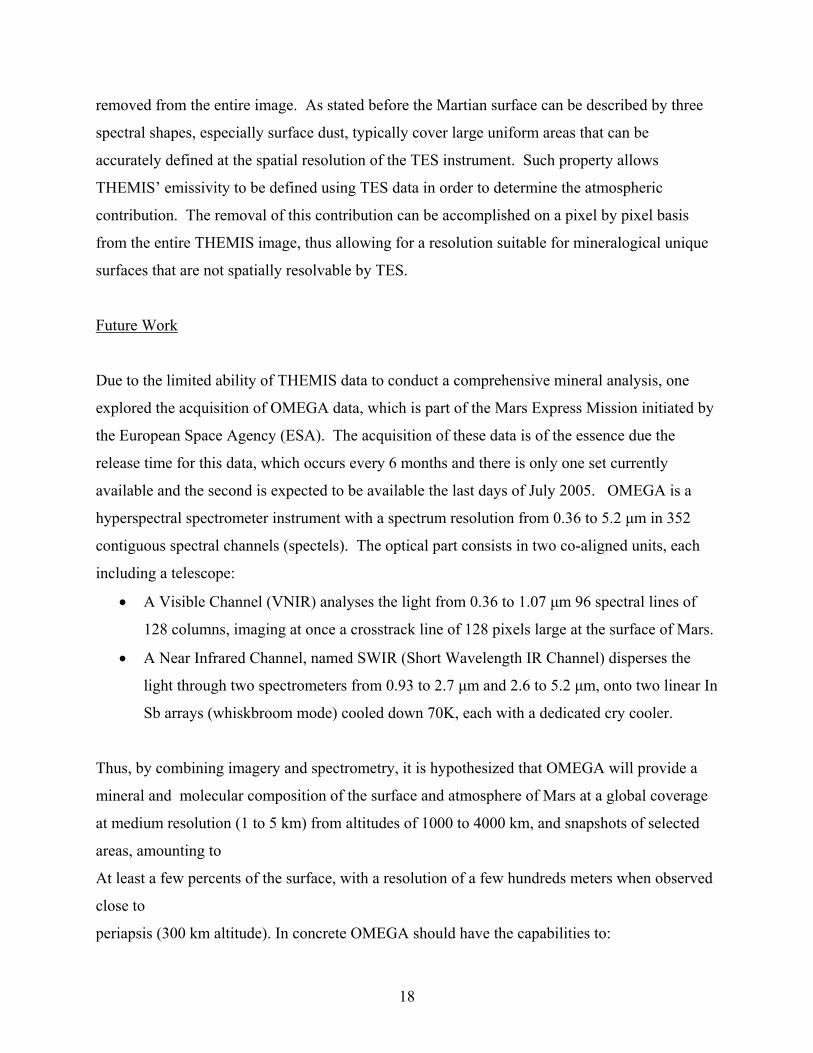
The regions of interest were exported as ASCII files and downloaded into an excel spreadsheet.
The spreadsheet contained the coordinates for each individual pixel and the digital numbers
associated with each pixel in each band. Since it was specified by Bandfield et al (2004) that
band 3 is chosen for temperature determination and set to a fixed emissivity value, one
constructed a regression line for all bands, but calculated the R^2 value of band 3, which is 0.99
for both regions of interest as seen on Figure XVI.
Radiance vs. TemperatureCanyon ROI
y = 8E-06x - 0.0018R2 = 0.9994
0
0.00005
0.0001
0.00015
0.0002
0.00025
0.0003
0.00035
0.0004
0.00045
200 205 210 215 220 225 230 235 240 245 250 255 260
T (Kelvin)
Rad
ianc
e (W
cm-2
sr-1
um-1
)
B1
B2
B3
B4
B5
B6
B7
B8
B9
B10
Linear (B3)
Radiance vs. TemperatureVolcano ROI
y = 8E-06x - 0.0018R2 = 0.9996
0
0.00005
0.0001
0.00015
0.0002
0.00025
0.0003
0.00035
0.0004
0.00045
0.0005
245 247 249 251 253 255 257 259T (Kelvin)
Rad
ianc
e (W
cm-2
sr-1
um-1
)
B1
B2
B3
B4
B5
B6
B7
B8
B9
B10
Linear (B3)
Figure XVI radiance vs. Temperature graphs for both Regions of Interest.
The regression line yielded the C(v) unknown term for equation (1). However, due to time
constraints and need to learn/download data from the European Space Center, which has only
been available for five months the actual calculations were not performed as this work will
continue to move forward using OMEGA data.
Upon conducting this correction, spectral differences between surfaces will no longer influenced
by surface temperature differences. Relative variations between equivalent emissivity spectra
are accurate and are not influenced by atmospheric effects. Thus, ratios and relative differences
within emissivity images represent those of the surfaces being measured.
The next step will be the surface emissivity retrieval from TES data to determine atmospheric
contributions for a large area of a THEMIS image. Then, the atmospheric contributions can be
17
removed from the entire image. As stated before the Martian surface can be described by three
spectral shapes, especially surface dust, typically cover large uniform areas that can be
accurately defined at the spatial resolution of the TES instrument. Such property allows
THEMIS’ emissivity to be defined using TES data in order to determine the atmospheric
contribution. The removal of this contribution can be accomplished on a pixel by pixel basis
from the entire THEMIS image, thus allowing for a resolution suitable for mineralogical unique
surfaces that are not spatially resolvable by TES.
Future Work
Due to the limited ability of THEMIS data to conduct a comprehensive mineral analysis, one
explored the acquisition of OMEGA data, which is part of the Mars Express Mission initiated by
the European Space Agency (ESA). The acquisition of these data is of the essence due the
release time for this data, which occurs every 6 months and there is only one set currently
available and the second is expected to be available the last days of July 2005. OMEGA is a
hyperspectral spectrometer instrument with a spectrum resolution from 0.36 to 5.2 µm in 352
contiguous spectral channels (spectels). The optical part consists in two co-aligned units, each
including a telescope:
• A Visible Channel (VNIR) analyses the light from 0.36 to 1.07 µm 96 spectral lines of
128 columns, imaging at once a crosstrack line of 128 pixels large at the surface of Mars.
• A Near Infrared Channel, named SWIR (Short Wavelength IR Channel) disperses the
light through two spectrometers from 0.93 to 2.7 µm and 2.6 to 5.2 µm, onto two linear In
Sb arrays (whiskbroom mode) cooled down 70K, each with a dedicated cry cooler.
Thus, by combining imagery and spectrometry, it is hypothesized that OMEGA will provide a
mineral and molecular composition of the surface and atmosphere of Mars at a global coverage
at medium resolution (1 to 5 km) from altitudes of 1000 to 4000 km, and snapshots of selected
areas, amounting to
At least a few percents of the surface, with a resolution of a few hundreds meters when observed
close to
periapsis (300 km altitude). In concrete OMEGA should have the capabilities to:
18
• Characterize the composition of surface materials, discriminating between the various
classes of silicates, hydrated minerals, oxides and carbonates, organic frosts and ices;
• Study the time and space distribution of atmospheric CO2, CO and H2O;
• Identify the aerosols and dust particles in the atmosphere, and observe their time and
space distributions
• Monitor the surface dust transportation processes
The data handling and preprocessing is accomplished by the Intitut d’ Astrophysique Spatiale by
obtaining the raw data sorted by orbit bumber, then it proceeds to be PDS formatted (Level 1A),
including decompressed science data, housekeeping and geometric data (1B). Then, it is
calibrated as a result of data reduction performed by the OMEGA software (2) and finally, the
high level derived products such as mineralogical maps will be released (3). Note that only level
1B prime, which contains longitude, latitude, incidence, emergence phase, distance and MOLA
elevation will be available to the public
There are standards used in data product generation including the PDS standard associated with
NASA projects. In addition, the time standards in OMEGA products are as follows:
• UT:year, month, day, hour, minute, second, millisecond
• SCET: seconds and fractions of seconds since January 1st 1970, 00:00:00
• On-board time: seconds and fractions of seconds since last switch-on of the spacecraft
The cartographic standards are of outmost importance when attempting to select imagery of
desired location. For OMEGA products the inertial reference frame starts at eh Earth Mean
mean equator and equinox of Julian Date 2451545.0 (referred to as the J2000 system) is the
standard inertial frame. The Body fixed frame is the center of mass of Mars. The spin axis of
Mars defines the z-axis, whereas the prime meridian provides the direction of the x-axis that lies
on the equatorial plane.
19
The Coordinate system is defined as planetocentric, which consist of longitude measured
positively eastward and planetocentric latitude, defined as the angle between the equatorial plane
and line from the center of mass of mars to given point. Thus, longitudes range from 0 to 360
degrees and the latitudes range from -90 to 90 degrees. The reference surface is based on MOLA
data, which defines the Mars radius as a function of planetocentric latitude and longitude in the
Mars-Body fixed frame.
The OMEGA data object is a QUBE format that does not fulfill ISIS standards. The binary data
is constituted of a cube, 7 side planes in the X direction and 1 side plane in the Y direction. The
cube is coded as 16 bits signed integers. All side-planes are coded as 32 signed bits integers.
However, a reduction software to level 2 is provided is provided by ESA in IDL as a Zip file in
the software directory: SOFT00.ZIP. When unzipping the latest ZIP file it creates a subdirectory
SOFTNN, note that all files form this subdirectory must be copied to the working directory
http://www.rssd.esa.int/SB/PSA/include/MARS_EXPRESS_1_0.html#software . All users’ guide and
information on updates will be provided in the SOFTNN_readme.txt. In addition, the omega
path must be edited so as to point to the proper directories for the QUB and NAV files,
respectively. Note that for windows the path name must end with \ and / for Linux. Then, a
QUB file and its NAV file can be read by typing :
IDL (CR) IDL>.run readomega (CR) OMEGA observation: ORBNNNN_M(CR) (name without the extension) The “readomega” compiles required procedures, then creates the following arrays:
idat: raw data sdat0: dark current and offset jdat: radiance dat1: housekeeping info specmars: solar spectrum(→I/F) wvl: table of wavelengths geocube: geometry information mtf: photometric function exposure: 3 values (C, L, Vis) summation: co-added successive scans
Detailed information on the content of these arrays is provided in the EAICD.
20
Conclusion
Due to limited data availability and difficult image processing, only analysis of radiance in
relation to the individual wavelengths in each spectral category (IR and Vis) could be pursued.
Though the results of this study yielded interesting results, the lack of ground-truthing
temperature data prevented the calculation of emmissivity. As stated earlier, the kinetic
temperature of Mars could not be derived. In order to make mineralogy comparisons between
Earth and Mars, emmissivity which is calculated from Mars kinetic temperature, must be
obtained. However, this does not imply that had emmissivity had been calculated that
mineralogy could be confirmed. The presence of minerals such as basalt, pyroxene and granite
is inherently difficult to evaluate due the influence of other factors. Further work was performed
to remove atmospheric interactions and other environmental interactions such as the contributing
effects. However, due to time constrains one did not calculate the last unknown term to remove
the constant radiance effect from atmosphere constituents such as water vapor, and CO2 gases.
Despite the problems associated with deriving mineralogy results, this study did produce
interesting findings. From the results obtained it was noted that the physical/chemical
composition surrounding the volcano site was consistent throughout the image, while the crater
area analyzed in the Valles Marineris site displayed similarity only with the impact area. In
addition, it was confirmed by the image classification, that regardless of the temperature of an
object, the radiance for different substances with different physical and chemical properties
reveals subtle differences when compared as a whole. The significance of this research is that
the calculation of radiance is the most appropriate parameter for remote sensing of terrestrial
bodies. Current work was performed to eventually calculate the emissivity from THEMIS data.
In addition to this, one learned about the OMEGA instrument and attempted to download data
sets. However, due to lack of processing knowledge one did not successfully utilized these
datasets.
21
References:
http://themis-data.asu.edu/
http://volcano.und.nodak.edu/vwdocs/planet_volcano/mars/Shields/olympus_mons.html
http://astrogeology.usgs.gov/Projects/VallesMarineris/
http://isis.astrogeology.usgs.gov/
http://www.msss.com/moc_gallery/
http://astrogeology.usgs.gov/Projects/MDIM21/#Download
http://www.rssd.esa.int/SB/PSA/include/mex/presentations/OMEGA_dataset_tutorial.pdf
22