Effects of Temperature and Strain Rate on the Tensile Behavior of
14
Effects of Temperature and Strain Rate on the Tensile Behavior of Short Fiber Reinforced Polyamide-6 ZHEN WANG, YUANXIN ZHOU, and P. K. MALLICK Center for Lightweighting Automotive Materials ancl Processing University of Michigan-Dearborn Dearbom, Michigan 481 28 Tensile behavior of extruded short E-glass fiber reinforced polyamide-6 composite sheet has been determined at different temperatures (21.5"C, 50°C 75°C 100°C) and Merent strain rates (O.O5/min, 0.5/min, 5/min). Experimental results show that this composite is a strain rate and temperature dependent material. Both elas- tic modulus and tensile strength of the composite increased with strain rate and decreased with temperature. Experimental results also show that strain rate sensi- tivity and temperature sensitivity of this composite change at a temperature between 25°C and 50°C as a result of the glass transition of the polyamide-6 matrix. Based on the experimental stress-strain curves, a two-parameter strain rate and temper- ature dependent constitutive model has been established to describe the tensile behavior of short fiber reinforced polyamide-6 composite. The parameters in this model are a stress exponent n and a stress coefficient u*. It is shown that the stress exponent n, which controls the strain rate strengthening effect and the strain hard- ening effect of the composite, is not only strain rate independent but also tempera- ture independent. The stress exponent u*, on the other hand, varies with both strain rate and temperature. 1. INTRODUCTION uring the past several years, increasing attention D has been given to the mechanical behavior of en- gineering thermoplastics and thermoplastic matrix composites. One reason for this interest is that engi- neering thermoplastics and their composites are finding increasing applications in many structural automotive components, such as instrument panels, radiator fans, and electronic modules (1).Most of these applications require good performance over a range of temperatures and deformation rates. Hence it has become important to know the effects of temperature as well as strain rate on the mechanical behavior of engineering ther- moplastics and their composites. Polyamide-6 (nylon-6)is a semicrystalline engineer- ing thermoplastic known for its balance of strength, modulus, and chemical resistance. Both polyamide-6 and short E-glass fiber reinforced polyamide-6 com- posite have many potential applications in automo- biles where creep resistance, stifhess and some tough- ness are demanded in addition to welght savings. TWO examples of its automotive applications are radiator fans and air intake manifolds. The E-glass fibers give the composite its stiffness and strength and the poly- amide-6 matrix provides the means of achieving tough- ness and chemical resistance in addition to holding the fibers together. Several publications have consid- ered the mechanical properties of short fiber reinforced polyamides. For example, Laura et aL (2) examined the effect of glass fiber content on the tensile modulus, yield strength and impact strength of a rubber-tough- ened polyamide-6. Darlington and Smith (3) reported the creep, creep rupture and impact strength of short fiber reinforced polyamide-6 and polyamide-6, 6. Akay and Barkley (4) examined the fiber orientation effect on the elastic modulus, tensile strength and fracture properties of injection molded polyamide composites. Ramsteiner and Theysohn (5) studied the effect of fiber/matrix interfacial strength and fiber volume h c - tion on the tensile and impact strengths of unidirec- tional, short glass fiber reinforced polyamide-6. In this paper, the tensile behavior of a short E-glass fiber reinforced polyamide-6 composite is examined at four different temperatures and three Merent strain rates. Based on the experimental results, a two-pa- rameter constitutive equation is proposed that can be 858 POLYMER COMPOSITES, OCTOBER 2002, Vol. 23, No. 5
Transcript of Effects of Temperature and Strain Rate on the Tensile Behavior of

Effects of Temperature and Strain Rate on the Tensile Behavior
of Short Fiber Reinforced Polyamide-6
ZHEN WANG, YUANXIN ZHOU, and P. K. MALLICK
Center for Lightweighting Automotive Materials ancl Processing University of Michigan-Dearborn
Dearbom, Michigan 481 28
Tensile behavior of extruded short E-glass fiber reinforced polyamide-6 composite sheet has been determined at different temperatures (21.5"C, 50°C 75°C 100°C) and Merent strain rates (O.O5/min, 0.5/min, 5/min). Experimental results show that this composite is a strain rate and temperature dependent material. Both elas- tic modulus and tensile strength of the composite increased with strain rate and decreased with temperature. Experimental results also show that strain rate sensi- tivity and temperature sensitivity of this composite change at a temperature between 25°C and 50°C as a result of the glass transition of the polyamide-6 matrix. Based on the experimental stress-strain curves, a two-parameter strain rate and temper- ature dependent constitutive model has been established to describe the tensile behavior of short fiber reinforced polyamide-6 composite. The parameters in this model are a stress exponent n and a stress coefficient u*. It is shown that the stress exponent n, which controls the strain rate strengthening effect and the strain hard- ening effect of the composite, is not only strain rate independent but also tempera- ture independent. The stress exponent u*, on the other hand, varies with both strain rate and temperature.
1. INTRODUCTION uring the past several years, increasing attention D has been given to the mechanical behavior of en-
gineering thermoplastics and thermoplastic matrix composites. One reason for this interest is that engi- neering thermoplastics and their composites are finding increasing applications in many structural automotive components, such as instrument panels, radiator fans, and electronic modules (1). Most of these applications require good performance over a range of temperatures and deformation rates. Hence it has become important to know the effects of temperature as well as strain rate on the mechanical behavior of engineering ther- moplastics and their composites.
Polyamide-6 (nylon-6) is a semicrystalline engineer- ing thermoplastic known for its balance of strength, modulus, and chemical resistance. Both polyamide-6 and short E-glass fiber reinforced polyamide-6 com- posite have many potential applications in automo- biles where creep resistance, stifhess and some tough- ness are demanded in addition to welght savings. TWO examples of its automotive applications are radiator fans and air intake manifolds. The E-glass fibers give
the composite its stiffness and strength and the poly- amide-6 matrix provides the means of achieving tough- ness and chemical resistance in addition to holding the fibers together. Several publications have consid- ered the mechanical properties of short fiber reinforced polyamides. For example, Laura et aL (2) examined the effect of glass fiber content on the tensile modulus, yield strength and impact strength of a rubber-tough- ened polyamide-6. Darlington and Smith (3) reported the creep, creep rupture and impact strength of short fiber reinforced polyamide-6 and polyamide-6, 6. Akay and Barkley (4) examined the fiber orientation effect on the elastic modulus, tensile strength and fracture properties of injection molded polyamide composites. Ramsteiner and Theysohn (5) studied the effect of fiber/matrix interfacial strength and fiber volume h c - tion on the tensile and impact strengths of unidirec- tional, short glass fiber reinforced polyamide-6.
In this paper, the tensile behavior of a short E-glass fiber reinforced polyamide-6 composite is examined at four different temperatures and three Merent strain rates. Based on the experimental results, a two-pa- rameter constitutive equation is proposed that can be
858 POLYMER COMPOSITES, OCTOBER 2002, Vol. 23, No. 5
Eflects of Temperature and Strain Rate
used to predict the tensile stress-strain characteris- tics of this composite over the range of temperatures and strain rates considered. The strain rate and tem- perature sensitivities of tensile strength and modulus of the composite are also established.
2. EKpERwlENTs The material used in this study was a short E-glass
fiber reinforced polyamide-6 (trade name: Capron 8233). The fiber content in this composite was 33% by weight. Several extruded sheets of this material were obtained from AUiedSignal Plastics. The glass transition tem- perature, Tg of polyamide-6 matrix is between 40°C and 50°C (6) and its melting point is 215°C. In a re- cent study (7), the glass transition temperature of poly- amide-6 is reported as 40°C.
Dogbone-shaped tensile specimens were machined from one of the extruded sheets in the extrusion di- rection and normal to the extrusion direction of the sheet. Uniaxial tension tests were performed on an MTS servohydraulic testing machine equipped with an environmental chamber in which heating is performed by forced air convection. Axial strain was measured us- ing a strain gauge extensometer (25 mm gauge length). The tests were conducted at three different crosshead speeds, namely 1.25, 12.5 and 125 mm/min and at four different temperatures, namely 21.5, 50, 75 and 100°C. Since the gauge length was 25 mm. the average strain rates were assumed to be 0.05, 0.5 and 5 min-'. Three parameters were determined from each stress- strain curve: elastic modulus @]. tensile strength (ub). and failure strain (&b). Elastic modulus or Young's modulus is the initial slope of the stress-strain curve. Tensile strength is the stress at failure and the strain corresponding to the tensile strength is the failure Strain.
3. RESULTS
Tensile stress-strain curves of the short E-glass fiber reinforced polyamide-6 composite in the extrusion di- rection and normal to the extrusion direction are shown in ms. 1-4. The tensile stress-strain curves are mostly non-linear and do not exhibit any obvious yield point. The rate at which stress increases with strain reduces drastically after an initial rapid increase and at higher temperatures, the stress-strain curves become nearly flat as the failure strain is approached.
W e s 1 and 2 show the effect of temperature on the stress-strain curves of the polyamide-6 composite in the extrusion direction and normal to the extrusion direction, respectively. As expected, the overall stress level decreases with increasing temperature. Both modulus and tensile strength decrease with increas- ing temperature, while the failure strain increases as the temperature is increased up to 75°C; however, at lOO"C, the failure strain is decreased. Figure 3 shows the effect of strain rate on the stress-strain curves of the polyamide-6 composite in the extrusion direction (Figs. 3a and 3b) as well as normal to the extrusion
direction (Figs. 3c and 3d) at 21.5 and 100°C. It is ob- served in these figures that the overall stress level in- creases with increasing strain rate: however, the effect of strain rate on the failure strain is relatively small for the three strain rates investigated.
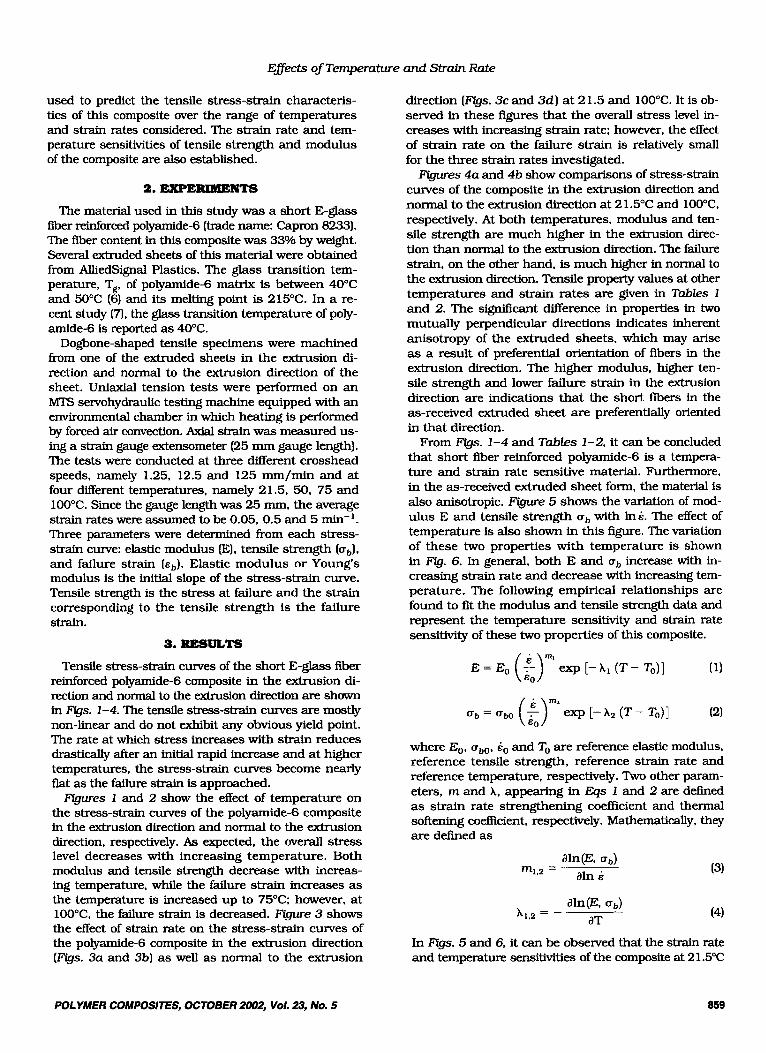
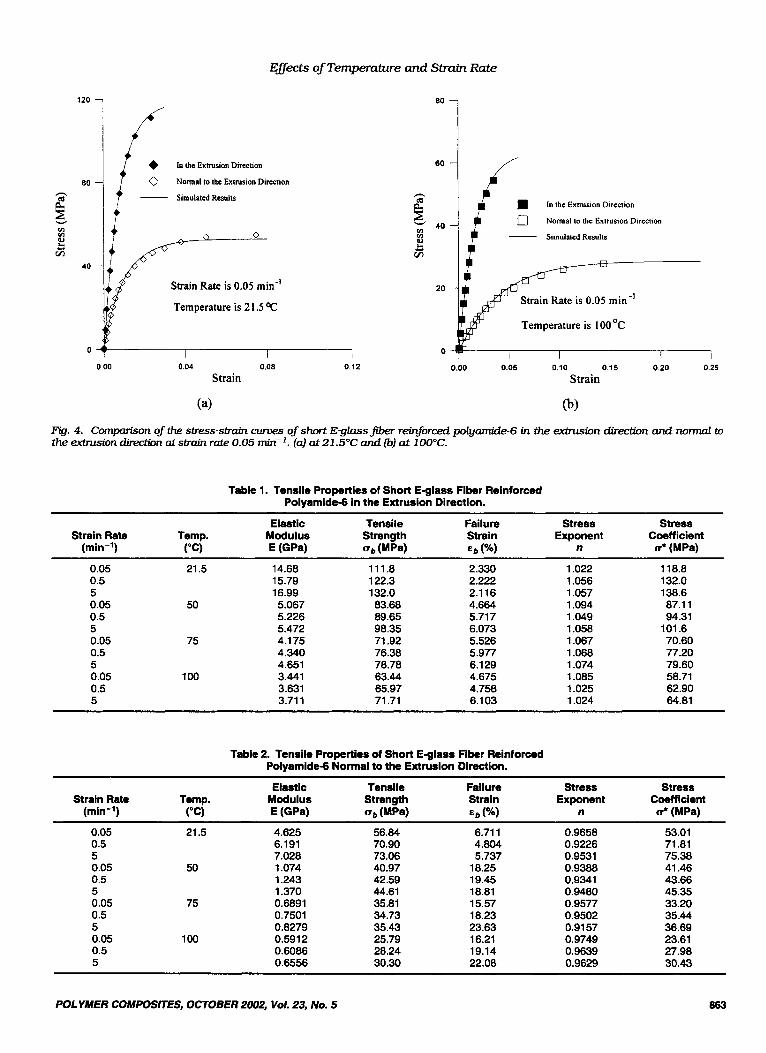
Figures 4 a and 4b show comparisons of stress-strain curves of the composite in the extrusion direction and normal to the extrusion direction at 21.5"C and 100°C. respectively. At both temperatures, modulus and ten- sile strength are much higher in the extrusion direc- tion than normal to the extrusion direction. The failure strain, on the other hand, is much higher in normal to the extrusion direction. Tensile property values at other temperatures and strain rates are given in Tables I and 2. The significant difference in properties in two mutually perpendicular directions indicates inherent anisotropy of the extruded sheets, which may arise as a result of preferential orientation of flbers in the extrusion direction. The higher modulus, higher ten- sile strength and lower failure strain in the extrusion direction are indications that the short fibers in the as-received extruded sheet are preferentially oriented in that direction.
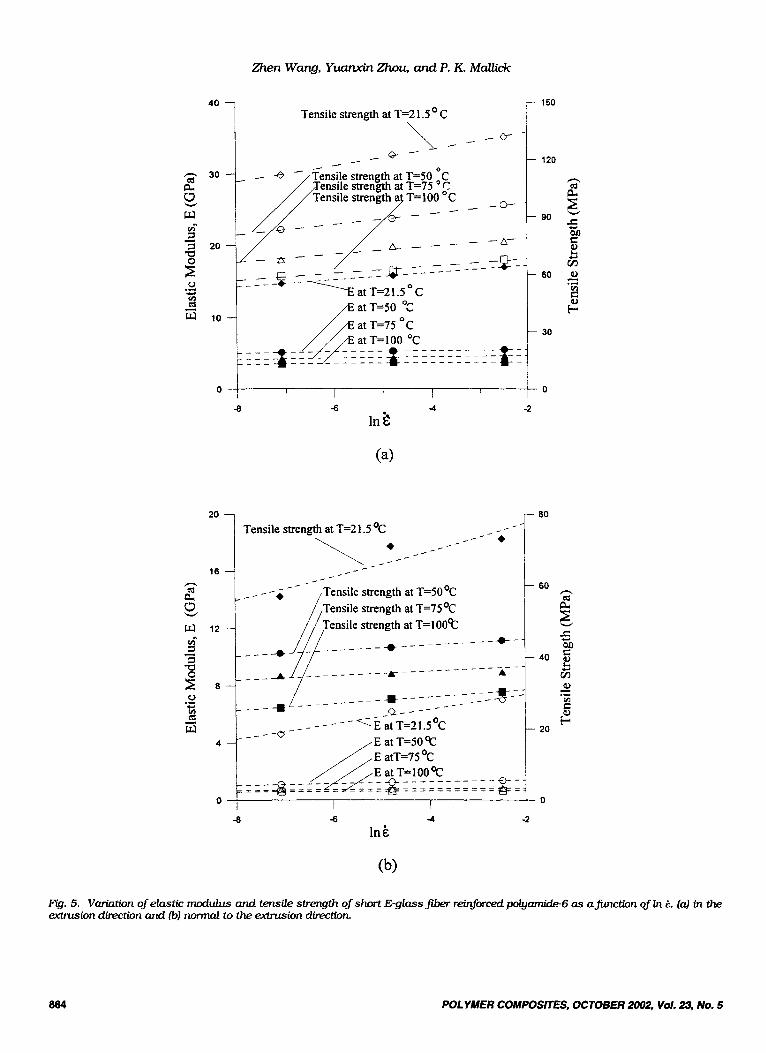
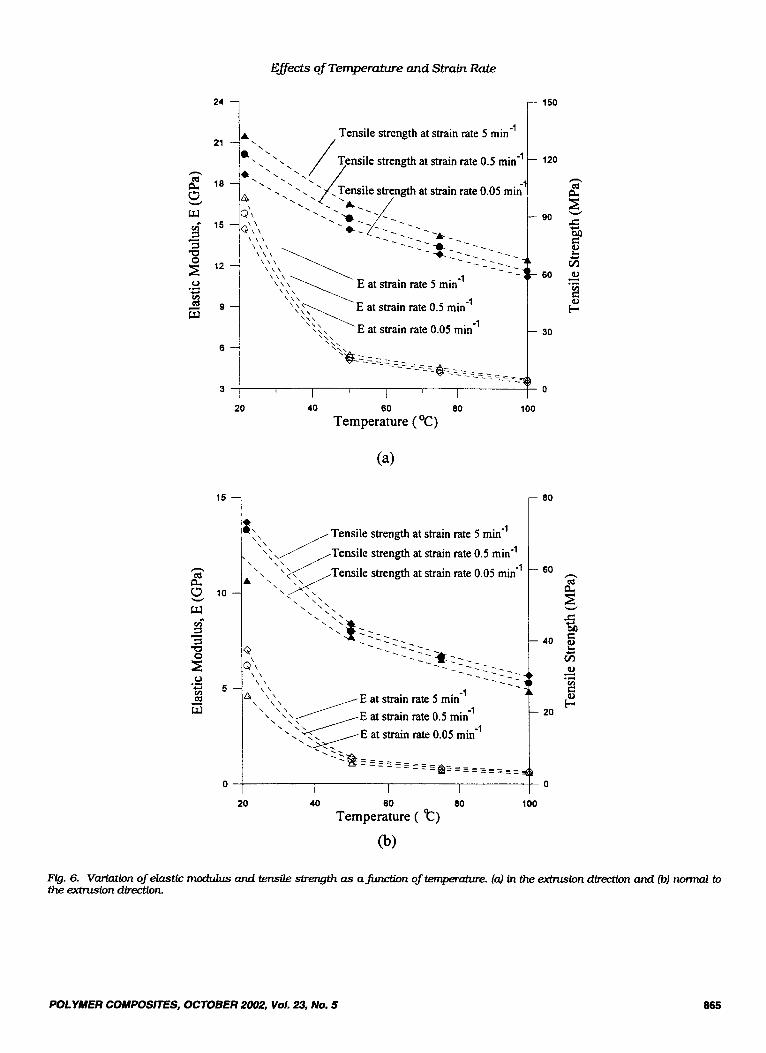
From Figs. 1-4 and Tables 1-2, it can be concluded that short fiber reinforced polyamide-6 is a tempera- ture and strain rate sensitive material. Furthermore, in the as-received extruded sheet form, the material is also anisotropic. Figure 5 shows the variation of mod- ulus E and tensile strength ub with Ink. The effect of temperature is also shown in this figure. The variation of these two properties with temperature is shown in Fig. 6. In general, both E and cb increase with in- creasing strain rate and decrease with increasing tem- perature. The following empirical relationships are found to fit the modulus and tensile strength data and represent the temperature sensitivity and strain rate sensitivity of these two properties of this composite.
E = Eo ( i)ml exp [- A l (T - To)] (1)
where E,, UbO, 6, and To are reference elastic modulus, reference tensile strength, reference strain rate and reference temperature, respectively. Two other param- eters, rn and A, appearing in Eqs I and 2 are defined as strain rate strengthening coefficient and thermal softening coefficient, respectively. Mathematically, they are defined as
(3)
(4)
In Figs. 5 and 6. it can be observed that the strain rate and temperature sensitivities of the compite at 2 1.5"C
ub)
aT A1.2 = -
POLYMER COMPOSITES, OCTOBER 2002, Yo/. 23, No. 5 859

Zhen Wary, Yuanwin Zhou, and P. K. Mallick
120 -
80
40
0
In the Extrusion Direction
Strain Rate 0.05 min-*
m m 2 r3i
150 1
In the Extrusion Direction Strain Rate 5 rnin -'
100 n
k m m 2 3i
50
0
160
120
n
0.00 0.02 0.04 0.06 0 00 0.02 0.04 0.06 0.08
Strain Strain
TEMPERATURE C
0 21.3 //! ,%. - Simulated Results
40
0.00 0.02 0.04 0.06 Strain
(b)
are considerably different from that at the other three temperatures. This is indicated by the change in slope that occus as the temperature is increased h m 21.5"C to 50°C. Since the glass transition temperature of poly- amide-6 is between 40°C and 50"C, it is assumed that the strain rate sensitivity has changed due to glass transition. Assuming 6, = O.O5/min and To = 5OoC, m and X values are calculated from the experimental results using the least square method (Table 3). The
Rg. 1. Effect of temperature on the stress-strain CLUES of short E-glassjiber reinforced polyamide-6 in the extrusion direction at three dzffmnt strain rakes. (Q) 0.05 min-', (bl0.5 min-' and Icl 5 m-1.
strain rate sensitivity and temperature sensitivity val- ues are given over two temperature ranges, between 21.5"C and 50°C and between 50°C and 100°C. It can be observed that both modulus and strength are more temperature sensitive between 2 1.5"C and 50°C than between 50°C and 100°C. The strain rate sensitivity of modulus is also much higher between 21.5"C and 50°C. The difference in strain rate sensitivity of tensile strength is not as high as in the case of modulus. It
860 POLYMER COMPOSITES, OCTOBER 2002, Vd . 23, No. 5

Effects of Temperature and Strain Rate
h
k E, v1
M b m
6o 1
Normal to the Extrusion Direction Strain Rate 0.05 min-'
r n _I x n
0 21.5
n 50
G 15
0 100
Simulated Results
I I 0.00 0.05 0.10 0.15 0.20 0.25
Strain
- Simulated Refults I 4
ormal to the Extrusion Direction Strain Rate 0.5 rnin
T I I I I I 0.00 0.05 0.10 0.15 0.20 0.25
Strain
can also be observed fiom this table that the strain rate sensitivity and temperature sensitivity of E-glass fiber reinforced polaymide-6 is much lower in the extrusion direction than normal to the extrusion direction. The difference in strain rate and temperature sensitivity in these two mutually perpendicular directions can also be explained in terms of preferential fiber orientation in the extrusion direction of the sheet. As a result of the preferential orientation, the extrusion direction is more fiber-dominated and the normal to the extrusion direction is more matrix-dominated.
80
Temperature 'i:
6 O - I i h
k ' v) 40 vl p! G
20
n 50
0 75
0 100
- Simulated Results
0.00 0.05 0.10 0.15 0.20 0.25 Strain
(c )
Flg. 2. E f f i of temperature on the stress-strain curues of short E-glass fiber reinforced polyamide-6 normal to the exhuswn direction at three different strain rates. (3 0.05 m-', (b) 0.5 mbi' and (c) 5 min-'.
4. CONSTITUTIVE EQUATION In this section, we develop a constitutive equation
that describes the tensile stress-strain behavior of short fiber reinforced polyamide-6. The total strain is assumed to be the sum of elastic strain, E,, and in- elastic strain, si, (8), so that the strain rate can be written as
(5)
where, 6, and di represent the strain rates correspond- ing to the elastic and inelastic components, respectively.
& = E, + Et
POLYMER COMPOSITES, OCTOBER2002, Vol. 23, No. 5 a61

h e n Wang, Yuanxin Zhou, and P. K. Mallick
h
a" E v) v)
e I%
Temperature is 2 1.5 O C
Strain Rate ( m i d )
-f 0.05
.3 0.5
Simulated Results
0.00 0.01 0.02 0.03 Strain
80
60
n ' v) 40
a"
v)
2 I%
In the Extrusion Direction Temperature 100 OC
Strsin Rate (mid')
-1 0.0.5
9 0.5
3 5
__ Simulated Results
h
k z v) 40 v)
2 tz
20
+
Normal to the Extrusion Direction
Temperature 2 1.5 O C
Strain Rate (min-')
+ 0.05
0 0 5
2 s Simulated RCSU~IS
J +
Normal to the Extrusion Direction
Temperature 2 1.5 O C
Strairl Rate (min-')
+ 0.05
0 0 5
2 s Simulated RCSU~IS
I --r--------- I - I 0 -
0.00 0.02 0.04 0.06 0.08 Strain
(c>
40
30
n
2 E m 20 m 2 tz
Normal to Extrusion Direction Temperature 100 O C
Strain Rate (mid')
-t 0.05
0 s 0 G.5
Simulated Results
I----- T - i - - - - I - l 0.00 0.05 0 10 0.15 0.20 0.25 0.00 0.02 0.04 0.06
Strain Strain (b) (4
Fig. 3. Effkct of strain rate on the stress-strain curves of short E - g l a s s m reinforced polyamide-6 at 21.5 and 100°C. (a) and (b) in the c3inlsw . n direction, (c) and (d) n o d to the exbvsion direction
The elastic strain rate is assumed to be path-inde- pendent, such that
1 du E dt
&,=--
where E is elastic modulus of the material, and u is the stress. The inelastic strain rate, hi, is assumed to follow a power-law function of stress
d, = c ( ;)n (7)
where cro and n are defined as the reference stress and the stress exponent, respectively. Both the strain rate strengthening as well as the strain hardening effects of the composite are controlled by the stress exponent n. C is a material parameter. Substituting Eqs 6 and 7 into JZq 5, we obtain
862 POLYMER COMPOSITES, OCTOBER 2002, Vol. 23, No. 5
Effects of Temperature and Strain Rate
120
80 - k z v) m 2 sj
40
0
80
I
In the Extrusion Direction
Normal to the Extrusion Direction
Simulated Results
0
t
Temperature i s 2 1.5 OC f I I 1
0.00 0.04 0.08 0.12
Strain
60
n ' m 40
s m 2 sj
20
0
In the Extrusion Direction
Simulated Results
i. 4 0 Normal to the Extrusion Khrcction + - - Strain Rate i s 0.05 min-'
Temperature is 100 O C
I I I 1 1 0.00 0.05 0.10 0.15 0.20 0.25
Strain
Fig. 4. Comparison of the stress-strain m e s of short Eglassfiber reinforced polyamide-6 in the extrusion direction and normal to the extrusion direction at strain rate 0.05 mW'. (3 at21.5"C and (b) at 100°C.
Table 1. Tensile Properties of Short E-glass Fiber Reinforced Polyamide-6 in the Extrusion Direction.
Elastic Tensile Failure Stress Stress Strain Rate Temp. Modulus Strength Strain Exponent Coefficient
(min-I) ("C) E (GPa) ub (MPa) Eb n u* (MPa) ~
0.05 0.5 5 0.05 0.5 5 0.05 0.5 5 0.05 0.5 5
~~ ~ ~~
21.5 14.68 15.79 16.99
50 5.067 5.226 5.472
75 4.175 4.340 4.651
100 3.441 3.631 3.71 1
~ ~~
111.8 122.3 132.0 83.68 89.65 98.35 71.92 76.38 78.78 63.44 65.97 71.71
~
2.330 2.222 2.116 4.664 5.71 7 6.073 5.526 5.977 6.1 29 4.675 4.758 6.103
~~~
1.022 1.056 1.057 1.094 1.049 1.058 1.067 1.068 1.074 1.085 1.025 1.024
118.8 132.0 138.6 87.1 1 94.31
70.60 77.20 79.60 58.71 62.90 64.81
101.6
Table 2. Tensile Properties of Short E-glass Fiber Reinforced Polyamide-6 Normal to the Extrusion Direction.
Elastic Tensile Failure stress Stress Strain Rate Temp. Modulus Strength Strain Exponent Coefficient
(min-l) ("C) E (GPa) ub (MPa) n U* (MPa)
0.05 21.5 4.625 56.84 6.71 1 0.9658 53.01 0.5 6.191 70.90 4.804 0.9226 71.81 5 7.028 73.06 5.737 0.9531 75.38 0.05 50 1.074 40.97 18.25 0.9388 41.46 0.5 1.243 42.59 19.45 0.9341 43.66 5 1.370 44.61 18.81 0.9480 45.35 0.05 75 0.6891 35.81 15.57 0.9577 33.20 0.5 0.7501 34.73 18.23 0.9502 35.44 5 0.8279 35.43 23.63 0.9157 36.69 0.05 100 0.5912 25.79 16.21 0.9749 23.61 0.5 0.6086 28.24 19.14 0.9639 27.98 5 0.6556 30.30 22.08 0.9629 30.43
POLYMER COMPOSITES, OCTOBER 2002, Vol. 23, No. 5 863
Zhen Wcug, Yuanxin Zhou, and P. K. Mallick
40
w
Tensile strength at T=2 1.5 C 1 \ 1- / / Q - -
1
Gnsile strength at T=50 O C ensile strength at T=75 C
i /E at T=75 OC c
150
120
90 - s e iz M c
I I I I I I 1 0
-8 6 4 In 6
-2
20 1 r- 80
/ @ - - . + Tensile strength at T=2 1.5 OC
- _ - - 16 n
d 2, w 12 -I
-8 -6 -4
Ink -2
Flg. 5. Variation of elastic modulus and tensile strength of short E-glass Jib, reinforced plyamide-6 as afunction of In 6. (4) in the ewbuswn direction and (b) normal to the airusion direction
864 POLYMER COMPOSITES, OCTOBER 2002, Vol. 23, No. 5
Eflects of Temperature and Strain Rate
24
21
n g 18
9 w m- 15 3 3 Q
- 5 12
0 .- .I-. v)
9 9 W
Tensile strength at strain rate 5 min-' /
strength at strain rate 0.5 min-'
strength at strain rate 0.05 mini 4
\ \ \
\ \ \
E at strain rate 5 min" \"'\E \ \ \
at strain rate 0.5 min-'
\ \ \ \ \ \ E at strain rate 0.05 mid' \ \ \
20 40 60 80 100
Temperature ("C)
€ \ ,- Tensile strength at strain rate 5 mid' '';\ / Tensile strength at strain rate 0.5 mi"-' . \ \ , \ : : r i l e strength at strain rate 0.05 min-' \ \;\ /
\ \ \ \ \ \ \
'. 1:' . . '\\'$ : . . - - - - . - . . . - . - - - - - ._ - . - - 3 -..*:I.- . - - . - - -_ - - - - 3\\ - - - -._-- \ \ - _ \ \
-1 \ \
A, \ > \ NE at strain rate 5 min \ \ \
\ \ \ \ \ \ E at strain rate 0.5 min'
' ' \ N E at strain rate 0.05 min" '-:W
20 40 80 80 100 Temperature ( t)
(b)
Rg. 6. Variation of elastic moduIus and tensile strength as afunction of temperature. (4) in the ewtruswn direction and the extrusion direction
n o d to
POLYMER COMPOSITES, OCTOBER 2002, Vol. 23, No. 5 865

Zhen Wang, Yuanwin ZJwu, and P. K. Mallick
Table 3. Strain Rate Strengthening Coefficients and Thermal Softening Coefficients of Short E-Glass Fiber Reinforced Polyamide-6.
In the Extrusion Direction Normal to the Extrusion Direction
Temperature Range ("C) 21 5-50 50-1 00 21 5-50 50-1 00 m, (for elastic modulus) 0.03177 0.01 884 0.09085 0.03546 A, (for elastic modulus) 0.03862 0.007956 0.05500 0.01 366
A, (for tensile strength) 0.01 094 0.007073 0.01556 0.008403 m, (for tensile strength) 0.0361 1 0.03034 0.05451 0.03499
If we further assume that u* = u o / w , Eq 8 can be rewritten as
- E - E (%>" du de _ -
In Eq 9, the parameter u* is called the stress coeffi- cient.
To determine the parameters n and u*, we take log- arithms on both sides of Eq 9 to write
In E - - = n l n u - n l n u * + l n E (10) ( 2) Equation I 0 represents a linear plot of In
vs. ha. The slope of this linear plot is equal to the
10
8
h
w
0 6
F
8 E 4
4
2
Temperature
0 100
0 7s
n 50
0 21.5
/' Ef' / I
I / , , I , In the Extrusion Direction
STrain Rate is 0.05 min-' /' 3
stress exponent n and the intercept on the ordinate is equal to (In E - nlnu*), from which the stress coeffi- cient u* can be determined.
The values of In E - - are derived from the
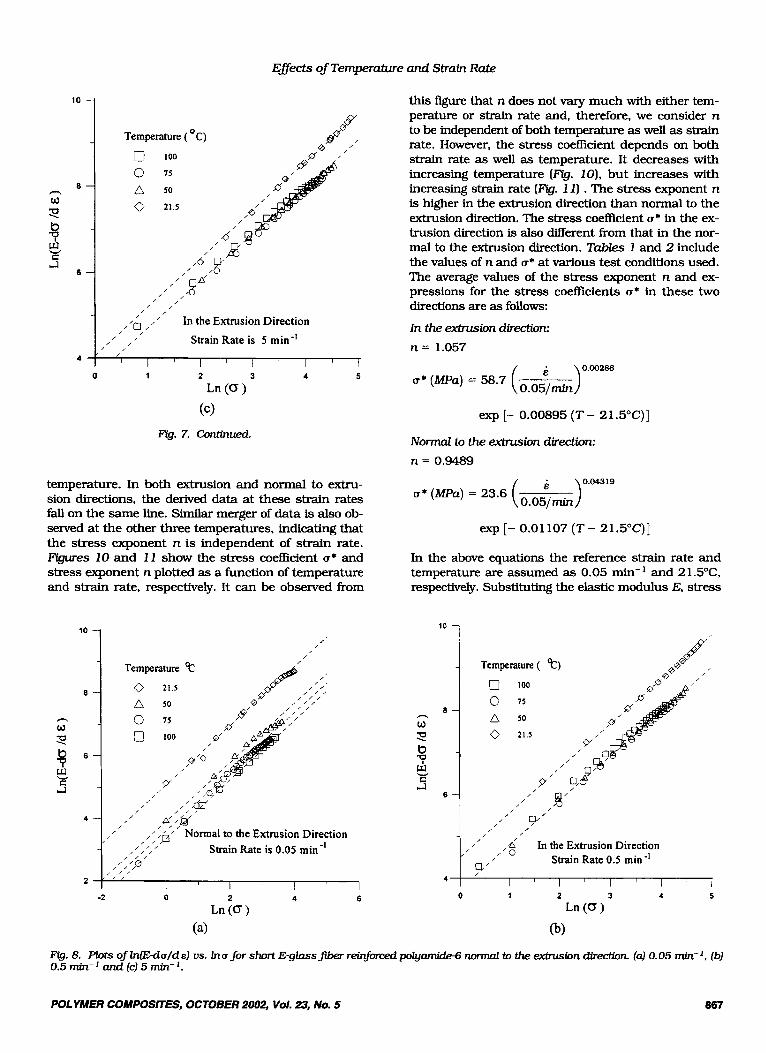
stress-strain plots shown in Figs. I and 2. FIgues 7 and 8 show the plots In(E - du/de) vs. In u at 21.5"C, 50°C 75°C and 100°C for the extrusion direction and n o d to the extrusion direction, respectively. As these figures show, these plots are linear at all four temper- atures. In the extrusion direction, the derived data at 5OoC, 75°C and 100°C fall on the same line, but the line representing the 2 1.5"C temperature is distinctly different. In the normal to the extrusion direction, the lines representing the four different temperatures are separated, although the 50"C, 75°C and 100°C-lines are much closer than the 2 1.5"C line.
Figure 9 shows the plots of In (E - du/ds) vs. In u at strain rates 0.05, 0.5 and 5 min-' for the 21.5"C test
( 2)
10
8 n w 2 t3 &
6 5
4
Temperature
0 100
0 75
A 50
0 21.5
,114' ,%/' /' 0'
I
/" , , g' In the Extrusion Direction
I I
Strain Rate 0.5 min -' Q'
I I I I I I I I 0 1 2 3 4 5
Ln (0 )
Fig. 7. Plots of h@-du/dE) us. lnu for short E - g l a s s m reinforced polyamide-6 in the a w n direction (4) 0.05 min-', (b) 0.5 min-1 and (c) 5 mil-'.
866 POLYMER COMPOSITES, OCTOBER 2002, Vol. 23, No. 5
Eflects of Temperature and Strain Rate
1
8 n W
?? b
3 6
Temperature
0 100
0 75
n 50
0 21.5
: O C )
.6
I /
In the Extrusion Direction
Strain Rate is 5 min-'
/ I
/'O;' , , , I
, I
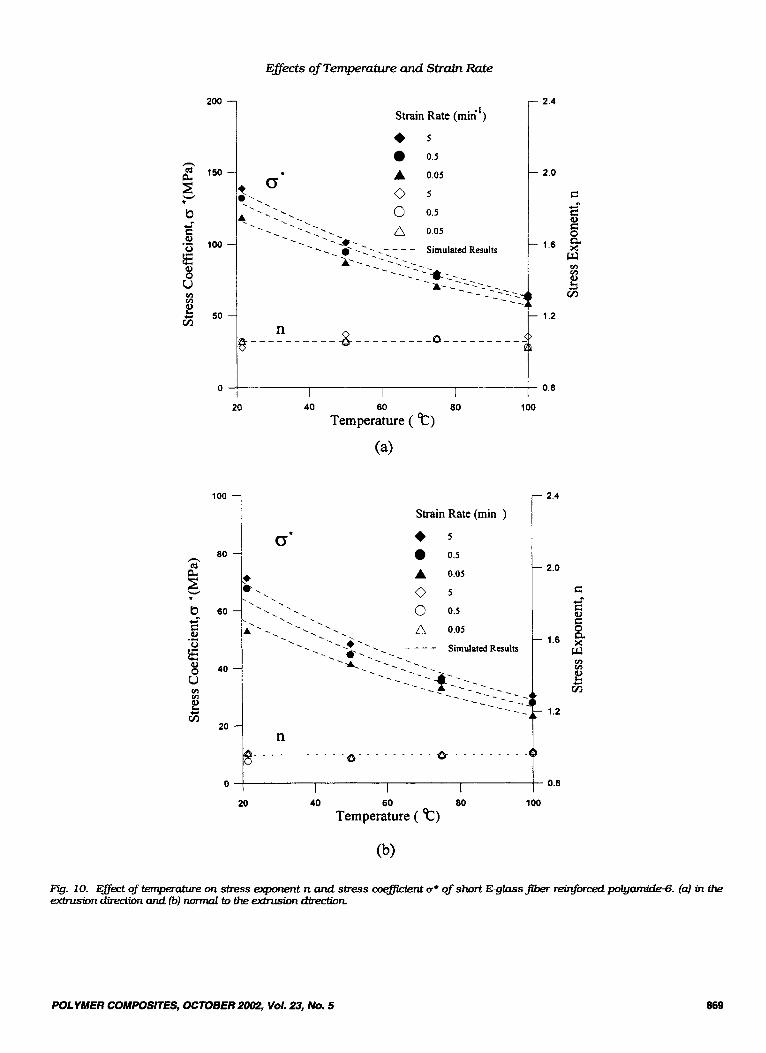
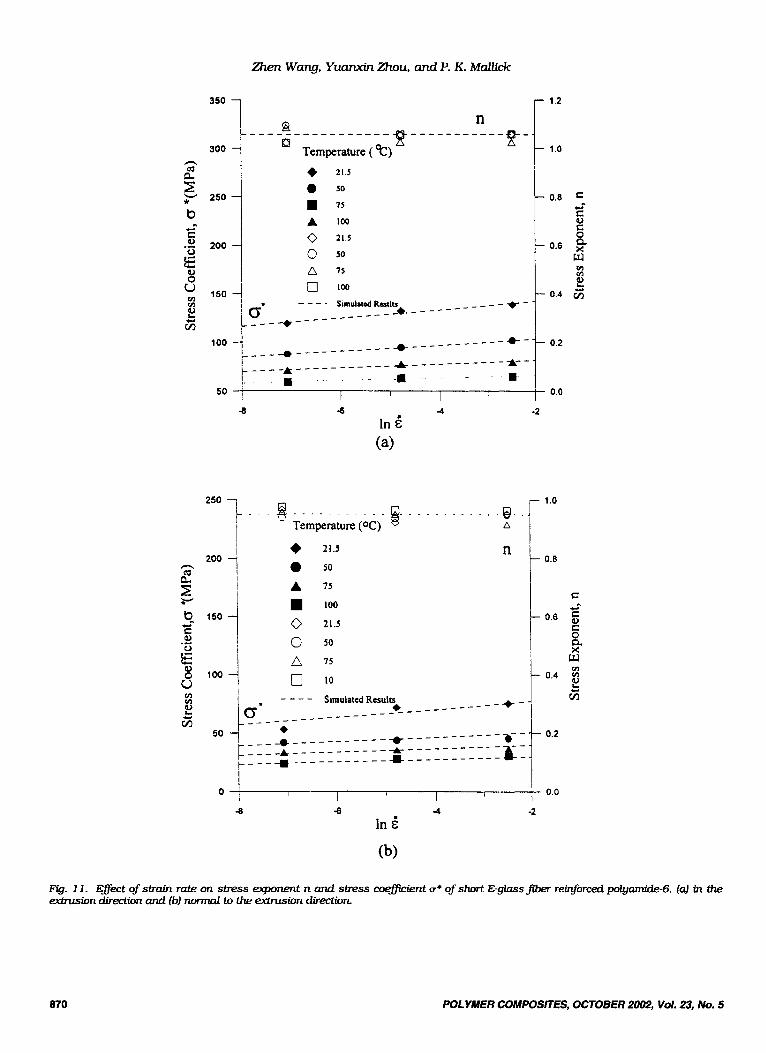
temperature. In both extrusion and normal to extru- sion directions, the derived data at these strain rates fall on the same h e . Similar merger of data is also ob- served at the other three temperatures, indicating that the stress exponent n is independent of strain rate. m e s 10 and 1 1 show the stress coefficient u* and stress exponent n plotted as a function of temperature and strain rate, respectively. It can be observed from
10
8
h
W z! S 6 & E cl
4
2
this figure that n does not vary much with either tem- perature or strain rate and, therefore, we consider n to be independent of both temperature as well as strain rate. However, the stress coefficient depends on both strain rate as well as temperature. It decreases with increasing temperature (Rg. 10). but increases with increasing strain rate (Fig. 1 I) . The stress exponent n is higher in the extrusion direction than normal to the extrusion direction. The stress coefficient cr* in the ex- trusion direction is also different from that in the nor- mal to the extrusion direction. Tables 1 and 2 include the values of n and u* at various test conditions used. The average values of the stress exponent n and ex- pressions for the stress coefficients u* in these two directions are as follows:
In the extrusion direction. n = 1.057
( o.o;min> o.oo286 u* (ma) = 58.7 ( o.o;min> o.oo286 u* (ma) = 58.7
exp [- 0.00895 (T - 21.5OC)I
Normal to the exbusion directiom n = 0.9489
u* (Wa) = 23.6 (O.O~min)o-DIslg CXP [- 0.01107 (T - 21.5OC)I
In the above equations the reference strain rate and temperature are assumed as 0.05 min-' and 21.5OC, respectively. Substituting the elastic modulus E, stress
10
a n W 2 b 2
6 s
4
Temperature
0 100
c 75
50
0 21.5
/' , ,$' In the Extrusion Direction
1
Strain Rate 0.5 min-' 9' I I I I I
0 1 2 3 4 5
Ln (0 ) 0)
Rg. 8. Plots Of k@-du/dE] us. h u for short E-glass- reinforcedpolyamide-6 nomud to the ewbuswn direction (4) 0.05 min-', fb) 0.5 mir-' and (c) 5 min-'.
POLYMER COMPOSITES, OCTOBER 2002, Yo/. 23, No. 5 867

Zhen Wang, Yuanxin Zhou, and P. K. Mdick
6. CONCLUSIONS
Uniaxial tensile tests were conducted on an extruded polyamide-6 matrix composite sheet containing 33 weight YO short E-glass fibers at four different temper- atures and three Merent strain rates. Based on the ex- perimental data, the following conclusions are reached
1. Short E-glass fiber reinforced polyamide-6 is a typical strain rate and temperature dependent ma- terial. Both elastic modulus and tensile strength of the composite decrease with increasing tem- perature and increase with increasing strain rate. There is a change in the strain rate sensitivity and the temperature sensitivity of composite be- tween 21.5"C and 50°C. possibly as a result of the glass transition of the polyamide-6 matrix.
2. The extruded composite sheet is anisotropic in the sense that the tensile properties of the sheet in the extrusion direction are significantly dif- ferent from those in the normal to the extrusion direction. The strain rate and temperature sensi- tivities of the composite are much lower in the extrusion direction than normal to the extrusion direction.
3. A two-parameter strain rate and temperature dependent constitutive model has been estab- lished to describe the tensile behavior of com- posite. The parameters in this model are called the stress exponent and the stress coefficient. The stress exponent n, which controls the strain rate strengthening effect and strain hardening
Temperature OC i 0 21.5
D C
P- ,
, ,
J -
Normal to the Extrusion Direction Strain Rate is 5 min -'
2
0 1 2 3 4 5
Ln (0 )
(c) Fig.8. Continued
exponent n and stress coefficient u* into Eq 9, the slope of the stress-strain curve, du/ds , is calculated in a step-wise fashion at a strain interval of 0.005, starting with du/de = Eat E = 0 and u = 0. The re- sulting stress-strain plots are shown in Figs. 1-4 and they seem to fit the experimental data well.
lo 1
Strain Rate (mid' )
+ 0.05
a 0.5
0 5
0'
/' In the Extrusion Direction I Temperature 2 1.5 C
+a'' 6 I I I I
1 2 3 4 5
I I I
Ln (0 )
n w 'I 8
T!
C
6
!Y- +/ Q
,,is'
,
Strain Rate (min )
Normal to the Extrusion Direction Temperature 21.5 OC
4
0 1 2 3 4 5
Ln (0 1
FXg. 9. Plots of In(E-du/de) us. lnu for siwrt E-glass fiber reinforced polyamide-6 at 21.5"C. (4 in the extrusion direction and @) m d to the ewtruswn direction.
868 POLYMER COMPOSITES, OCTOBER 2002, Vol. 23, No. 5
Effects of Temperature and Strain Rate
200
n 2 150
b c-
.- 100 s
s 2 50
!2 0 m m
3;
0
Strain Rate (min')
* 5
0.5
0 5
A 0.05
20 40 60 80 100
Temperature ( 't=)
(a)
loo 1 80 4 6
. 2.4
- 2.0
c 4 2
E 0
. 1.6 a
$
r3 m m 2 G
. 1.2
. 0.8
Strain Rate (min )
+ s 0.5
2.0
c c- c
0
w
2 1.6
m m 2 G
1.2
20 40 60 80 100
Temperature ( t)
Fig. LO. ED& of temperature on stress exponent n and stress coe-nt u* of short E-glnss @?r reinforced polyamide-6. (d in t%e exbusiondirectionandfb) dtotheewbusiondirect ion
POLYMER COMPOSITES, OCTOBER2OO2, Vol. 23, No. 5 869
Zhen Wang, Yuanxin m u , and P. K. Mallick
b
1 r
i 0 21.5
0 50
n 75
.-f
0.8
0.6
0.4
I I I I j 0.0
-8
21.5
a SO
A 75
100
c. 50
n 75
a 10
0 21.5
@ - -
n A
i O I I I 1 I I
-2
c
- 1.0
- 0.8
C cr c 0 P X w
- 0.4 v)
- 0.6
v)
2 tj
- 0.2
- 0.0
Flg. 11. Effect of strain rate on stress exponent n and stress coe-nt u* of short E - g h s jiber reinforced polyamide-6. (a) in the extrusion direction and (b) normal to the exbusion direction
870 POLYMER COMPOSKES, OCTOBER 2002, Vol. 23, No. 5

Eflects of Temperature and Strain Rate
effect of the composite, are not only strain rate independent, but also temperature independent. The stress coefficient u*, on the other hand, de- pend on both strain rate and temperature.
6. ACKNOWLEDGMENT The authors would like to acknowledge the financial
support provided by the Ford Motor Company under its University Research Program to conduct this re- Search.
POLYMER COMPOSITES, OCTOBER 2002, Vol. 23, No. 5
7. REFERENCES 1. J. L. Broge. Auto. Eng., 108, 70 (2000). 2. D. M. Laura, H. Keskkula, J. W. Barlow, and D. R. Paul,
3. M. W. Darlington and G. R Smith, Plastics and Rubber:
4. M. Akay and D. Barkley, J. Mat . Sci. 28, 2731 (1991). 5. F. Ramsteiner and R. Theysohn, Composites, 10. 111
( 1979). 6. L. T. Nielsen and R. F. Landel. Mechanical Properties of
Polymers and Composites, 2nd Edition, Marcel Dekker, Inc. (1994).
7. H. C. Y. Cartledge and C. A. Baillie, J. Mat. Sci, 94, 5099 ( 1999).
8. C. Zhang and I. D. Moore, PoZym Eng. Sci., 37, 414 ( 1997).
PoZymer, 41,7165 (2000).
Materials andApplications, 9,97 (1978).
871