Effects of Storm Surges on the Beaufort Sea Coast...
16
VOL. 32, NO. 4 (DEC. 1979), P. 329-344 ARCTIC Effects of Storm Surges on the Beaufort Sea Coast, Northern Alaska ERK REIMNITZ’ and DOUGLAS K. MAURER’ ABSTRACT. In 1970, a major storm surge caused by gale-force westerly winds inundated low-lying tundra plains and deltas as far as 5000 m inland and left a driftwood line as much as 3.4 m above normal sea level along the Beaufort Sea coast of Alaska. The height of the surge followed a predictable pattern and was highest along windward-facing shorelines. Coastal retreat and thermoerosion are greatly accelerated on such west-facing shores with eastward sediment transport opposite to normal littoral drift. Evidence suggests an approximate 100-year recurrence interval for similar surges, with potential for damaging the developing oil fields on the North Slope. ReSUMfi. En 1970, une tempête majeure causée par des forts coups de vent d’ouest, inonda les plaines de toundras situées à basse altitude et les deltas justqu’à 5 kms à l’intérieur des terres et laissa une trainée de bois flottés, à une hauteur aussi élevée que 3, 4m au dessus du niveaunormalde la mer, tout le long de la côte de la mer de Beaufort en Alaska. La hauteur de la houle se conformait aux prévisions et était la plus élevée le long des rivages, face au vent. Le recul de la côte et I’érosion thermique s’accélèraient particulièrement sur de tels rivages, face au vent d’ouest avec transport de sédiments vers l’est, contrairement au courant littoral normal. II parait évident qu’ils s’agit là de vagues “centenaires,” capables d’endommager les champs de pétrole, en voie de developpement du “North Slope.” INTRODUCTION The North Slope of Alaska fringes the Beaufort Sea and consists of a low tundra-covered coastal plain with numerous deltas that allows storm surges to inundate extensive areas. In the fall of 1970, gale-force westerly winds in the Canadian and Alaskan Beaufort Sea resulted in a storm surge as high as 3 m (Department of Public Works, 1971a, Reimnitz et al., 1972; Lewis and Forbes, 1975; Dygas and Burrell, 1976b), an order of magnitude higher than normal flood tide. Recurrence intervals for similar events in Canada range from 25 to 50 years (Department of Public Works, 1971a). While in transit aboard a small vessel from Point Barrow to Prudhoe Bay we observed considerable amounts of driftwood afloat during the storm, much of which was deposited on land to form a rim roughly marking the storm-surge level. This rim can still be seen from low-flying aircraft. During August 1977 we conducted a one-and-a-half-day helicopter reconnaissance survey to study the configuration and elevation of the driftwood line from Cape Halkett to the Canning River (Fig. 1). In this report we discuss our findings, some observations made during the 1970 storm surge along the Alaskan and Canadian Beaufort Sea coasts, the recurrence of similar events, and themarinegeologic consequences of storm surges. We also present a brief storm-surge scenario for the coastal zone of the future, and speculate about winter surges. ‘U.S. Geological Survey, Menlo Park, California
Transcript of Effects of Storm Surges on the Beaufort Sea Coast...

VOL. 32, NO. 4 (DEC. 1979), P. 329-344 ARCTIC
Effects of Storm Surges on the Beaufort Sea Coast, Northern Alaska
ERK REIMNITZ’ and DOUGLAS K. MAURER’
ABSTRACT. In 1970, a major storm surge caused by gale-force westerly winds inundated low-lying tundra plains and deltas as far as 5000 m inland and left a driftwood line as much as 3.4 m above normal sea level along the Beaufort Sea coast of Alaska. The height of the surge followed a predictable pattern and was highest along windward-facing shorelines. Coastal retreat and thermoerosion are greatly accelerated on such west-facing shores with eastward sediment transport opposite to normal littoral drift. Evidence suggests an approximate 100-year recurrence interval for similar surges, with potential for damaging the developing oil fields on the North Slope.
ReSUMfi. En 1970, une tempête majeure causée par des forts coups de vent d’ouest, inonda les plaines de toundras situées à basse altitude et les deltas justqu’à 5 kms à l’intérieur des terres et laissa une trainée de bois flottés, à une hauteur aussi élevée que 3, 4m au dessus du niveau normal de la mer, tout le long de la côte de la mer de Beaufort en Alaska. La hauteur de la houle se conformait aux prévisions et était la plus élevée le long des rivages, face au vent. Le recul de la côte et I’érosion thermique s’accélèraient particulièrement sur de tels rivages, face au vent d’ouest avec transport de sédiments vers l’est, contrairement au courant littoral normal. II parait évident qu’ils s’agit là de vagues “centenaires,” capables d’endommager les champs de pétrole, en voie de developpement du “North Slope.”
INTRODUCTION
The North Slope of Alaska fringes the Beaufort Sea and consists of a low tundra-covered coastal plain with numerous deltas that allows storm surges to inundate extensive areas. In the fall of 1970, gale-force westerly winds in the Canadian and Alaskan Beaufort Sea resulted in a storm surge as high as 3 m (Department of Public Works, 1971a, Reimnitz et al . , 1972; Lewis and Forbes, 1975; Dygas and Burrell, 1976b), an order of magnitude higher than normal flood tide. Recurrence intervals for similar events in Canada range from 25 to 50 years (Department of Public Works, 1971a). While in transit aboard a small vessel from Point Barrow to Prudhoe Bay we observed considerable amounts of driftwood afloat during the storm, much of which was deposited on land to form a rim roughly marking the storm-surge level. This rim can still be seen from low-flying aircraft.
During August 1977 we conducted a one-and-a-half-day helicopter reconnaissance survey to study the configuration and elevation of the driftwood line from Cape Halkett to the Canning River (Fig. 1). In this report we discuss our findings, some observations made during the 1970 storm surge along the Alaskan and Canadian Beaufort Sea coasts, the recurrence of similar events, and the marine geologic consequences of storm surges. We also present a brief storm-surge scenario for the coastal zone of the future, and speculate about winter surges.
‘U.S. Geological Survey, Menlo Park, California

330 ERK REIMNITZ and DOUGLAS K. MAURER
FIELD METHODS
The driftwood line was photographed and sketched from an altitude of 150 m on 1:63.360-scale topographic sheets. These maps, along with the details of field methods and problems encountered at specific sites, were presented by Reimnitz and Maurer (1978). We made frequent stops to inspect material in the driftwood line and to measure driftwood elevation relative to sea level, using the pole-and-horizon method (Emery, 1961). Sea-level fluctuations during the period of fieldwork were eliminated on the basis of tide gauge records from a tidal inlet east of Spy Island, provided by Brian Matthews of the University of Alaska.
Driftwood does not mark the highest water level of a surge but may lie higher or lower than the storm-surge level, as outlined by Reimnitz and Maurer (1978). Along the mainland shores, which are backed by gently sloping surfaces inland (Fig. 2) and have shallow water offshore, almost no wave runup occurs. Therefore, and because of the draft of larger wood, the driftwood line along the mainland shore may generally lie 50-100 m seaward of the limit of inundation. The barrier islands were entirely awash during the storm so that the driftwood came to rest during storm recession and lies below true surge height. For these reasons, our surge height data may be in error in many places. Problem areas and possible errors of 0.5-1.0 m were discussed by Reimnitz and Maurer (1978).
BACKGROUND INFORMATION
The shelf of the Beaufort Sea in the study area (Fig. 1) is shallow, with the 20-m isobath about 30-35 km from the mainland shore, and has gentle relief

STORM SURGES 33 1
(Carsola, 1954; Barnes and Reimnitz, 1974; Reimnitz and Barnes, 1974). The shelf has a nearly complete sea-ice cover for nine months of the year. Astronomical tides have an average range of only 15 cm and on a day-to-day basis are overshadowed by the effects of wind. The dominant easterly wind causes low water levels and offshore movements of ice, whereas the westerly wind causes a rise in water level (Short, 1973) and onshore movement of ice. The most severe storms have westerly winds and generally occur during September or October.
The sea level fluctuates with the tides regardless of the presence of an ice cover. Only within the shallow areas of the bottom-fast ice zone landward of tidal cracks does the sea level remain constant under most conditions (Reimnitz et al., 1978). Meteorologic tides, even surges, can occur in the middle of the winter in the presence of a nearly complete ice cover (Zubov, 1945; Henry, 1975; Brian Matthews, written comm., 1977), but this phenomenon has not been well explained.
The 13 September 1970 storm reached its peak during the afternoon, when northwesterly winds of 80 kmlh were observed at the Oliktok DEW-line site. According to Dygas and Burrell (1976b), the winds were gusting to almost 120 km/h. At Deadhorse, about 10 km inland from Prudhoe Bay, pe'ak wind velocities reached only 46 km/h (National Climatic Center, Asheville, N;C.). This discrepancy could be expected because in the presence of a surface cold front, winds over the water may be two to four times stronger than those reported inland (Burns, 1973). In the area off Cape Halkett, one of LIS (E.R.) estimated westerly winds of 130 kmlh (70 knots) and wave heights of about 3 m. The small size of the waves was due to the presence of scattered ice along
FIG. 2. Aerial view of well-defined driftwood line on tundra surface with imperceptible slope. Distance across photograph is about 1 0 0 m. For location see figure 6.
332 ERK REIMNITZ and DOUGLAS K. MAURER
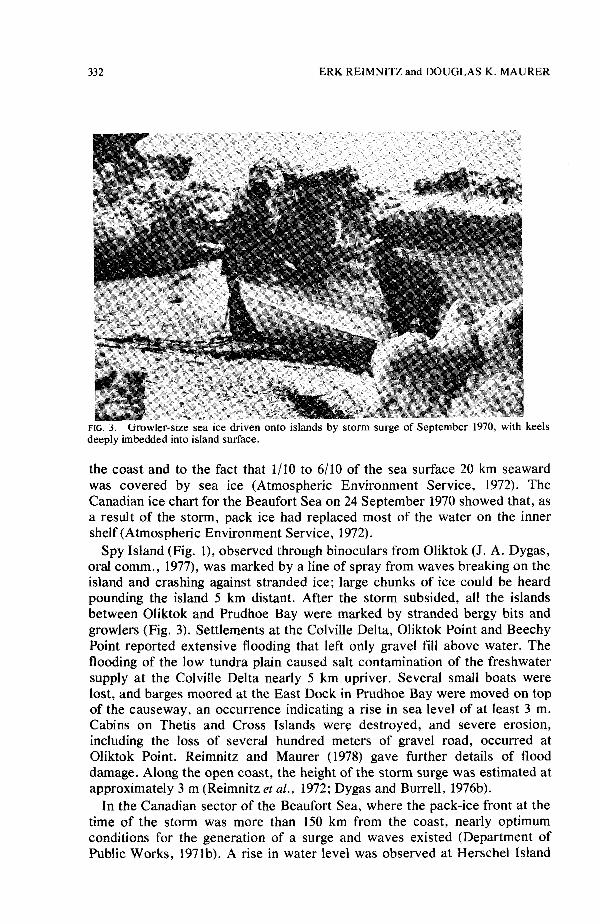
FIG. 3. Cirowler-size sea ice driven onto islands by storm surge of September 1970, with keels deeply imbedded into island surface.
the coast and to the fact that 1/10 to 6/10 of the sea surface 20 km seaward was covered by sea ice (Atmospheric Environment Service, 1972). The Canadian ice chart for the Beaufort Sea on 24 September 1970 showed that, as a result of the storm, pack ice had replaced most of the water on the inner shelf (Atmospheric Environment Service, 1972).
Spy Island (Fig. l), observed through binoculars from Oliktok (J. A. Dygas, oral comm., 1977), was marked by a line of spray from waves breaking on the island and crashing against stranded ice; large chunks of ice could be heard pounding the island 5 km distant. After the storm subsided, all the islands between Oliktok and Prudhoe Bay were marked by stranded bergy bits and growlers (Fig. 3). Settlements at the Colville Delta, Oliktok Point and Beechy Point reported extensive flooding that left only gravel fill above water. The flooding of the low tundra plain caused salt contamination of the freshwater supply at the Colville Delta nearly 5 km upriver. Several small boats were lost, and barges moored at the East Dock in Prudhoe Bay were moved on top of the causeway, an occurrence indicating a rise in sea level of at least 3 m. Cabins on Thetis and Cross Islands were destroyed, and severe erosion, including the loss of several hundred meters of gravel road, occurred at Oliktok Point. Reimnitz and Maurer (1978) gave further details of flood damage. Along the open coast, the height of the storm surge was estimated at approximately 3 m (Reimnitz et al., 1972; Dygas and Burrell, 1976b).
In the Canadian sector of the Beaufort Sea, where the pack-ice front at the time of the storm was more than 150 km from the coast, nearly optimum conditions for the generation of a surge and waves existed (Department of Public Works, 1971b). A rise in water level was observed at Herschel Island

STORM SURGES 333
more than five hours before the storm. At Shingle Point, the winds were only 8-15 km/h (5-10 mph) from the southwest; five minutes later, they were gusting in excess of 130 km/h (70 mph) from the northwest (Department of Public Works, 1971b). The observed surge height was a 2.4 m (Department of Public Works, 1971b) but locally may have been as much as 3 m (Lewis and Forbes, 1975). Deep water waves as large as 9 m were noted. Pack ice, including many remnants of multiyear floes and one ice island, was driven into Babbage Bight. The ice island grounded at 11 m water depth with a '
freeboard of as much as 12 m (Kovacs and Mellor, !1971), suggesting considerable surge height and driving forces. Damage reported from the Canadian coast was considerable including bluff erosion as much as 12 m at Tuktoyaktuk (Department of Public Works, 1971b).
During the storm huge amounts of sediment were apparently put into suspension in the shallow waters. For example, the tugboat Radium Dew, anchored behind Escape Reef near Shingle Point, reported waves breaking over the wheelhouse that coated the tug with mud. Buildings at Tuktoyaktuk 200-300 m from shore were coated in frozen mud (Department of Public Works, 1971b). The entire sandspit at the Nicholson Peninsula DEW-line site was submerged and, after water level fell again, reduced in width by 30 m.
Some information on storm surges is available for the Chukchi Sea, mainly from observations and recordings at Barrow, Alaska (Hume and Schalk, 1967). But the setting at Barrow is very different from that of the Beaufort Sea coast, and surges recorded at Point Barrow do not appear on the records at Oliktok or in Canada (Brian Mathews, oral comm., 1978). Thus the Beaufort Sea surge of 1970 was not an unusual event at Barrow. The Barrow storm surge of October 1963, which flooded much of the Naval Arctic Research Laboratory area (Hume and Schalk, 1967), was only about 0.5 m below the level of the 1970 surge on the Colville Delta (B. Helmericks, oral comm., 1978) and was comparable to normal spring-flood stage of the Colville River. Historical information on past major storm surges in the Beaufort Sea is presented by Reimnitz and Maurer (1978), and has been summarized in Table I .
TABLE 1. Historical observations of major storm surges in the Beaufort Sea (after Reimnitz and Maurer, 1978)
Date Area Comments
1905 Mackenzie Delta
1929 Mackenzie Delta approx. 1928 . Simpson Lagoon (probably same event)
approx. 1940 WesternBeaufort Sea
- -
9-9- 1944 Mackenzie Delta (probably same event)
9-13-1970

334 ERK REIMNITZ and DOUGLAS K. MAURER
RESULTS
Configuration ana! elevation' of the drijhood line Maps showing the driftwood line were presented by Reimnitz and Maurer
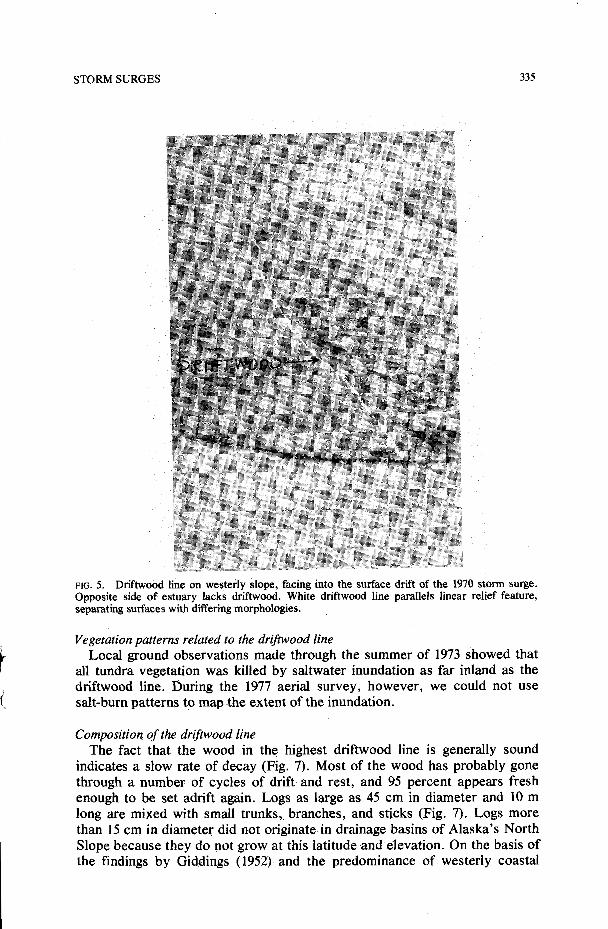
(1978). The distance of this line from shore ranges from 20 to 5000 m along the Kuparuk and Colville Deltas. In many localities two or three distinct driftwood lines are identifiable from the air (Fig. 4); the second-highest line can in some places be related to the westerly storm of August 1975. We made no attempt to map this surge, which was 0.7-1.2 m lower th? the 1970 surge. Materials set adrift during storm surges move eastward along the coast, so that westward-facing sections of coast and land-surface. slopgs, many oriented at right angles to the genqral trend of the coast, intercept more wood than land surfaces sloping northwai-di toward the open sea (Fig. 5) . Coastal depressions opening westward to the sea, such as the creek valley in Figure 4, commonly have well-defined driftwood lines on opposing slopes and generally catch abnormally large amounts of flotsam.
The elevation of the highest driftwood line shows large variations, ranging from about 1.4-3.4 m above sea level. In Figure 6 we plot measured values, corrected for tidal variations, and rounded to the nearest 0.1 m. The figure also shows the height above mean water level by contours. Although our placement of the offshore limit of surge heights greater than 1.5 m is largely arbitrary, storm-surge amplitudes are known to decrease rapidly with distance from the coast (Henry, 1975.)
FIG. 4. Two driftwood lines at different elevations, paralleling a westward-opening drainage. The higher line records the 1970 storm surge, and about 1 m lower is a line dating a 1975 storm. For location see figure 6.
STORM SURGES 335
FIG. 5. Driftwood line on westerly slope, facing into the surface drift of the 1970 storm surge. Opposite side of estuary lacks driftwood. White driftwood line parallels linear relief feature, separating surfaces with differing morphologies.
‘ i
Vegetation patterns related to the driftwood line Local ground observations made through the summer of 1973 showed that
all tundra vegetation was killed by saltwater inundation as far inland as the driftwood line. During the 1977 aerial survey, however, we could not use
i salt-burn patterns to map -the extent of the inundation.
Composition of the drifnyood line The fact that the wood in the highest driftwood line is generally sound
indicates a slow rate of decay (Fig. 7). Most of the wood has probably gone through a number of cycles of drift and rest, and 95 percent appears fresh enough to be set adrift again. Logs as large as 45 cm in diameter and 10 m long are mixed with small trunks, branches, and sticks (Fig. 7). Logs more than 15 cm in diameter did not originate in drainage basins of Alaska’s North Slope because they do not.grow at this latitude and elevation. On the basis of the findings by Giddings (1952) and the predominance of westerly coastal

336 ERK REIMNITZ and DOUGLAS K. MAURER
BEAUFORT SEA ELEVATION OF 1970 STORM-SURGE
SURFACE, IN METERS
HhLKETT
T
FIG. 6. Height of 1970 storm surge above mean sea level, as measured from the elevation of driftwood found on the mainland and islands, and corrected for sea level fluctuations. Note pile-up of water on the east side of shallow embayments and the lagoon near the Canning River. Very old driftwood in southern Harrison Bay discovered by Roger Hartz, U.S. Geol. Surv., in 1978.
currents, we believe that most of this material comes from the drainage basin of the Mackenzie River and not from the Yukon or other rivers draining to the Bering and Chukchi Seas.
Much large lumber on beaches and in the high driftwood line has been notched or chipped with crude tools. From our own contacts with Eskimos, and observations from the last ten years, we believe that most of these marks are more than 30 or 40 years old, dating from the time when Eskimos using such tools inhabited the coast. Along with the natural wood, the high driftwood line also contains varying amounts of milled lumber, pallets, treated pilings, and other debris, including oil drums. Materials in direct contact with the tundra surface are slowly being incorporated into the vegetative mat, and tundra slabs are found locally in the driftwood line.
Older surges and the extreme event Old rotten wood can also be found within the areas flooded in 1970. The
largest logs seem to last the longest, and we commonly found surfaces of old logs barely protruding above the tundra mat, so rotten that they no longer supported our weight. Nowhere did we find such materials at elevations above those of the 1970 surge, but in some places, rotten wood was found coincident with the 1970 driftwood line, always distinct from the driftwood moved by the 1970 storm surge. In areas where much driftwood has collected, very old, extreme events, with all components decomposed, could be expected to show up as linear accumulations of compost, perhaps marked by different vegetation, but we found no such evidence.
In most places studied, the land slopes imperceptibly, so that evidence for an “extreme event” ranging perhaps 1 m higher than the 1970 surge would have to be searched for in a wide zone. Here, evidence for surges higher than that of 1970 was difficult to obtain. Nonetheless, we landed in one location

STORM SURGES 337
where the detection of a very high surge would be facilitated by a smooth, well-drained, relatively steep slope leading to higher ground a short distance from the beach (Fig. 7). This location is at the mouth of the western branch of the Canning River (Fig. 6) where, at 2.7 m elevation, the driftwood line is relatively high and much driftwood accumulates. This east end of the long lagoon system is a natural trap for driftwood, as would also have been true in the past. We found no evidence here, however, for surges higher than the one in 1970.
There is no reliable method of dating the older driftwood lines, and therefore we can only give an estimate that is based on our judgment of the weathering characteristics of wood in the Arctic. We have observed a number of abandoned habitations whose ages we know, wooden markers, boats, and frames, over a period of ten years. From this experience we estimate that the 1970 surge has not been exceeded for from 50 to possibly 100 years.
Carvings on the wooden marker on Cross Island include the year 1889, when it was apparently erected by Stockton’s party (Stockton, 1890). According to Jim B . Helmericks (personal comm., 1978), who had spent some time living on the island, wood chips from the construction of the cross were lying on the ground around the base before the surge. These chips are no longer there. From this evidence, and evidence related to a small hut on the island (Reimnitz and Maurer, 1978), we conclude that the surge of 1970 may not have been matched since 1889.
FIG. 7. Close-up view of driftwood deposited by the 1970 storm surge. Note barrel for scale. Smooth, well-drained slope leading to higher ground on right lacks evidence of higher surges, and should preserve such records for at least 1 0 0 years, but probably 200 to 300 years. For location see figure 6.

338 ERK REIMNITZ and DOUGLAS K. MAURER
In 1978, Roger W. Hart of the U.S. Geological Survey noted a very old driftwood line at 3.5-4.5 elevation 1-2 m above the 1970 driftwood line, along the south shores ofiHarrison Bay (Fig. 6). The wood crumbles when 6 touched, has been in the tundra sod, and was estimated by Hartz to be 70-200 a bluff retreat rate of 2 /yr for this area (Hopkins and line, now 5-10 m from the tundra edge, would
DISCUSSION
Variation in surge height The variations in the height of the surge surface are considerable but follow
a predictable pattern on the basis of model studies (Henry and Heaps, 1976). Shallow embayments that are open in the direction of the wind and face the surge show maximum runup; on the other hand, major promontories provide shelter and therefore sho' little surge runup on their lee sides. In the study area (Fig. 6), major pile ps of water occurred in the southeast sector of Harrison Bay, in the sout F east sector of Prudhoe Bay, and at the east end of the long lagoon ending a t the Canning River (Leffingwell Lagoon). The positive bulge off the eastpn Sagavanirktok Delta may be explained by water piling up against Point Btower, a high promontory east of the delta. In the southwest sectors of H h s o n , Prudhoe, and Foggy Bays (east of the Sagavanirktok River), the water level remained relatively low. We expected to find evidence for a pileup of water in the east end of Simpson Lagoon, but such a pileup apparently did not occur.
Geotogic effects of storm Shoreline erosion a major contribution to the sediment budget of
Arctic shelves, a that may be larger than that of the rivers. Dygas and Burrell along Simpson Lagoon, the average yearly
high as 40 m/yr have been documented in a averages'generally are the result of
1976a), when the equivalence of can be moved (Hume and
of the thermal erosion an overtopping of with the bluffs, a
8), extending as and solifluction. lowered, so that
1977). At

STORM SURGES 339
FIG. 8. Thermo-erosional niche on Eskimo Island, resulting from minor surge in 1972. The sea overtopped the beach, and undermined the coastal plain up to 5 m.
find that bluff erosion along Simpson Lagoon, where many data points are available (Dygas and Burrell, 1976a), is higher on the west side of promontories than on their east side. Ample evidence exists for westward net longshore transport and for westward barrier-island migration (Short, 1973; Dygas and Burrell, 1976a). During extreme events, however, when tremendous amounts of sediment are introduced into the sea and concentrations of suspended matter are extremely high near shore, transport is in the opposite direction - to the east.
Ice gouging is highly effective during westerly storms, which bring pack ice against the coast where the ice runs aground 'and causes bulldozing of sediments toward the east, opposite to the general direction of ice drift (Reimnitz and Barnes, 1973). The 1970 storm, which brought growlers and bergy bits up to the highest parts of the barrier islands (Fig. 3), formed gouges leading up to areas normally exposed above sea level (Reimnitz et al., 1972). Because of strong currents during these times, the gouges are filled at the same rate at which they are formed (Reimnitz et al., 1972). Depressions as deep as 1.5 m, formed from the melting of ice above sea level, were found on the islands in the following years (Short, 1973; and our own observations). Such depressions on Spy Island, which lost the upper 50 cm by erosion during the storm (see below), attest to the depth of gouges made in shallow areas of the shelf. If the fetch and the resulting waves are large, as they were in Canada during the storm, long, continuous gouges probably would not form

340 ERK REIMNITZ and DOUGLAS K . MAURER
because the ice rises and falls with the waves and impacts the bottom at regular intervals. As the fetch decreases with the advancing pack-ice front, the resulting gouges become increasingly linear and regular. The process of ice gouging in a strong current causes winnowing and resuspension of shelf sediment, as discussed by Reimnitz and Barnes (1974). Vibracores show that periods of slow deposition of mud are interrupted by severe events of current winnowing, when clean ripple-bedded sand units 10 cm or more thick formed 20 km or more from shore,. These sand units may represent storm surges of the 1970 magnitude.
Major changes in the size and configuration of barrier islands and bars seem to occur during major storm surges. The Argo and Reindeer Islands, charted in 1950 as single islands, are now double, probably breached during the storm. Gravel-filled drums, which serve as foundations for a day beacon on Spy Island, seem to have originally been flush with the top of the island but are now exposed as much as 50 cm. This exposure, together with extensive overwash deposits along the south side of the island, suggests that island migration occurs in steps related to major storms. Barnes et al. (1977) detected an anomalous seaward migration of the east end of Stump Island over a 20-year period and related this to widening of the narrow, funnellike end of Simpson Lagoon during a westerly storm. The highest surfaces of all barrier islands in the area show the effects of current shaping.
A cold weather storm surge with open water may have very different effects on a coastline than a warm surge (A. Sallenger, pers. comm., 1977). Such a surge in the Bering Sea was accompanied by beach accretion, possibly owing to the formation of an icefoot and/or anchor ice in the surf zone during that time. Storm-surge scenario
On the basis of an analysis of the 1970 storm and other experiences on the North Slope, we may outline a scenario for the events during a future major storm. This scenario may be of use to planners and developers of the offshore and shoreline facilities for petroleum exploration and production.
Open-water conditions are a first requisite for the generation of a major surge because the transmission of wind stress to the water is inhibited by the presence of shorefast ice. ‘A severe westerly storm in the Beaufort Sea is a second requisite. The Combination of these two factors restricts the time frame to the months of September and October, when the pack-ice edge may be somewhere on the midshelf. There may be little or no warning of a storm, and wind velocity may increase from light to gale force within just minutes. However, a rise in water level that may start before the local wind regime changes can be taken as a warning. Maximum wave size is reached within a few hours of the onset of a westerly storm because the fetch is later restricted by the encroachment of pack-ice onto the inner shelf area. Swift easterly current of 2-3 knots can be anticipated in the shallow areas of the shelf. Most positively buoyant items below the surge level will be picked up by the seas and moved east and onshore at a rapid rate; these items include boats, barges, fuel containers, lumber, and buildings, as well as driftwood. The greatest

STORM SURGES 341
danger to artificial structures probably lies in the encroachment of pack ice; solid fields of pack-ice exert tremendous pressures, but even individual growlers, rolling and pounding with the waves, act as huge battering rams exerting thousands of tons of force on any fixed structures. Such rams can cut into the bottom to greater depths than the depths of incision of long, continuous ice gouges. This potential poses a severe hazard to buried pipelines. The additional hazard of sharply intensified water flow and currents exists on the shelf, scouring adjacent to the large grounded bergy bits and floebergs that serve as flow obstacles.
Major surges inundate rather extensive coastal areas. Because roads leading to causeways, as well as the causeways themselves, may be flooded, land-based relief-and-rescue operations using available vessels such as small tugs will be difficult. Vessels navigating in coastal waters generally rely on radar for positioning; a flooded coastline will be hard to recognize, however, so that navigation during the time of a surge will also be difficult. Causeways at right angles to the force of storms, such as the present West Dock, will probably be either breached or destroyed, much like the road at Oliktok Point. The gravel fill of the West Dock may move eastward and plug the 1-m deep entrance channel to Prudhoe Bay and thus create additional problems for launching rescue operations from land. Before breaching, causeways, like the promontories, would create a pileup of water and therefore cause abnormal inundation of the adjacent land. In addition, tugboats and other vessels already winterized on causeways would be set adrift.
Natural hazards are one of the main causes of oil spills, and the likelihood of a spill is greatest during a storm surge; the oil could cover the tundra and low deltas as far as 5 km inland. In any case, the intrusion of saltwater would make the lakes within those areas useless to man. As much as five years of normal flushing would be required to restore these critical reservoirs to normal freshness.
Winter storm surge Major surges usually occur during open-water conditions where 2 to 3/10
ice cover may be considered open water (Henry and Heaps, 1976). But winter surges, which occur during times of complete ice cover, have also been reported. Zubov (1945, p. 253) described an unusual rise in water level to 1.25 m above normal at Cape Cheliuskin during late January. He also described a “roller” 1-2 m high (p. 254) that moved into a bay in January and broke up the 1-m thick ice cover, which was complete. Furthermore, he reported that “wind-driven fluctuations of sea level on the Severnaya Dvina did not Cease through the winter, while the entire sea was solidly covered with ice” (p. 335).
Winter surges have not always shown a correlation with storms. Henry (1975) recorded two surges about 1 m high in the Canadian sector of the Beaufort Sea during the winter of 1973-74, one surge in November and the other in January; only the November surge was associated with local strong westerly winds (Henry and Heaps, 1976). These winter surges were recorded
342 ERK REIMNITZ and DOUGLAS K. MAURER
on three tide gauges, two onshore and one offshore. The observation that offshore levels seem to be comparable to onshore levels under the fast ice cover (Henry and Heaps, 1976) is of significance because it suggests driving mechanisms other than wind for some reported winter surges.
A tide gauge operated at Oliktok during the winter of 1973 recorded three surges during January and February with heights of 94, 140 and 69 cm, respectively (Brian Mathews, written comm., 1977). Such variations in hydrostatic head imply buildup of under-ice pressure in shallow ice-restricted embayments. In lagoon and bay entrances where an ice canopy restricts cross sections, high flow velocities are anticipated during winter surges. Reimnitz and Maurer (1978) attempted to calculate flow velocities for the entrance channel to Prudhoe Bay during a winter surge. Depending on the assumptions made, the velocities range from 1 to 4 mls (2-8 knots), enough to cause bottom scour. No actual data exist for such phenomena, and knowledge of how a solid ice canopy reacts during a surge is critical for determining channel flow velocities. Reports from early explorers (Parry, 1826; Leffingwell, 1910 field notes in U.S.G.S. files) indicate that the reaction could be explosive. Numerous attempts of our own to learn more about this problem using current- and tide-recording packages in shallow waters and tidal inlets below the fast ice have only result in extensive damage to the equipment or its total loss.
SUMMARY
The line of driftwood deposited by the 1970 storm surge on the Beaufort Sea coast ranges in height from about 1.5-3.4 m above mean sea level, and its distance from the normal strand ranges from 20 to 5000 m on low delta plains. The driftwood line today does not coincide with a vegetation boundary resulting from saltwater intrusion. Variations in the height of the storm surge follow a predicted pattern, with the greatest water pileup at the end of shallow embayments that open in the direction of westerly winds. Although historical information suggests that storms of magnitude similar to that in 1970 occur at about 25-year intervals, our findings indicate that the 1970 surge height was not equaled during the previous 90-100 years and may not have been exceeded in several hundred years.
Large amounts of sediment are supplied to the shelf during surges from thermoerosion of the coastal plain. Over long periods, westward-facing bluffs of promontories show higher erosion rates than eastward-facing bluffs, a feature reflecting the importance of the short-term effects of rare westerly storms compared to the long-term effects of dominating easterly winds and waves. Major modification of the barrier islands also occurs during the surges; all barrier islands were submerged and under the influence of breakers and currents, and, during later stages, the islands were also affected by gouging and pounding by 'large ice blocks. The pack ice brought in against the coast during a surge causes intensive ice gouging. If a major surge were to occur during a period of offshore petroleum exploration or production, environmental damage could be extensive.
STORM SURGES 343
ACKNOWLEDGEMENTS
Our study was supported by the U.S. Bureau of Land Mangement through interagency agreement with the National Oceanic and Atmospheric Administration (NOAA), under which a multiyear program responding to the needs of petroleum development of the Alaskan continental shelf is managed by the Office of the Outer Continental Shelf Environmental Assessment Program (OCSEAP).
We are grateful to Brian Matthews for providing tidal data to correct our storm-surge height measurements and data on winter surges.
REFERENCES
ATMOSPHERIC ENVIRONMENT SERVICE 192 . Ice summary and analysis, 1970. Canadian Arctic Annual publication. Toronto. pp. 60-63.
changes, northwestern Prudhoe Bay, Alaska. U.S. Geological Survey, Open -File Report
BARNES, P. W. and REIMNITZ, ERK. 1974. Sedimentary processes on arctic shelves off northern Alaska. In: Proceedings of the Arctic Institute of North America Symposium on Beaufort Sea Coast and Shelf Research. Arlington: Arctic Institute of North America. pp. 439-476.
BURNS, B. M. 1973. The climate of the Mackenzie Valley-Beaufort Sea. Toronto: Atmospheric Environment Service. Climatological Studies No. 24,
CARSOLA, A. J. 1954. Microrelief on the arctic sea floor. Bulletin of the American Association of Petroleum Geologists, 38: 1587-1601.
DEPARTMENT OF PUBLIC WORKS 1971a. Herschel Island: Feasibility of marine terminal. Ottawa: Engineering Programs Branch. 141 pp.
-. 1971b. Beaufort Sea storm, September 13-16, 1970, Investigation of effects in the Mackenzie Delta region. Ottawa: Engineering Programs Branch. 22 pp.
DYGAS, J . A. and BURRELL, D. C. 1976a. Dynamic sedimentological processes dong the Beaufort Sea coast of Alaska, assessment of the Arctic marine environment. Selected Topics. Institute of Marine Science University of Alaska. pp. 189-203.
-, and BURRELL, D. c. 1976b. Response of waves and currents to wind patterns in an Alaskan Lagoon, assessment of the Arctic marine environment. Selected Topics. Institute of Marine Science University of Alaska. pp. 263-285.
EMERY, K. 0. 1961. A simple method of measuring beach profiles. Limnology and Oceanography, 6: 90-93.
GIDDINGS, J. L. , Jr. 1952. Driftwood and problems of arctic sea currents. American Philosophical Society Proceedings. Philadelphia. 96: 129-142.
HENRY, R. F. 1975. Storm surges: Beaufort Sea Project. Victoria; Department of the Environment. Technical Report 19.
-, and HEAPS, N. s. 1976. Storm surges in the southern Beaufort Sea. Journal of the Fish Resource Board of Canada, 33 (10): 2362-2376.
HOPKINS, D. M. and HARTZ, R. w. 1978. Coastal morphology, coastal erosion, and barrier islands Of the Beaufort Sea, Alaska. U.S. Geological Survey Open-File Report 78-1063. 54 pp.
HUME, J . E. and SCHALK, MARSHALL. 1%7, Shoreline processes near Barrow, Alaska: a Comparison of the normal and the catastrophic. Arctic, 20 (2): 86-103.
KOVACS, AUSTIN and MELLOR, MALCOLM. 1971. Investigation of ice islands in Babbage Bight. Science and Technology. Hanover, N.H.: Creare Inc. Technical note N-118. 22 pp.
LLEWELLYN, ROBERT. 1977. A study of Beaufort Sea coastal erosion, northern Alaska, environmental assessment of the Alaskan continental shelf. U.S. National Oceanic and Atmospheric Administration Annual Report for year ending March, 1977, 15: 491-527.
LEWIS, C. P. and FORBES, D. L. 1975. Coastal sedimentary processes and sediments, southern Beaufort Sea. Department of the Environment Beaufort Sea Project Technical Report 24. 68 P.
PARRY. SIR WILLIAM EDWARD. 1826. Journal of a third voyage for the discovery of a northwest passage. Philadelphia: H. C. Carey and I. Lea.
REIMNITZ. ERK and MAURER, D. K. 1978. Storm surges in the Alaskan Beaufort Sea. U.S. Geological Survey Open-File Report 78-593. 26 pp.
zonation, Beaufort Sea, Alaska. Marine Geology, 28: 179-210.
BARNES, P. W. and REIMNITZ, ERK.. SMITH, G . , and MELCHIOR, 1. 1977. Bathymetric and shoreline
77-161. 10 pp.
-, TOIMIL. L. J., and BARNES, P. w. 1978. Arctic continental shelf morphology related to sea ice
344 ERK REIMNITZ and DOUGLAS K. MAURER
-, BARNES, P. W . . FORGATSCH. T. C. and RODEICK. C. A. 1972. Influence Of grounding ice On the Arctic shelf of Alaska. Marine Geology, 13: 323-334. -. and BARNES, P. w. 1974. Sea ice as a geologic agent on the Beaufort Sea shelf of Alaska. In: Reed, J. C. and Sater, J. E. (eds.) The Coast and Shelf of the Beaufort Sea. Arlington: Arctic Institute of North America. pp. 301-353.
SHORT, A. D. 1973. Beach dynamics and nearshore morphology of the Alaskan Arctic coast. Unpublished Ph.D. thesis, Louisiana State University, Baton Rouge. 139 pp.
STOCKTON, c. H. 1890. The arctic cruise of the U.S.S. THETIS in the summer and autumn of 1889. The National Geographic Magazine, 2 (3): 174-198.
ZUBOV, N . N . 1945. Arctic Sea Ice, translated by the Naval Oceanographic Office and the American Meteorological Society under contract to Air Force Cambridge Research Center. San Diego: U.S. Naval Electronics Laboratory. 491 pp.