Effects of participation in a simulation game on marketing...
30
1 Effects of participation in a simulation game on marketing students’ numeracy and financial skills Abstract The need to endow marketing graduates with skills relevant to employability grows ever more important. Marketing math and elementary financial understanding are essential employability skills, particularly given the contemporary emphasis on marketing metrics, but the evidence is that marketing graduates are often relatively weak in such skills. This paper suggests that one educational strategy to improve numeracy and financial skills may be through the use of a marketing simulation game. Through the simulation game, students are exposed to marketing calculations and financial data in an engaging context which simulates the real world. It is hypothesized that marketing students’ numeracy and financial skills, and their self-efficacy with respect to marketing calculations, will improve following participation in a simulation game where numerical and financial analysis are necessary activities. Using a quasi-experimental research design, it is found that there are substantial and significant improvements in numerical and financial performance after participating in a simulation game, but that there is no improvement (and possibly a small decline) in self-efficacy related to these tasks. Marketing educators are advised that a marketing simulation game is a viable option to consider when seeking to improve students’ numeracy and financial skills.
Transcript of Effects of participation in a simulation game on marketing...
1
Effects of participation in a simulation game on marketing students’ numeracy and financial skills
Abstract
The need to endow marketing graduates with skills relevant to employability grows ever more
important. Marketing math and elementary financial understanding are essential employability skills,
particularly given the contemporary emphasis on marketing metrics, but the evidence is that
marketing graduates are often relatively weak in such skills. This paper suggests that one educational
strategy to improve numeracy and financial skills may be through the use of a marketing simulation
game. Through the simulation game, students are exposed to marketing calculations and financial
data in an engaging context which simulates the real world. It is hypothesized that marketing
students’ numeracy and financial skills, and their self-efficacy with respect to marketing calculations,
will improve following participation in a simulation game where numerical and financial analysis are
necessary activities. Using a quasi-experimental research design, it is found that there are substantial
and significant improvements in numerical and financial performance after participating in a
simulation game, but that there is no improvement (and possibly a small decline) in self-efficacy
related to these tasks. Marketing educators are advised that a marketing simulation game is a viable
option to consider when seeking to improve students’ numeracy and financial skills.

2
Effects of participation in a simulation game on marketing students’ numeracy and financial skills
Introduction
There is considerable evidence that, in order to enhance their employability, marketing graduates
need to be capable of handling numerical and financial concepts (Walker et al., 2009; Wellman,
2010). This is particularly important because marketers are increasingly being asked to demonstrate
the return on marketing investments, and to do this they must have a facility with marketing
metrics—something that involves both numerical and financial concepts (Saber & Foster, 2011).
However, there is also evidence that many marketing students fail to acquire these essential skills
during their undergraduate studies. For example, Ganesh, Quinn and Barat (2010: 48) say, “At a
major public university in the southwest United States, marketing faculty experienced the same
frustrations as their colleagues elsewhere—that is, undergraduate students’ inability to handle even
basic marketing math.” A number of researchers have suggested learning approaches designed to
bridge this gap (Pilling, Rigdon, & Brightman, 2012; Pirog III, 2010; Saber & Foster, 2011; Schlee
& Harich, 2010). However, there is no suggestion yet that the solution has been found. Indeed, it is
likely that multiple strategies will be required to enhance marketing students’ quantitative and
financial skills. Saber and Foster (2011) suggest the use of marketing accounting spreadsheet
exercises, Ganesh et al (2010) describe the use of one-page mini-cases designed around characteristic
marketing calculations, and Pilling, Rigdon and Brightman (2012) describe in detail the development
and implementation of a comprehensive marketing metrics course. The suggestion of this paper is
that one additional fruitful strategy for enhancing analytical skills is to use a strategic marketing
simulation game as a medium through which financial and numerical learning is achieved.
In an increasingly competitive global market-place for higher education, universities everywhere are
coming under increasing pressure to prepare their students for employment. Not to put too fine a
3
point on it, employers are unimpressed by business school graduates who cannot do basic business
calculations or do not understand elementary financial concepts such as gross and net profit margin.
If this was not reason enough for marketing educators to want to endow their students with numerical
and financial skills, there is also the professional pride in producing graduates who can correctly
apply numerical and financial analytical skills to marketing problems. Simply, this is something that
marketing educators know that their students should be able to do and, as Ganesh and colleagues
(2010) observe, it is a matter of real frustration if they cannot.
The underlying rationale for the proposition that a marketing simulation game is a good medium for
learning about quantitative and financial concepts is based on the arguments, firstly, that a simulation
game is an engaging learning experience within which students become absorbed, and, secondly, that
business and marketing students will find it easier to acquire numerical and financial concepts when
these are contextualized in a simulated real-world experience. The next section expands on this
rationale and provides support from the literature on marketing and business education.
Subsequently, the proposition is converted into testable hypotheses, and a research study employing
a quasi-experimental design conducted at a university business school in London is described.
Following the presentation of the results from this study, the paper concludes by summarizing the
implications for marketing educators, and mentioning a number of interesting areas for further
research.
Employability, skills & simulation games
There is a clear consensus among marketing educators that they should strive to provide students
with an educational experience that prepares them for successful careers (Ardley & Taylor, 2010;
Walker et al., 2009; Wellman, 2010). Their education cannot simply involve the acquisition of a
4
body of knowledge; it must also make them more employable by endowing them with work-relevant
skills and competences (Gibson-Sweet, Brennan, Foy, Lynch, & Rudolph, 2010; Pefanis Schlee &
Harich, 2010). In particular, marketing graduates need adequate numeracy and financial skills
because marketers are increasingly called upon to be accountable for their decisions (Ganesh et al.,
2010; Saber & Foster, 2011). The premise of this study is that marketing simulation games provide
an excellent opportunity to improve these skills; consequently, we hypothesize that simulation games
are a good medium through which to deliver numerical and financial skills on a marketing degree
program.
Numeracy skills are among the most important skills needed by graduates. Studies have confirmed
the common-sense belief that having better numeracy skills is associated with better employment
prospects (Bynner & Parsons, 1997). For example, Parsons and Bynner (2005: 35) found that
modern jobs to which young people are attracted “place a high premium on skills to which basic
numeracy is central”. Many entry-level marketing positions would fall into this category. While there
are many definitions of numeracy, perhaps the definition provided by Lockett (1974) is still the most
useful: that a numerate employee is one who can make logical deductions, do basic arithmetic, and
work with the relevant mathematical symbols, terms and formula used in the profession. These may
appear to be quite basic skills and yet many studies have demonstrated that students in higher
education today not only exhibit a weakness in basic arithmetic, but show a general fear of numbers
and anything related to them (Zanakis & Valenzi, 1997; Zeidner, 1992). This does not bode well for
their ability to succeed in marketing tasks involving setting budgets, interpreting numerical
information on the business environment, competitors or customers, or undertaking even basic
statistical analysis.
5
Previous research has demonstrated the ability of simulation games to engage students in the learning
process while also developing a range of key skills and attitudes (Bobot, 2010; Vos & Brennan,
2010). This study makes use of a marketing simulation game currently used in a final year
undergraduate marketing strategy module to determine the degree to which participation in such a
game improves marketing students’ skills in numerical and financial analysis, as well as their
perceived self-efficacy in those skills. Pollack and Lilly (2008) have previously found an association
between self-efficacy and the enjoyment that marketing students derive from learning activities, and
between self-efficacy and the degree of practical application in the learning activity. They note that
“the more students perceive the assignment as relevant to businesses, the higher their self-efficacy as
a result of participating in or working on the assignments” (Pollack & Lilly, 2008:65). Bandura
(1977:195) defined self-efficacy as “a self-evaluation of one’s ability to successfully execute a
course of action necessary to reach desired outcomes” and found that students with higher self-
efficacy tend to have more motivation and greater persistence to master academic challenges.
In addition self-efficacy itself may be a valuable aspect of a student’s employability: Pollack and
Lilly (2008) suggest that a student with higher self-efficacy may be more employable than a similar
student with equal, or even slightly superior, objective skill levels. Consequently, self-efficacy is
included in this study, to explore whether participating in the engaging and practical learning
environment provided by a strategic marketing simulation game enhances student self-efficacy in
quantitative and financial skills.
Prior research into the educational value of simulation games suggests that they are good for
developing key skills and giving participants a “valid representation of real world issues facing
managers” (Wolfe & Roberts, 1993: 22) including enhanced skills in strategy formulation, analysis
of multiple variables, integration of a range of marketing concepts and tools, manipulating financial
6
concepts, problem-solving, communication and team-work (Faria, 2001, 2006; Gopinath & Sawyer,
1999; Jennings, 2002; Keys & Wolfe, 1990; Zantow, Knowlton, & Sharp, 2005). Many studies have
demonstrated high correlations between statements such as the game “improved analytical skills”,
“improved problem solving”, “helped learn concepts”, and “taught fundamentals”.
A number of studies have reported on classroom initiatives to try to improve marketing students’
quantitative skills (Ganesh et al., 2010; Pirog III, 2010; Saber & Foster, 2011). One of the key
findings that emerges from these studies is that greater success can be achieved if the quantitative
analysis is placed in an engaging and relevant context; that is to say, where marketing students do not
consider themselves to be in “math class”, but perceive themselves to be learning about the practice
of marketing (Pollack & Lilly, 2008). Teaching quantitative skills in the abstract is less effective than
teaching quantitative skills in the natural context of business decision-making. Marketing simulation
games provide a naturalistic setting within which to address the kind of quantitative task that is
commonly expected of marketing executives, such as understanding gross profit margin,
contribution, and relative market share. Little is known about the ability of simulation games to
improve specific and relevant numeracy and financial skills of marketing students, and this project
seeks to fill this gap. Consequently, the principal goals were to determine the degree to which
participation in a marketing simulation game improves marketing students’ objective skills in
numerical and financial analysis, and how participation affected students’ subjective perceptions of
their numerical and financial skills. The following hypotheses were tested in this study:
Hypothesis 1: Marketing students’ scores in a standard test of numeracy skills will rise following
their participation in a simulation game that requires them to engage in numerical analysis.
7
Hypothesis 2: Marketing students’ scores in a standard test of financial skills will rise following their
participation in a simulation game that requires them to engage in financial analysis.
Hypothesis 3: Marketing students’ self-efficacy in handling numerical and financial issues will
improve following their participation in a simulation game that requires them to engage in numerical
and financial analysis.
In addition, the research design provided the opportunity to explore whether differences existed
between categories of respondents in terms of their response to the simulation game. The
demographic data collected on each respondent was gender, age, ethnic origin (self-described, using
the classifications from the UK Census), and qualification route into university (UK academic
qualifications [A-levels], UK vocational qualification, high school qualification from an overseas
school, access course and other).
Methodology
Sample
The project was a single-institution exploratory study. The university where the study was conducted
is a large, public university in London drawing many of its undergraduate students from the local
population, which is socially and ethnically diverse; like most metropolitan universities in the UK
this university also attracts a substantial number of overseas students. The study participants were
students on a final year course in strategic marketing.
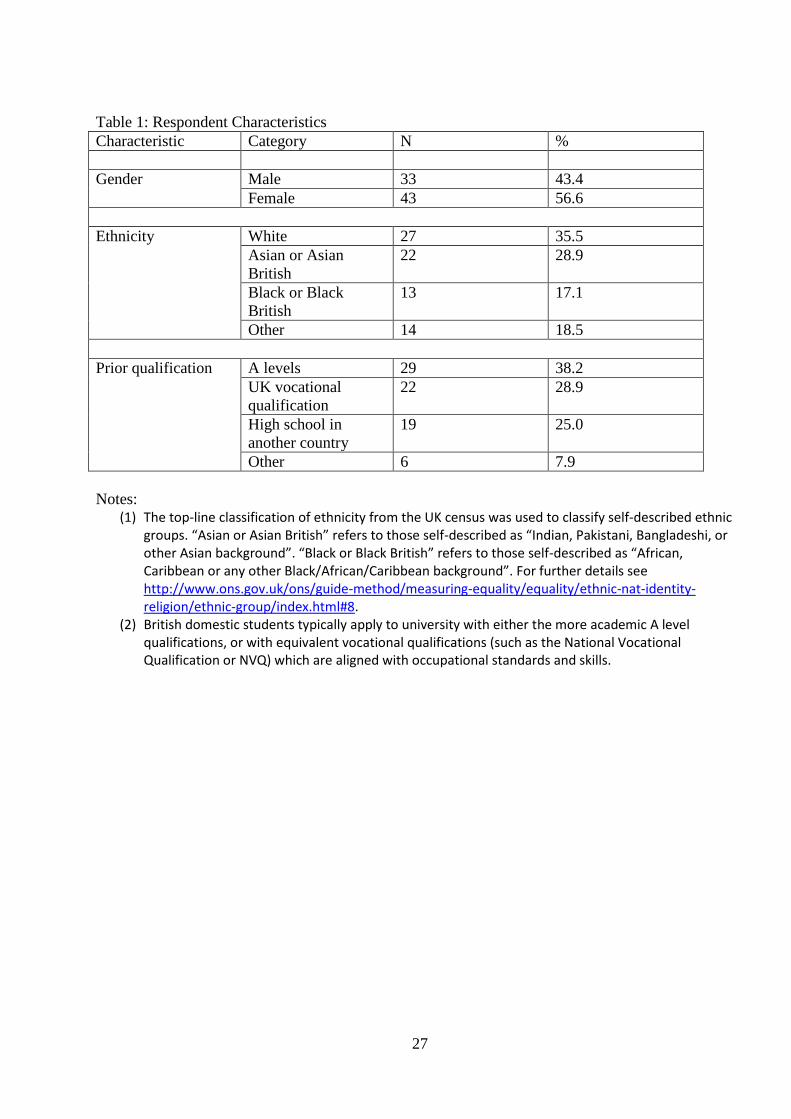
(Insert Table 1 about here)

8
The profile of respondents shown in Table 1 is representative of a ‘modern university’ in London or
most other British metropolitan areas (a ‘modern university’ is one that has been awarded university
status since 1992). Such universities have an ethnically diverse student body and attract many
students with vocational qualifications as well as those with the more traditional, academic A-level
school leaving qualification.
Table 1 shows that there were 127 respondents before game participation and 88 respondents after
game participation; of these, it was possible to identify 76 paired questionnaires, where the same
respondent had completed both the before and the after questionnaire. In Table 1, and in the later
sections where the results are discussed, it is only the results from the 76 respondents for whom a
direct paired comparison is possible that is discussed. The decline in respondents between the first
and second test administrations merits some comment. Students did not receive credit for
participation, but were informed that participation in the study would be of direct benefit in preparing
for their final assessment (see further discussion below under “procedures”). The timing of the
second test administration was towards the end of the semester, since the simulation game was
played throughout a semester. The end of a semester is a busy time for students who are typically
preparing final reports and revising for examinations, and it is likely that this accounts for the lower
participation at the second administration. Demographically, those who participated in both test
administrations did not differ substantially from those who participated in only one; for students who
participated in both the mean age was 21.7 and the gender ratio was 43.4% male to 56.6% female,
while for those who participated only in one the mean age was 22.1 and the gender ratio was 42.0%
male to 58.0% female.
9
Research Instrument
The research design aimed to capture both objective and subjective data about the changes in
students’ numeracy and financial skills arising from participating in a marketing simulation game for
three months. By objective data is meant the results of a test of analytical skills focusing on
numerical and financial concepts, while by subjective data is meant the beliefs and perceptions of
students concerning their self-efficacy in tackling numerical and financial problems.
Self-efficacy in numerical and financial tasks had to be captured by the research instrument. It has
been emphasized in prior research that the measurement of self-efficacy must be domain specific
(Bandura, 1977, 1997; Pajares, 1996), consequently the decision was made not to use general
questions that have been previously developed to measure mathematics self-efficacy, but to develop
an original scale for this study. Questions previously used to measure general mathematics self-
efficacy concentrate on aspects of pure mathematics (Betz & Hackett, 1983), while the questions
developed for this study concentrated on specific quantitative and financial applications in
marketing.
The questionnaire comprised four sub-sections. The first asked for basic demographic data: gender,
age, ethnicity and prior educational qualifications. The second sub-section focused on student self-
efficacy perceptions regarding quantitative and financial analysis for marketing decision-making.
Respondents were asked to examine a one-page sales report drawn from a case study in a strategic
marketing textbook. Five calculations or tasks were described for this sales report, representing
quantitative thinking activities that would commonly be associated with marketing analysis (for
example, to calculate the sales generated for every £1 of advertising spent). The respondents were
asked to indicate the level of confidence they felt that they would be able to undertake these tasks
10
correctly. An eight-point confidence scale, drawn from Pajares & Graham (1999), was used anchored
by “Not confident at all” (1) and “Completely confident” (8). The five questions and eight-point
scale gave a self-efficacy score of between 5 and 40 for each respondent.
The third sub-section of the questionnaire comprised 10 quantitative test questions, each with a
unique correct answer. Respondents had to answer these questions without the use of a calculator.
These questions required mental arithmetic. The questions were calibrated to be at the level expected
of a typical English school leaver; specifically, the easier questions were designed to match the
foundation and higher-tier levels of the English General Certificate of Secondary Education in
mathematics (non-calculator paper), while harder questions slightly exceeded this level. The fourth
sub-section of the questionnaire comprised five questions concerning concepts in financial
accounting, based on a simple profit and loss statement drawn from an introductory marketing
textbook. Following the administration of the questionnaire, the researchers coded the quantitative
and financial questions manually and gave each respondent a score between 0 and 15. The
questionnaire is included as an appendix.
Procedure
The overall research design can be described as a pre- and post-test single-group quasi-experiment
(Bryman, 2004; Robson, 1993). The research instrument was administered at the start of the game,
and then again, three months later, at the end of the game. The game (SimBrand, for details see
www.cesim.com) is a widely used strategic marketing simulation. In terms of the decision-making
process, the data provided to students and the analysis required of students SimBrand do not differ
markedly from other marketing simulation games such as The Marketing Game! (Mason &
Perreault, 2001), MarkStrat and Markops (see www.stratxsimulations.com). However, the authors
had selected SimBrand for this final year (senior level) strategic marketing module on the basis that
11
the industry context (the mobile phone industry) is engaging for students, the academic level is
appropriate, and the user interface is attractive and modern (much use is made of graphics and charts
that simulate perceptual mapping and portfolio analysis). All of these games involve the analysis of
marketing and financial data in a simulated competitive market environment in order to make
decisions about such marketing variables as target market selection, product design features,
advertising spend, media mix, distribution channels and pricing.
The fundamental reason for using a simulation game is to enable students to design and implement
strategic marketing plans and see the results of their decisions. The game was incorporated into the
final year marketing strategy module; this module primarily covers the conventional strategic market
planning curriculum of the marketing audit, competitive analysis, objective setting, designing and
selecting optimal marketing strategies, implementation and control. Marketing data analysis and
financial analysis are not a component of the curriculum for this module, since these subjects are
covered earlier in the marketing program. Through the use of the simulation game, it is intended that
students will learn to appreciate the link between marketing data analysis, financial analysis and
strategic marketing. In order to succeed in the simulation game, the students have to correctly
undertake such analytical tasks as sales forecasting and analysis of market share, and such financial
tasks as calculation of relative product profitability and return on investment in customer service.
Students made weekly decisions as part of the normal teaching and learning process (each set of
decisions is one year in the simulated environment). Weekly one-hour seminars were devoted to
briefings about how to play SimBrand, the relationship between SimBrand and strategic marketing
theory, and tutor guidance on the appropriate methods of analysis and decision-making to deploy in
the game. These seminars were the normal weekly small-group classes for the students to support the
weekly lecture series; both the game play and the research described in this paper were fully
integrated into the module so that no additional teaching resources were required over and above the
12
standard allocation. Students playing the game were organized into groups of four, which is a group
size that has been recommended for experiential learning exercises (Strong & Anderson, 1990).
However, the questionnaire was administered to individuals under controlled, test-like conditions.
With the aim of achieving high reliability between the two administrations of the questionnaire,
exactly the same research instrument was used at the start and at the end of the game. This approach
carries a small risk that, at the time of the second administration, some respondents may recollect
questions from the first administration. However, the risk here was considered minimal because,
firstly, three months elapsed between administrations, secondly, all questionnaires were collected
after the first administration, and, thirdly, no feedback was provided to students until after the second
questionnaire administration.
Administration of the research instrument was confidential but not anonymous. Since the students
were to receive feedback on their performance in the tests incorporated into the questionnaire once
the study had been completed, as a form of constructive feedback, it was necessary to record
respondents’ student identification numbers. In addition, since the research objectives require the
comparative analysis of the results from the first (before) and second (after) measurements, it was
necessary to have a mechanism for pairing-up the responses; the student identification number was
used for this. The questionnaire was administered in class as a part of the normal business of running
the module. The research process was integrated into the teaching and learning strategy for the
module; providing feedback to students on their results on the questionnaire tests (that is, how their
self-efficacy, quantitative skills and financial skills had changed during the module) was part of the
formative assessment for the module. Students did not earn credit for the results they recorded on the
test questions incorporated into the research instrument. However, questions similar to those in the
research instrument were included in a time-limited summative (end of course) assessment—a fact
13
that was made known to the students at an early stage—so that those students who participated fully
in the research process benefitted by being better prepared for the terminal assessment.
Results
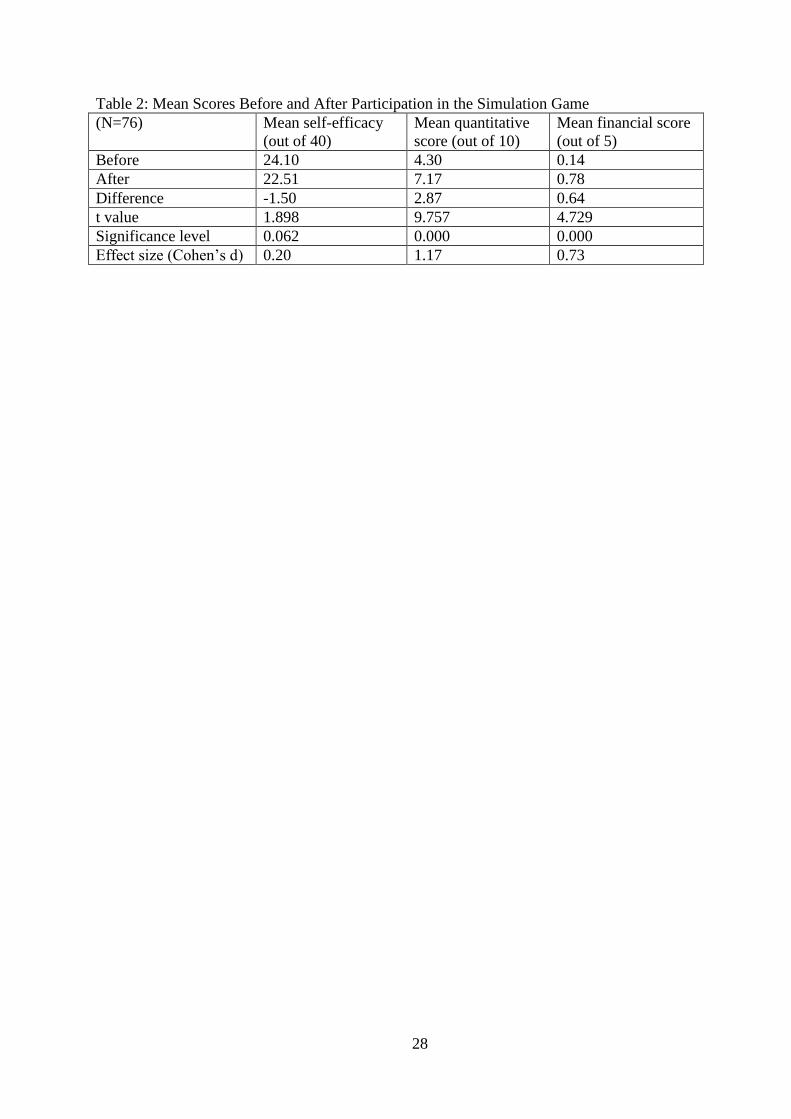
(Insert Table 2 about here)
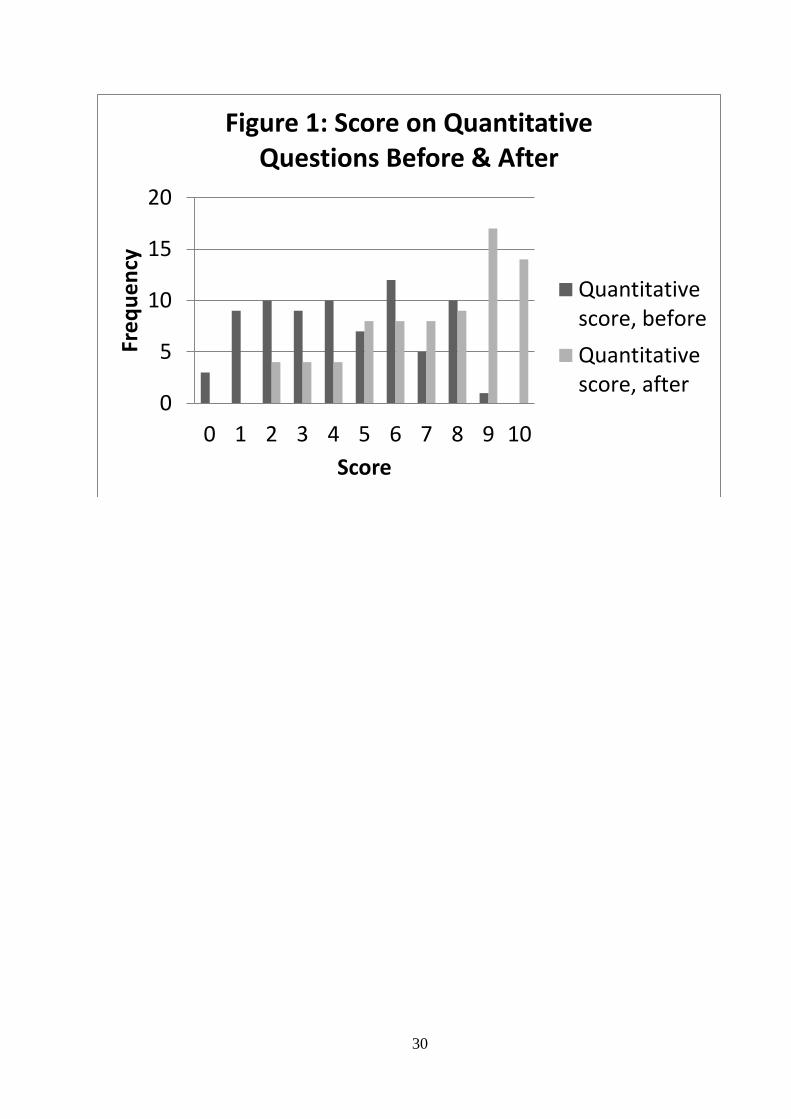
(Insert Figure 1 about here)
Table 2 provides mean scores on the three measures (self-efficacy, quantitative skills and financial
skills) before and after participation in the simulation game, and t values and effect sizes for the
difference between the before and after scores. Since the analysis was conducted on paired data,
namely the scores of the same individuals before and after participation in the simulation game,
paired t tests were used. Figure 1 provides greater detail for the quantitative skills measure. There
was a substantial increase in mean scores on the quantitative and financial skills measures after
participation in the game. For the quantitative measure, Figure 1 shows that before participation 22
students scored 0, 1 or 2 out of 10 on this measure, while after participation no student scored less
than 2, and only four students scored as low as 2. The mean score on the quantitative component
increased from 4.30 (before) to 7.17 (after) out of a possible 10, and the mean score on the financial
component increased from 0.14 (before) to 0.78 (after) out of a possible five. On the other hand,
unexpectedly, mean student self-efficacy was lower after the game than before, declining from 24.10
(before) to 22.51 (after) out of 40.
14
These results suggest that H1 and H2 should be accepted; marketing students’ scores in standard
tests of numeracy skills and of financial skills did rise following their participation in the simulation
game where they were required to engage in numerical and financial analysis. However, H3 is
rejected; marketing students’ self-efficacy in handling numerical and financial issues did not improve
following their participation in the simulation game.
Discussion
Where, as here, a quasi-experiment is conducted without a control group, some care has to be taken
in the interpretation of the results, since confounding factors might be responsible for observed
changes. In the present case these risks are considered to be fairly low. The students were not
studying any other parallel modules that covered quantitative and financial analysis, and the average
age of the respondents was 21.7 years, so that maturation of the respondents during the experimental
period can be ruled out (maturation would be a more likely confounding factor with very young
children, for example). Given that the observed changes are substantial and widely observed within
the respondent group (85.5% of respondents recorded an improvement on their quantitative score) it
is plausible to attribute much of the change to the experimental intervention, that is, the effect of
tutor-supported participation in the simulation game.
There is some evidence that the students learned the quantitative skills more effectively than the
financial skills as a result of participating in the simulation game. As the reader can see in the
Appendix, the five financial questions concerned elementary accounting terms of relevance to
marketers, such as profit margin and ROI calculations. All of the students had studied principles of
accounting earlier in their program of study, and these concepts are in common use within the
simulation game. Nevertheless, the results for the financial component were surprisingly low, with
15
the mean rising from 0.14 (before) to 0.78 (after) out of five. Clearly this is a substantial
improvement, but even the higher score still represents less than an average of one correct question
per student. Furthermore, the majority of the students did not record any improvement on the
financial component at the second administration (five scored worse, 41 scored the same, 30 scored
better). On the other hand, the great majority of the students did record an improvement on the
quantitative component at the second administration (seven scored worse, four scored the same, 69
scored better). This is consistent with the effect size results reported in Table 2, which show that the
effect size for the improvement in the quantitative score was considerably greater than for the
improvement in the financial score. Consequently, while the simulation game may be a good vehicle
for teaching both quantitative and financial skills, the evidence from this study is stronger for
quantitative skills than for financial skills. A problem here was the low base level of understanding
financial concepts. It is possible that a certain base level of understanding is needed before the
engaging, experiential learning process of the simulation game can be most effective.
The result for mean self-efficacy was unexpected. Mean self-efficacy for quantitative and financial
tasks was expected to increase as the students learned about the application of these concepts in the
practical context of the game, and became more confident in their use. In fact, a decline was
measured in mean self-efficacy, although it is not quite significant at the 5% level (t = 1.898, df = 74,
p = 0.062). It is possible that, prior to their practical engagement with the application of quantitative
and financial concepts the respondents simply assumed that, as final year undergraduates on a
marketing course, they would be fairly competent in these tasks (moderately high self-efficacy).
Subsequently, on finding that the interpretation of the game information was complex and often
confusing, they may have revised their self-efficacy beliefs downwards. In addition, Pajares and
Kransler (1995) found that when asked to complete a math self-efficacy questionnaire before
undertaking a test—the situation encountered in the research design of this study—most students are
16
over-confident about their abilities. Consequently, explanations for the unexpected rejection of H3
suggest themselves, but these cannot be supported by data from the present study and merit further
investigation.
Additional Findings
The principal goal of the study was to test for the effects of participation in the simulation game on
students’ self-efficacy and objective ability with respect to the kinds of elementary numerical and
financial analysis typically found in marketing management. However, the study design also makes
it possible to investigate whether there are significant differences between categories of student,
either in terms of their performance on the tests, or in terms of the changes in performance from the
first questionnaire administration to the second questionnaire administration. The demographic data
collected for this purpose were sex, age, ethnicity, and university entry qualification type. No
statistical association was found between age or student ethnicity and any of the dependent variables
(self-efficacy, and scores on the financial and quantitative tests). While there were no significant
differences between the absolute scores of men and women, there was some evidence that women
achieved a larger increase in their quantitative test score than men. The improvement in mean
quantitative test score for men was 2.18, and for women 3.39 (t = 2.15, df = 74, p = 0.035). This
result is consistent with prior research into women learning mathematics at college level, which has
found that a focus on practical applicability and a collaborative classroom environment are
conducive to female success (Brew, 2001). Playing a simulation game in student teams supported by
tutor guidance creates both of these conditions.
University entry qualification was not very helpful for explaining student performance on the tests
used in this study. The only difference between groups that was found to be statistically significant
was that students with overseas qualifications had higher average self-efficacy when the research
17
instrument was first administered than students with UK domestic qualifications (t = 2.416, df = 74,
p = 0.018). The levels of decline in self-efficacy and of improvement in test scores between the first
and second questionnaire administrations did not vary significantly between groups with different
entry qualifications.
Measure reliability and correlation among measures
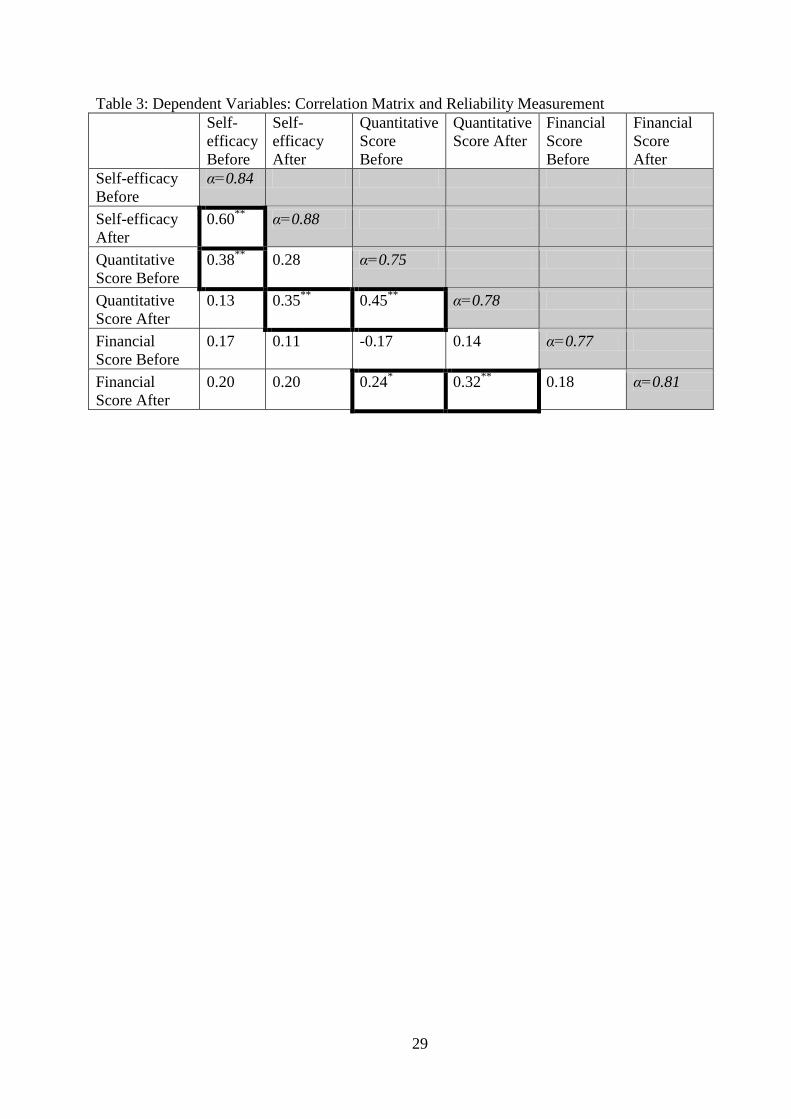
(Insert Table 3 about here)
Table 3 shows the internal reliability for the dependent variables—self-efficacy, quantitative score,
and score on financial questions— and the correlations between them, before and after test
administration. Internal reliability was measured using Cronbach’s coefficient alpha. The value of
alpha was in all cases greater than 0.7, and indicates adequate internal scale reliability (Kline, 1999).
The correlation coefficient between before and after self-efficacy scores is high and statistically
significant (r = 0.600, p = 0.000). High correlations between self-efficacy and performance are
characteristic of self-efficacy studies (Bandura, 1997), and are found in this study (self-efficacy
before with quantitative score before, r = 0.377, p = 0.001; self-efficacy after with quantitative score
after, r = 0.353, p = 0.002). Self-efficacy is usually correlated with performance, both because those
with greater objective competence tend to have higher self-efficacy, and because greater self-efficacy
leads to increased persistence with a task. In the case of the present study, it is likely that both effects
were present: students with stronger quantitative skills would have above-average self-efficacy, and
even students with average or below quantitative skills would persist longer with the tests if they had
relatively high self-efficacy. The nature of the questions asked—elementary quantitative and
financial questions—was such that greater persistence would likely bring greater success. One
observation, when administering the questionnaire, was that in the case of a few students their self-
18
efficacy concerning quantitative and financial skills was so low that they refused even to attempt
those parts of the questionnaire the first time it was administered. That is, they gave up before they
started, and refused to make any attempt at all. If such students had slightly greater self-efficacy then
it is very likely that would have found it possible to complete at least some of the test questions.
Limitations, conclusions, and insights for marketing educators
There are limitations on the external validity of this study. This was a single-institution study on a
relatively small scale. The pre- and post-test quasi-experimental design (without control group) is
convenient to administer, but leaves open the possibility that confounding factors outside the
researchers’ control may have affected the measurements. In addition, and following considerable
reflection, it was decided that students would not be allowed to use calculators in the controlled tests
during which the research instrument was administered. Of course, in their everyday lives the
students would commonly use calculators (often on their mobile phones) for simple arithmetic
calculations. Consequently, it is possible that the students’ confidence, and self-efficacy, was
adversely affected by this condition. However, when designing the research instrument the authors
used the “non-calculator paper” of the British school-leaving test (GCSE, normally taken at age 16)
in mathematics as a guideline in calibrating the questions requiring calculation, and were concerned
that the use of calculators would have rendered the task too easy and so reduced the discriminatory
power of the research instrument.
In addition, this study only took two snapshots at the beginning and end of the simulation game. A
very important question that remains is the durability of the learning achieved by the students. Of
course, many of the skills that they used during the simulation game were skills that they had
previously been taught on an elementary quantitative methods module and a financial accounting
19
module—typically first year undergraduate modules. A question for future research is whether
learning that is achieved through an engaging, experiential learning process (such as a simulation
game) is more, less, or equally durable as learning achieved through more didactic approaches. Since
the quantitative and financial concepts are learned in a meaningful context and are not simply
learned by rote, it is plausible to suggest that deep learning may be achieved which is likely to prove
enduring (Bacon & Stewart, 2006; McIntyre & Munson, 2008).
On the first administration of the test instrument the final year students on this strategic marketing
module had fairly poor skills in the quantitative analysis of marketing data and in elementary
financial analysis, corroborating the pessimistic remarks of Ganesh et al (2010) about the analytical
skills of marketing students. Objective performance was positively correlated with self-efficacy in
numerical and financial tasks. There was no evidence that performance in such tasks is associated
with prior qualifications; university entry qualification did not prove to be a useful explanatory
variable. By the time of the second administration the average scores on the quantitative component
had increased from 4.30 (out of 10) to 7.17 and the average scores on the financial analysis
component had increased from 0.14 (out of 5) to 0.78, while the average self-efficacy score had
declined from 24.01 (out of 40) to 22.51. The outcome on quantitative skills accords fairly closely to
what the authors expected—final year marketing students are a little rusty in terms of elementary
marketing math calculations, but were able to improve quickly when faced with an engaging (and
competitive) challenge requiring the use of number. The outcome on elementary financial skills
came as a surprise to the authors. While the students’ performance improved considerably, it did so
from an unexpectedly low base, and even after the improvement the mean score achieved was less
than one correct answer out of five. As readers can see in the appendix (questions 20 to 24) these
were not difficult questions. It is very unlikely that this phenomenon is unique to the university or the
class investigated in this study; it is more likely that this is not unrepresentative of final year
20
marketing undergraduates, all of whom have, at some point in their degree, taken a module in
financial accounting. It seems to the authors that this finding is worthy of further investigation, and
that if it is found to be generalizable, then marketing educators need to identify urgently strategies to
improve the financial literacy of their graduates. If marketers are to understand and act upon
marketing metrics, they first need basic competence in marketing math and the interpretation of
elementary financial information.
The findings from this study are perhaps of greatest use to marketing educators who are already users
of simulation games, or to those who are seriously considering using a simulation game. It would
probably be undesirable to undertake the considerable task of integrating a simulation game into the
marketing curriculum purely because it could help in delivering elementary quantitative and financial
skills. There are many good reasons to use simulation games, and the present study seems to have
added one more good reason to that list. The curriculum design described in this paper has
considerable strengths: students are introduced to quantitative methods and financial concepts early
in their marketing degree course, and then this learning is reinforced towards the end of their studies
through the highly practical medium of a simulation game. This serves to remind them of the
concepts, permit them to re-acquire skills, and to see how these concepts and skills are put to use in
the work-place. The ideas presented here may encourage those marketing educators who are already
using simulation games to address more explicitly quantitative and financial analysis within the
game environment.
21
APPENDIX
Marketing Student Quantitative Skills Questionnaire
We hope that your experience on our module will help you to understand how marketing and
financial data are used to make business decisions. This is the first of two questionnaires we will be
administering during the module. We have two reasons for doing this. First, we want to get an idea
of how comfortable you are with the sorts of analyses we will be doing in the module; and second,
we want to use this opportunity to check your answers and give you feedback. That’s why we ask for
your student number—but don’t worry; the only people who will see your questionnaire are you and
ourselves as module tutors.
Please write in your student number
M
1 Your gender (please tick one)
Male 1
Female 2
2 Your age (please write in)
Years
3 Your ethnic background (Please tick one)
White 1 Black or Black British 4
Mixed 2 Chinese 5
Asian or Asian British 3 Other 6
4 Which type of qualification did you use to get a place on your university programme?
(Please tick one only)
A levels 1
Vocational qualification [e.g. BTEC] 2
Access course 3
High school in another country 4
Other 5
22
Please look at Table 1. This shows the sales report for a product called the CPC100 photocopier.
Suppose you were asked to do the following calculations or tasks. Please indicate how confident you
are that you would be able to do each correctly.
The confidence scale runs from (1) meaning “not confident at all” to (8) meaning “completely
confident”. Tick the number that matches your own feeling of confidence for the task.
5 Calculate the share of marketing expenditure that was spent on market research in April
Not confident at all (1)
(2) (3) (4) (5) (6) (7) Completely confident
(8)
6 Prepare a revised forecast for sales volume for the period July to December, taking account of the
actual data for January to June
Not confident at all (1)
(2) (3) (4) (5) (6) (7) Completely confident
(8)
7 Calculate the variance (in £ and in %) between forecast and actual advertising spend in July, if the actual
spend was £27,650
Not confident at all (1)
(2) (3) (4) (5) (6) (7) Completely confident
(8)
8 Prepare, from a blank spreadsheet, a similar spreadsheet to Table 1, showing all the same components
shown in Table 1, but for a different product.
Not confident at all (1)
(2) (3) (4) (5) (6) (7) Completely confident
(8)
9 Calculate the sales revenue generated per £1 of advertising expenditure for each month and for the
year-to-date
Not confident at all (1)
(2) (3) (4) (5) (6) (7) Completely confident
(8)
23
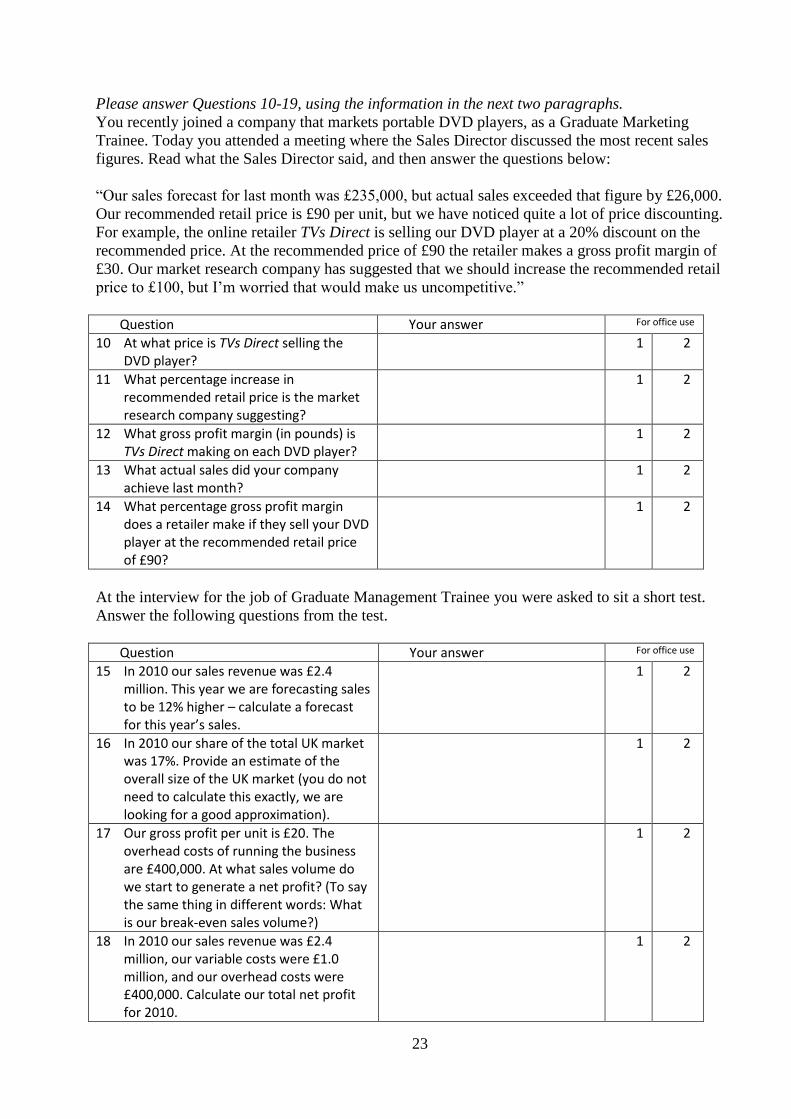
Please answer Questions 10-19, using the information in the next two paragraphs.
You recently joined a company that markets portable DVD players, as a Graduate Marketing
Trainee. Today you attended a meeting where the Sales Director discussed the most recent sales
figures. Read what the Sales Director said, and then answer the questions below:
“Our sales forecast for last month was £235,000, but actual sales exceeded that figure by £26,000.
Our recommended retail price is £90 per unit, but we have noticed quite a lot of price discounting.
For example, the online retailer TVs Direct is selling our DVD player at a 20% discount on the
recommended price. At the recommended price of £90 the retailer makes a gross profit margin of
£30. Our market research company has suggested that we should increase the recommended retail
price to £100, but I’m worried that would make us uncompetitive.”
Question Your answer For office use
10 At what price is TVs Direct selling the DVD player?
1 2
11 What percentage increase in recommended retail price is the market research company suggesting?
1 2
12 What gross profit margin (in pounds) is TVs Direct making on each DVD player?
1 2
13 What actual sales did your company achieve last month?
1 2
14 What percentage gross profit margin does a retailer make if they sell your DVD player at the recommended retail price of £90?
1 2
At the interview for the job of Graduate Management Trainee you were asked to sit a short test.
Answer the following questions from the test.
Question Your answer For office use
15 In 2010 our sales revenue was £2.4 million. This year we are forecasting sales to be 12% higher – calculate a forecast for this year’s sales.
1 2
16 In 2010 our share of the total UK market was 17%. Provide an estimate of the overall size of the UK market (you do not need to calculate this exactly, we are looking for a good approximation).
1 2
17 Our gross profit per unit is £20. The overhead costs of running the business are £400,000. At what sales volume do we start to generate a net profit? (To say the same thing in different words: What is our break-even sales volume?)
1 2
18 In 2010 our sales revenue was £2.4 million, our variable costs were £1.0 million, and our overhead costs were £400,000. Calculate our total net profit for 2010.
1 2
24
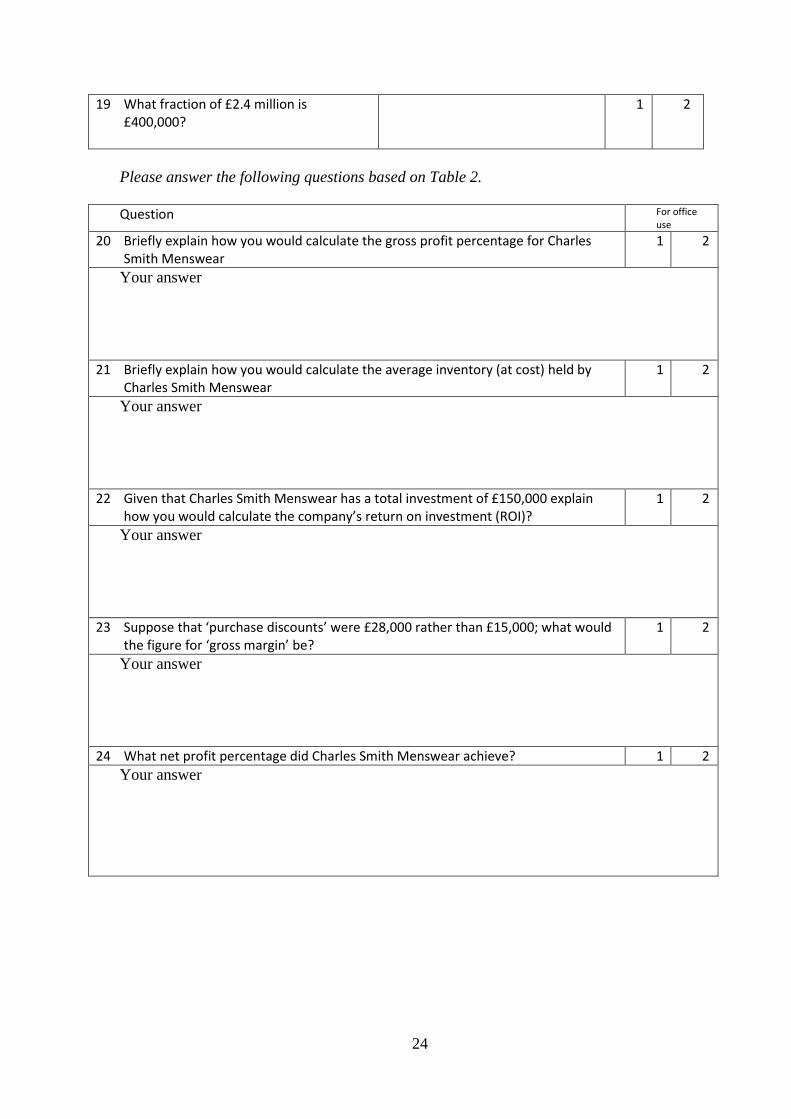
19 What fraction of £2.4 million is £400,000?
1 2
Please answer the following questions based on Table 2.
Question For office use
20 Briefly explain how you would calculate the gross profit percentage for Charles Smith Menswear
1 2
Your answer
21 Briefly explain how you would calculate the average inventory (at cost) held by Charles Smith Menswear
1 2
Your answer
22 Given that Charles Smith Menswear has a total investment of £150,000 explain how you would calculate the company’s return on investment (ROI)?
1 2
Your answer
23 Suppose that ‘purchase discounts’ were £28,000 rather than £15,000; what would the figure for ‘gross margin’ be?
1 2
Your answer
24 What net profit percentage did Charles Smith Menswear achieve? 1 2
Your answer
25
References
Ardley, Barry, & Taylor, Nick. (2010). The student practitioner: Developing skills through the
marketing research consultancy project. Marketing Intelligence & Planning, 28(7), 847-861.
Bacon, Donald R., & Stewart, Kim A. (2006). How Fast Do Students Forget What They Learn in
Consumer Behavior? A Longitudinal Study. Journal of Marketing Education, 28(3), 181-192.
doi: 10.1177/0273475306291463
Bandura, Albert. (1977). Self-efficacy: Toward a Unifying Theory of Behavioral Change.
Psychological Review, 84(2), 191-215.
Bandura, Albert. (1997). Self-Efficacy: The Exercise of Control. New York: W.H. Freeman &
Company.
Betz, Nancy E, & Hackett, Gail. (1983). The Relationship of Mathematics Self-Efficacy
Expectations to the Selection of Science-Based College Majors. Journal of Vocational
Behavior, 23, 329-345.
Bobot, Lionel. (2010). Teaching Sales and Negotiation with Combining Computer-Based Simulation
and Case Discussions. Marketing Education Review, 20(2), 115-122.
Brew, Christine. (2001). Women, mathematics and epistemology: an integrated framework.
International Journal of Inclusive Education, 5(1), 15-32. doi: 10.1080/13603110010003515
Bryman, Alan. (2004). Social Research Methods (2nd ed.). Oxford: Oxford University Press.
Bynner, John, & Parsons, Samantha. (1997). Does Numeracy Matter? London: Basic Skills Agency.
Faria, A. J. (2001). The Changing Nature of Business Simulation Gaming Research: a Brief History.
Simulation & Gaming, 32(1), 97-110.
Faria, A. J. (2006). History, Current Usage, and Learning from Marketing Simulation Games: a
Detailed Literature Review. Paper presented at the Proceedings of the Marketing
Management Association, Nashville, TE.
Ganesh, Gopala, Qin, Sun, & Barat, Somjit. (2010). Improving the Marketing Math Skills of
Marketing Undergraduate Students through a Unique Undergraduate Marketing Math Course.
Marketing Education Review, 20(1), 47-63.
Gibson-Sweet, Monica, Brennan, Ross, Foy, Anne, Lynch, Jacqueline, & Rudolph, Peter. (2010).
Key issues in marketing education: the marketing educators' view. Marketing Intelligence &
Planning, 28(7), 931-943.
Gopinath, C., & Sawyer, John E. (1999). Exploring the Learning from an Enterprise Simulation.
Journal of Management Development, 18(5), 477-489.
Jennings, David. (2002). Strategic Management: an Evaluation of the Use of Three Learning
Methods. Journal of Management Development, 21(9), 655-665.
Keys, Bernard, & Wolfe, Joseph. (1990). The Role of Management Games and Simulations in
Education and Research. Journal of Management, 16(2), 307-336.
Kline, P. (1999). The Handbook of Psychological Testing (2nd ed.). London: Routledge.
Lockett, Geoffrey. (1974). Thoughts in Numeracy in Management. Personnel Review, 3(2), 36-39.
Mason, Charlotte, & Perreault, William D. (2001). The Marketing Game! New York: McGraw-Hill.
McIntyre, Shelby H., & Munson, J. Michael. (2008). Exploring Cramming: Student Behaviors,
Beliefs, and Learning Retention in the Principles of Marketing Course. Journal of Marketing
Education, 30(3), 226-243. doi: 10.1177/0273475308321819
Pajares, Frank. (1996). Self-Efficacy Beliefs in Academic Settings. Review of Educational Research,
66(4), 543-578.
Pajares, Frank, & Graham, Laura. (1999). Self-Efficacy, Motivation Constructs, and Mathematics
Performance of Entering Middle School Students. Contemporary Educational Psychology,
24, 124-139.
Pajares, Frank, & Kransler, J. (1995). Self-Efficacy Beliefs and General Mental Ability in
Mathematical Problem-Solving. Contemporary Educational Psychology, 20(4), 426-443.

26
Parsons, Samantha, & Bynner, John. (2005). Does Numeracy Matter More? London: National
Research and Development Centre for Adult Literacy and Numeracy.
Pefanis Schlee, Regina, & Harich, Katrin R. (2010). Knowledge and Skill Requirements for
Marketing Jobs in the 21st Century. Journal of Marketing Education, 32(3), 341-352. doi:
10.1177/0273475310380881
Pilling, Bruce K., Rigdon, Edward E., & Brightman, Harvey J. (2012). Building a Metrics-Enabled
Marketing Curriculum: The Cornerstone Course. Journal of Marketing Education. doi:
10.1177/0273475312450390
Pirog III, Stephen F. (2010). Promoting Statistical Analysis in the Marketing Curriculum: A Conjoint
Analysis Exercise. Marketing Education Review, 20(3), 249-254.
Pollack, Birgit Leisen, & Lilly, Bryan. (2008). Gaining Confidence and Competence through
Experiential Assignments: An Exploration of Student Self-Efficacy and Spectrum of Inquiry.
Marketing Education Review, 18(2), 55-66.
Robson, Colin. (1993). Real World Research. Oxford: Blackwell.
Saber, Jane Lee, & Foster, Mary K. (2011). The Agony and the Ecstasy: Teaching Marketing Metrics
to Undergraduate Business Students. Marketing Education Review, 21(1), 9-20.
Schlee, Regina Pefanis, & Harich, Katrin R. (2010). Knowledge and Skill Requirements for
Marketing Jobs in the 21st Century. Journal of Marketing Education, 32(3), 341-352. doi:
10.1177/0273475310380881
Strong, J. T., & Anderson, R. E. (1990). Free Riding in Group Projects: Control Mechanisms and
Preliminary Data. Journal of Marketing Education, 12(2), 61-67.
Vos, Lynn, & Brennan, Ross. (2010). Marketing simulation games: student and lecturer perspectives.
Marketing Intelligence & Planning, 28(7), 882-897.
Walker, Ian, Tsarenko, Yelena, Wagstaff, Peter, Powell, Irene, Steel, Marion, & Brace-Govan, Jan.
(2009). The Development of Competent Marketing Professionals. Journal of Marketing
Education, 31(3), 253-263. doi: 10.1177/0273475309345197
Wellman, Neil. (2010). The employability attributes required of new marketing graduates. Marketing
Intelligence & Planning, 28(7), 908-930.
Wolfe, Joseph, & Roberts, C. Richard. (1993). A Further Study of the External Validity of Business
Games: Five-Year Peer Group Indicators. Simulation & Gaming, 24(1), 21-33.
Zanakis, S.H., & Valenzi, E.R. (1997). Student Anxiety and Attitudes in Business Statistics. Journal
of Education for Business, 73(1), 10-16.
Zantow, Kenneth, Knowlton, Dave S, & Sharp, David. (2005). More Fun and Games: Reconsidering
the Virtues of Strategic Management Simulations. Academy of Management Learning and
Education, 4(4), 451-458.
Zeidner, M. (1992). Statistics and Mathematics Anxiety in Social Science Students: Some Interesting
Parallels. British Journal of Educational Psychology, 61(3), 319-328.
27
Table 1: Respondent Characteristics
Characteristic Category N %
Gender Male 33 43.4
Female 43 56.6
Ethnicity White 27 35.5
Asian or Asian
British
22 28.9
Black or Black
British
13 17.1
Other 14 18.5
Prior qualification A levels 29 38.2
UK vocational
qualification
22 28.9
High school in
another country
19 25.0
Other 6 7.9
Notes: (1) The top-line classification of ethnicity from the UK census was used to classify self-described ethnic
groups. “Asian or Asian British” refers to those self-described as “Indian, Pakistani, Bangladeshi, or other Asian background”. “Black or Black British” refers to those self-described as “African, Caribbean or any other Black/African/Caribbean background”. For further details see http://www.ons.gov.uk/ons/guide-method/measuring-equality/equality/ethnic-nat-identity-religion/ethnic-group/index.html#8.
(2) British domestic students typically apply to university with either the more academic A level qualifications, or with equivalent vocational qualifications (such as the National Vocational Qualification or NVQ) which are aligned with occupational standards and skills.
28
Table 2: Mean Scores Before and After Participation in the Simulation Game
(N=76) Mean self-efficacy
(out of 40)
Mean quantitative
score (out of 10)
Mean financial score
(out of 5)
Before 24.10 4.30 0.14
After 22.51 7.17 0.78
Difference -1.50 2.87 0.64
t value 1.898 9.757 4.729
Significance level 0.062 0.000 0.000
Effect size (Cohen’s d) 0.20 1.17 0.73
29
Table 3: Dependent Variables: Correlation Matrix and Reliability Measurement
Self-
efficacy
Before
Self-
efficacy
After
Quantitative
Score
Before
Quantitative
Score After
Financial
Score
Before
Financial
Score
After
Self-efficacy
Before
α=0.84
Self-efficacy
After
0.60**
α=0.88
Quantitative
Score Before
0.38**
0.28 α=0.75
Quantitative
Score After
0.13 0.35**
0.45**
α=0.78
Financial
Score Before
0.17 0.11 -0.17 0.14 α=0.77
Financial
Score After
0.20 0.20 0.24*
0.32**
0.18 α=0.81
30
0
5
10
15
20
0 1 2 3 4 5 6 7 8 9 10
Fre
qu
en
cy
Score
Figure 1: Score on Quantitative Questions Before & After
Quantitativescore, before
Quantitativescore, after