Effects of Pad Properties on Cu Dishing During CMP
24
Effects of Pad Properties on Cu Dishing During CMP Caprice Gray PhD Student, Mechanical Engineering Tufts University, Medford, MA Intel Intern Presentation 8/18/05
-
Upload
casey-mcintosh -
Category
Documents
-
view
55 -
download
0
description
Effects of Pad Properties on Cu Dishing During CMP. Caprice Gray PhD Student, Mechanical Engineering Tufts University, Medford, MA Intel Intern Presentation 8/18/05. Overview. Goal: Investigate Cu line dishing during CMP using polishing pads with varying properties - PowerPoint PPT Presentation
Transcript of Effects of Pad Properties on Cu Dishing During CMP
Effects of Pad Properties on Cu Dishing During CMP
Caprice GrayPhD Student, Mechanical Engineering
Tufts University, Medford, MAIntel Intern Presentation
8/18/05
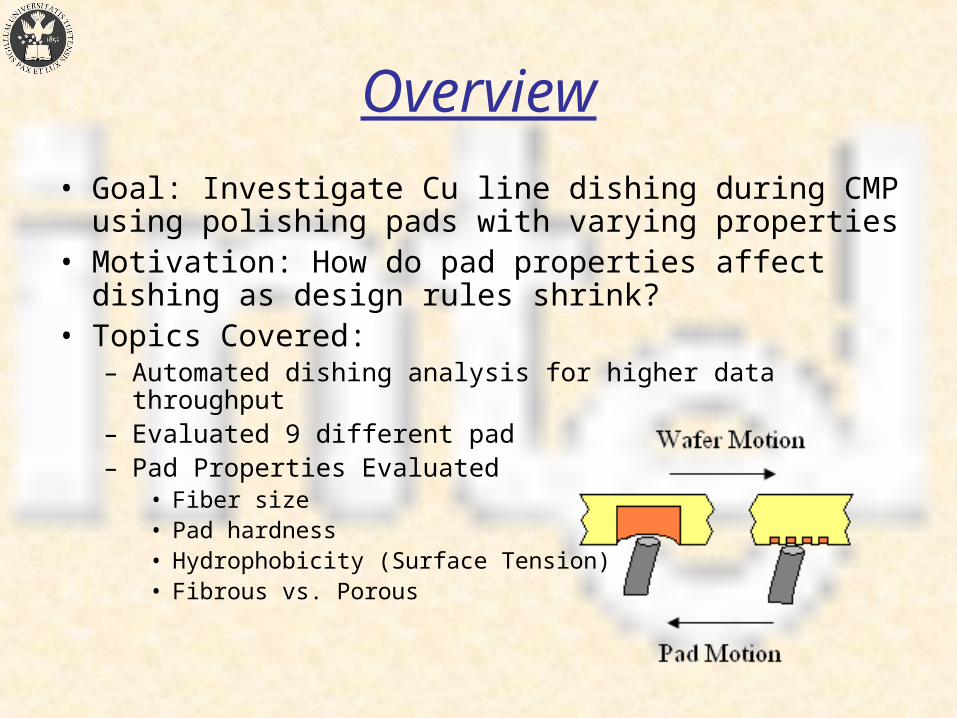
Overview
• Goal: Investigate Cu line dishing during CMP using polishing pads with varying properties
• Motivation: How do pad properties affect dishing as design rules shrink?
• Topics Covered:– Automated dishing analysis for higher data throughput– Evaluated 9 different pad– Pad Properties Evaluated
• Fiber size• Pad hardness• Hydrophobicity (Surface Tension)• Fibrous vs. Porous
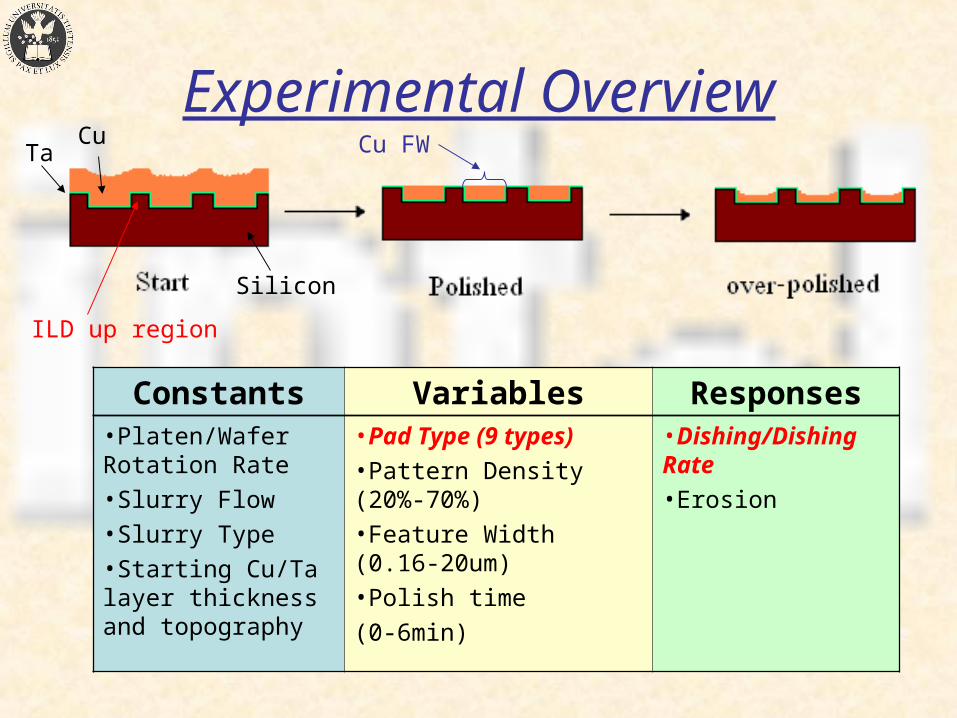
Experimental OverviewCu
Ta
Silicon
Cu FW
ILD up region
Constants Variables Responses•Platen/Wafer Rotation Rate
•Slurry Flow
•Slurry Type
•Starting Cu/Ta layer thickness and topography
•Pad Type (9 types)
•Pattern Density (20%-70%)
•Feature Width (0.16-20um)
•Polish time
(0-6min)
•Dishing/Dishing Rate
•Erosion
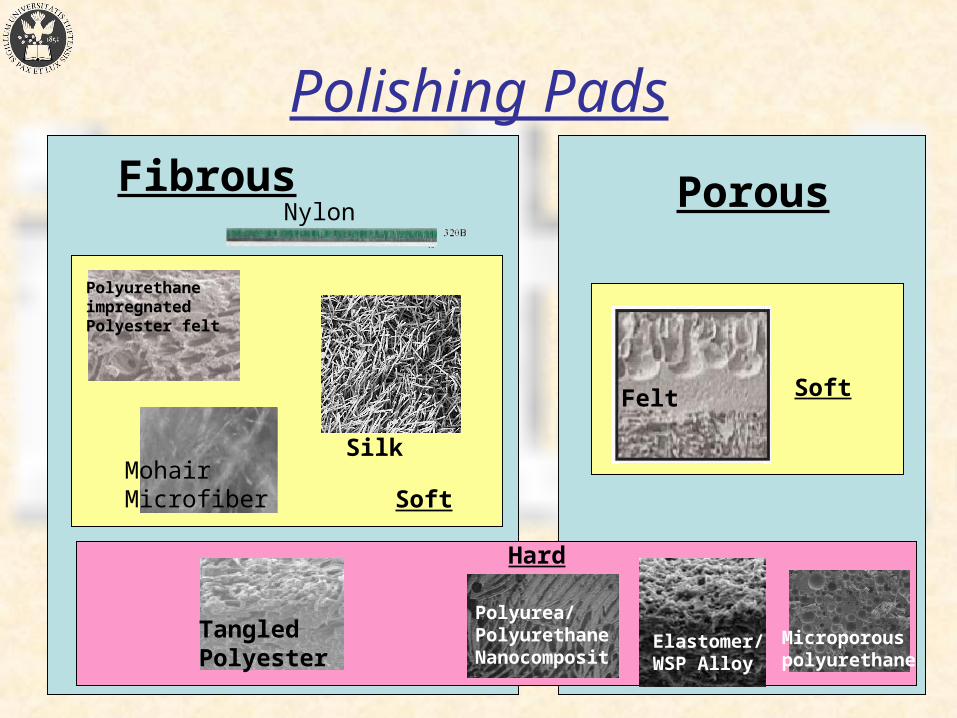
Polishing Pads
Polyurethane impregnatedPolyester felt
Felt
Nylon
Microporouspolyurethane
Silk
TangledPolyester
Fibrous Porous
Soft
Soft
Hard
Polyurea/PolyurethaneNanocomposit
Elastomer/WSP Alloy
Mohair Microfiber
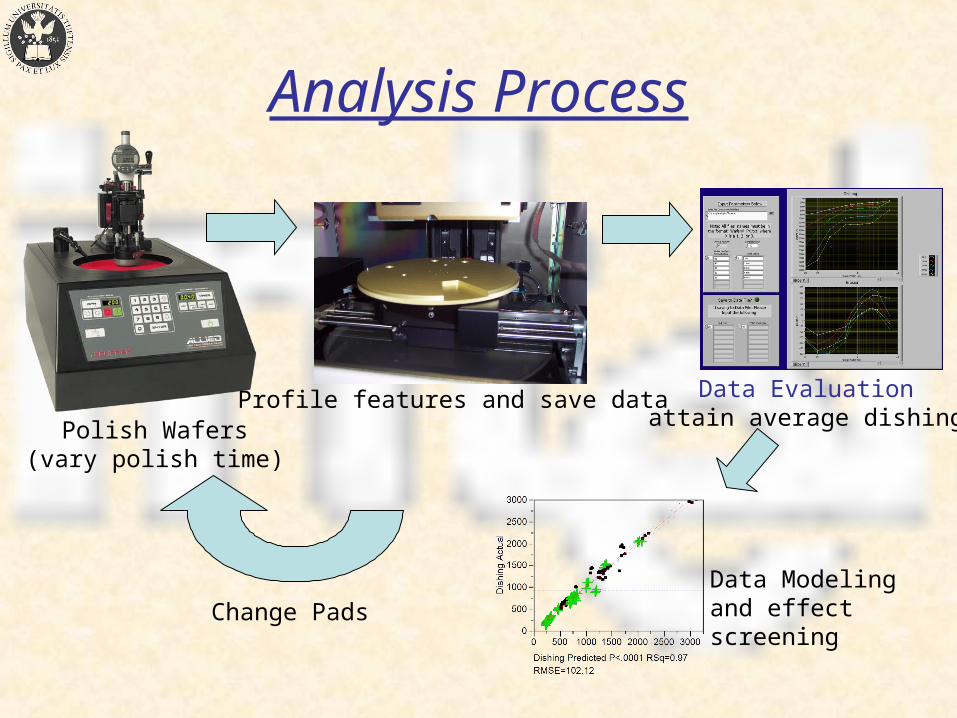
Analysis Process
Polish Wafers(vary polish time)
Profile features and save data Data Evaluationattain average dishing
Change PadsData Modeling and effect screening
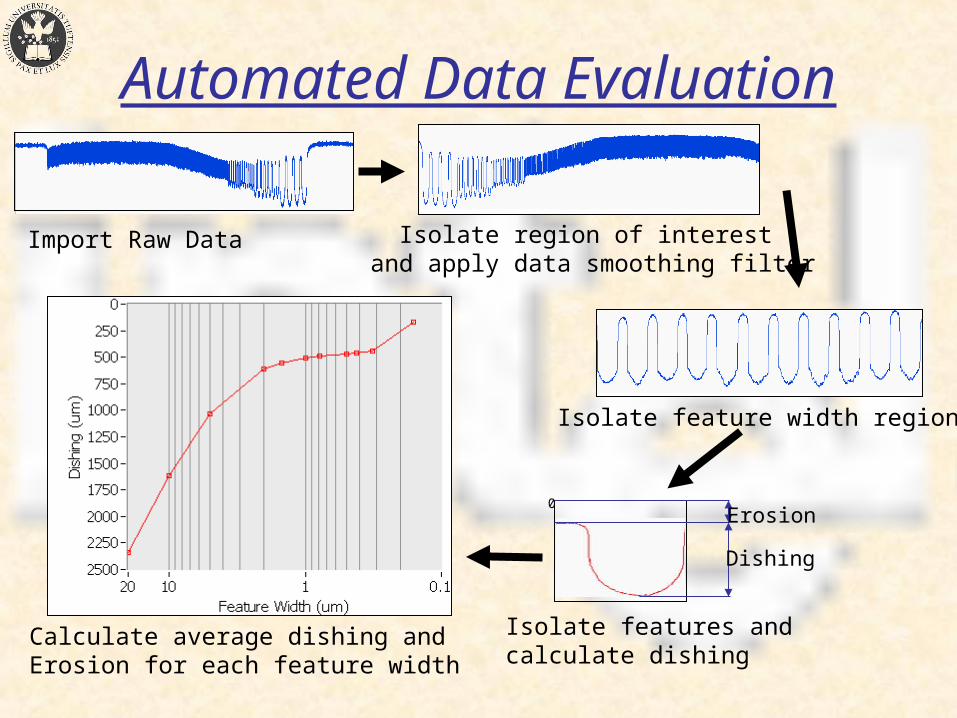
Automated Data Evaluation
Import Raw Data Isolate region of interest and apply data smoothing filter
Isolate features andcalculate dishing
Isolate feature width region
Calculate average dishing and Erosion for each feature width
0
Dishing
Erosion
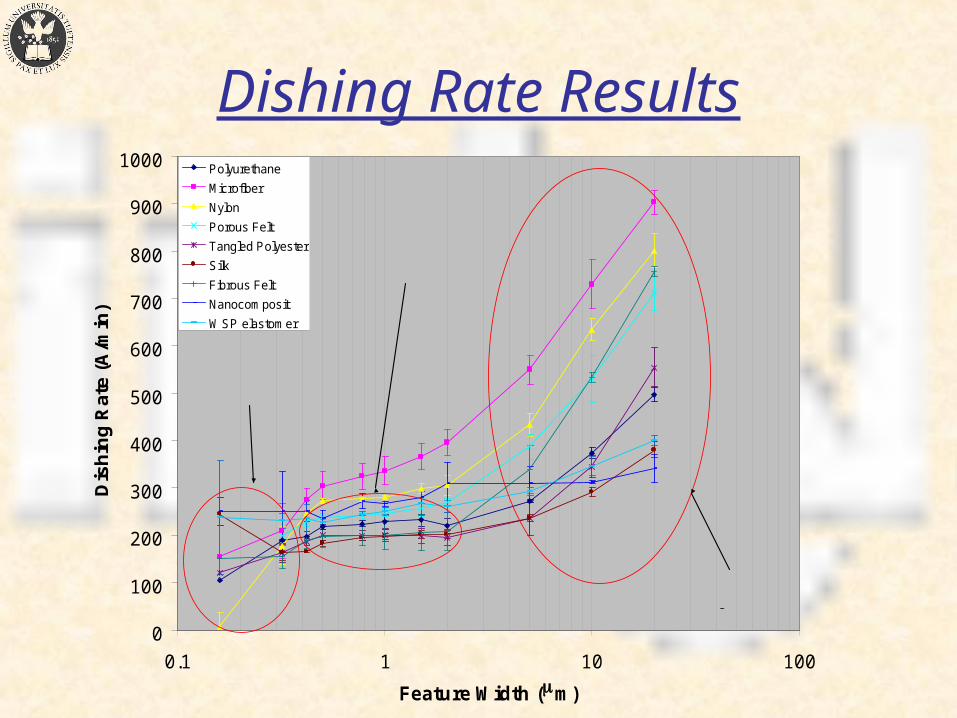
Dishing Rate Results
0
100
200
300
400
500
600
700
800
900
1000
0.1 1 10 100
Feature Width (mm)
Dis
hin
g R
ate
(A
/min
)
Polyurethane
Microfiber
Nylon
Porous Felt
Tangled Polyester
Silk
Fibrous Felt
Nanocomposit
WSP elastomer
QuestionableData
Most Pads have similardishing rates for features
smaller than 2 um
Distict Dishing ratesfor large features
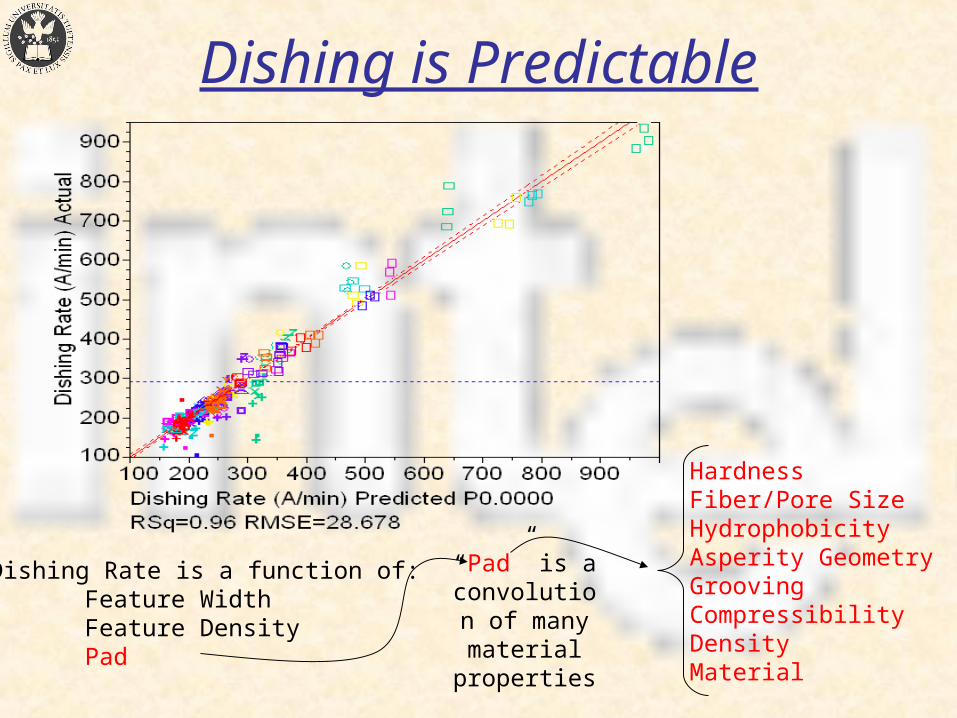
Dishing is Predictable
Dishing Rate is a function of:Feature WidthFeature DensityPad
“Pad” is a convolution of many material
properties
HardnessFiber/Pore SizeHydrophobicityAsperity GeometryGroovingCompressibilityDensityMaterial
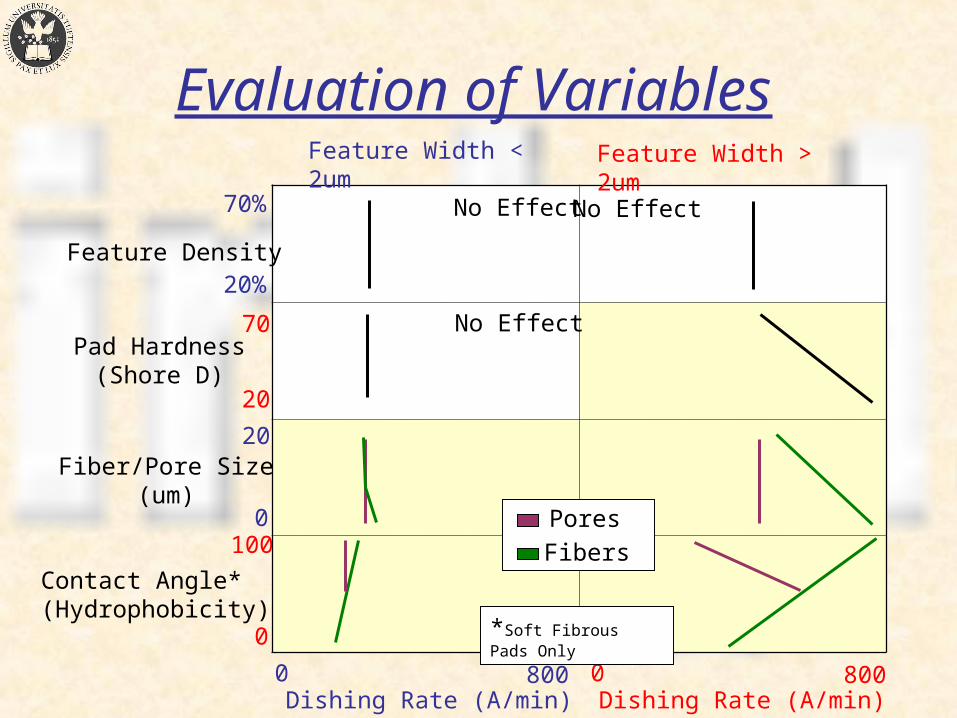
Evaluation of VariablesFeature Width > 2umFeature Width < 2um
Contact Angle*(Hydrophobicity)
Fiber/Pore Size(um)
Pad Hardness(Shore D)
Feature Density
0
20%
70%
70
20
0
20
0
100
Dishing Rate (A/min)800
Dishing Rate (A/min)800 0
Pores
Fibers
*Soft Fibrous Pads Only
No Effect No Effect
No Effect
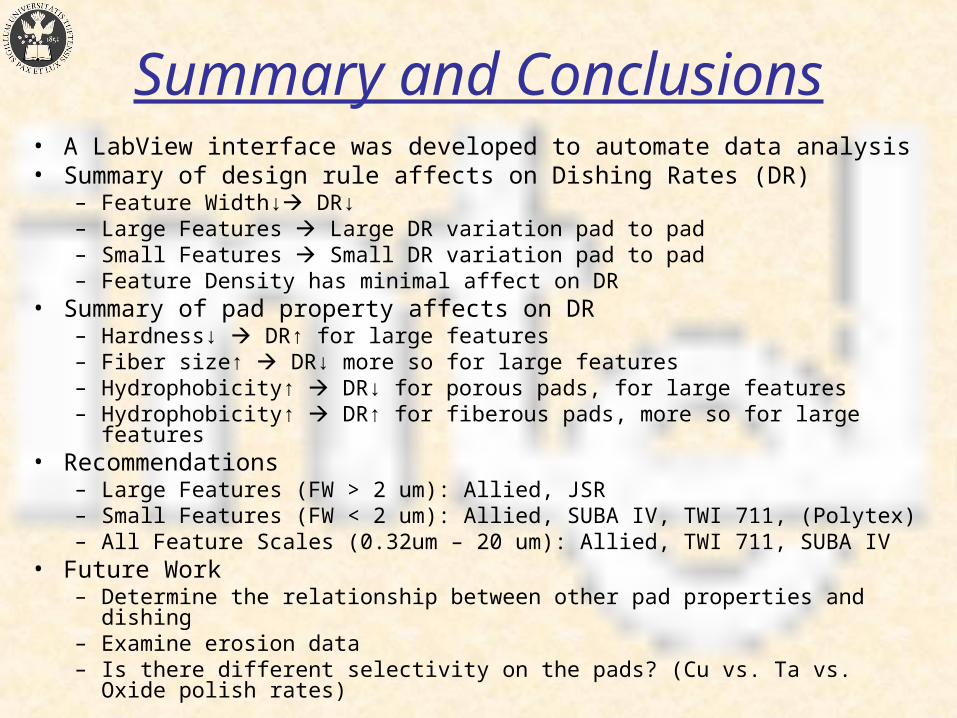
Summary and Conclusions• A LabView interface was developed to automate data analysis• Summary of design rule affects on Dishing Rates (DR)
– Feature Width↓ DR↓– Large Features Large DR variation pad to pad– Small Features Small DR variation pad to pad– Feature Density has minimal affect on DR
• Summary of pad property affects on DR– Hardness↓ DR↑ for large features– Fiber size↑ DR↓ more so for large features– Hydrophobicity↑ DR↓ for porous pads, for large features– Hydrophobicity↑ DR↑ for fiberous pads, more so for large features
• Recommendations– Large Features (FW > 2 um): Allied, JSR – Small Features (FW < 2 um): Allied, SUBA IV, TWI 711, (Polytex)– All Feature Scales (0.32um – 20 um): Allied, TWI 711, SUBA IV
• Future Work– Determine the relationship between other pad properties and dishing– Examine erosion data– Is there different selectivity on the pads? (Cu vs. Ta vs. Oxide polish rates)

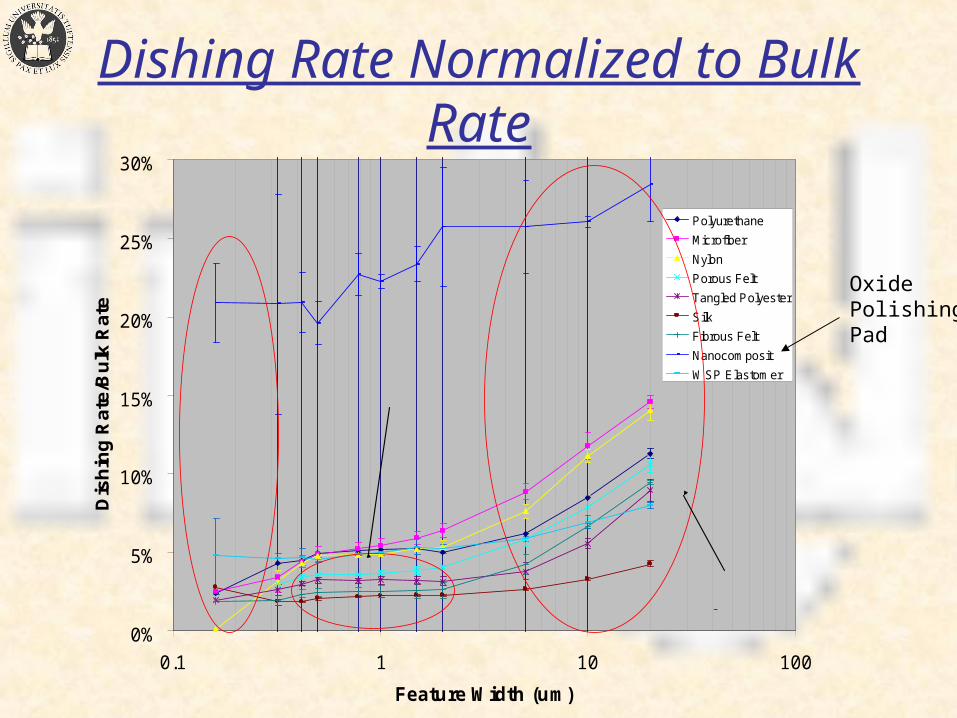
Dishing Rate Normalized to Bulk Rate
0%
5%
10%
15%
20%
25%
30%
0.1 1 10 100
Feature Width (um)
Dis
hin
g R
ate
/Bu
lk R
ate
Polyurethane
Microfiber
Nylon
Porous Felt
Tangled Polyester
Silk
Fibrous Felt
Nanocomposit
WSP Elastomer
QuestionableData
Most Pads have similardishing rates for features
smaller than 2 um
Distict Dishing ratesfor large features
Oxide Polishing Pad
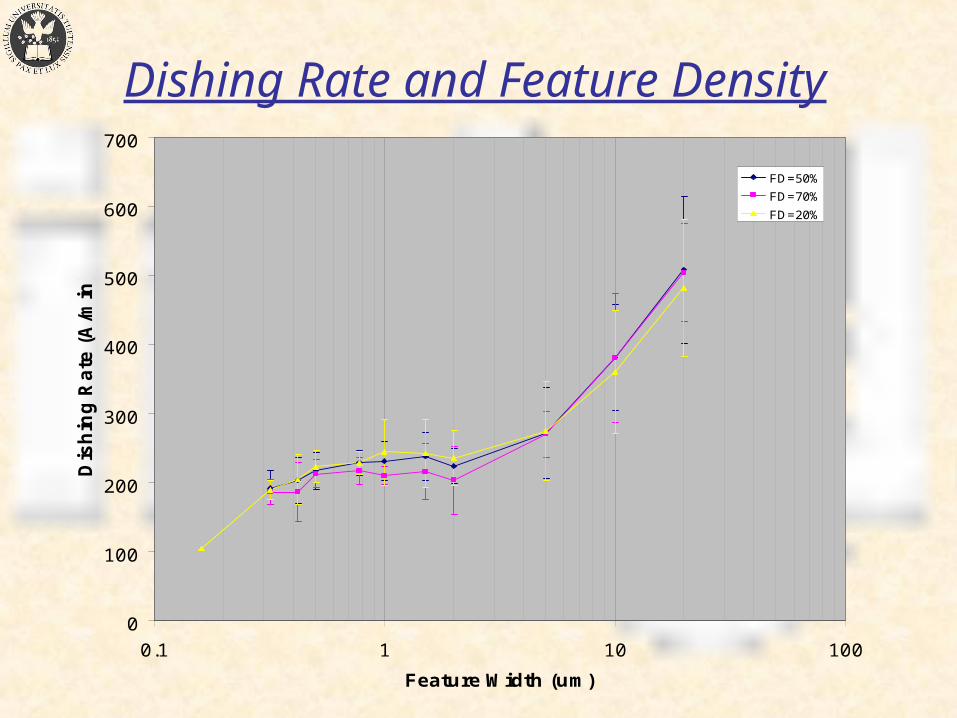
Dishing Rate and Feature Density
0
100
200
300
400
500
600
700
0.1 1 10 100
Feature Width (um)
Dis
hin
g R
ate
(A
/min
)
FD=50%
FD=70%
FD=20%
Effect of Feature Density by Pad
0
10
20
30
40
50
60
70
80
Re
lati
ve
Aff
ec
t o
f F
D o
n D
ish
ing
(a
u)
Increasing Fiber Diameter
Porous Pads
Fiberous Pads
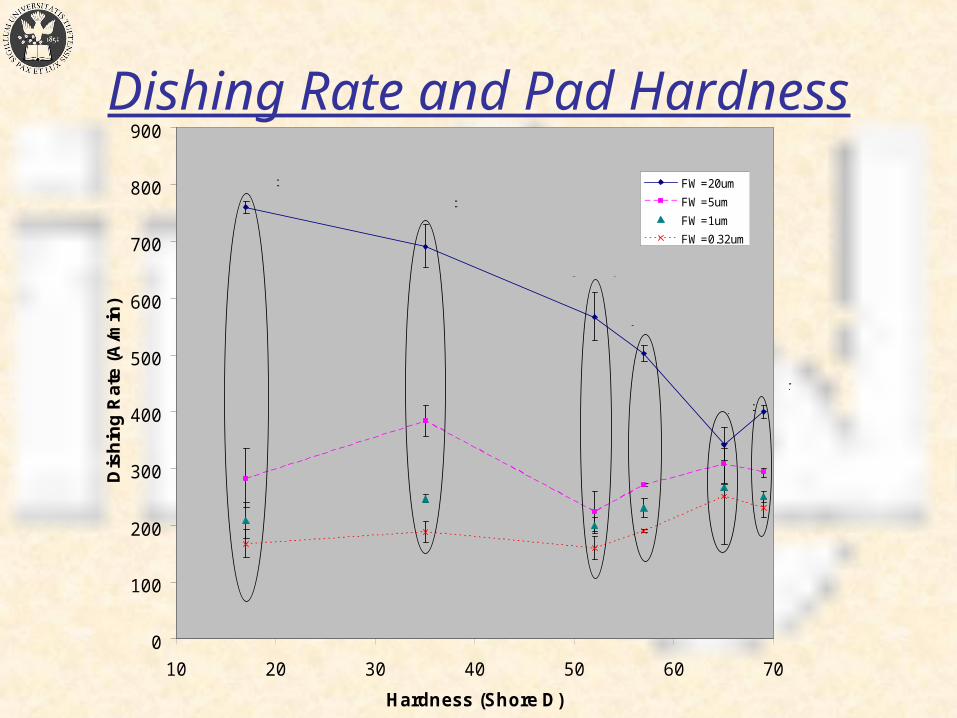
Dishing Rate and Pad Hardness
0
100
200
300
400
500
600
700
800
900
10 20 30 40 50 60 70
Hardness (Shore D)
Dis
hin
g R
ate
(A
/min
)
FW=20um
FW=5um
FW=1um
FW=0.32um
Fibrous Felt
Tangled Polyesters
Porous Felt
Polyurethane
Nanocomposit
WSPElastomer
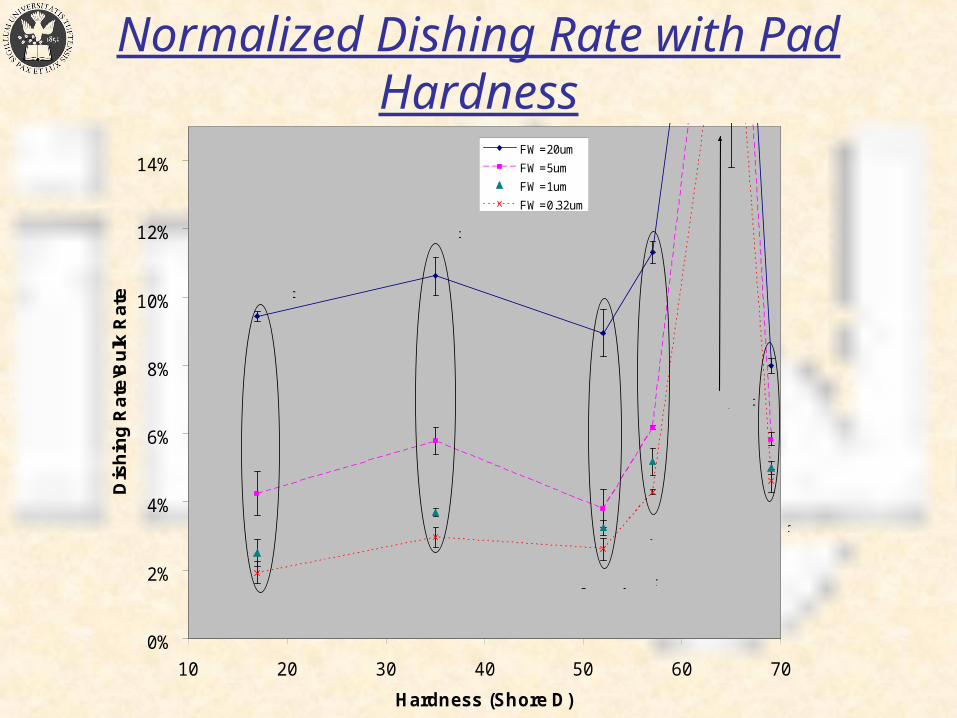
Normalized Dishing Rate with Pad Hardness
0%
2%
4%
6%
8%
10%
12%
14%
10 20 30 40 50 60 70
Hardness (Shore D)
Dis
hin
g R
ate
\Bu
lk R
ate
FW=20um
FW=5um
FW=1um
FW=0.32um
Fibrous Felt
Tangled Polyester
Porous Felt
Polyurethane
Nanocomposit
WSPelstomer
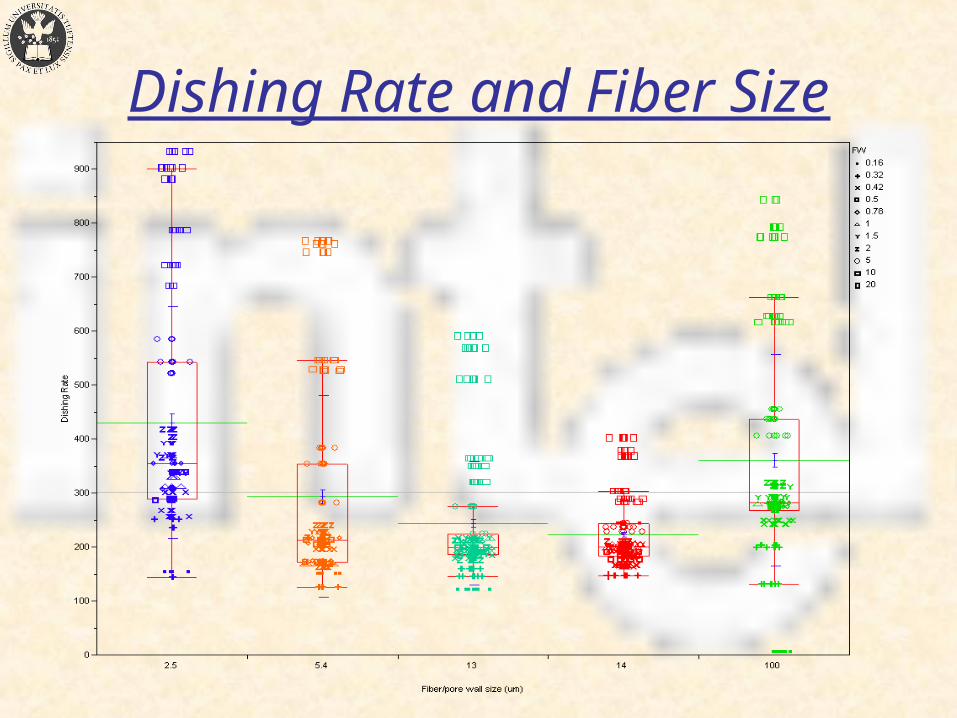
Dishing Rate and Fiber Size
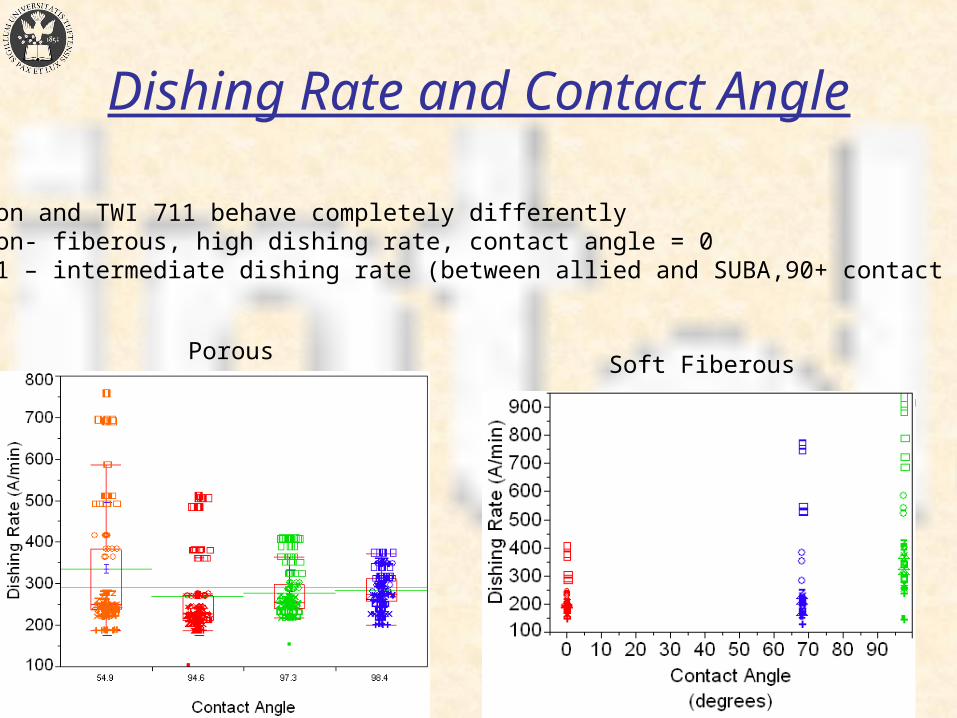
Dishing Rate and Contact Angle
Soft FiberousPorous
Brushlon and TWI 711 behave completely differentlyBrushlon- fiberous, high dishing rate, contact angle = 0TWI 711 – intermediate dishing rate (between allied and SUBA,90+ contact angle
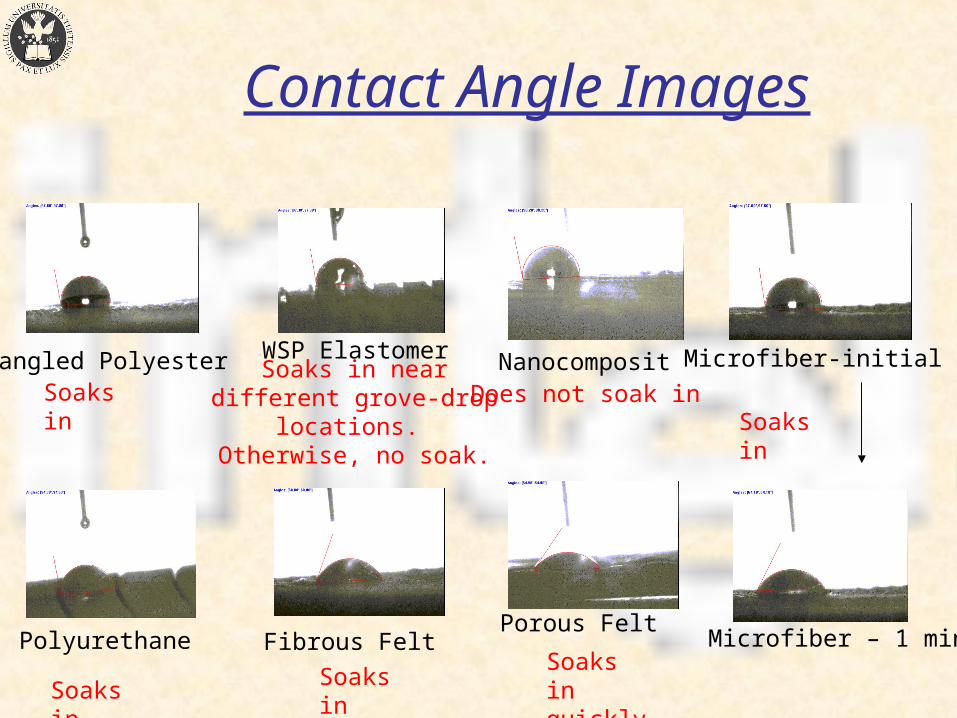
Soaks in near different grove-drop locations. Otherwise, no soak.
Contact Angle Images
Polyurethane
WSP ElastomerTangled Polyester Nanocomposit Microfiber-initial
Porous FeltMicrofiber – 1 minFibrous Felt
Soaks in
Soaks in quickly
Soaks inSoaks in quickly
Soaks in Does not soak in
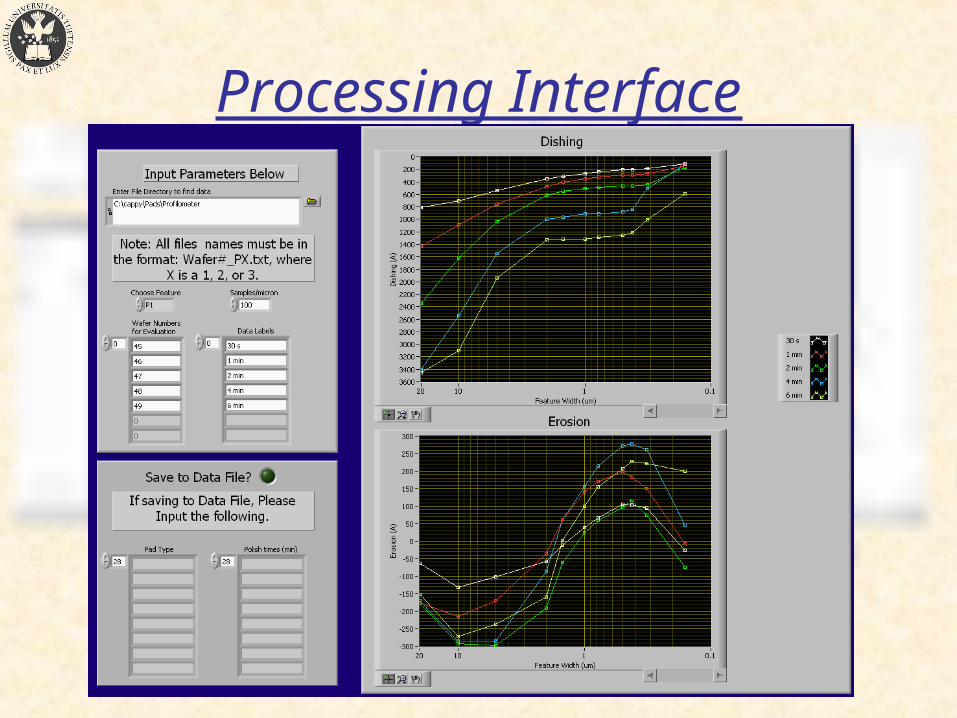
Processing Interface
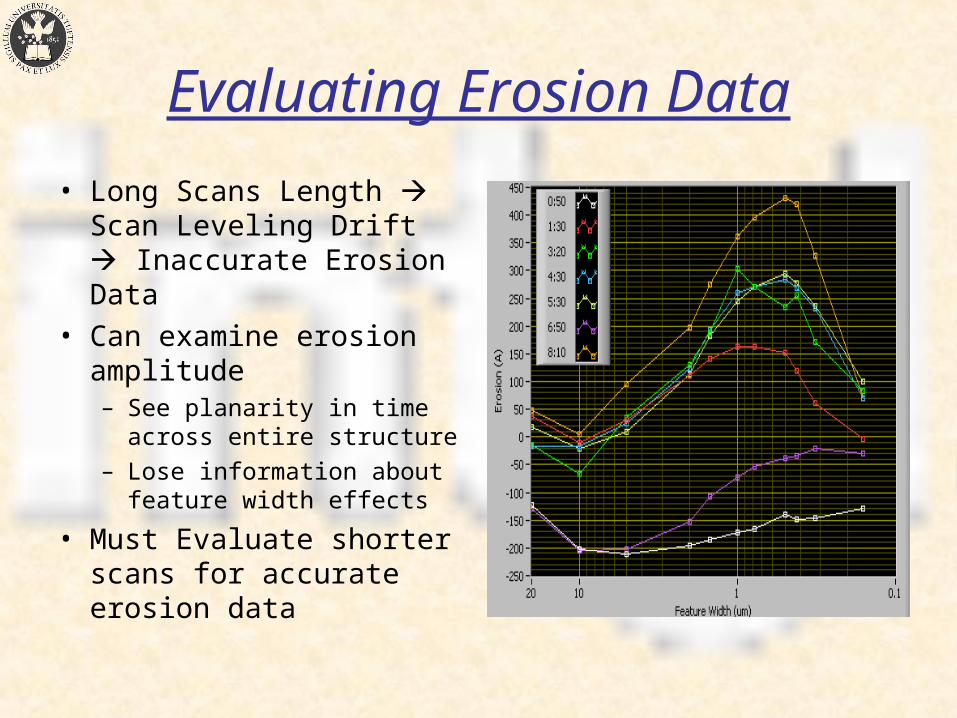
Evaluating Erosion Data
• Long Scans Length Scan Leveling Drift Inaccurate Erosion Data
• Can examine erosion amplitude– See planarity in time
across entire structure– Lose information about
feature width effects
• Must Evaluate shorter scans for accurate erosion data
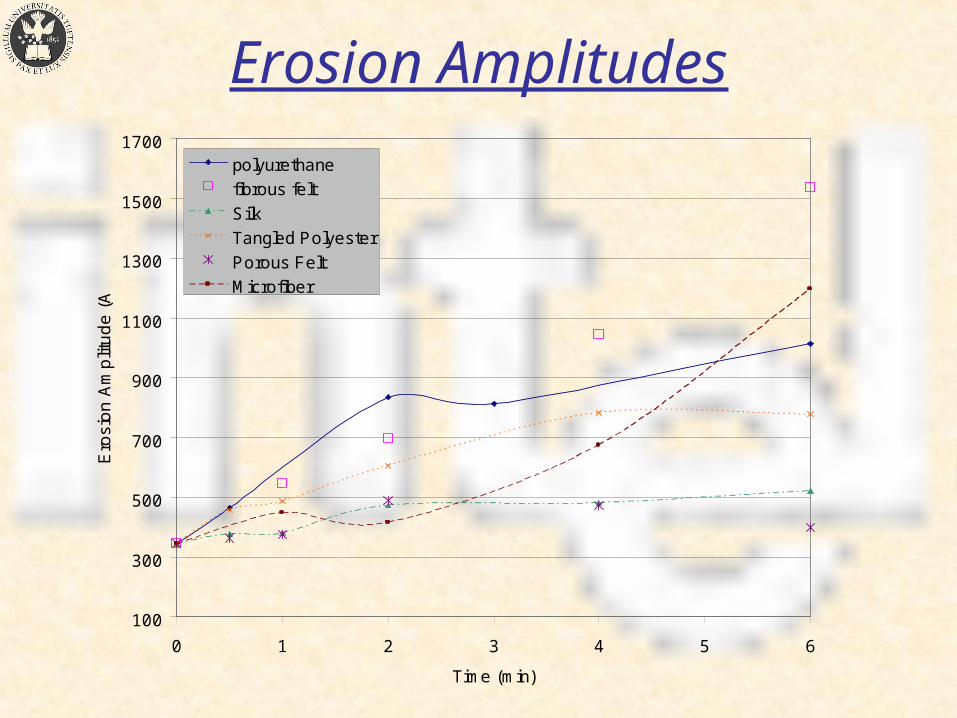
Erosion Amplitudes
100
300
500
700
900
1100
1300
1500
1700
0 1 2 3 4 5 6
Time (min)
Ero
sio
n A
mp
litu
de
(A
)
polyurethane
fibrous felt
Silk
Tangled Polyester
Porous Felt
Microfiber
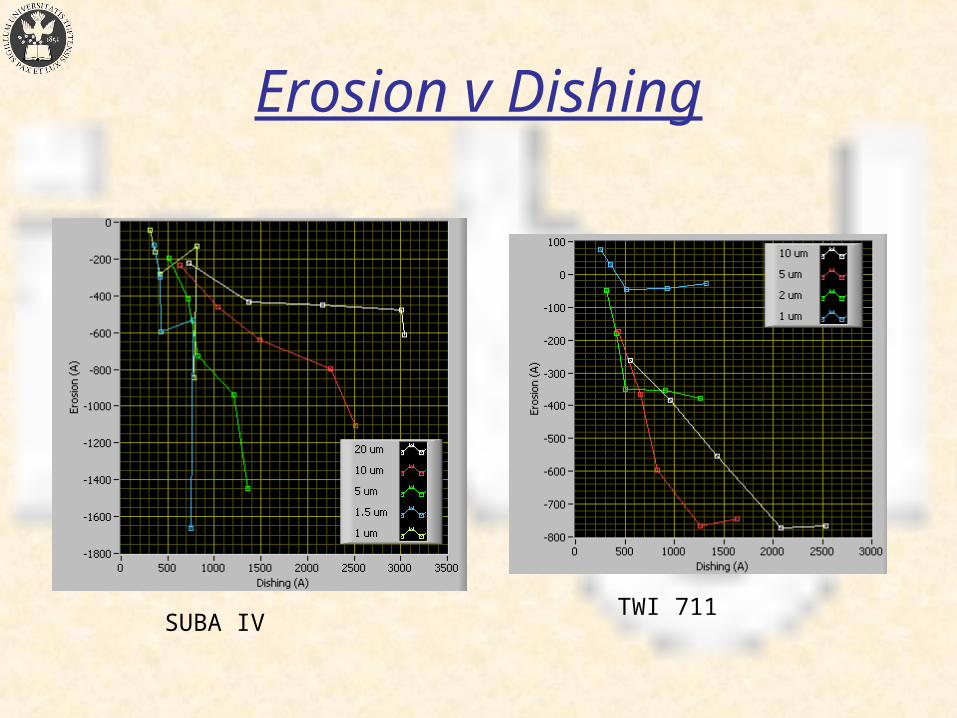
Erosion v Dishing
SUBA IVTWI 711
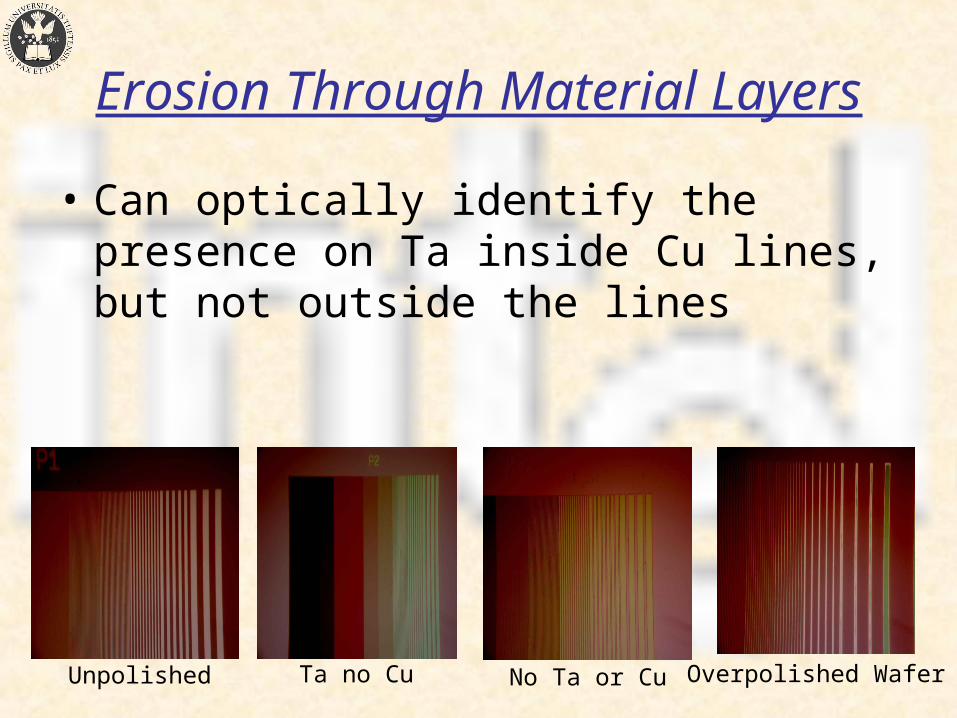
Erosion Through Material Layers
Unpolished Ta no Cu No Ta or Cu Overpolished Wafer
• Can optically identify the presence on Ta inside Cu lines, but not outside the lines