EFFECTS OF ORGANOCHLORINE CONTAMINANTS ON HATCHLING AMERICAN
110
EFFECTS OF ORGANOCHLORINE CONTAMINANTS ON HATCHLING AMERICAN ALLIGATOR (Alligator mississippiensis) GROWTH By JONATHAN J. WIEBE A THESIS PRESENTED TO THE GRADUATE SCHOOL OF THE UNIVERSITY OF FLORIDA IN PARTIAL FULFILLMENT OF THE REQUIREMENTS FOR THE DEGREE OF MASTER OF SCIENCE UNIVERSITY OF FLORIDA 2005
Transcript of EFFECTS OF ORGANOCHLORINE CONTAMINANTS ON HATCHLING AMERICAN

EFFECTS OF ORGANOCHLORINE CONTAMINANTS ON HATCHLING
AMERICAN ALLIGATOR (Alligator mississippiensis) GROWTH
By
JONATHAN J. WIEBE
A THESIS PRESENTED TO THE GRADUATE SCHOOL OF THE UNIVERSITY OF FLORIDA IN PARTIAL FULFILLMENT
OF THE REQUIREMENTS FOR THE DEGREE OF MASTER OF SCIENCE
UNIVERSITY OF FLORIDA
2005

Copyright 2005
by
Jonathan J Wiebe

This document is dedicated to Ralph Peter “Joey” Wiebe. Though I have not been able to see your face, your words, thoughts, and style live on forever.

iv
ACKNOWLEDGMENTS
I would like to thank my committee members, Dr. Tim Gross, Dr. Dave Barber,
and Dr. Franklin Percival, for their patience, understanding, and most importantly their
interest in my project. Tim, I will never be able to truly express my thanks for all the
opportunities that he has given me. I thank him for his counsel, beer making skills, and
ability to know “almost” everything before it happens but, most of all I thank you for
being my friend. Mom, I can’t say enough about all of the love, support and
understanding that she has provided. I thank her for being a great friend except for the
following: Jon the Mexican baby, Stretch Marks the Spot references, and Bulgur Wheat
care packages. Cheryl, who is my all-time, favorite chick on this rock. I thank her for
having a great attitude, closet neuroses, and removing that fishing hook. Janet, I cannot
thank her enough for all of her help, guidance, support, understanding and great food.
Thanks for making me laugh at myself when I get… well the way that I get. Ruth, thanks
for her supportive words of encouragement and wonderful sense of humor. Thanks to the
many families that I call my own Smiths, Duncans, Greenans, Scarboroughs, Loverns,
and Mitchells. All of you folks have showed tremendous support and kept me alive with
your amazing hospitality and friendship. Heath, I thank him for his time, assistance as
well as classic Arkansas stories. Phil Wilkinson, Franklin Percival and Woody
Woodward, I thank them for instilling in me an appreciation of alligators, southern jokes,
and appreciation of fine BBQ cuisine. Dwayne Carboneau, I thank him for social
commentary on not only alligator season but, life in general. Drs. Dan Sharp and Alan

v
Ealy, I thank them for providing time and assistance with my project. Finally, I thank all
of my former and current lab mates: Travis “Smitty” Smith, Carla “CW” Wieser, Jim
“Roll Tide” Williams, Sherry “Lionheart” Bostick, Howard “Howie” Jelks, Nikki
“Nicooola” Kernaghan, Shane “Prarie Boy” Ruessler, Alfred “Fredo” Harvey, Jessica
“Gambusia Girl” Noggle, Kevin “The Stick” Johnson, Jessie “Piggy Girl” Grosso, Adro
“Tweety Bird” Fazio, and James “The Tape Man” Basto. Your friendship, patience, and
understanding throughout this MS experience are greatly appreciated.

vi
TABLE OF CONTENTS page
ACKNOWLEDGMENTS ................................................................................................. iv
LIST OF TABLES........................................................................................................... viii
LIST OF FIGURES ........................................................................................................... ix
ABSTRACT....................................................................................................................... xi
CHAPTER
1 LITERATURE REVIEW .............................................................................................1
Overview.......................................................................................................................1 Organochlorine Contaminant Exposure and Endocrine Disruption in Alligators ........2 Alligator Growth and Mortality in Relation to Organochlorine Contaminants............4
Thyroid Structure...................................................................................................7 Thyroid Hormone Synthesis and Systemic Availability .......................................7 Thyroid Hormone Binding Proteins ......................................................................9 Deiodination of Thyroid Hormones ....................................................................10
Thyroid Hormone Availability and Synthesis among Oviparous Species .................12 Species-Differences in Thyroid Hormone Utilization and Regulation.......................13
Fish ......................................................................................................................13 Amphibians..........................................................................................................13 Avian ...................................................................................................................14
Physiological and Environmental Influences on Thyroid Regulation........................15 Overview .............................................................................................................15 Reproductive and Thyroidal Seasonal Cycles.....................................................16 Nutritional Availability and Hibernation.............................................................18 Physiological and Environment Parameters Influence Growth...........................19
Effects of Organochlorine Contaminant Exposure on Thyroid Regulation ...............20 Overview .............................................................................................................20 Effects of Organochlorine Contaminant Exposure on Alligator Thyroid
Regulation........................................................................................................21 Thyroid Histology Alterations in Relation to Organochlorine Contaminant
Exposure ..........................................................................................................23 Influence of Organochlorine Contaminant Exposure on Integrated Levels of
Thyroid Hormone Regulation ..........................................................................25 Thyroid Hormone Synthesis................................................................................25

vii
Thyroid Hormone Binding Proteins ....................................................................26 Deiodination of Thyroid Hormones ....................................................................27 Thyroid Hormone Excretion................................................................................28
Growth in Relation to p,p’-DDE, dieldrin, chlordane and toxaphene exposure.........30 Overview .............................................................................................................30 Experimental Data ...............................................................................................31
Organochlorine Contaminant Exposure and Hatchling Alligator Growth .................34
2 MANUSCRIPT...........................................................................................................37
Introduction.................................................................................................................37 Materials and Methods ...............................................................................................42
Egg Collection, Evaluation and Incubation.........................................................42 Clutch Selection...................................................................................................43 Animal Maintenance ...........................................................................................44 Hatchling Morphometrics and Tissue Sampling .................................................44 Plasma Thyroid Hormone Validation Procedures (Total and Free Thyroxine) ..45 Free T4 (FT4) Assay Procedures.........................................................................46 Total T4 (TT4) Assay Procedures .......................................................................46 Analysis of Chlorinated Analytes from Alligator Egg Yolks .............................47 Statistics...............................................................................................................49
Results.........................................................................................................................49 Clutch and Organochlorine Contaminant Parameters .........................................49 Hatchling Growth Rates ......................................................................................50 Thyroid Hormones, Growth and Organochlorine Contaminants ........................51
Discussion...................................................................................................................52
LIST OF REFERENCES...................................................................................................89
BIOGRAPHICAL SKETCH .............................................................................................98
viii
LIST OF TABLES
Table page 2-1. Total length growth rates among and within sites......................................................81
2-2. Snout-vent length growth rates among and within sites.............................................82
2-3. Head length growth rates among and within sites......................................................83
2-4. Body weight growth rates among and within sites.....................................................84
2-5. Hatchling alligator thyroid (TSI) and liver (LSI) somatic indices among sites. ........85
2-6. Hatchling alligator thyroid somatic indices (TSI) within sites over time...................86
2-7. Hatchling alligator liver somatic indices (LSI) within sites over time.......................87
2-8. Multiple linear regression analysis of hatchling alligator growth rates,.....................88

ix
LIST OF FIGURES
Figure page 2-1. Graphical interpretation of thyroid hormone biosynthesis.......................................61
2-2. Clutch fecundity and clutch viability (site means)...................................................62
2-3. Clutch fecundity and clutch viability (current study)...............................................63
2-4. Yolk OC concentrations. site means (a) and current study (b).. ..............................64
2-5. Hatchling alligator growth parameters among sites over time.................................65
2-6. Hatchling alligator total length (mm) within sites over time.. .................................66
2-7. Hatchling alligator snout-vent length (mm) within sites over time..........................67
2-8. Hatchling alligator head length (mm) within sites over time...................................68
2-9. Hatchling alligator body weight (g) within sites over time......................................69
2-10. Hatchling alligator growth parameters (necropsy animals) among sites over time……...................................................................................................................70
2-11. Hatchling alligator total length (mm)(necropsy animals) within sites over time.....71
2-12. Hatchling alligator snout-vent length (mm)(necropsy animals) within sites over time……...................................................................................................................72
2-13. Hatchling alligator head length (mm)(necropsy animals) within sites over time.. ..73
2-14. Hatchling alligator body weight (g) (necropsy animals) within sites over time.. ....74
2-15. Hatchling alligator thyroid weight (g)(necropsy animals) within sites over time....75
2-16. Hatchling alligator liver weight (g) (necropsy animals) within sites over time.. .....76
2-17. Hatchling alligator total thyroxine(ng/ml)and free thyroxine (pg/ml) plasma concentrations among sites over time.. ....................................................................77
2-18. Hatchling alligator total thyroxine (ng/ml) plasma concentrations within sites over time...................................................................................................................78

x
2-19. Hatchling alligator free thyroxine (pg/ml) plasma concentrations within sites over time...................................................................................................................79
2-20. Graphical interpretation of factors that control the release of growth hormone.. ...80
xi
Abstract of Dissertation Presented to the Graduate School of the University of Florida in Partial Fulfillment of the
Requirements for the Degree of Master of Science
EFFECTS OF ORGANOCHLORINE CONTAMINANTS ON HATCHLING AMERICAN ALLIGATOR (Alligator mississippiensis) GROWTH
By
Jonathan J Wiebe
December 2005
Chair: Timothy S. Gross Major Department: Veterinary Medicine
Alterations in alligator reproductive and growth parameters have been reported in
association with organochlorine (OC) contaminated sites in central Florida. These data
indicate reductions in egg and embryo quality as well as reductions in hatchling growth
and survivability. Thyroid, a growth-regulating tissue, has been suggested as a key bio-
indicator of growth among several species. In addition, several researchers have reported
alterations in thyroid regulation in relation to OC contaminant exposure. Previous field
studies have reported alterations in alligator plasma thyroid hormone concentrations as
well as several thyroid histological parameters. However, these data were unable to relate
plasma thyroid hormone (TH) concentrations to alligator growth. Under captive
conditions, preliminary data demonstrated that hatchlings from high OC environments
had hyperthyroid secretory patterns and accelerated growth. The current study examined
the same relationship; however an additional site with high OC contaminant
concentrations was added in order to evaluate the effects of OC contaminant exposure

xii
versus site as it relates to the observed alterations in hatchling growth and thyroid
regulation. In addition, a subset of hatchlings were sacrificed bi-monthly to compare
thyroid and liver weight (indicators of growth) with both hatchling external
morphometrics and plasma TH concentrations over time. Though TH were shown to be
bio-indicators of hatchling growth, no relationship was observed between OC
contaminant exposure and hatchling alligator growth or plasma TH concentrations. These
data suggest that hatchling alligator growth may be influenced by several key factors
including an integrated endocrine network (GH, IGF-I, TH, corticoids), habitat
degradation, as well as OC contaminant exposure.
1
CHAPTER 1 LITERATURE REVIEW
Overview
During the 1980’s, significant reductions in American Alligator (Alligator
mississippiensis) egg viability were observed on Lake Apopka (a site positioned at the
headwaters of the Ocklawaha river basin with high organochlorine (OC) pesticide
concentrations) in comparison with lake Woodruff, a national wildlife refuge with
reduced concentrations of OC (Woodward, 1993; Rice et al., 1998). In addition, a severe
(~ 90%) reduction in the juvenile alligator population was observed on Lake Apopka
(1981-1986) that was likely attributed to reproductive failure (Woodward, 1993). These
observed reductions in juvenile survivability and adult reproductive success have been
attributed in part to the influence of agriculture and anthropogenic alterations
specifically: extensive utilization of organochlorine pesticides by muck farming
operations (i.e., (≈ 6,000 ha) of the lake’s northern wetland was converted for vegetable
production), citrus crops, and effluent discharges from both the citrus processing plant
and sewage treatment facility located at the city of Winter Garden (Woodward et al.,
1993; Schelske and Brezonik, 1992). These environmental alterations were compounded
by the overflow of a wastewater pond located at the Tower Chemical facility which is
adjacent to the Gourd Neck region of Lake Apopka (1980) consisting of high
2
concentrations of sulfuric acid, DDT, dicofol and several unidentified OC compounds in
which by 1983, the EPA designated this facility’s property as a superfund site
(Rauschenberger, 2004). Though several of these OC compounds were identified in yolk
from alligator eggs, no direct association with reduced clutch viability was observed
suggesting other cofactors (i.e., diet, population dynamics, specific OCP mixtures) might
be involved and/or the developmental effects resulted from altered maternal physiology
(caused by OC exposure) as opposed to direct embryotoxicity (Rauschenberger et al.,
2004; Heinz et al. 1991). Therefore, sites that have been historically impacted by varying
degree of OC contamination (lakes Griffin and Apopka as well as the Emeralda Marsh
Conservation Area) continue to demonstrate coincident alterations in reproductive
function and success as measured by sex steroid biomarkers, sexual differentiation, clutch
viability, embryonic mortality, post hatch survivability, and growth (Rauschenberger,
2004; Wiebe et al., 2002; Gross et al. 1994).
Organochlorine Contaminant Exposure and Endocrine Disruption in Alligators
Reductions in alligator reproductive success as well as egg and embryo qualities
have been observed in relation to sites with intermediate to high concentrations of OC
contaminants (Rauschenberger, 2004; Masson, 1995). These chemicals have often been
referred to as “endocrine disruptors” or exogenous agents that interfere with the
production, release, transport, metabolism, binding, action, or elimination of natural
hormones in the body responsible for the maintenance of homeostasis and regulation of
developmental processes (Rolland, 2000; Brucker-Davis, 1998). As some of these OC
contaminants (i.e., p,p’-DDE) have been suggested to have positive and/or negative
estrogenic or androgenic activity, plasma sex steroid concentrations have been one of the
principal biomarkers utilized to examine the relationship between exposure to OC

3
contaminants and alterations in reproductive productivity. Gross et al. (1994) noted
alterations in plasma sex steroids among juvenile alligators from lakes Apopka (high OC
concentrations) and Woodruff (reference). Specifically, female juvenile alligators had
significantly higher plasma estradiol concentrations versus females from the reference
site (Gross et al., 1994) In contrast, juvenile male alligators from lake Woodruff exhibited
plasma testosterone concentrations that were almost four times higher than males on lake
Apopka (Gross et al., 1994). A similar incidence of altered plasma testosterone
concentrations in juvenile male alligators was reported by Guillette et al. (1999) among
seven Florida lakes. In addition, the author’s suggested a relationship between phallus
size (a sex steroid-dependent tissue) as a bio-indicator of anti-androgenic or estrogenic
contaminant exposure (Guillettte et al., 1999).
Masson (1995) reported significant reductions in alligator clutch viability (i.e.
embryonic mortality) on lake Apopka (3.9%) versus conservation sites with low OC
concentrations (71%). The author suggested that lake Apopka’s extremely variable, low
clutch viability and hatch percentages confirmed the suggestion that a severe
environmental problem exists at this lake site (Masson, 1995). Rice et al. (1998) observed
that the majority of lake Apopka’s embryonic mortality occurred during pre-egg
deposition or in early incubation with the next largest proportion of mortality occurring
very late in incubation. These data continue to support several hypotheses: 1) maternal
OC exposure alters reproductive regulation (as demonstrated by alterations in plasma
estrogen and testosterone concentrations) and, 2) the reported alterations in adult
reproductive fitness as well as maternal-transfer of OC contaminants among yolk
constituents appears to be related to the observed increase in embryonic mortality.

4
Alligator Growth and Mortality in Relation to Organochlorine Contaminants
It has been suggested that many of the observed embryonic and post-natal
alterations in offspring viability are the result in part of parental exposure to
environmental contaminants (Guillette, 1995). This exposure is primarily associated with
maternal transfer of lipophilic compounds (i.e., OCs) among yolk constituents to
developing offspring (Rauschenberger et al., 2004; Wu et al., 2000). OC exposure has
been suggested to alter hormones that control the course of development and growth and
may have the potential to alter differentiation of major organ systems resulting in
physiological and morphological changes (Rauschenberger et al., 2004; Wu et al., 2000;
Guillette et al., 1995). Wiebe et al. (2001) reported significant alterations in alligator
clutch viability and embryonic and post hatch survivabilities among sites of intermediate
(Griffin) to high (Apopka and Emeralda Marsh) OC concentrations. These data were
strengthened by Rauschenberger’s (2004) examination of the relationship between OC
exposure and subsequent reductions in egg and embryo qualities under field and
laboratory conditions. During 2000-2002 field collections, eggs collected from OC
contaminated sites had higher fecundity, lower average clutch mass and reduced clutch
viability in comparison with lake Lochloosa, a site with determined low OC
concentrations (Rauschenberger, 2004). Through the utilization of a captive adult
alligator treatment study, populations (treated and control) were orally dosed with eco-
relevant doses of the four principal OC contaminants identified from the previous field
egg collection: DDT and metabolites (principally p,p’-DDE), dieldrin, chlordanes and
toxaphene or vehicle control (Rauschenberger, 2004). Though reduced clutch viability
was observed in the treated versus control clutches, the majority of the observed mortality
was in the form of unbanded eggs which may represent either early embryonic mortality

5
or lack of conception (Rotstein et al., 2002). These data, from both field and laboratory,
continue to suggest that overall clutch survival appears to be related to total OC yolk or
maternal burdens (Rauschenberger, 2004).
Alterations in embryonic and hatchling growth as well as reduced post-hatch
survivability in relation to OC exposure has been reported in the American alligator
(Rauschenberger et al., 2004, Wiebe et al., 2002, Wiebe et al., 2001). It seems empirical
that alterations in growth and survivability among animals in these OC contaminated
environments would have ramifications at both site and population levels.
Rauschenberger (2004) examined the incidence of embryonic growth retardation and
survivability in relation to OC exposure utilizing an established embryo staging
methodology (Ferguson, 1985). This evaluation not only examined embryonic
morphological differences among sites over specific developmental time points but, also
evaluated the histopathology of live and dead embryos from “best-case” (clutches with
low mortality rates and low OC egg yolk concentrations) and “worst-case” (clutches with
high mortality rates and high OC egg yolk concentrations) clutches independent of site
(Rauschenberger, 2004). These data demonstrated several key points: 1) the youngest
embryos sampled (calendar day 14 of artificial incubation) showed the strongest
relationship between OC egg concentrations and morphometric parameters, 2)
morphology of live embryos was not consistently different among sites, except during
calendar day 25 (timeframe signifies the middle of organogenesis and may be a more
sensitive time period to OC exposure), 3) morphometry of live embryos was not
significantly related to variation in clutch mortality (i.e.., live embryos from clutches with
high mortality rates develop similarly to those of low mortality rates) 4), cyclodienes

6
(i.e., chlordane analytes) accounted for an average of 70% of the morphometric variation
that could be attributed to OC variables which is surprising considering DDT and its
metabolites compose an average of 66% of the total OC burden among all sites, 5)
concurrent decreases in maturational age and mass of dead embryos in comparison with
live embryos may have represented normal development up to a point at which the
development stalled and the embryo eventually perished, or embryos could have
developed at a much slower overall rate until the point at which they perished, and 6) no
significant differences in histopathology were observed among “best-case” and “worst-
case” clutches. (Rauschenberger 2004).
The principal mode of alligator embryonic exposure to OC contaminants has been
suggested to occur via maternal transfer among yolk constituents. Several examples have
demonstrated increased incidence of embryonic mortality in relation to exposure to high
concentrations of OC contaminants under both field and laboratory conditions. In
addition, Rauschenberger (2004) detailed significant relationships between OC exposure
and subsequent reductions in embryonic growth and development. Therefore, OC
contaminants are suggested to interfere with the regulation of critical growth and
developmental time periods which may ultimately contribute to the observed increase in
embryonic mortality on OC contaminated sites. These data demonstrate a critical need to
better understand the physiological role in regulating growth and development among
species exposed to OC contaminants.
The thyroid is one of the principal regulatory tissues of growth and development
among multiple taxonomic groups which has been demonstrated to regulate diverse
physiological endpoints including: metabolic rate, tissue differentiation and subsequent

7
growth and development (Rousset and Dunn, 2004). The two principal physiological
actions of thyroid hormones consist of 1) regulation of cellular differentiation and
development and, 2) regulation of metabolic pathways (Rousset and Dunn, 2004). These
general actions share a common integration in that changes in development and growth
are due to both hormone modulation of metabolism. In addition, cellular differentiation
changes inherently alter changes in gene expression, resulting in modulation of metabolic
pathways (Rousset and Dunn, 2004). A detailed working knowledge of thyroid regulation
is critical in understanding the complex and integrated roles the thyroid plays in growth
and development. Therefore, a literature review is provided which summarizes the
principal factors that regulate thyroid function including tissue structure, thyroid hormone
synthesis, availability, distribution, and deiodination in both embryonic and post-natal
life stages among several poikilothermic as well as homeothermic species.
Thyroid Structure
The thyroid gland is a bilobular tissue that is organized into spherical follicles
whose walls are composed of follicle cells that surround a central lumen filled with
colloid (McNabb, 2000). Colloid is primarily composed of thyroglobulin, a large protein
which is constructed in the rough endoplasmic reticulum, glycosylated in the reticular
lumen, and further post-translationally modified in the golgi apparatus of the follicle cell
(Norman and Litwack, 1997). Thyroglobulin with its tyrosine residues provides the
polypeptide backbone for the synthesis and storage of thyroid hormones as well as an
interim iodine storage area (McNabb, 2000; Norman and Litwack, 1997).
Thyroid Hormone Synthesis and Systemic Availability
The biosynthesis and secretion of thyroid hormones requires four principal
components including: thyroglobulin, thyroperoxidase, hydrogen peroxide and iodide.
8
Initially, dietary iodide is absorbed from the intestine and transferred from systemic
circulation across the basal lateral membrane of the follicle cells utilizing an ATP-driven
Na+ I- active transport (Norman and Litwack, 1997). The sequestered iodide is oxidized
to iodine via thyroperoxidase enzymatic activity in the presence of hydrogen peroxide
(principal electron acceptor) at the cell/colloid interface (McNabb, 2000). Concurrently,
follicle cells synthesize thyroglobulin which contains select tyrosyl residues that will
ultimately be iodinated and coupled to form either monoiodotyrosyls (MIT) or
diiodotyrosyls (DIT) residues and stored as colloid (Norman and Litwack, 1997). In total,
the catalyzing action of thyroperoxidase is required for the oxidation of iodide, iodination
of the thyroglobulin tyrosyl residues and the coupling of the MIT and DIT tyrosyls (i.e.,
thyronines) which based on the coupling combination produces either triiodothyronine
(T3) or thyroxine (T4) (Norman and Litwack, 1997).
Systemic TH availability is regulated utilizing a classic negative feedback
mechanism among the hypothalamic-pituitary-thyroid (HPT) axis (Norman and Litwack,
1997). As thyroid hormones occupy their nuclear receptors in the anterior pituitary, it
suppresses the transcriptional synthesis of preproTSH in the thyrotropes of the anterior
pituitary (Norman and Litwack, 1997). Under conditions of reduced T4, negative
feedback is reduced on thyrotropes of the anterior pituitary (McNabb 2000; Norman and
Litwack, 1997) Thyroid-releasing hormone (TRH) is secreted from the hypothalamus via
the hypophyseal portal vessels interacting with the anterior pituitary which results in the
release of thyroid-stimulating hormone (TSH). TSH interacts with its 7 transmembrane,
G coupled protein receptor on the thyroid follicle cells (Norman and Litwack, 1997,
Eales, 1984). As TSH is the most important controlling factor in iodine availability, the

9
thyroid follicle will proceed to generate free hormones from the stored hormones
sequestered among thyroglobulin (Norman and Litwack, 1997). This is accomplished as
the apical cell membrane engulfs the colloid by endocytosis and resulting cytoplasmic
colloid droplets fuse with lysosomes to form phagolysosomes (Norman and Litwack,
1997). Thus, the internalized thyroglobulin molecules are subject to a variety of
hydrolytic reactions leading to generation of free thyroid hormones and the complete
degradation of the protein (Rousset and Dunn, 2004; Brown et al., 2004; McNabb, 2000;
Norman and Litwack, 1997).
Thyroid Hormone Binding Proteins
Upon the release of TH from degraded thyroglobulin, a system of plasma proteins
that bind and distribute thyroid hormones is critical to counteract their loss from the
vascular and interstitial compartments by permeation into cell membranes (Prapunpoj et
al., 2002). These binding proteins are integral for systemic circulation due to THs high
lipid solubility (Richardson et al., 2005; Prapunpoj et al., 2002). Albumin (ALB) and
prealbumin or transthyretin (TBPA / TTR) are generally regarded as the two major T4
binding proteins throughout vertebrates; these having low binding affinity and high
capacity (Licht et al., 1991). In addition, many mammals possess thyroxine binding
globulin (TBG), a separate high binding affinity, low capacity binding protein that is
responsible for the principal portion of thyroid hormone binding (Licht et al., 1991).
Thyroid hormone binding protein(s) among vertebrate taxa demonstrate an evolutionary
progression towards increasing thyroid hormone distribution capacity during both
developmental and adult life stages (Richardson et al., 2005). An example of this can be
observed in the binding protein, transthyretin (TTR). TTR is transiently synthesized by
the liver during the time of increased thyroid hormone concentrations (i.e., smoltification,

10
metamorphosis and development) in fish, amphibians, reptiles whereas it is synthesized
by the liver during development and adult life stages in eutherians and birds (Richardson
et al., 2005). In crocodilians, TTR immunoreactivity has been detected in saltwater
crocodile (Crocodylus porosus) serum on days 60, 68, 75 of egg incubation, and day 1
post-hatch, but not detected in serum at 6 months of age or a 3 year old animal. In
addition, serum albumin was observed at all C. porosus age classes examined
(Richardson et al., 2005). Prapunpoj et al. (2002) demonstrated that C. porosus TTR has
higher binding affinity for T3 versus T4 suggesting that TTR was the principal
transporter of T3 to the crocodilian brain. These data in conjunction with an observed
higher percentage of amino acid sequence identity of C. porosus TTR to chicken TTR
versus lizard TTR and, Chang et al. (1999) observation of avian TTRs having higher
binding affinity for T3 versus eutherian TTRs suggest that the binding properties of C.
porosus TTR are more evolutionarily similar to those of avian TTRs versus eutherian
TTRs (Prapunpoj et al., 2002). Indeed, the separation in evolutionary functionality
between eutherian, avian and poikilotherm thyroid hormone regulation appears to be the
eutherian’s ability to generate and regulate thyroid hormones in a tissue-specific manner
(i.e., the evolution of 5’ deiodinases) and the utilization of additional binding proteins
(i.e., TBG) which enhances thyroid hormone regulation and distribution (Prapunpoj et al.,
2002).
Deiodination of Thyroid Hormones
The delivery of the predominant circulating TH (T4) to specific target tissues (i.e.,
liver, choroid plexus) is critical for the subsequent conversion of T4 to T3; which is
considered the principal, biologically-active form of TH. The majority of systemic T3
availability for multiple taxa is generated via extrathyroidal mechanisms in these target

11
tissues utilizing a process known as deiodination (Brown et al., 2004; McNabb, 2000).
The process of deiodination is catalyzed by a family of selonoenzymes called
deiodinases. These membrane-bound enzymes are located primarily in the microsomal
fraction of tissue homogenates suggesting an endoplasmic reticulum and/or plasma
membrane location (Hulbert, 2000). T4 is deiodinated by removal of iodine from the
outer ring of the molecule (ORD) to produce T3 or the inner ring of the molecule (IRD)
producing reverse T3 (rT3). ORD and IRD are catalyzed by three distinct deiodinases.
Type I catalyzes both ORD and IRD by preferentially removing phenolic and tyrosyl
iodide. This type of deiodinase is probably located in all tissues but has especially high
activity in the liver, kidney, thyroid tissue, and the central nervous system. Type II,
catalyzes only ORD by removing only phenolic iodide and has been found in the central
nervous system, brown adipose tissue, anterior pituitary and placenta. Type III catalyzes
exclusively IRD by removing only tyrosyl iodide and is found in the central nervous
system and the placenta (Shepherdley et al., 2002; Hulbert, 2000; Eales, 1984).
The integrated nature of thyroid regulation reflects a system principally regulated
by classic endocrine feedback mechanisms. In oviparous embryos, thyroid hormone
synthesis and availability are governed by a developmentally-regulated system utilizing
two sources: 1) maternal deposition in yolk (utilized during early stages of embryonic
development) and, 2) embryonic endogenous synthesis (utilized during later stages of
embryonic development). The next section details the principal mechanism(s) that
regulate oviparous embryo TH availability. In addition, a brief summary is provided to
demonstrate species-differences in TH utilization and regulation.

12
Thyroid Hormone Availability and Synthesis among Oviparous Species
Thyroid hormone availability during embryonic and early post-natal development
in oviparous species has been principally investigated through the examination of TH
synthesis, availability, compartmentalization, functionality, and utilization during several
lifestages (Prati et al., 1992; Greenblatt et al., 1989; Tagawa and Hirano, 1987; Sullivan
et al., 1987). The principal sources of thyroid hormones for developing oviparous
embryos have been identified as maternal deposition in yolk and endogenous synthesis by
the embryo (Greenblatt et al., 1989). In salmonids, high-density lipoproteins (HDL) and
vitellogenin (VTG), a yolk precursor protein, have been identified as the major carriers of
thyroid and other hormones, vitamins, ions, and minerals from maternal circulation and
subsequent sequestering in the yolk for the developing oocyte (Monteverdi and Di Giulio,
2000; Conley et al., 1997). In addition, Prati et al. (1992) suggested that TTR from
chicken extra embryonic membranes may bind iodothyronines of maternal origin
constituting the mechanism by which THs become available to the fetus before the onset
of thyroid function. In an examination of the relationship between TH content and yolk
mass, Sechman and Bobeck (1988) observed that a linear increase in both T4 and T3
concentrations in oocytes was proportional to the weight of the yolk without changes in
the iodothyronines content per 100 mg of yolk which indicated transfer of iodothyronines
together with other yolk constituents as a principal source of TH for developing oocytes.
Greenblatt et al. (1989) examined the compartmentalization of both T4 and T3 in yolk
and larvae in coho (Oncorhynchus kisutsch) and chinook (O. tschawytscha) salmon.
These data demonstrated an asynchronous species difference in thyroid hormone
utilization versus time between yolk reserves and endogenous TH production (Sullivan et
al., 1989). However, both species demonstrated a decreasing reliance on TH yolk

13
reserves in step with an increase in endogenous TH production in relation to increasing
larvae development (Sullivan et al., 1989).
Species-Differences in Thyroid Hormone Utilization and Regulation
Fish
In teleosts, T4 has been reported as the primary hormone released by the thyroid
(Eales, 1985). Under TSH stimulation, Eales (1985) reported a surge in both
endogenously labeled and stable plasma T4 concentrations with no corresponding
changes in plasma T3 concentrations. Kinetic studies have shown that about 80% of T3
in salmonids may reside in a slowly exchanging reserve pool, mainly represented by
skeletal muscle (Brown et al., 2005). This constancy in plasma T3 concentrations is due
at least in part to a rapid decrease in the proportion of available plasma T4 peripherally
monodeiodinated to plasma T3 (Eales, 1985). Though total thyroxine (TT4) and total
triiodothyronine (TT3) plasma hormone concentrations have been shown to be highly
correlated with their respective free plasma hormone concentrations, both percent free
thyroxine (%FT4) and free triodothyronine (%FT3) plasma hormone concentrations
demonstrated a negative correlation with TT4 and TT3 indicating that a smaller
proportion of total hormone is free at higher total hormone concentrations (Eales and
Shostak, 1985). In general, poikilotherm plasma TH concentrations contrast with those of
both Japanese Quail and humans where %FT3 exceeds %FT4, and are 3-5x higher than
those reported in both trout and charr (Eales and Shostak, 1985).
Amphibians
Amphibian utilization of TH has been primarily reported during several critical
stages of metamorphosis (Galton and Cohen, 1980; Suzuki and Suzuki, 1980; Mondou
and Kaltenbach, 1979). At stages V-XVIII (limb differentiation), plasma T4
14
concentrations were undetectable suggesting that bullfrog (Rana catesbeiana) tadpoles
were responsive to very low concentrations of thyroid hormones (Mondou and
Kaltenbach, 1979). During stage XIX (forelimb emergence) through stage XXI (tail
resorption), a rapid increase was observed in both circulating plasma T4 and T3
concentrations (Suzuki and Susuki, 1981). In addition, the T3/T4 ratio of plasma TH
concentrations suggested extrathyroidal deiodination during these stages of amphibian
metamorphosis (Suzuki and Susuki, 1981). At the conclusion of metamorphosis (stages:
XXIV – XXV), a rapid decline was observed in both plasma T3 and T4 concentrations in
froglets of four months of age (Suzuki and Susuki, 1981). In adult frogs, low but
detectable plasma T4 concentrations were observed (Mondou and Kaltenbach, 1979).
Avian
Birds possess the ability through the actions of thyroid hormones to regulate and
maintain thermal independence (i.e., homeothermy) (Schew et al., 1996; McNabb, 1995).
The initiation of avian thyroidal function is discriminatively observed among two
separate modes of hatchling development: precocial and altricial. Chicks of precocial
species have dramatic peaks of plasma T3 and T4 concentrations at hatching, which is
marked by the initiation of thermoregulation. By contrast, altricial chick plasma TH
concentrations are very low at hatching which is followed by a progressive increase by
the time of the greatest endothermic improvements during nestling life (McNabb 2000;
Olson et al., 1999). McNabb et al. (1991) noted in Japanese quail (Coturnix c. japonica),
a precocial species, that both plasma T4 and T3 concentrations as well as T3/T4 ratio
increased following the chick’s penetration of the air cell. Thus, both TH release and
utilization in quail increase concurrently with the beginning of pulmonary respiration and
increased metabolic rate (McNabb et al., 1991). The proposed functionality of this rapid

15
increase in TH release and utilization during the perinatal period probably institute a level
of metabolic readiness and final maturation of the nervous system (McNabb et al., 1991).
In altricial species, a significant increase in plasma T4 concentrations have been observed
in the red-winged blackbird (Agelaius phoeniceus) from hatching to day 8 by which
nestlings can achieve significantly large factorial increases in both instantaneous and
steady state rates of oxygen consumption in response to cold challenge (i.e., gradual
cooling) versus their younger counterparts (Olson et al., 1999). In addition, early nestling
blackbirds demonstrated increased plasma T3 concentrations which have been suggested
to be important in the organization and maturation of skeletal muscle essential for
shivering thermogenesis (Olson et al., 1999).
These data demonstrate the diverse and multifaceted roles that THs play in the
areas of growth and development among several species. In addition, thyroid regulation
as well as growth and development have been reported to be significantly influenced by
several physiological and environmental parameters. Therefore, a review of the principal
physiological and environmental effectors that have been reported to influence thyroid
regulation is provided.
Physiological and Environmental Influences on Thyroid Regulation
Overview
Several studies have reported an inter-relation between physiological and
environmental parameters and subsequent alterations in thyroid hormone regulation
among a number of species (Kohel et al., 2001; Denver and Licht, 1991; Eales, 1985).
Primarily, a seasonal, counter-regulatory system involving plasma T4 and testosterone
(T) concentrations has been suggested among several poikilothermic species. In this
system, plasma T4 generally increases in conjunction with and beyond testis growth and

16
subsequently regresses reproductive tissues (Bona-Gallo et al., 1980). In addition,
physiological and environmental factors such as: ambient and water temperatures,
photoperiod, nutritional availability and hibernation have been reported to play critical
roles in TH regulation among several poikilothermic and homeothermic species (Kohel et
al., 2001; Schew et al., 1996; Denver and Licht, 1991; Jallageas and Assenmacher, 1979).
Reproductive and Thyroidal Seasonal Cycles
Gonadal and thyroid seasonal cycles have been described for numerous reptile
and avian species (Hulbert, 2000; Kar and Chandola-Sakalani, 1984; Licht et al., 1984;
Bona-Gallo et al., 1980; Jallageas et al., 1978). Bona-Gallo et al. (1980) examined both
male and female cobra (Naja naja). In female N. naja, plasma T4 concentrations were
reported low in pre-vitellogenic animals, rose significantly in vitellogenic and pre-
ovulatory animals and showed only a slight decline after ovulation (Bona-Gallo et al.,
1980). Females demonstrated their greatest rise in plasma T4 concentrations during the
peak of vitellogenesis but, these were observed to be much more variable than males
(some values ranged up to 70 ng/ml) (Bona-Gallo et al., 1980). Male N. naja plasma T4
concentrations increased significantly in March-April, coincident with rapid increase in
testis weight however, plasma T4 concentrations demonstrated their greatest rise a full
month after the peak in testis weight and plasma T concentrations (Bona-Gallo et al.,
1980).These data suggest a distinct seasonality for plasma T4 concentrations in the male
cobra as plasma T4 concentrations generally increased in conjunction with and beyond
testis growth and subsequent regression (Bona-Gallo et al., 1980). Jallageas et al. (1978)
reported a strong inhibitory effect of elevated plasma T4 concentrations on sex steroid
synthesis and secretion in male Peking ducks (Anas platyrhynchos) rather than LH
concentrations suggesting that plasma T4 concentrations may be responsible for a

17
seasonal state of reduced sensitivity of the endocrine testis toward circulating LH. This
suggestion, observed both in male Peking ducks and male teal (Anas creeca), was based
on the observation that the highest concentration of plasma T4 coincided with a
substantial decrease in circulating plasma T concentrations, whereas a transient rebound
of plasma testosterone concentrations (August/September) was associated with a decline
in plasma T4 concentrations (Jallageas and Assenmacher, 1979; Jallageas et al., 1978).
Licht et al. (1985) noted a seasonal peak in plasma T4 concentrations in comparison with
plasma T concentrations and follicle-stimulating hormone (FSH) concentrations in the
painted turtle (Chrysemys picta). Following emergence in mid-March to April, C. picta
plasma T and FSH concentrations demonstrated a transient peak for about 2 weeks
followed by a decline. In contrast, plasma T4 concentrations continued to progressively
increase and did not peak until late May (i.e., the conclusion of reproductive activity).
Licht et al. (1985) noted that plasma T4 concentrations tended to fall more slowly or even
remain relatively stable in spite of the observed decline in plasma T concentrations.
Though a coincident regulatory pattern has been observed between plasma T4 and T
concentrations, Licht et al. (1985) suggests that these separate androgen and thyroid
cycles may simply reflect independent or differential responsiveness of the gonads and
thyroid to changing environmental stimuli in the temperate-zone reptiles.
Several authors have experimentally demonstrated the influence of both ambient
temperature and photoperiod as it relates to testosterone and thyroid hormone synthesis
and regulation (Jallageas and Assenmacher, 1979; Jallageas et al., 1978). In ducks and
teal, cold environments have been shown to induce increased plasma T4 concentrations
as well as moderate but, significant inhibition of plasma T concentrations (Jallageas et al.,
18
1978). However, these observed effects have not been determined to be a clear inhibition
of photogonadal response or merely an example of cold-induced hyperthyroidism
increasing metabolic rate and subsequent inhibition of sex steroid secretion (Jallageas et
al., 1978). Under artificial lighting conditions (20D: 4N), Wilson and Reinert (1999)
noted that female tree sparrows (Spizella arborea) demonstrated both thyroid-dependent
and thyroid-independent components that were coincident with reproductive activity.
Animals that received thyroidectomy (THX) demonstrated an inhibition of ovarian
growth by 81 to 84% in comparison to (THX) supplemented with T4 and controls.
Interestingly, ovarian growth in THX animals was still progressing whereas both THX
supplemented with T4 and controls had completed 40-50% of their postnuptial molt and
significant ovarian reduction had occurred by day 84 of treatment (Wilson and Reinert,
1999). These data suggest that both temperature and delayed expression of absolute
photorefractoriness (i.e., state of unresponsiveness to previously gonadostimulatory
daylength which terminates breeding in many photoperiodic bird species) are associated
with alterations in both reproductive and thyroid function (Wilson and Reinert, 1999;
Jallageas and Assenmacher, 1979).
Nutritional Availability and Hibernation
Schew et al. (1996) examined the relationship between food availability and TH
regulation among precocial and altricial species. Initially, birds were placed on a
maintenance diet (i.e., a limited ration of food was provided). Plasma T3 concentrations
among both species were significantly decreased not only compared to controls, but also
compared to each species’ own values at the beginning of the restriction period (Schew et
al., 1996). Realignmentation (i.e., birds returned to ad libitum feeding), resulted in a
rebound of plasma T3 concentrations among both species in comparison to controls

19
(Schew et al., 1996). Upon emergence from their burrows, both male and female Desert
Tortoise’s (Gopherus agassizi) demonstrated elevated plasma T4 concentrations with
increased feeding, activity (i.e., mating, locomotion), and warmer temperatures (Kobel et
al., 2001). Female tortoises exhibited a single, dramatic increase in plasma T4
concentrations during the spring (i.e., warmer ambient temperatures and peak
reproductive period) while males exhibited a longer plateau in plasma T4 concentrations
throughout the summer (Kohel et al., 2001). Sellers et al. (1982) noted in the lizard
(Cnemidophorus sexlineatus) significant increases in plasma T4 concentrations coincided
with the entrance and emergence of hibernation. The author’s suggested that the observed
increase in plasma T4 concentrations were the result of decreased peripheral utilization of
TH.
Physiological and Environment Parameters Influence Growth
Denver and Licht (1991) examined the inter-relationship between thyroid
hormones, photoperiod, ambient temperature and growth utilizing slider turtles
(Pseudemys scripta). Animals were treated by either sham, partial (PTX) or complete
(TX) thyroidectomy (Denver and Licht, 1991). Significant reductions in plasma T4
concentrations and increased plasma TSH concentrations were observed in TX treatment
versus sham. By 8 weeks (post-treatment), TX treatment had a significant reduction in
both body mass and carapace length in comparison to sham treatment (Denver and Licht,
1991). Interestingly, partial groupings of sham , PTX and TX treatment were maintained
under either constant (30ºC ambient temperature, 27± 1ºC water temperature and constant
light) or variable (40ºC to 24 ºC ambient temperature, 19ºC to 24 ºC water temperature
and a 12L:12D photoperiod) environmental conditions (Denver and Licht, 1991). Under
constant environmental conditions, growth rates in the sham and TX treatments exhibited

20
a significant decline whereas growth rates of sham and TX animals under variable
conditions declined only slightly by week 14 (Denver and Licht, 1991). These data
demonstrate the profound influence of both physiological and environment parameters on
brain-pituitary-thyroid axis regulation (Denver and Licht, 1991).
OC contaminants have been reported to alter thyroid regulation producing
deleterious effects in the areas of growth and development. As alligators have exhibited
alterations in growth and survivability in relation to OC exposure, a review is provided
demonstrating reported alterations in TH synthesis, deiodination, delivery, activity,
metabolism and excretion in relation to OC exposure.
Effects of Organochlorine Contaminant Exposure on Thyroid Regulation
Overview
Thyroid hormones are one of the principal regulators of diverse physiological
endpoints including: metabolic rate, oxygen consumption, tissue differentiation, and
subsequent embryonic and post-natal growth and development. However, these endpoints
have been shown to be highly influenced by a variety of physiological and/or
environmental influences including but not limited to nutritional state, ambient
temperature, photoperiod, and potentially coincident counter-regulation by hypothalamic-
pituitary cascades involved in reproductive tissue development and subsequent
reproductive quiescence. Currently, environmental research has been examining the
influence of introduced chemical compounds (i.e., environmental contaminants) which
have been suggested to alter thyroid function, a growth-regulating endocrine tissue
(Brouwer et al., 1998). Many of the observed actions of environmental contaminants
have been reported to occur during embryonic development and sensitive early life stages
resulting in impaired reproduction and developmental abnormalities in the offspring

21
(Guillette, 1995). These chemicals have been referred to as “endocrine disrupters” or
exogenous agents that interfere with the production, release, transport, metabolism,
binding, action, or elimination of natural hormones in the body responsible for the
maintenance of homeostasis and regulation of developmental processes (Rolland, 2000;
Brucker-Davis, 1998). Due to the reported structural similarity among THs and
chlorinated hydrocarbons (i.e., DDT, PCBs and dioxins), it has been hypothesized that
these chemicals may elicit alterations in several areas of TH regulation including: TH
synthesis, deiodination, delivery, activity, metabolism and excretion (Brucker-Davis,
1998; Porterfield, 1994). Therefore, OC contaminant exposure may contribute to the
observed alterations in alligator embryonic and hatchling growth, development and
survivability. In order to examine this relationship in greater detail, a detailed review is
provided which 1) provides the current information on alligator thyroid regulation and
growth in relation to OC exposure, 2) presents reported alterations in both thyroid
histology and regulation among several species in OC contaminated environments, 3)
demonstrates the potential disruptive influence OC contaminants may have at all levels of
thyroid regulation, and 4) provides experimental data that demonstrate alterations in
growth in relation to exposure by the four primary OC compounds identified among OC
contaminated sites in central Florida: p,p’-DDE, dieldrin, chlordane and toxaphene.
Effects of Organochlorine Contaminant Exposure on Alligator Thyroid Regulation
American alligators (Alligator mississippiensis) have been considered a
particularly suitable indicator species as they have been shown to bioaccumulate and
biomagnify contaminants to levels equal to or greater than reported in birds and
mammals (Crain and Guillette, 1998). However, an understanding of alligator thyroid
function is limited as the principal data available is in relation to OC exposure

22
(Gunderson et al., 2002; Crain et al., 1998). Crain et al. (1998) noted a negative
relationship with both plasma T3 and T4 concentrations and body size among male and
female animals from lake Woodruff (low OC). However, a general lack of correlation
between plasma TH concentrations, sex and body size was observed in sub-adult
alligators from both lakes Apopka and Okeechobee (Crain et al., 1998). These data may
potentially reflect altered reproductive potential in these animals, as THs cooperatively
regulate the reproductive activities of vertebrates (Crain et al., 1998). Gunderson et al.
(2002) and Hewitt et al. (2002) reported on sub-adult (0.9 to 1.5 m) alligator plasma T4
concentrations and quantitatively assessed sub-adult alligator thyroid function in sites
with varying degrees of OC contamination in south Florida (Belle Glade > WCA3A >
Moonshine Bay). No obvious relationship was observed between body size and plasma
T4 concentrations (Gunderson et al., 2002). Data generated from combined sampling
years demonstrated that WCA3A had significantly higher plasma T4 concentrations than
either Belle Glade or Moonshine Bay (Gunderson et al., 2002). In addition, no
differences in plasma T4 concentrations were observed between Belle Glade and
Moonshine Bay (Gunderson et al., 2002). However, significant differences were observed
between Belle Glade versus Moonshine Bay in epithelial width and colloid content
(Hewitt et al., 2002). The author’s suggest an interrelation between the observed
reduction in colloid content and reduced plasma T4 concentration observed in Belle
Glade animals. Therefore, reductions in the observed plasma T4 concentrations may be
related to OC competition with TH for binding proteins as well as elevation of UDP-GT
enzymatic activity which induces T4 glucuronidation and subsequent biliary hormone
excretion. The inter-regulatory actions of both OC contaminant affinity for TH binding

23
proteins and biliary TH excretion may have led to the equivalent plasma T4
concentrations observed between Belle Glade and Moonshine Bay (Hewitt et al., 2002).
Thyroid Histology Alterations in Relation to Organochlorine Contaminant Exposure
Several field-oriented studies utilizing both qualitative and quantitative
methodologies have provided insight as to the potential interrelation between
environmental contaminant exposure and observed pathological thyroidal alterations
among several species (Zhou et al., 1999; Moccia et al., 1986; Moccia et al., 1981;
Sonstegard and Leatherland, 1976). Sonstegard and Leatherland (1976) noted that coho
salmon (Oncorhynchus kisutch) from several Great Lakes had increased incidence of
goiter (distinct growths located on the gill arches) and diffuse swelling at the base of the
gill arches which is indicative of thyroid neoplasia. Oblate or extremely elongated thyroid
follicles with thickened, columnar shaped epithelial and extensive colloid vacuolation
were observed among spawning coho (O. kisutch) and chinook ( O. tschawytscha)
salmon among the Great Lakes in comparison with the Fraser River (control site)
(Moccia et al., 1981). In addition, dense aggregations of thyroid microfollicles were
observed in many of the Great Lakes salmon (Moccia et al., 1981). In order to assess the
degree of observed thyroid hyperplasia, Moccia et al. (1981) developed a thyroid index
for inter-lake and inter-species comparisons among the two salmon species. These data
demonstrated a significant correlation between the thyroid index and observed goiter
frequencies in the coho salmon (Moccia et al., 1981). The author’s reported a 13-fold
difference in goiter frequency among Great Lake coho salmon populations (Moccia et al.,
1981). Though the Great Lakes region has previously been documented with reduced
iodine availability, the documented incidence of goiter has been reported to fluctuate over

24
several years demonstrating goiters are not solely due to low iodine availability but, may
be attributed to the presence of organochlorine contaminants (principally: PCB
congeners) in the environment (Moccia et al., 1981; Sonstegard and Leatherland, 1978).
In order to examine the direct effects of environmental contaminants and
subsequent thyroid hyperplasia, Zhou et al. (1999) quantitatively evaluated mummichogs
(Fundulus heteroclitus) exposed to high sediment concentrations of PCBs, PAHs, DDT
and various metals (Mercury, Lead, Copper, Zinc, Chromium, Cadmium) under both
field and captive conditions. The author’s reported greater epithelial height, larger
follicles, and partially depleted colloid in fish from the contaminated site (PC) in
comparison with the control site (TK) (Zhou et al., 1999). Both male and female fish
from (PC) demonstrated a greater liver somatic index (LSI) in comparison with animals
from (TK) (Zhou et al., 1999). The author’s suggested that LSI may be utilized as a
biomarker of extrathyroidal T4 conversion (Zhou et al., 1999). Fish (male and female)
from PC demonstrated significantly higher plasma T4 concentrations versus TK, which is
different than what would typically be observed in goiterous fish (Zhou et al., 1999). No
significant differences were observed in plasma T3 concentrations among PC and TK fish
(Zhou et al., 1999). A captive reciprocal environment experiment was conducted
utilizing animals and sediment from both contaminated and control environments (Zhou
et al., 1999). These data suggest that the simulated PC environment could elevate plasma
T4 concentrations in TK fish, whereas an unpolluted environment could reduce plasma
T4 and T3 concentrations in PC fish (Zhou et al., 1999). However, conditions of goiter
as noted by Sonstegard and Leatherland (1978) were not observed in fish under field or
experimental conditions (Zhou et al., 1999).

25
Accumulation and biomagnification of high concentrations of lipophilic,
polyhalogenated hydrocarbons has been suggested as an additive cause for the observed
thyroid hyperplasia in several salmonid species among the Great Lakes region
(Sonstegard and Leatherland, 1978). Adult herring gull (Larus argentatus), a non-
migratory, piscivorous bird of the Great Lakes region were utilized to quantitatively
examine the incidence of thyroidal hyperplasia in relation to dietary environmental
contaminant exposure (Moccia et al., 1986). Great Lakes herring gulls demonstrated
predominantly microfollicular follicles, enlarged epithelial height, limited/no colloid
versus established controls (Bay of Fundy) which displayed normal thyroid morphology
(Moccia et al., 1986). Many of the microfollicular thyroids from Great Lakes herring
gulls also had a severely hyperplastic epithelial component (Moccia et al., 1986). These
data in conjunction with Moccia et al. (1981) demonstrated diffuse, microfollicular
hyperplasia in both herring gulls and salmon in the Great Lakes region (Moccia et al.,
1986). The author’s noted the increased prevalence of diffuse, microfollicular hyperplasia
in most of the Great Lake collections and its absence in similar collections from the Bay
of Fundy (control site) which are relatively free of environmental contaminants (i.e.,
lipophilic organohalogens) is consistent with the existence of thyrotoxic factors in the
Great Lakes food chain (Moccia et al., 1986).
Influence of Organochlorine Contaminant Exposure on Integrated Levels of Thyroid Hormone Regulation
Thyroid Hormone Synthesis
A wide variety of chemicals, drugs and other xenobiotics have been determined to
affect thyroid hormone biosynthesis. A number of anions act as competitive inhibitors of
iodide transport in the thyroid, including perchlorate, thiocyanate, and pertechnetate

26
(McNabb et al., 2004; Capen, 2001). In addition, several classes of chemicals have been
identified that inhibit the organification of thyroglobulin including: 1) thionamides
(thiourea, thiouracil, PTU), 2) alanine derivatives (sulfonamides), 3) substituted phenols,
4) and miscellaneous inhibitors (aminotriazole) (Capen, 2001). Many of these chemicals
have been reported to exert their action by inhibiting thyroperoxidase, responsible for
iodide oxidation to iodine, which results in the disruption of both iodination of tyrosyl
residues in thyroglobulin and also the coupling reaction of iodotyrosines (i.e., MIT and
DIT which form iodothyronines: T3 and T4) (Capen, 2001; McNabb, 2000).
Thyroid Hormone Binding Proteins
Concomitant reduction in plasma T4 concentrations has been reported in some
cases to be an indication of compromised plasma transport system for both ligands and of
the presence of hydroxylated PHAHs on the TTR protein (Brouwer et al., 1998). Cheek
et al. (1999) noted that hydroxylated PCBs are potent ligands for TTR, having affinities
in the 1 nM range, 50-fold greater than that of T4. TTR is a major T4 binding protein in
the blood, and it shows in addition to the thyroxine binding sites a site that is
complimentary to the DNA double helix, indicating a possible relationship to the
thyroxine nuclear receptor (Rickenbacher et al., 1986). The TTR molecule has two-fold
symmetry, and the binding site is lined primarily with hydrophobic amino acid side
chains that form polarizable pockets for halogen interactions (Rickenbacher et al., 1986).
In view of the highly hydrophobic/polarizable nature of the TTR binding site, the
author’s suggest that van der Waals / hydrophobic interactions would be dominant in
controlling the binding strength of biphenol compounds (Rickenbacher et al., 1986).
Contaminants with the highest TTR binding efficiencies were shown to have a para
hydroxyl substituent flanked by two meta chlorines which is analogous to the

27
diiodophenolic ring system in T4 (Rickenbacher et al., 1986). Van den Berg et al.
(1991) noted that chlorophenols demonstrated the highest level of competition for TTR
binding utilizing a competition assay (i.e., radiolabelled T4, TTR versus individual
contaminant). These data suggest that 1) interaction with the T4 binding site is dependent
on the degree of chlorination, 2) the combination of hydroxyl and chlorine groups is more
competitive than either group separately, and 3) displacement of T4 from the binding site
is by a competitive type of interaction (Van den Berg et al., 1991). The author’s noted
that DDT isoforms such as p, p’-DDD, o, p’-DDD as well as dicofol, in particular, were
found to interact with TTR (Van den Berg et al., 1991). A large proportion of the
chemicals with affinity for TTR appear to have neurotoxic properties (Van den Berg et
al., 1991). In addition, transthyretin has been reported as one of the few proteins
identified in the cerebrospinal fluid (CSF) that is synthesized by the choroids plexus and
may function in the transport of T4 through the blood-CSF barrier (Van den Berg et al.,
1991). Therefore, chemicals interacting with TTR may affect the transportation function
of the choroids plexus with possible consequences on brain function (Van den Berg et al.,
1991).
Deiodination of Thyroid Hormones
Iodothyronine deiodinase activity is principally responsible for TH conversion in
extrathyroidal tissues has been suggested as a more sensitive thyroidal index of
contaminant exposure (Adams et al. 2000). Male plaice dosed (ip) with 5 ng PCB 77 / g
body mass demonstrated reduced plasma T4 and T3 concentrations as well as increased
hepatic T4 ORD activity during week one versus week four post-exposure (Adams et al.,
2000). Coimbra et al. (2005) noted that Nile Tilapia receiving dietary treatments (0.1µg
Endosulfan / g -1 of food (EL), 0.5µg Endosulfan / g -1 of food (EH), or 0.5µg Arochlor

28
1254 / g -1 of food (A)) demonstrated alterations in both plasma T4 and ORD activity
(time points: days 21 and 35). Tilapia exposed to EL21 demonstrated lower plasma T4
concentrations than either EH (days 21 and 35), A (days 21 and 35), and control
treatments (Coimbra et al., 2005). Plasma T3 concentrations were not significantly
altered in any treatments (Coimbra et al., 2005). Liver DI ORD activity was found to be
depressed by both EL treatments while liver D3 activity was found to be enhanced by the
EL treatment in relation to time of exposure (Coimbra et al., 2005). The observed
changes in the activity of several deiodinases could result in decreased plasma T3
availability (Coimbra et al., 2005). The fact that plasma T3 concentrations remained
unaltered, is probably indicative of the prominent role of hepatic D2 activity and renal D1
activity, both of which remained stable (Coimbra et al., 2005).
Thyroid Hormone Excretion
Hepatic microsomal enzymes (specifically: uridine diphosphate
glucuronsyltransferase - UDP-GTs) play an important role in thyroid hormone
economy/availability which is accomplished in part through glucuronidation (a rate-
limiting step in the biliary excretion of T4) and sulfation (which utilizes phenol
sulfotransferase for the excretion of T3) (Capen, 2001). Glucuronidation and sulfation are
responsible, in part, for the conversion/mobilization of aglycones (parent compounds or
phase I metabolites) into water-soluble conjugates that can be subsequently excreted from
the body (Parkinson, 2001). Sulfation and desulfation appear to be very important
pathways to regulate free TH concentrations in the fetal compartment (Brouwer et al.,
1998). Since hydroxylated PCBs tend to accumulate in the fetal department, where
sulfation is a major regulation pathway, it is hypothesized that the fetal regulation of free

29
TH concentrations may be compromised by PHAHs which may have serious negative
consequences for fetal and neonatal development (Brouwer et al., 1998).
Several xenobiotics have been reported to induce microsomal enzymes and
disrupt function in rats including: CNS-acting drugs (phenobarbital) and chlorinated
hydrocarbons (i.e., chlordane, DDT, and TCDD) and polyhalogenated biphenyls (PCB,
PBB) (Capen, 2001). McClain et al. (1989) provided a detailed assessment of hepatic T4-
UDP-glucuronyl transferase activity in phenobarbital-treated rats. A significantly higher
cumulative biliary excretion of 125I-labeled T4 was observed in rats orally treated with
phenobarbital versus controls bile (McClain et al., 1989). The observed increase in biliary
excretion was accounted for by an increase in T4-glucoronide resulting from increased
T4 metabolism (McClain et al., 1989). This was consistent with enzymatic activity
measurements which resulted in increased hepatic T4-UDP-glucuronyl transferase
activity (McClain et al., 1989). In addition, histological alterations including: follicular
cell hypertrophy followed by hyperplasia in association with both a marked increase in
biliary T4 excretion and sustained increases in TSH (McClain et al., 1989). These data
are consistent with the hypothesis that the promotion of observed thyroid tumors in rats is
not a direct effect of phenobarbital treatment on the thyroid gland but rather an indirect
effect mediated by plasma TSH concentrations secreted from the pituitary secondary to
the hepatic microsomal enzyme –induced increase of T4 excretion in the bile (McClain et
al., 1989). In addition, significant species differences in UDP-GT expression have been
observed between rats and mice exposed to the PCB, Kanechlor-500 (K-500) (Kato et al.,
2003). Though K-500 treatment resulted in a significant decrease in plasma T4
concentrations in both rats and mice, a significant increase in UDP-GT activity was

30
observed only in the rat (Kato et al., 2003). These data were further supported following
K-500 treatment as gene expression of hepatic UDP-GT isoforms UGT1A1 and
UGT1AG in the rat liver were enhanced prior to the decrease in plasma T4
concentrations as opposed to the mouse liver (Kato et al. 2003). Utilizing Gunn rats
(UGT1A deficient) and Winstar rats (normal), Kato et al. (2004) dosed both species with
KC-500 and 2,2’,4,5,5’-Pentachlorobiphenyl (PentaCB) examining deiodinase activity
and additional mechanisms of biliary excretion of thyroid hormones. Plasma total T4 and
free T4 concentrations were significantly decreased in both PCB treated species (Kato et
al., 2004). In addition, type I deiodinase activity (converts T4 to T3) in Winstar rats was
significantly decreased by KC-500 but not by PentaCB, although in Gunn rats, it was
significantly decreased by both PCB isoforms (Kato et al., 2004). These data led the
author’s to suggest that PCB-mediated decrease in plasma T4 concentrations does not
occur through the induction of hepatic T4 glucuronidation enzymes (Kato et al., 2004).
These conflicting reports regarding UDP-GT activity prompted several authors to suggest
potential mechanisms/factors that may individually/collectively reduce plasma T4
concentrations including: displacement of T4 from transthyretin (TTR) binding by PCBs
facilitating free T4 excretion in urine or bile, alteration in the HPT axis, and/or increase
in estrogen sulfotransferase, which efficiently catalyzes the sulfation of iodothyronines
(Kato et al., 2004, McNabb and Fox, 2003).
Growth in Relation to p,p’-DDE, dieldrin, chlordane and toxaphene exposure
Overview
Several PCBs and organochlorine pesticides (i.e., DDE, dieldrin, chlordanes, and
toxaphene) have been suggested to alter thyroid regulation in several species under
experimental (in-ovo and in-vivo) conditions (Scollon et al., 2004; Nishimura et al., 2002,

31
Willingham, 2001; Waritz et al., 1996; Jefferies and French, 1972). These OC pesticides
have been previously identified in both alligator maternal tissues and egg yolk which
have been associated with alterations in alligator egg and embryo qualities as well as
hatchling growth among several contaminated lakes and reclaimed agricultural properties
in central Florida (Rauschenberger, 2004; Wiebe et al., 2002). TH regulation and
alterations in thyroid histology in relation to OC exposure have been primarily examined
utilizing pharmacological dosing methodologies. A consistent observation among several
controlled treatment studies was thyroid gland histological alterations consisting of
increases in overall thyroid weight, epithelial hyperplasia and colloid depletion in relation
to exposure by several PCBs and/or OC pesticides among several species (Fowles et al.,
1996; Jefferies and French, 1972; Jefferies and Parslow, 1972; Fregly et al., 1967).
Experimental Data
As thyroid hormones are an integral component in embryonic and hatchling
growth, the observed thyroidal alterations in relation to chlorinated hydrocarbon exposure
suggest the potential for subsequent growth alterations. O’Steen and Janzen (1999)
reported that plasma TH concentrations and resting metabolic rate in hatchling snapping
turtles (Chelydra serpentina) correlated with incubation temperature. As incubation
temperature is strongly linked with sex determination in many reptile species, compounds
that mimic or antagonize steroid hormones may affect metabolism, TH concentrations, or
growth rate (Willingham, 2001). Red Eared Slider (Trachemys elegans) eggs were
topically treated prior to the temperature-sensitive window of sex determination (Stage
17, from Yntema, 1968) with low, intermediate, and high concentrations of either trans-
Nonachlor and chlordane or p,p’-DDE (Willingham , 2001). Upon hatching, hatchling
turtles were fasted for 28 days and subsequently re-fed ad-libitum for 14 days
32
(Willingham, 2001). At the conclusion of a 28 day fast, the intermediate trans-Nonachlor
group significantly lost mass in comparison with controls (Willingham, 2001). Following
re-feeding, both the intermediate and high trans-Nonachlor groups significantly increased
in mass (Willingham, 2001). The author suggests that the reduction in mass observed in
several OC treatments may have elicited a temporal, hyperthyroid state in which yolk
reserves were utilized more quickly, thus reducing overall mass. As was observed in
Schew et al. (1996) following fasting and ad-libitum re-feeding, compensatory increases
in mass were observed in several trans-Nonaclor and p, p’-DDE treatment groups
(Willingham, 2001). Janz and Bellward (1996) examined in-ovo exposure of 2,3,7,8-
tetrachlorodibenzo-p-dioxin (TCDD) in precocial (chicken), semi-altricial (great blue
heron) and altricial (pigeon) species and subsequent alterations in growth and
development (Janz and Bellward, 1996). In both chickens and great blue herons, no effect
in plasma TH concentrations or hatchling growth and development was observed in
relation to TCDD exposure (Janz and Bellward, 1996). However, pigeons exposed to
TCDD demonstrated significant reductions in both plasma TH concentrations and
hatchling growth and development decreases including: crown-rump length, wing length,
and tibia length (Janz and Bellward, 1996). These data are reaffirmed by the established
temporal differences in TH maturation among precocial and altricial species (McNabb
2000, Olson et al., 1999). Hatchling Artic Glaucous Gulls (Larus hyperboreous) growth
was assessed in relation to parental bird serum OC concentrations over a three year
period (Bustnes et al., 2005). Adult female gulls with high OC burdens spent significantly
longer time periods in search of nutritional resources for their chicks (Bustnes et al.,
2005). In addition, a significant negative relationship was reported between chick growth

33
and increasing adult OC serum concentrations of HCB, oxychlordane, p,p’-DDE, and
several PCBs (Bustnes et al., 2005).. The author’s suggest that there may be interactions
between energy expenditure and different OC concentrations, and females with high OC
concentrations may have fewer resources available to provide for their chicks (Bustnes et
al., 2005). In addition, significant reductions in weight were observed in juvenile (~ 37
day old) Nile Tilapia (Oreochromis niloticus) exposed to aqueous dieldrin (1.0 to 2.4
µg/liter-1) for 30 days in comparison with controls (Lamai et al., 1999). Finally, Blanar et
al. (2005) noted that juvenile Artic Charr (Salvelinus alpinus) orally dosed (1x) with
toxaphene (10 µg/g) demonstrated decreased growth and overall body condition (k) as
well as decreased muscle lipid and protein content. These reports suggest the potential
direct (i.e., feeding, injection, aqueous OC exposure) and indirect (i.e., reduced parental
fitness due to OC exposure) influences that OC contaminants may have to influence
growth among several oviparous species.
These data suggest that OC exposure can elicit alterations in both thyroid function
and subsequent growth. Several field studies have reported severe alterations in both
plasma T4 concentrations and thyroid histology in relation to OC contaminated
environments among avian and several fish species (Rolland, 2000). In addition,
controlled treatment studies utilizing either p, p’ DDE, dieldrin, chlordane, or toxaphene
reported altered thyroid regulation and growth reduction. These data suggest that OC
exposure may be related to the observed reductions in alligator embryo and hatchling
growth from OC contaminated sites in central Florida (Rauschenberger, 2004; Wiebe et
al., 2001; Gross et al., 1994). In addition, several authors have reported modified alligator
thyroid function in relation to OC exposure (Hewitt et al., 2002; Crain et al., 1998). These

34
reported modifications have taken the forms of reductions in plasma T4 concentrations
and changes in thyroid histology compared with controls. However, researchers must be
keenly aware of both physiological (i.e., sex, age, nutritional availability, reproduction,
hibernation) and environmental factors (i.e., ambient and water temperatures and
photoperiod). These factors have been reported to vary thyroid regulation and may
complicate data interpretation regarding OC exposure and subsequent alterations in
thyroid function. Therefore, a captive study providing a controlled, structured
environment presents a more applicable means to test the relationship between OC
exposure and subsequent differences in hatchling thyroid function and growth.
Organochlorine Contaminant Exposure and Hatchling Alligator Growth
Wiebe et al. (2002) evaluated hatchling alligator thyroid regulation and growth
from several lakes in central Florida: lakes Apopka (high OC concentrations), Griffin
(Intermediate OC concentrations), and lake Lochloosa (Low OC concentrations) under
captive conditions for a period of 6 months. These experimental conditions included: a
restricted photoperiod (12D:12N), controlled ambient and water temperatures, ad-libitum
feeding twice a week, and restricted number of animals per enclosure to limit stressful
overcrowding. Though egg viability rates did not differ among sites, lake Apopka
hatchlings demonstrated a significantly higher growth rate and plasma T3 and T4
concentrations in comparison with lakes Griffin and Lochlooosa. These data suggest that
lake Apopka hatchlings demonstrated a hyperthyroid secretory pattern resulting in an
enhancement of hatchling growth in relation to exposure to high OC concentrations.
However, OC contaminants, due to their structural similarity with THs, have been
predominantly suggested to reduce TH systemic availability by competing for binding
proteins. These conflicting data suggest the need for further examination of thyroid

35
regulation among hatchling alligators exposed to OC contaminants. Specifically,
hatchlings from a site of similar OC contaminants and concentrations (i.e., Emerelda
Marsh Conservation Area) to lake Apopka should be utilized in a comparative growth
study. A comparison of hatchling thyroid regulation and growth among several sites with
high OC concentrations may provide further insight (i.e., OC exposure versus site-
specific variables) into the observed hyperthyroid secretory pattern and accelerated
growth rate observed in lake Apopka hatchlings. Therefore, a captive hatchling growth
study was undertaken utilizing animals from lakes Apopka, Griffin as well as Orange (a
site with low OC concentrations) and Emeralda Marsh Conservation Area (Area #7) to
assess if in-ovo exposure to high concentrations of OC contaminants elicits a
hyperthyroid secretory pattern that accelerates hatchling alligator growth. The following
hypotheses were tested by this study.
Hypothesis #1
Ho: No change in hatchling growth rates will be observed among all sites in relation to
high in-ovo OC contaminant exposure.
Ha: In-ovo exposure to high concentrations of OC pesticides will accelerate hatchling
alligator growth rates in comparison with animals exposed to intermediate to low in-ovo
OC concentrations.
Hypothesis # 2
Ho: No change in hatchling TH secretory pattern will be observed among all sites in
relation to high in-ovo OC contaminant exposure.

36
Ha: In-ovo exposure to high concentrations of OC contaminants will elicit a hyperthyroid
secretory pattern in hatchling alligators that will result in an accelerated growth rate in
comparison with animals exposed to intermediate to low in-ovo OC concentration

37
CHAPTER 2 MANUSCRIPT
Introduction
During the 1980’s, significant reductions in American Alligator (Alligator
mississippiensis) egg viability were observed on Lake Apopka (high OC concentrations)
in comparison with lake Woodruff, a national wildlife refuge (low OC concentrations)
(Woodward, 1993; Rice et al., 1998). In addition, a severe (~ 90%) reduction in the
juvenile alligator population was observed on Lake Apopka (1981-1986) that was likely
attributed to reproductive failure (Woodward, 1993). The observed reductions in juvenile
survivability and adult reproductive success have been attributed in part to the influence
of agriculture and anthropogenic alterations specifically: extensive utilization of
organochlorine pesticides by muck farming, citrus crops, and effluent discharges from
both the citrus processing plant and sewage treatment facility located at the city of Winter
Garden (Woodward et al., 1993; Schelske and Brezonik, 1992). These environmental
alterations were compounded by the overflow of a wastewater pond located at the Tower
Chemical facility, adjacent to the Gourd Neck region of Lake Apopka (1980), consisting
of high concentrations of sulfuric acid, DDT, dicofol and several unidentified OC
compounds. This event resulted in the EPA designation of this property as a superfund
site in 1983 (Rauschenberger, 2004). Though several of these OC compounds were
identified in yolk from alligator eggs, no clear association with reduced clutch viability
was observed for specific OC contaminants (Rauschenberger et al., 2004, Heinz et al.
1991). Therefore, sites that have been historically impacted by varying degrees of OC

38
contamination continue to demonstrate coincident alterations in reproductive function as
measured by sex steroid biomarkers, sexual differentiation, clutch viability, embryonic
mortality, post-hatch growth and survivability (Rauschenberger, 2004; Wiebe et al.,
2002; Guillettte et al., 1999; Gross et al. 1994).
Guillette (1995) suggested that many of the observed embryonic and post-natal
alterations in offspring viability are the result, in part, of parental exposure to
environmental contaminants. OC exposure has been reported to alter hormones that
control the course of growth and development and may have the potential to alter
differentiation of major organ systems resulting in physiological and morphological
changes (Rauschenberger et al., 2004; Wu et al., 2000; Guillette et al., 1995). Significant
alterations in alligator clutch viability and embryonic and post-hatch survivability have
been reported among sites of intermediate to high OC concentrations, suggesting an inter-
relationship between in-ovo OC exposure and subsequent reductions in embryonic and
hatchling survivability (Wiebe et al., 2001). The predominant exposure route for
developing offspring would be maternal transfer of OC contaminants among yolk
constituents (Rauschenberger et al., 2004; Wu et al., 2000). Rauschenberger (2004) noted
that eggs collected from OC contaminated sites had higher fecundity, lower average
clutch mass and reduced clutch viability in comparison with sites with low OC
contamination (Rauschenberger, 2004). The observed alterations in embryo morphology
appear to be in association with variation in OC contaminant burdens of eggs. In addition,
OC analyte composition was determined to be equally as important as concentration,
suggesting the importance of mixture composition (Rauschenberger, 2004). These data
demonstrate a need to better understand the physiological and/or chemically-induced

39
mechanisms that may effect alligator growth and development from OC contaminated
sites (Rauschenberger, 2004; Wiebe, 2001).
One of the principal regulators of growth and development among multiple
taxonomic groups are thyroid hormones (TH) which have been demonstrated to regulate
diverse physiological endpoints including: metabolic rate, tissue differentiation and
subsequent growth and development (Rousset and Dunn, 2004). Several literature
reviews have suggested that alterations in thyroid function may be in relation to exposure
to a variety of compounds including OC contaminants (Rolland, 2000; Brucker-Davis,
1998). Due to the structural similarities between THs and DDT, PCB’s and dioxins,
these chemicals may act as weak agonists that have the potential to reduce/block thyroid
hormone activity (Brucker-Davis, 1998; Porterfield, 1994). French and Jefferies (1972)
however, noted that pigeons fed low concentrations of p,p’-DDE and dieldrin induced
hyperthyroidism whereas higher doses of both OC contaminants caused hypothyroidism.
Therefore, thyroid regulation alterations due to OC contaminant exposure may have
contributed to the observed variation in alligator embryo and hatchling growth and
development.
American alligators (Alligator mississippiensis) have been considered a
particularly suitable indicator species as they have been shown to bio-accumulate and
biomagnify contaminants to levels equal to or greater than reported in birds and
mammals (Crain and Guillette, 1998). However, an understanding of alligator thyroid
function is limited as the principal data available is in relation to OC exposure
(Gunderson et al., 2002; Crain et al., 1998). Crain et al. (1998) noted a negative
relationship with both plasma T3 and T4 concentrations and body size among male and

40
female lake Woodruff (low OC) animals. However, a general lack of correlation between
plasma TH concentrations, sex and body size was observed in sub-adult alligators from
both lakes Apopka and Okeechobee (Crain et al., 1998). The author’s suggested that
these data may potentially reflect altered reproductive potential in these animals, as THs
cooperatively regulate the reproductive activities of vertebrates (Crain et al., 1998).
Gunderson et al. (2002) and Hewitt et al. (2002) reported significantly higher plasma T4
concentrations among sub-adult alligators exposed to intermediate OC contaminant
concentrations versus animals from either high and low OC environments. In addition,
the author’s observed no relationship between body size and plasma TH concentrations.
The author’s suggested that the observed reductions in plasma T4 concentrations from
animals located at the site of high OC contamination may be related to OC competition
with TH for binding proteins as well as elevation of UDP-GT enzymatic activity which
induces T4 glucuronidation and subsequent biliary TH excretion.
Alterations in thyroid regulation in relation to OC exposure have been reported to
cause reductions in growth. Red Eared Slider (Trachemys elegans) eggs topically treated
with trans-Nonachlor significantly lost mass in comparison with controls (Willingham,
2001). The author suggested that the reduction in mass may be the result of a temporal,
hyperthyroid state in which yolk reserves were utilized more quickly, thus reducing
overall mass. A significant negative relationship was reported between Artic Glaucous
Gull (Larus hyperboreous) hatchling growth chick and increasing adult OC serum
concentrations of HCB, oxychlordane, p,p’-DDE, and several PCBs (Bustnes et al.,
2005). Juvenile Nile Tilapia (Oreochromis niloticus) exposed to aqueous dieldrin for 30
days demonstrated significant reductions in weight in comparison with controls (Lamai et

41
al., 1999). In addition, Blanar et al. (2005) reported that juvenile Artic Charr (Salvelinus
alpinus) orally dosed with toxaphene demonstrated decreased growth and overall body
condition (k). These reports suggest the potential direct (i.e., feeding, injection, aqueous
OC exposure) and indirect (i.e., reduced parental fitness due to OC exposure) influences
that OC contaminants may have to influence growth among several oviparous species.
Several authors have reported altered alligator thyroid function in relation to OC
exposure (Hewitt et al., 2002; Crain et al., 1998). In addition, controlled treatment studies
utilizing several OC contaminants reported both modified thyroid regulation and
subsequent growth reductions. These data suggest that OC exposure may be related to the
observed reductions in alligator embryo and hatchling growth from OC contaminated
sites in central Florida (Rauschenberger, 2004; Wiebe et al., 2001; Gross et al., 1994).
However, researchers must be keenly aware of both physiological (i.e., sex, age,
nutritional availability, reproduction, hibernation) and environmental factors (i.e.,
ambient and water temperatures and photoperiod) which have been reported to alter
thyroid regulation and may complicate data interpretation regarding OC exposure and
subsequent alterations in thyroid function. Therefore, a captive study providing a
controlled, structured environment presents a more applicable means to test the
relationship between OC exposure and subsequent alterations in hatchling thyroid
function and growth.
Wiebe et al. (2002) evaluated hatchling alligator thyroid regulation and growth
from lakes Apopka, Griffin, and Lochloosa under captive conditions for a period of 6
months. These experimental conditions included: a restricted photoperiod (12D:12N),
controlled ambient and water temperatures, ad-libitum feeding twice a week, and
42
restricted number of animals per enclosure. Egg viability rates did not differ among sites.
However, lake Apopka hatchlings demonstrated a significantly higher growth rate and
plasma TH concentrations in comparison with lakes Griffin and Lochlooosa. These data
suggest that lake Apopka hatchlings demonstrated a hyperthyroid secretory pattern
resulting in enhanced hatchling growth in relation to exposure to high OC concentrations.
OC contaminants, due to their structural similarity with THs, have been predominantly
suggested to reduce TH systemic availability by competing for binding proteins.
Therefore, these conflicting data suggest a need to compare hatchling thyroid regulation
and growth among several sites with high OC concentrations to provide further insight
(i.e., OC exposure versus site-specific variables) into the observed hyperthyroid secretory
pattern and accelerated growth rate observed in lake Apopka hatchlings. Therefore, a
captive hatchling growth study was undertaken utilizing animals from lakes Apopka and
Griffin as well as lake Orange (a site of low OC concentrations) and Emerelda Marsh
Conservation Area (Area #7) (a site of high OC concentrations) to assess if in-ovo
exposure to high concentrations of OC contaminants elicits a hyperthyroid secretory
pattern that accelerates hatchling alligator growth.
Materials and Methods
Egg Collection, Evaluation and Incubation
Clutches (n=10/site) were collected from lakes Apopka (N 28° 35’, W 81° 39’),
Griffin (N 28° 53’, W 81° 46’), and Orange (N 29° 30’, W 82° 13’) as well as Emerelda
Marsh Conservation Area (Area # 7)(N 28° 55’, W 81° 47’). Nests were located by
aerial (helicopter) and ground (airboat) surveys. Clutches were collected and transported
in their original nesting substrate. To provide proper positioning for subsequent artificial
incubation, a black mark was placed on top of each egg to indicate the original egg

43
orientation in the nest. Eggs were evaluated utilizing a bright light candling procedure
(Lyon Electric, Chula Vista, CA, USA) in order to observe the presence/absence of a
calcium rich band (an indicator of developing embryos) encircling the midsection of each
egg. Each clutch was evaluated by the following measures: 1) clutch weight (Kg), 2)
fecundity (total number of eggs in clutch), 3) number of banded eggs (number of
currently viable eggs in clutch), 4) number of unbanded eggs (number of eggs with no
band which represents early embryonic mortality or lack of fertilization), and 5) number
of damaged eggs (eggs that were cracked and leaking due to nest predators or collection
error). Yolk was collected from one viable egg per clutch to assess clutch age (Ferguson,
1985) as well as identify and quantify lipophilic OC pesticide concentrations. Following
the initial clutch evaluation, the remaining banded, viable eggs from each clutch were
transferred to an incubation pan (18.5” x 14” x 7”) containing moist sphagnum moss
substrate. Clutches were maintained in an artificial incubation building (13’ x 11’ x 7.5’)
at ambient temperatures of 31.5º C ± 1º C and ≈95% relative humidity. Individual clutch
viability (total number of hatchlings / total number of eggs collected) was assessed at the
completion of hatching. Upon hatching, external morphometrics including: total length
(mm), snout-vent length (mm), and head length (mm) (Wildlife Supply Co., Saginaw,
MI, USA; Mitutoya Calipers, Japan) and weight (g) (Ohaus, Inc., Pine Brook, NJ, USA)
were collected on each animal. In addition, a unique Monel ® web tag (National Band
and Tag Co., Newport, KY, USA) was provided to allow for individual animal
identification.
Clutch Selection
Three to five clutches per site were selected, based upon specific selection criteria
for this study. Clutch selection criteria included: 1) The clutch must have at least 15

44
hatchlings (as per the sample numbers required to satisfy the goals of the study), and 2)
Clutches were selected based on site mean yolk OC pesticide concentrations among the
four principal OCs (p,p’-DDE, dieldrin, chlordane, toxaphene) (as variance in OC
concentrations among sites limits the ability to test the direct effects of OCs on hatchling
alligator growth). Hatchlings (n=15) were randomly selected from each study-related
clutch. Prior to the studies onset, hatchlings (n=3/clutch) from all sites were sacrificed in
order to establish baseline values of free and total T4 plasma concentrations, thyroid
weight (g) (a suggested indicator of thyroid activity), and liver weight (g) (a suggested
indicator of extrathyroidal conversions of THs) (McNabb, 2004; Zhou et al., 1999). All
remaining animals selected for this study received a corresponding microchip (Biomark,
Inc., Boise, ID, USA) at the base of the tail utilizing a trocar delivery system.
Animal Maintenance
Hatchlings (n=12) per clutch were maintained for a period of eight months. Each
clutch was housed in a fiberglass tank (4’ x 2’ x 2’) (Rowland Fiberglass, Ingleside, TX,
USA) with an aquarium heater and heat lamp to maintain uniform ambient and water
temperatures. All clutches were fed a commercial alligator diet (Burris Mill and Feed,
Franklinton, LA, USA) ad libitum twice a week.
Hatchling Morphometrics and Tissue Sampling
Hatchlings were measured once a month for a period of eight months. These
measurements include: total length (mm), snout-vent length (mm), head length (mm)
SVL, and weight (g). In addition, a 1.5 mL blood sample was taken from the cranial
sinus. Whole blood was centrifuged at 1000 x g for 10 minutes. Plasma was aliquoted
into several cryogenic vials (2 mL) and frozen at -80º C. Following the initial sampling
date (Oct 2004), a subset of hatchlings (n=3 / clutch) from all sites were sacrificed on a
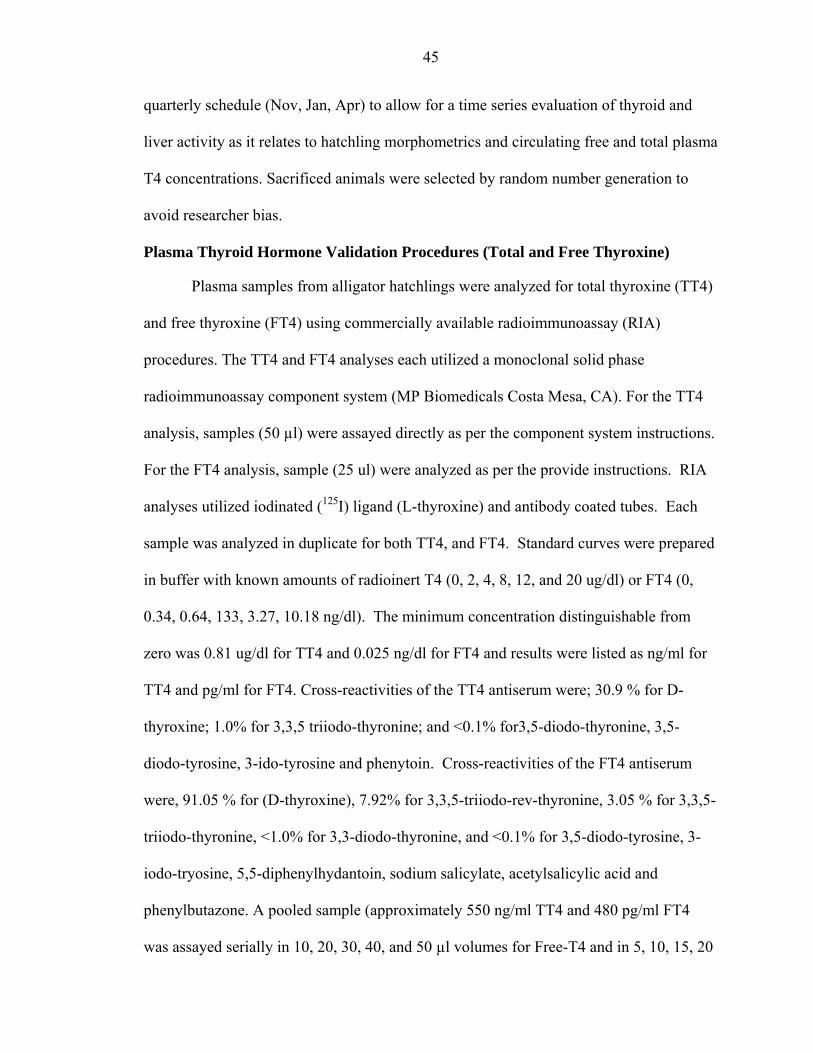
45
quarterly schedule (Nov, Jan, Apr) to allow for a time series evaluation of thyroid and
liver activity as it relates to hatchling morphometrics and circulating free and total plasma
T4 concentrations. Sacrificed animals were selected by random number generation to
avoid researcher bias.
Plasma Thyroid Hormone Validation Procedures (Total and Free Thyroxine)
Plasma samples from alligator hatchlings were analyzed for total thyroxine (TT4)
and free thyroxine (FT4) using commercially available radioimmunoassay (RIA)
procedures. The TT4 and FT4 analyses each utilized a monoclonal solid phase
radioimmunoassay component system (MP Biomedicals Costa Mesa, CA). For the TT4
analysis, samples (50 µl) were assayed directly as per the component system instructions.
For the FT4 analysis, sample (25 ul) were analyzed as per the provide instructions. RIA
analyses utilized iodinated (125I) ligand (L-thyroxine) and antibody coated tubes. Each
sample was analyzed in duplicate for both TT4, and FT4. Standard curves were prepared
in buffer with known amounts of radioinert T4 (0, 2, 4, 8, 12, and 20 ug/dl) or FT4 (0,
0.34, 0.64, 133, 3.27, 10.18 ng/dl). The minimum concentration distinguishable from
zero was 0.81 ug/dl for TT4 and 0.025 ng/dl for FT4 and results were listed as ng/ml for
TT4 and pg/ml for FT4. Cross-reactivities of the TT4 antiserum were; 30.9 % for D-
thyroxine; 1.0% for 3,3,5 triiodo-thyronine; and <0.1% for3,5-diodo-thyronine, 3,5-
diodo-tyrosine, 3-ido-tyrosine and phenytoin. Cross-reactivities of the FT4 antiserum
were, 91.05 % for (D-thyroxine), 7.92% for 3,3,5-triiodo-rev-thyronine, 3.05 % for 3,3,5-
triiodo-thyronine, <1.0% for 3,3-diodo-thyronine, and <0.1% for 3,5-diodo-tyrosine, 3-
iodo-tryosine, 5,5-diphenylhydantoin, sodium salicylate, acetylsalicylic acid and
phenylbutazone. A pooled sample (approximately 550 ng/ml TT4 and 480 pg/ml FT4
was assayed serially in 10, 20, 30, 40, and 50 µl volumes for Free-T4 and in 5, 10, 15, 20

46
and 25 ul volumes for TT4. The resulting inhibition curves were parallel to the respective
standard curve, with the tests for homogeneity of regression indicating that the curves did
not differ. Further characterization of the assays involved measurement of known
amounts (0, 2, 4, 8, 12, and 20 ug/dl) of TT4 in 25ul plasma or (0, 0.34, 0.64, 133, 3.27,
10.18 ng/dl) of TT4 in 50 of plasma. For TT4, mass recoveries were estimated as:
Y=0.16 + 0.97X, R2=0.9018; and for free-T4: Y= 0.015 + 0.96X, R2=0.8814 (Y=
amount of TT4, FT4 measured; X= amount ofTT4, FT4 added). Interassay and intrassay
coefficients of variation were 9.2 and 8.7 % respectively for plasma TT4, and 10.3 and
8.7% respectively for plasma FT4.
Free T4 (FT4) Assay Procedures
FT4 (representing <1% of available T4) is considered the most biologically
available form of thyroxine for cellular interaction. Plasma (50µL in duplicate) was added
to solid-phase coated count tubes (MP Biomedicals, Costa Mesa, CA). 1.0 mL of 125I free
T4 tracer was added to each tube. Tubes were vortexed (< 10 seconds) and incubated in
an IR-Autoflow C02 water-jacketed incubator (Nuare, Plymouth, MA, USA) at 37 ± 1º C
for a period of 90 minutes. Contents of tubes were decanted and 1 mL of distilled water
was added / decanted to rinse each tube. Tubes were counted on a LKB-Wallac 1282
CompuGamma gamma counter (PerkinElmer, Boston, MA, USA).
Total T4 (TT4) Assay Procedures
TT4 (representing >99% of available T4) is reversibly associated with several
binding proteins including transthyretin, thyroglobulin, and albumen. Plasma (25µL in
duplicate) was added to solid-phase coated count tubes (MP Biomedicals, Costa Mesa,
CA). 1.0 mL of 125I total T4 tracer was added to each tube. Tubes were vortexed (< 10
seconds) and incubated at room temperature (18 to 25º C) for a period of 60 minutes.

47
Contents of tubes were decanted and counted on a LKB-Wallac 1282 CompuGamma
gamma counter (PerkinElmer, Boston, MA, USA).
Analysis of Chlorinated Analytes from Alligator Egg Yolks
Analytical grade standards for the following compounds were purchased from the
sources indicated: aldrin, α-BHC, β-BHC, lindane, δ-BHC, p,p’-DDD, p,p’-DDE, p,p’-
DDT, dieldrin, endosulfan, endosulfan II, endosulfan sulfate, endrin, endrin aldehyde,
endrin ketone, heptachlor, heptachlor epoxide, hexachlorobenzene, kepone,
methoxychlor, mirex, cis-nonachlor, and trans-nonachlor from Ultra Scientific
(Kingstown, RI); cis-chlordane, and trans-chlordane from Supelco (Bellefonte, PA);
oxychlordane from Chem Service, Inc. (West Chester, PA); o,p’-DDD, o,p’-DDE, o,p’-
DDT from Accustandard (New Haven, CT); and toxaphene from Restek Corp.
(Bellefonte, PA). All reagents were analytical grade unless otherwise indicated. Water
was doubly distilled and deionized.
Alligator egg yolk samples were analyzed for OCP content using methods modified
from Holstege et al. [1] and Schenck et al. [2]. For extraction, a 2-g tissue sample was
homogenized with ~1 g of sodium sulfate and 8 mL of ethyl acetate. The supernatant
was decanted and filtered though a Büchner funnel lined with Whatman #4 filter paper
and filled to a depth of 1.25 cm with sodium sulfate. The homogenate was extracted
twice with the filtrates collected together. The combined filtrate was first concentrated to
a volume of ~2 mL by rotary evaporation, then further concentrated until solvent-free
under a stream of dry nitrogen. The residue was reconstituted in 2 mL of acetonitrile.
After vortexing (30 s) the supernatant was applied to a C18 SPE cartridge (pre-
conditioned with 3 mL of acetonitrile; Agilent Technologies, Wilmington, DE) and was
allowed to pass under gravity. This procedure was repeated twice with the combined

48
eluent collected in a culture tube. After the last addition, the cartridge was rinsed with 1
mL of acetonitrile which was also collected. The sample was then applied to a 0.5 g NH2
SPE cartridge (Varian, Inc., Harbor City, CA), was allowed to pass under gravity, and
was collected in a graduated conical tube. The cartridge was rinsed with an additional 1
mL portion of acetonitrile which was also collected. The combined eluents were
concentrated under a stream of dry nitrogen to a volume of 300 µL and transferred to a
GC vial for analysis.
Analysis of the samples was performed using a Hewlett Packard HP-6890 gas
chromatograph (Wilmington, DE) with split/splitless inlet operated in splitless mode. The
analytes were introduced in a 1 µL injection and separated across the HP-5MS column
(30 m x 0.25 mm; 0.25 µm film thickness; J & W Scientific, Inc., Folsom, CA) under a
temperature program that began at 60º C, increased at 10º C/min to 270º C, was held for
5 min, then increased at 25º C/min to 300º C and was held for 5 min. Detection utilized
an HP 5973 mass spectrometer in electron impact mode. Identification for all analytes
and quantitation for toxaphene, was conducted in full scan mode, where all ions are
monitored. To improve sensitivity, selected ion monitoring was used for the quantitation
for all other analytes, except kepone. The above program was used as a screening tool
for kepone which does not optimally extract with most organochlorines. Samples found
to contain kepone would be reextracted and analyzed specifically for this compound.
For quantitation, a five-point standard curve was prepared for each analyte (R2 ≥
0.995). Fresh curves were analyzed with each set of twenty samples. Each standard and
sample was fortified to contain a deuterated internal standard, 5 µL of US-108 (120
µg/mL; Ultra Scientific), added just prior to analysis. All samples also contained a

49
surrogate, 2 µg/mL of tetrachloroxylene (Ultra Scientific) added at homogenization.
Duplicate quality control samples were prepared and analyzed with every twenty samples
(typically at a level of 1.00 or 2.50 µg/mL of γ-BHC, heptachlor, aldrin, dieldrin, endrin,
and p,p’-DDT) with an acceptable recovery ranging from 70 – 130%. Repeated analyses
were conducted as allowed by matrix interferences and sample availability.
Statistics
Initial RIA data was analyzed and fit four parameters logistic curve utilizing
Beckman EIA/RIA ImmunoFit software (Fullerton, CA). All statistics were performed on
SAS version 9.1 for windows (SAS Institute, Inc., Cary, NC, USA). PROC GLM
procedures including Tukey multiple comparison analysis was utilized to detect
differences (p < .05) among hatchling external morphometrics, plasma thyroid hormone
concentrations and OC contaminant concentrations between and within sites. Correlative
analysis among growth rates, plasma thyroid hormone concentration rates and OC
contaminated concentrations was performed with PROC REG procedures (p < .05).
Differences in thyroid and liver somatic indices were analyzed by the Wilcoxon Rank
Sum Test in which the Kruskal-Wallis Test was utilized to determine significant
differences among and within sites (p< .05).
Results
Clutch and Organochlorine Contaminant Parameters
Clutches (n=40) were collected from lakes Apopka (n=10), Griffin (n=10),
Orange (n=12) and Emerelda Marsh Conservation Area (n=8). Two principal clutch
parameters were utilized to select clutches for the current study: fecundity and viability.
A summary of all clutches collected demonstrated site differences among both clutch
fecundity and viability (p < .05) (Fig. 2-2). In specific, lake Apopka clutches had

50
significantly reduced clutch viability in comparison with the remaining sites. Selected
clutches for the current study demonstrated similar trends in clutch fecundity (p < .05)
(Fig. 2-3). However, no differences were observed in clutch viability between sites for
these select clutches (Fig. 2-4). Hatchling OC (specifically: total chlordane, total DDE,
dieldrin, and toxaphene) exposure was determined from a representative yolk sample per
clutch. Total OC concentrations per site (i.e., all clutches and growth clutches)
concentrations were distributed as follows: (EM>AP>GR>OR) (Fig. 2-4).
Hatchling Growth Rates
Hatchling growth morphometrics were monitored monthly for a period of eight
months. Multiple comparative analyses among sites demonstrated that lake Griffin
hatchlings grew significantly larger in total length, snout-vent length, head length and
weight (Fig. 2-5) (p < .05). Clutches within each site demonstrated similar trends in total
length (Fig. 2-6), snout-vent length (Fig. 2-7), head length (Fig. 2-8), and weight (Fig. 2-
9). Hatchlings (n=3/clutch/site) sacrificed on a quarterly schedule to compare thyroid and
liver weights to growth over time demonstrated similar trends among (Figs. 2-10) and
within sites in total length (Fig. 2-11), snout-vent length (Fig. 2-12), head length (Fig. 2-
13), weight (Fig. 2-14), thyroid weight (Fig. 2-15), and liver weight (Fig. 2-16) (p < .05).
No differences were observed in thyroid somatic indices among sites (Table 2-5).
However, significant temporal differences were observed in thyroid somatic indices
within sites (p< .05) (Table 2-6) Liver somatic indices demonstrated several temporal
significant differences among and within sites (p < .05) (Tables 2-5 and 2-7).
Mean growth rates were tabulated among and within sites to examine hatchling
growth per day including: total length/day (Table 2-1), snout-vent length/day (Table 2-2),
head length/day (Table 2-3) and weight/day (Table 2-4). Multiple comparative analyses

51
of growth rates among clutches demonstrated several significant differences among total
length, snout-vent length and head length rates (p < .05). However, analysis of growth
rates among sites again demonstrated that lake Griffin hatchlings grew larger than the
other sites (p < .05). A correlative analysis in which all clutches were independent of site
demonstrated no differences in growth rates among all sampling dates (p < .05). These
data present several isolated differences in growth rates within clutches which can
potentially be attributed to inter-clutch variability. The dominant inference taken from
both correlative and multiple comparative analyses continues to indicate no significant
differences in hatchling growth among sites.
Thyroid Hormones, Growth and Organochlorine Contaminants
Thyroid hormones (specifically: total (TT4) and free (FT4) thyroxine) were
utilized as bio-indicators of hatchling alligator growth. Multiple comparison analysis of
plasma TT4 concentrations over time demonstrated an asynchronous secretory pattern
among (Fig. 17) and within sites (Figs. 18). Similarly, plasma FT4 concentrations over
time demonstrated an asynchronous secretory pattern among (Fig. 17) and within sites
(Fig. 19). No significant alterations in either TT4 or FT4 plasma concentrations were
observed over the eight month sampling period. In addition, no paired relationship was
observed among either growth rates or any growth parameter during specific sampling
dates and plasma thyroid hormone concentrations. However, a review of monthly mean
hatchling growth parameters and plasma thyroid hormone concentration distributions
demonstrate a temporal relationship between TH secretion and subsequent hatchling
growth.
Modifications in growth and plasma thyroid hormone concentrations have been
reported in association with OC contaminant exposure among several species (Bustnes et

52
al., 2005, Willingham, 2001). To examine the potential interactive nature of these
experimental variables, a correlative analysis was performed utilizing hatchling growth
rates, thyroid hormone rates and the four principal OC contaminants (i.e., total chlordane,
total DDE, dieldrin and toxaphene). No significant correlative relationships were
observed (Table 2-8).
Discussion
The objective of the current study was to determine if in-ovo exposure to high
concentrations of OC contaminants elicits a hyperthyroid secretory pattern that
accelerates hatchling alligator growth. This assessment was based on several reports
indicating both alterations in thyroid function and/or subsequent growth in relation to OC
exposure under field and experimental conditions. Rauschenberger (2004) reported
alterations in embryonic alligator growth and development in relation to maternal OC
exposure. In addition, several reports have related OC exposure to modified alligator
thyroid histological parameters and regulation (Gunderson et al., 2002; Hewitt et al.,
2002; Crain et al., 1998). Wiebe et al., (2002) reported both hyperthyroid secretory
patterns of THs and subsequent accelerated growth among hatchlings from high OC
contaminated environments. In addition, controlled treatment studies utilizing OC
contaminants (i.e., total chlordane, total DDE, dieldrin, and toxaphene) demonstrated
altered growth in relation to OC contaminant exposure (Blanar et al., 2005; Bustnes et al.,
2005; Willingham, 2001; Lamai et al., 1999). These combined data suggest an inter-
relation between OC exposure and modification of growth and growth-regulating factors
such as thyroid hormones. However, the current study demonstrated no significant
differences in hatchling alligator thyroid regulation or growth rates in relation to in-ovo
OC exposure. Results of the current study may be attributed to the 1) inability to utilize

53
clutches with low viability, 2) additional growth-regulating product(s) other than or
integrated with THs that regulate hatchling alligator growth, or 3) non-OC contaminant
influences including: maternal size and/or habitat and nutritional quality.
Reduced alligator clutch viability has been reported within sites of intermediate to
high concentrations of OC contaminants in central Florida (Rauschenberger, 2004; Gross,
1994). These data demonstrate growth retardation and subsequent mortality during both
early and late embryonic development, and among hatchlings from high OC
environments. However, low viability clutches were excluded from the current study due
to clutch selection requirements: study clutches required at least fifteen hatchlings in
order to test the current studies hypothesis. The elimination of these clutches from the
current study likely removed hatchlings with an increased potential to demonstrate
irregularities in growth and developmental regulation in relation to OCs and/or additional
environmental stressors. Though differences in OC contaminant concentrations were
observed (p<.05), clutches utilized in the current study demonstrated no significant
differences in viability between sites.
Several authors have reported alterations in alligator thyroid regulation in relation
to OC contaminant exposure (Gunderson et al., 2002; Hewitt et al., 2002; Crain, 1998). In
addition, these reports stated that alligators from OC contaminated environments
demonstrated a general lack of correlation between plasma TH concentrations, sex and
body size. However, these studies were not able to eliminate several physiological and
environmental factors (i.e., age, sex, photoperiod, water and ambient temperatures and
food availability) reported to influence thyroid regulation. In addition, these studies
examined the relationship between OC contaminant exposure and hatchling growth as

54
well as plasma TH concentrations utilizing a single point in time sampling procedure. As
thyroid hormones have been reported to have a pulsatile secretory pattern, multiple
sampling over time would appear to be pertinent when trying to relate plasma TH
concentrations and growth to the hyper-variable influences of environmental contaminant
exposure. Wiebe et al. (2002) correlated both plasma T3 and T4 concentrations with
growth over time among hatchling alligators from sites of varying OC contamination
under captive conditions. To more directly examine the relationship between OC
exposure and alterations in hatchling growth and thyroid regulation, captive conditions
were designed to limit the influence of physiological and environmental influences on
thyroid regulation. These conditions included: 12L:12D photoperiod; constant ambient
and water temperatures; restricted pod size to avoid stressful overcrowding; documented
hatchling age; and ad-libitum food availability. Results from the 2002 study demonstrated
that hatchlings from high OC environments demonstrated a hyperthyroid TH secretory
pattern and accelerated growth. Utilizing the comparable captive conditions, a temporal
relationship between plasma TH concentrations and hatchling alligator growth was
observed over time in the current study. Additionally, thyroid and liver weights as well as
liver somatic indices were found to be representative biomarkers of hatchling growth
among and within sites over time. However, no relationship was observed between OC
exposure and hatchling alligator growth rates or plasma thyroid hormone concentrations
among or within sites over time. Therefore, future research may require examination of
additional growth regulating endocrine pathways when assessing the potential influence
of OC contaminant exposure on hatchling alligator growth regulation.

55
These conflicting data suggest that THs may not be the principal growth
regulating hormone influenced by OC contaminant exposure. McNabb (2000) noted that
THs act permissively or indirectly, in concert with the principal growth regulators:
growth hormone (GH) and insulin-like growth factor I (IGF-I). In addition, THs have
been reported to participate in highly integrated growth regulation among both
somatotropic and corticotropic axis’ (Kühn et al., 2005, Kobel et al., 2001, Elsey et al.,
1990).
Growth hormone (GH) is an essential regulator of growth with complex
metabolic functions (Bjöornsson et al., 2002). Pituitary GH secretion reported to be under
the dual control by two neuropeptides from the hypothalamus: GH releasing hormone
(GHRH) which stimulates GH release and somatostatin (SRIH) which has an inhibitory
action (Renaville et al., 2002). However, plasma GH concentrations have been
demonstrated to be influenced by a variety of hormones, growth factors, and
environmental influences (Fig. 2-20). The anabolic and growth–promoting effects of GH
are to a large extent mediated by the stimulation and expression of insulin-like growth
factor I (IGF-I) in the liver and peripheral tissues (Sjögren et al., 1999). The interactive
(i.e., local and systemic) regulation demonstrated between GH and IGF-I is known as the
“dual effector theory of action.” (Bjöornsson et al., 2002). Several reports have examined
plasma IGF-I concentrations among reptilian models (Guillette et al., 1996, Crain et al.,
1995, Crain et al., 1995). These reports indicated that increased plasma IGF-I
concentrations were coincident with egg formation as oviparous species must
compartmentalize growth-promoting substances and nutrients into the yolk and albumen
of eggs (Guillette et al., 1996). In addition to IGF-I, maternal transfer of growth-

56
regulating substances (i.e., GH, TH) appears to be critical for embryo development with
implications on future hatchling growth and survival (Greenblatt et al., 1989). Therefore,
maternal quality, which encapsulates animal health in relation to exposure to
environmental stressors including OCs, continues to appear to be a dominant regulatory
factor in clutch growth and survival.
OC contaminant exposure has been reported to influence reproductive and
developmental parameters among adult and juvenile alligators (Rauschenberger et al.,
2004, Gross et al., 1994). These data suggest an integrated relationship between adult
alligator exposure to multiple environmental stressors (i.e., OCs, water quality,
nutritional quality) and subsequent alterations in clutch and hatchling quality. Under
captive conditions, the current study demonstrated that THs may serve as indicators of
hatchling alligator growth utilizing multiple sampling procedures over time. However, no
relationship was observed between OC exposure and hatchling alligator growth and
thyroid regulation in the current study. These data suggest that THs may not represent the
principal endocrine pathway affected by OC contaminant exposure. Therefore, the null
hypothesis which states that there will be no effects of in-ovo OC exposure on hatchling
alligator growth or thyroid regulation must be accepted. Future research efforts
examining the relationship between hatchling alligator growth and OC exposure should
incorporate an integrated evaluation of multiple endocrine pathways (i.e., GH, IGF-I, TH,
corticoids), utilize multiple sampling techniques over time, and, when possible, limit the
influence of reported physiological and environmental parameters on growth regulation
(Scollon et al., 2004).

57
In addition to OC exposure, anthropogenic habitat modifications have been
suggested as potential influential factors in the observed modifications in alligator
reproductive and growth parameters among OC contaminated sites. Schelske et al. (2005)
provides details a chronology of habitat modification in the upper Ocklawaha river basin
including: construction of the Beauclair canal and extensive levee systems, extensive
citrus and muck farming operations, as well as municipal sewage discharge. These habitat
modifications and the subsequent “back pumping” of phosphorous from muck farming
operations is credited with creating marginal habitat with an extensive changes of both
flora and fauna among this river system (Schelske et al., 2005). Several reports have
investigated the influence(s) of habitat modification and other non-OC related influences
on alligator clutch viability among OC contaminated sites. Rauschenberger (2004)
examined the incidence of alligator nutritional deficiencies specifically: thiamine
(Vitamin B1) deficiency, which has been suggested to increase embryonic mortality in
relation to OC contaminant exposure. Results from clutches collected from OC
contaminated environments demonstrated that thiamine deficiency may be involved in
decreased clutch viability. In addition, Mason (1995) suggested that changes in available
nesting vegetation had the potential to reduce alligator clutch viability through reduction
in insulation as well as inappropriate moisture content. Though alterations in alligator
reproductive and growth quality have been associated with OC contaminant exposure, the
tremendous influence of habitat modifications (i.e., habitat quality, water quality, non-
indigenous species) on alligator growth, reproduction and survival should not be
discounted.

58
Though no significant differences were observed in hatchling alligator growth or
thyroid regulation in relation to in-ovo OC exposure, these data do not discount the
potential for growth alterations among wild alligator populations in OC contaminated
environments. Significant variability in alligator reproductive and growth regulation
continues to be observed in relation to OC contaminated environments (Rauschenberger,
2004, Guillette et al., 1999, Gross et al., 1994). These data include: 1) gonadal
modifications such as: altered plasma sex steroid concentrations and histological
abnormalities, 2) increased fecundity 3) increased incidence of early and late embryonic
mortality, as well as 4) growth disparities between and within OC contaminated sites
versus control sites. In order to better relate the observed reductions in alligator
reproductive and clutch qualities to OC exposure, Rauschenberger et al. (2004) orally
dosed captive adult alligators in reproductive groups (1 male:1 female) with an eco-
relevant OC contaminant mixture. This experimental mixture was representative of OC
isoforms concentrations analytically identified among yolks from OC environments in
central Florida. Experimental clutches demonstrated comparable reductions in clutch
viability specifically: increased incidence of early embryonic mortality, which has been
observed in wild clutches from OC environments.
Data from the current study demonstrates that THs can be utilized as a
bioindicator of hatchling alligator growth under captive conditions. Therefore,
experimental control of established physiological and environmental influences on
thyroid regulation allowed for a more through examination of not only hatchling alligator
growth but, the potential inter-relation between OC contaminant exposure and subsequent
growth and thyroid regulation. These data represent a more direct examination of the

59
inter-relationship between OC exposure and altered hatchling alligator growth and
thyroid regulation. Though previous work reported a hyperthyroid secretory pattern and
accelerated growth in hatchling alligators from high OC environments, the current study
demonstrated no relationship between OC exposure and subsequent alterations in growth
or thyroid regulation(Table 2-8). These data suggest that hatchling alligator growth is
regulated by an integrated endocrine network (i.e., GH, IGF-I, corticoids) in which THs
may not be the principal regulatory agent. In addition, the inability to utilize clutches of
lower viability from OC contaminated sites may have restricted the incidence of
observing growth and developmental alterations.
Alligator reproductive and growth alterations continue to be reported in
association with OC contaminated sites. Previous data reported hyperthyroid secretory
patterns and accelerated hatchling alligator growth in association with high OC
contaminants. However, no relationship was observed between OC contaminant exposure
and hatchling growth or thyroid regulation in the current study. Though THs were
deemed useful for monitoring hatchling alligator growth, they do not appear to be the
principal growth regulatory factor. Future examination of both individual as well as
integrated regulatory relationships between growth-regulating hormones / growth factors
(i.e., GH, IGF-I, TH, corticoids) may prove more useful when trying to relate OC
contaminant exposure to observed alterations in alligator growth. In conclusion, there has
been a singular focus in associating the observed reductions in alligator reproductive and
growth parameters with OC contaminant exposure. However, the significant influence(s)
of environmental factors (i.e., habitat modification as well as water and nutritional

60
quality) should not be discounted when evaluating alligator physiology in relation to OC
contaminant exposure.

61
Figure 2-1.Graphical interpretation of thyroid hormone biosynthesis. Taken from
www.neurosci.pharm.otoledo.edu/MBC3320/thyroid.htm. (11/04/05).

62
Figure 2-2. Clutch fecundity and clutch viability (site means). Significant differences
among sites were determined by Tukey Multiple Comparison Analysis (p <.05).
Viability
GR OR EM AP
(%)
0
20
40
60
80
100
a
a a
b
Fecundity
GR OR EM AP0
10
20
30
40
50
60
a
b a a

63
Figure 2-3. Clutch fecundity and clutch viability (current study). Significant differences
among sites were determined by Tukey Multiple Comparison Analysis (p <.05).
Viability
GR OR EM AP
(%)
0
20
40
60
80
100
aa a
a
Fecundity
GR OR EM AP0
10
20
30
40
50
60
a
b a a
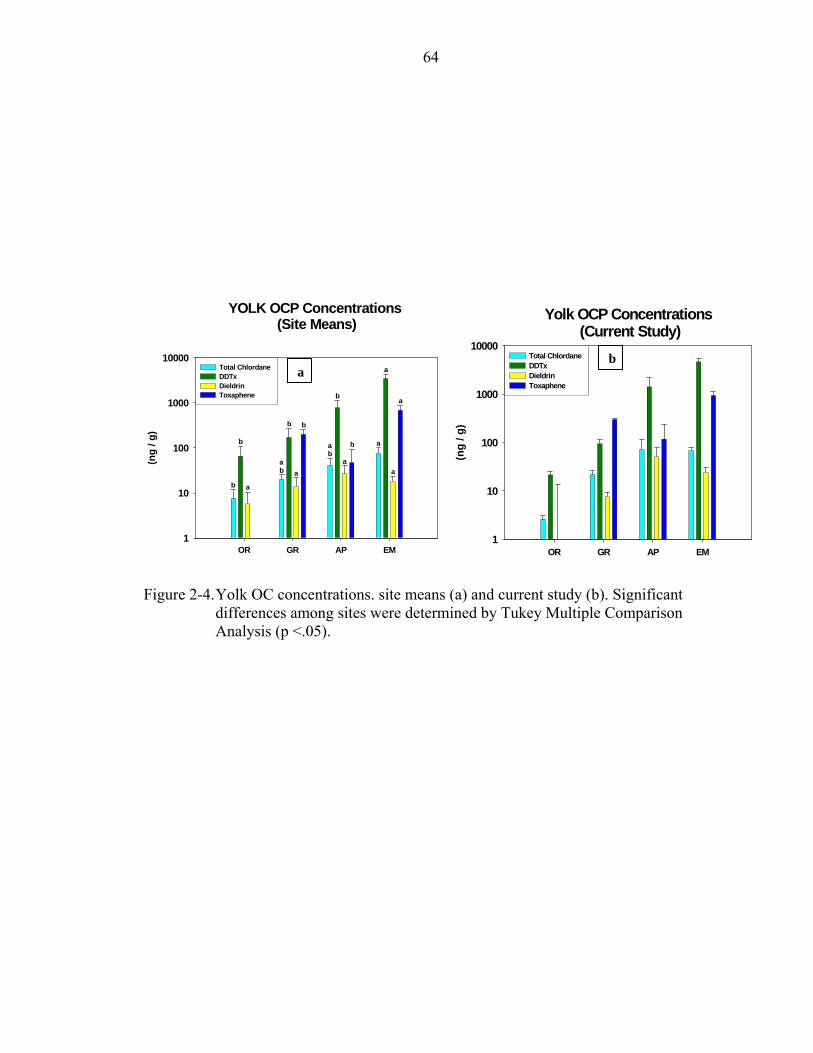
64
Figure 2-4. Yolk OC concentrations. site means (a) and current study (b). Significant
differences among sites were determined by Tukey Multiple Comparison Analysis (p <.05).
YOLK OCP Concentrations (Site Means)
OR GR AP EM
(ng
/ g)
1
10
100
1000
10000Total Chlordane DDTx Dieldrin Toxaphene
a
ab
ab
b
a
b
b
b
aa
a
a
a
b
b
Yolk OCP Concentrations (Current Study)
OR GR AP EM
(ng
/ g)
1
10
100
1000
10000Total Chlordane DDTx Dieldrin Toxaphene
a b

65
Figure 2-5. Hatchling alligator growth parameters among sites over time. Significant
differences among sites were determined by Tukey Multiple Comparison Analysis(p < .05).
Total Length
S ept O ct N ov D ec Jan Feb M ar A pr M ay
TL (m
m)
0
100
200
300
400
500
600G R O RE MAP
a a aaa
ab bb
a b b b
a ab b b
a ab b b
a ab b b
a ab a
b b
a ab b b
a ab
abb
Head
Sept O ct Nov Dec Jan Feb M ar Apr M ay
Hea
d (m
m)
0
20
40
60
80G RO RE MAP
aa a a
a bb ba b bb
a bb b
a bb b
a ab
abb
a ab b b
a ab b
ab
a ab b
ab
W eight
S ept O ct N ov D ec Jan Feb M ar A pr M ay
Wei
ght (
g)
0
100
200
300
400
500
600G R O RE MAP
a bb ba bb
ab
a b b b
abb b
ab b b
ab bb
aab
ab b
aab
ab
b
aab
b
ab
S n o u t-V en t L en g th
S ep t O ct N o v D e c Ja n F e b M ar A p r M a y
SVL
(mm
)
0
5 0
1 00
1 50
2 00
2 50
3 00G RO RE MAP
aab
ab b
a b bb
a b bb
abb b
abbb
a ab
ab b
a
bb b
a ab bb
a ab b
ab

66
Figure 2-6. Hatchling alligator total length (mm) within sites over time. Significant
differences among sites were determined by Tukey Multiple Comparison Analysis (p < .05).
Griffin
Sept Oct Nov Dec Jan Feb Mar Apr May
TL (m
m)
0
100
200
300
400
500
600
700GR-04-51 GR-04-A GR-04-B GR-04-C GR-04-D
aab
bc c
bab a a
ab
bab a a
ab b
ab a a
ab a
aa a abc c
aab
abc
aaa
aa
ab
b
ab
ab a
ab
b
aaa
b
Orange
Sept Oct Nov Dec Jan Feb Mar Apr May
TL (m
m)
0
100
200
300
400
500
600
700OR-04-12 OR-04-13 OR-04-B OR-04-W1 OR-04-W5
a a
a
aa
bc b ba
ac
ab
abab b
b b ba
ab
cd
bc
a bd
ab c
bc
ab
abc
ac
abc
a bc
ab c
a ab
aba
bb
aba
ab
ab
Emerelda
Sept Oct Nov Dec Jan Feb Mar Apr May
TL (m
m)
0
100
200
300
400
500
600EM-04-01 EM-04-02 EM-04-03 EM-04-04 EM-04-11
a ab bc
a a a ab
ab a
cb
ab
ab
a
cbb
ba
c
bc
bc
ab
a
b
ab
ab
ab
a
bb
baa
aa
aa a
a a
a
Apopka
Sept Oct Nov Dec Jan Feb Mar Apr May
TL (m
m)
0
100
200
300
400
500
600
700AP-04-10 AP-04-W2 AP-04-W10
a baa a
b b a bab
a bab
a b
ab a
a
aa
a
a aa
aa
c

67
Figure 2-7. Hatchling alligator snout-vent length (mm) within sites over time. Significant
differences among sites were determined by Tukey Multiple Comparison Analysis (p < .05).
O range
Sept O ct Nov Dec Jan Feb M ar A pr M ay
SVL
(mm
)
0
50
100
150
200
250
300
350O R-04-12O R-04-13O R-04-BO R-04-W 1O R-04-W 5
aab
bc c
bc
abb b b
ab bab
ab
ab
abb b
ab b b
ab
aabc
ab
bc
a ab
c
bc
bc
c
a
b
aba
bab
a
b b
ab
ab
Griffin
Sept Oct Nov Dec Jan Feb Mar Apr May
SVL
(mm
)
0
50
100
150
200
250
300
350GR-04-51GR-04-AGR-04-BGR-04-CGR-04-D
aab
bc c c
aa aa aa
aa a aa
aaa aab b
ab
aba
aab
baa
b
aa
a
a
a ab
b
aba
ba
abc
abc
c
ab
a
Em erelda
Sept O ct Nov D ec Jan Feb M ar A pr M ay
SVL
(mm
)
0
50
100
150
200
250
300EM -04-01EM -04-02EM -04-03EM -04-04EM -04-11
ab bc d
aa a ab
ab a
cb b
abb b
c
ba
cb
bc
abc
a
c
ab
bc
ab
a
bab
b
a
aaaa
a aa
aa
Apopka
Sept O ct N ov D ec Jan Feb M ar A pr M ay
SVL
(mm
)
0
50
100
150
200
250
300
350AP-04-10AP-04-W 2AP-04-W 10
a bc
aab
a ab
aa a
aabb
aaa a
aaa
a
a aa
a
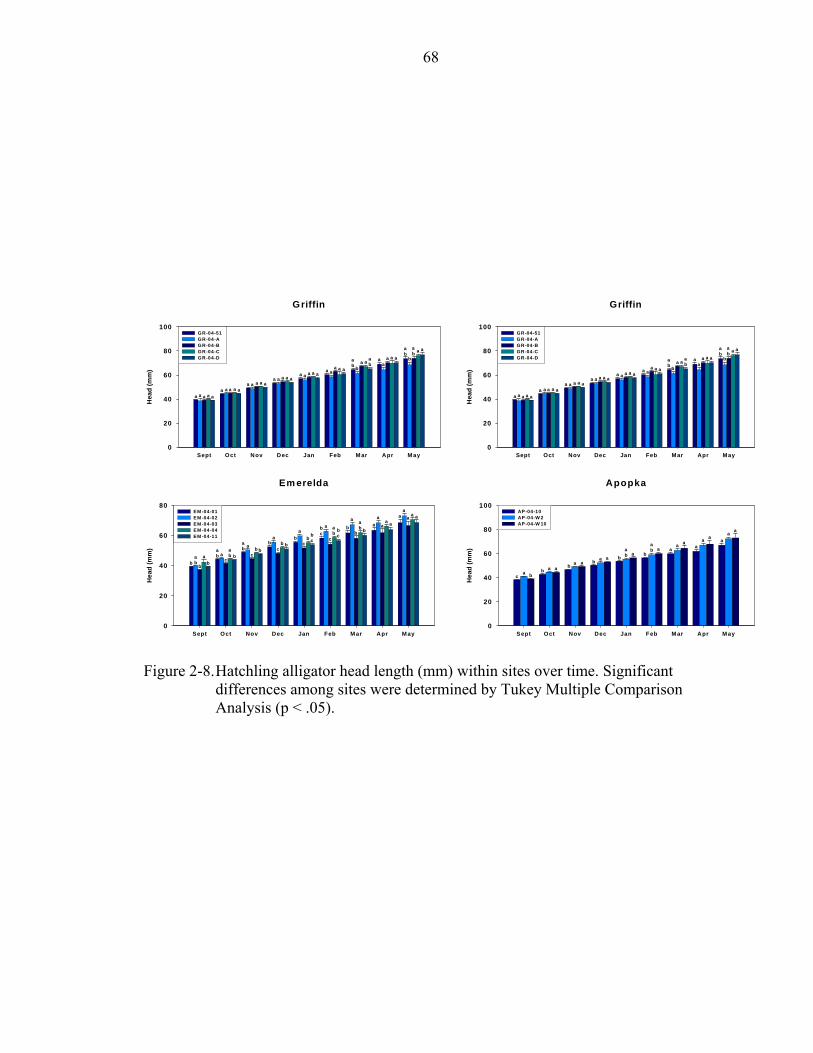
68
Figure 2-8. Hatchling alligator head length (mm) within sites over time. Significant
differences among sites were determined by Tukey Multiple Comparison Analysis (p < .05).
Griffin
Sept Oct Nov Dec Jan Feb Mar Apr May
Hea
d (m
m)
0
20
40
60
80
100GR-04-51GR-04-AGR-04-BGR-04-CGR-04-D
a aa aaa a aa a
aa a aaaaa a a
a a a a aaa
aa a
ab b
aaab
a a aa
a
ab
b
ab a a
Griffin
Sept Oct Nov Dec Jan Feb Mar Apr May
Hea
d (m
m)
0
20
40
60
80
100GR-04-51GR-04-AGR-04-BGR-04-CGR-04-D
a aa aaa a aa a
aa a aaaaa a a
a a a a aaa
aa a
ab b
aaab
a a aa
a
ab
b
ab a a
Em erelda
Sept Oct Nov Dec Jan Feb Mar Apr May
Hea
d (m
m)
0
20
40
60
80EM -04-01EM -04-02EM -04-03EM -04-04EM -04-11
aabb bb
aab
ab b
c
ab a
cb b
ba
cb b
ba
cb
bc
bc
a
c
ab
bc b
a
babb
aa
a
a aa a
aa
a
Apopka
Sept Oct Nov Dec Jan Feb Mar Apr May
Hea
d (m
m)
0
20
40
60
80
100AP-04-10AP-04-W 2AP-04-W 10
a bca ab
a aba a
ba
abb
aab
ba a
aa a a a
a a

69
Figure 2-9. Hatchling alligator body weight (g) within sites over time. Significant
differences among sites were determined by Tukey Multiple Comparison Analysis (p < .05).
Griffin
Sept Oct Nov Dec Jan Feb M ar Apr M ay
Wei
ght (
g)
0
100
200
300
400
500
600
700
800GR-04-51GR-04-AGR-04-BGR-04-CGR-04-D
a a bb ca a aa a
ab b
ab a a
b
abb
abaa
b
ab b
aba
ab
ab
aa
b
ab
ab
b
aaa
ab
b
ab
ab
aab
b
ab
a
a
Orange
Sept Oct Nov Dec Jan Feb Mar Apr May
Wei
ght (
g)
0
100
200
300
400
500
600
700OR-04-12OR-04-13OR-04-BOR-04-W1OR-04-W5
ab b bba bb bb
ab b bb
a ab
cbc
bc
a abb
cbc c
a abb
c bcc
a ab
bc
bc
c
a
ac
c
ab
bac
a
ab
ab
bb
E m erelda
Sept O ct N ov D ec Jan Feb M ar A pr M ay
Wei
ght (
g)
0
100
200
300
400
500
600EM -04-01EM -04-02EM -04-03EM -04-04EM -04-11
aabbc d
a b bbc
ba
cb b
b
a
c
b bb
a
c
b bc
a
b b
b
b
a
b bb
b
ab
a
b
aba
b
a
a
a
a
a
Apopka
Sept O ct N ov D ec Jan Feb M ar A pr M ay
Wei
ght (
g)
0
100
200
300
400
500
600
700AP-04-10AP-04-W 2AP-04-W 10
a bca ab
a ab
aab
b
aab
b
aab
baab
b
a a
a
a
aa

70
Figure 2-10. Hatchling alligator growth parameters (necropsy animals) among sites
over time. Significant differences among sites were determined by Tukey Multiple Comparison Analysis (p < .05).
Thyroid W eight
Sept N ov Jan M arch M ay
Thyr
oid
(g)
0 .00
0.01
0.02
0.03
0.04
0.05G RO REMAP
a
ab
bab
a a a a
a a a a
a
a
a
a
a
a a a
L iver W eight
Sept N ov Jan M arch M ay
Live
r (g)
0
2
4
6
8
10
12
14GROREMAP
a a a a
aa a a
aa a a
aa a a
a
b
ab a
b
W e ig h t
S e p t N o v J a n M a r c h M a y
Wei
ght (
g)
0
1 0 0
2 0 0
3 0 0
4 0 0
5 0 0
6 0 0
7 0 0G RO RE MA P
a a a a
a abb b
a aa a
aa a
a
a
b
ab
ab
Snout-V ent Length
Sept N ov Jan M arch M ay
SVL
(mm
)
0
50
100
150
200
250
300
350G RO REMAP
a a a a
a bb b
a aa a
a a aa
a ab
ab
b
H ead Length
Sept N ov Jan M arch M ay
Hea
d (m
m)
0
20
40
60
80G RO REMAP
a aa a
a a a a
a aa a
a a a a
a ab
ab
b
Total Length
Sept Nov Jan M arch M ay
TL (m
m)
0
100
200
300
400
500
600
700G RO REMAP
a bab
ab
a ab b b
a a aa
a aaa
ab
ab
ab
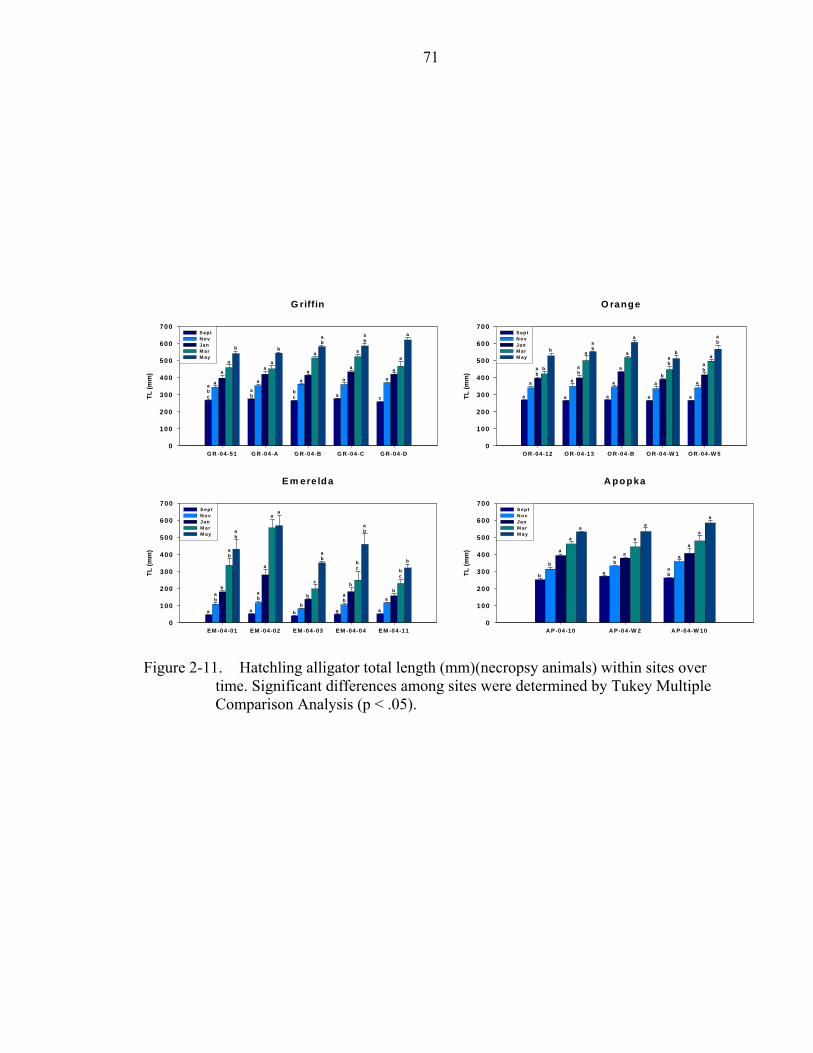
71
Figure 2-11. Hatchling alligator total length (mm)(necropsy animals) within sites over
time. Significant differences among sites were determined by Tukey Multiple Comparison Analysis (p < .05).
O range
O R -04-12 O R -04-13 O R -04-B O R -04-W 1 O R -04-W 5
TL (m
m)
0
100
200
300
400
500
600
700S eptN ovJanM arM ay
a
a
ab
b
b
a
a
ab
a
ab
a
a
a
a
a
a
a
bab
b
a
a
ab
a
ab
E m ere lda
E M -04-01 E M -04-02 E M -04-03 E M -04-04 E M -04-11
TL (m
m)
0
100
200
300
400
500
600
700S eptN o vJanM arM ay
ba a a a
aab
ab a
bb
a
bb
bb
a
ab
bc
bc
c
a
ab
ab
ab b
A popka
A P -04-10 A P -04-W 2 A P -04-W 10
TL (m
m)
0
100
200
300
400
500
600
700SeptN ovJanM arM ay
aabb
aabb
a a
aa
a
a
aa
a
G riffin
G R -04-51 G R -04-A G R -04-B G R -04-C G R -04-D
TL (m
m)
0
100
200
300
400
500
600
700SeptN ovJanM arM ay
aab
abc
bc c
aab
ab
bb
a
a
a
a
aa
a
a
a
a
a
a
a
a
a

72
Figure 2-12. Hatchling alligator snout-vent length (mm)(necropsy animals) within sites
over time. Significant differences among sites were determined by Tukey Multiple Comparison Analysis (p < .05).
O ran ge
O R -04-12 O R -04-13 O R -04-B O R -04-W 1 O R -04-W 5
SVL
(mm
)
0
50
100
150
200
250
300
350S ep tN ovJanM arM ay a
ab a
b
bb
aab
ab
b b
a
aa
a
aa
a
a
a
a
aa
a
a
a
G riffin
G R -04-51 G R -04-A G R -04-B G R -04-C G R -04-D
SVL
(mm
)
0
50
100
150
200
250
300
350SeptNovJanM arM ay
aab
abc
bc c
aab
ab
b b
a
aa
a
aa
a
a
a
a
a
a
a
a
a
E m e r e ld a
E M - 0 4 - 0 1 E M - 0 4 - 0 2 E M - 0 4 - 0 3 E M - 0 4 - 0 4 E M - 0 4 - 1 1
SVL
(mm
)
0
5 0
1 0 0
1 5 0
2 0 0
2 5 0
3 0 0
3 5 0S e p tN o vJ a nM a rM a y
aab
bcc d
aab
ab
ab
b
a
b bbb
aab
bc
bc
c
a
a
aa
a
A popka
A P-04-10 A P-04-W 2 A P -04-W 10
SVL
(mm
)
0
50
100
150
200
250
300
350SeptNovJanM arM ay
a bb
aab
b
a aa
a aa
aa
a

73
Figure 2-13. Hatchling alligator head length (mm)(necropsy animals) within sites over
time. Significant differences among sites were determined by Tukey Multiple Comparison Analysis (p < .05).
O ran ge
O R -04-12 O R -04-13 O R -04-B O R -04-W 1 O R -04-W 5
Hea
d (m
m)
0
20
40
60
80
100S ep tN ovJanM arM ay
aab
ab b
ab
aa aa a
ab
ab
ab
ab
a
b b
ab a
ba a
aa
a
E m ere ld a
E M -04-01 E M -04-02 E M -04-03 E M -04-04 E M -04-11
Hea
d (m
m)
0
20
40
60
80
100S eptN o vJanM arM ay
abb bc
a aa
aa
aab b bb
aab
bb b
aab
ab
ab
b
A po pka
A P -04-10 A P -04-W 2 A P -04-W 10
Hea
d (m
m)
0
20
40
60
80
100Sep tN o vJanM arM ay
ab b
aab
b
a aa
aa
a
a
aa
G riffin
G R -04-51 G R -04-A G R -04-B G R -04-C G R -04-D
Hea
d (m
m)
0
20
40
60
80
100SeptN o vJanM arM ay
a a a bb
a a a aaa
aa a
aa a
a a
a
aab
ab
ab
b

74
Figure 2-14. Hatchling alligator body weight (g) (necropsy animals) within sites over
time. Significant differences among sites were determined by Tukey Multiple Comparison Analysis (p < .05).
G riffin
G R -04-51 G R -04-A G R -04-B G R -04-C G R -04-D
Wei
ght (
g)
0
100
200
300
400
500
600
700
800SeptN ovJanM arM ay
baaaa
a
aba
bb
b
a
a
a
a
a
a
a
a
a
a
a
a
a
a
a
O range
O R -04-12 O R -04-13 O R -04-B O R -04-W 1 O R -04-W 5
Wei
ght (
g)
0
100
200
300
400
500
600
700
800SeptN ovJanM arM ay
aab bbb
a aba
bab
b
aab
ab
bc
c
a
bb
b
ab
a a a a a
Em erelda
EM -04-01 EM -04-02 EM -04-03 EM -04-04 EM -04-11
Wei
ght (
g)
0
100
200
300
400
500
600
700SeptN ovJanM arM ay
ab ba a a
a aab
ab
b
a
bb
bb
a
b
b
bb
a
aba
b
ab b
A p opka
A P -04-10 A P -04-W 2 A P -04-W 10
Wei
ght (
g)
0
100
200
300
400
500
600
700S eptN ovJanM arM ay
aab
ba bb
a
a
a
a
a
a
a
a
a

75
Figure 2-15. Hatchling alligator thyroid weight (g)(necropsy animals) within sites over
time. Significant differences among sites were determined by Tukey Multiple Comparison Analysis (p < .05).
G riffin
G R -04-51 G R -04-A G R -04-B G R -04-C G R -04-D
Thyr
oid
Wt.
(g)
0 .00
0.01
0.02
0.03
0.04
0.05
0.06
0.07SeptN ovJanM arM ay
aab
ab
b b
a
ab
ab
b
b
aa
a
a a
a
a a
a
a
a
a
a a
a
O range
O R -04-12 O R -04-13 O R -04-B O R -04-W 1 O R -04-W 5
Thyr
oid
Wt (
g)
0 .00
0 .01
0 .02
0 .03
0 .04
0 .05Sep tN o vJanM arM ay
a
aa
a
a
a
a
a
a
a
aa
a
a
a
aa
a
a
a
aa
a
a
a
E m ere lda
E M -04-01 E M -04-02 E M -04-03 E M -04-04 E M -04-11
Thyr
oid
Wt (
g)
0 .00
0.01
0.02
0.03
0.04
0.05
0.06S eptN ovJanM arM ay
a
b b b b
a
ab
b
b b
a
b
bb
b
a ab
ab a
b
b
a aa a a
A popka
A P -04-10 A P -04-W 2 A P -04-W 10
Thyr
oid
Wt (
g)
0 .00
0.01
0.02
0.03
0.04
0.05
0.06SeptN ovJanM arM ay
a
ab
b
a a aa
a
a
a
a
a
a
a
a

76
Figure 2-16. Hatchling alligator liver weight (g) (necropsy animals) within sites over
time. Significant differences among sites were determined by Tukey Multiple Comparison Analysis (p < .05).
G riffin
G R -04-51 G R -04-A G R -04-B G R -04-C G R -04-D
Live
r Wt (
g)
0
2
4
6
8
10
12
14
16
18SeptN ovJanM arM ay
aab
ab
bc c
a
ab
bb
b
aa
a
a
a
a
a a
a
a
a
a
a
a
a
O rang e
O R -04-12 O R -04-13 O R -04-B O R -04-W 1 O R -04-W 5
Live
r Wt (
g)
0
2
4
6
8
10
12
14
16
18S ep tN o vJanM arM ay
aab a
b
bb
a
ab
b
b
b
a
aa
a
a a
a
a
a
a
aa
a
a
a
E m ere lda
E M -04-01 E M -04-02 E M -04-03 E M -04-04 E M -04-11
Live
r Wt (
g)
0
2
4
6
8
10
12
14
16S ep tN o vJanM arM ay
aab
bc cd
a ab
ab a
bb
aab
bb
b
a
b
b
b
b
a
a
a
a
a
A popka
A P-04-10 A P-04-W 2 A P -04-W 10
Live
r Wt (
g)
0
2
4
6
8
10
12
14SeptN ovJanM arM ay
a ab
a
a
a
a
aa
a
a
a
a
a
a

77
Figure 2-17. Hatchling alligator total thyroxine(ng/ml)and free thyroxine (pg/ml)
plasma concentrations among sites over time. Significant differences among sites were determined by Tukey Multiple Comparison Analysis (p < .05).
Total Thyroxine
Oct Nov Dec Jan Feb Mar Apr May
TT4
(ng/
mL)
0
2
4
6
8
10
12
14
16
18GROREMAP
b
cd
a
db
ab
ab
a
a aa
a
a
bb
b aa
a
a
bc
ab
a
c
aa aa aa
b
b
Free Thyroxine
Oct Nov Dec Jan Feb Mar Apr May
FT4
(pg/
mL)
0
1
2
3
4
5
6GROREMAP
b b b
a
aa
b bb
ab
ab
a
a
b
b
c
a
b
bb
a
ab a
b
b aaa
a
a
a
a a

78
Figure 2-18. Hatchling alligator total thyroxine (ng/ml) plasma concentrations within
sites over time. Significant differences among sites were determined by Tukey Multiple Comparison Analysis (p < .05).
G riffin
O c t N o v D e c J an F e b M a r A p r M a y
TT4
(ng
/ ml)
0
2
4
6
8
1 0
1 2
1 4
1 6
1 8G R -04-51 G R -04 -A G R -04-B G R -04-C G R -04-D
a
aa
bb
a
a
a
a
a aaa
a
ab
ab
ab
ab
a
aa
a
a
a a
a
a
aa
b
a a
ab
ab
a
aa a
a
A p o p ka
O c t N o v D e c J a n F e b M a r A p r M a y
TT4
(ng/
mL)
0
2
4
6
8
10
12
14
16
18
20AP -04-10 AP -04 -W 2 AP -04 -W 10
a a
ba
a
a
a
a
a
a
aa a
a
a
a
a
a
aa
a
a
bb
O ran ge
O ct N o v D ec J an F eb M a r A p r M ay
TT4
(ng
/ ml)
0
2
4
6
8
10
12
14
16
18O R -04-12 O R -04 -13 O R -04 -B O R -04-W 1 O R -04-W 5
a
a
a
a
aa
a
aa
a
a
a a
aa
b b
ab
a
ab
aa
a
aa
a
aaa
a
aa
aa
a
a
b
a
a
a
E m ere lda
O ct N o v D ec Jan F eb M ar A p r M ay
TT4
(ng
/ ml)
02468
10121416182022
E M -04-01 E M -04-02 E M -04-03 E M -04-04 E M -04-11
d
bc
cd
ab
a
a
aa
a a
aa
a
aa
a
aa
aa
a
aa
a
ab
ab
ab
b
a ab
a
b
ab
b
a
aaa a
a

79
Figure 2-19. Hatchling alligator free thyroxine (pg/ml) plasma concentrations within
sites over time. Significant differences among sites were determined by Tukey Multiple Comparison Analysis (p < .05).
G riffin
O c t N o v D e c J a n F e b M a r A p r M a y
FT4
(pg/
mL)
0
1
2
3
4
5
6
7G R -04-5 1 G R -04 -A G R -04-B G R -04-C G R -04-D
ab
b
a
b b
b
ab
a
ba
ab
a aaa
a
a ab a
b
b
ab
c
ab
aabc b
c
a
a
a a
a
a
a
a
a
a
a
aa
a
a
O ra n g e
O c t N o v D e c J a n F e b M a r A p r M a y
FT4
(pg/
mL)
0
1
2
3
4
5
6
7
8O R -0 4-1 2 O R -0 4 -1 3 O R -0 4 -B O R -0 4-W 1 O R -0 4-W 5
a
a
aaa
a
a
a
aa a
bb
b ba a
a a a
abc
ab
c
a
bc
a
a
a
a
a
a
aa a a
a
c
b
b b
E m e re ld a
O c t N o v D e c J a n F e b M a r A p r M a y
FT4
(pg/
mL)
0
1
2
3
4
5
6E M -0 4 -0 1 E M -0 4 -0 2 E M -0 4 -0 3 E M -0 4 -0 4 E M -0 4 -1 1
a ab
ba
b
ba
a
a
a
a
a
a
a
aa
a
a
a
a
aa
ab
a
ab
ab
b
a
a
a
a
a
a
a
a
a
aa
aa
aa
A p o p ka
O ct N o v D e c J a n F e b M a r A p r M a y
FT4
(pg/
mL)
0
1
2
3
4
5
6
7
8
9AP -04 -10 AP -04 -W 2 AP -04 -W 10
a
bb
aa
a a
a
aaa
a
a
aa
a
aa
aaa
b
b
a

80
Testosterone
Estradiol
GHRH
Estradiol
Neuropeptide Y
GLP-I
Estradiol
Norepinephrine
Galanin
Somatotroph cellsof anterior pituitary
Growth Hormone Release
Ration SizeProtein Intake
StarvationAcute Stress
Chronic Stress
TSH
T3T4
DOPA
Dopamine
Norepinephrine
5-HydroxytryptamineSomatostatin-25
Somatostatin-28
SRIFIGF-I
NPY
NMA
GHTRH
SRIFGnRH
Estradiol
SRIF
Bombesin
ExerciseOvulation
TemperatureDaylength
Seawater Adaptation CCK
Figure 2-20.Graphical interpretation of factors that control the release of growth
hormone. Adapted from Mommsen, 1998.
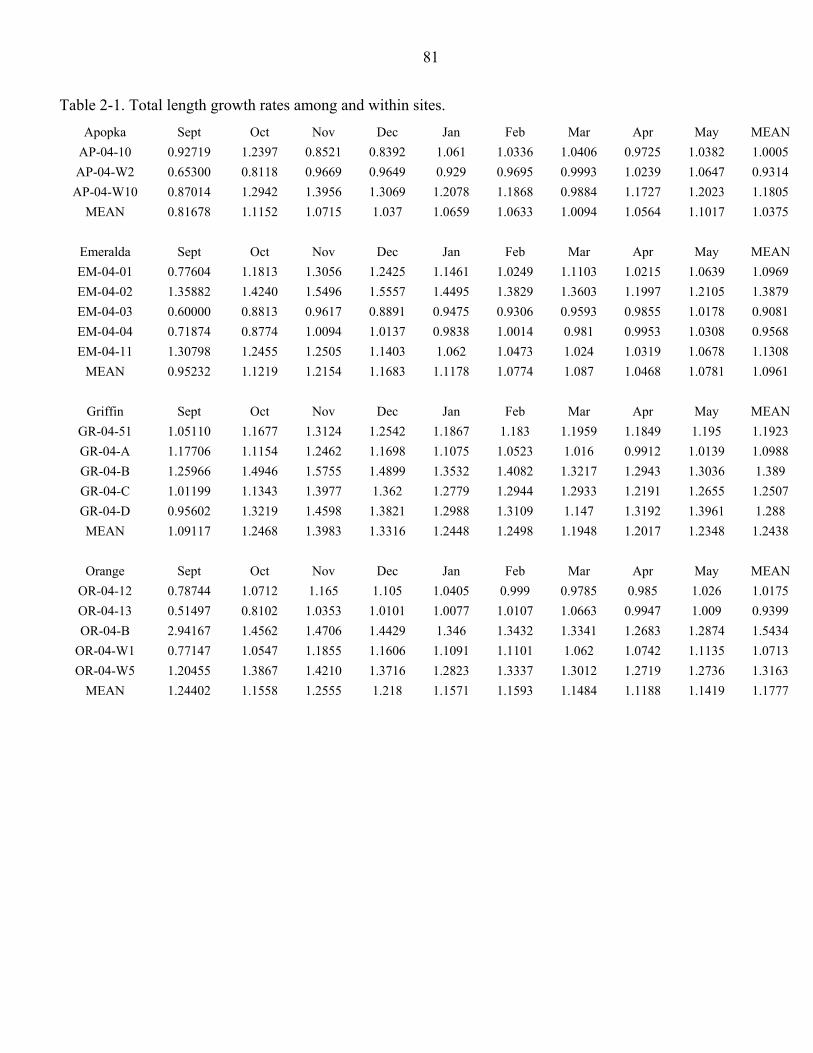
81
Table 2-1. Total length growth rates among and within sites.
Apopka Sept Oct Nov Dec Jan Feb Mar Apr May MEAN AP-04-10 0.92719 1.2397 0.8521 0.8392 1.061 1.0336 1.0406 0.9725 1.0382 1.0005 AP-04-W2 0.65300 0.8118 0.9669 0.9649 0.929 0.9695 0.9993 1.0239 1.0647 0.9314
AP-04-W10 0.87014 1.2942 1.3956 1.3069 1.2078 1.1868 0.9884 1.1727 1.2023 1.1805 MEAN 0.81678 1.1152 1.0715 1.037 1.0659 1.0633 1.0094 1.0564 1.1017 1.0375
Emeralda Sept Oct Nov Dec Jan Feb Mar Apr May MEAN EM-04-01 0.77604 1.1813 1.3056 1.2425 1.1461 1.0249 1.1103 1.0215 1.0639 1.0969 EM-04-02 1.35882 1.4240 1.5496 1.5557 1.4495 1.3829 1.3603 1.1997 1.2105 1.3879 EM-04-03 0.60000 0.8813 0.9617 0.8891 0.9475 0.9306 0.9593 0.9855 1.0178 0.9081 EM-04-04 0.71874 0.8774 1.0094 1.0137 0.9838 1.0014 0.981 0.9953 1.0308 0.9568 EM-04-11 1.30798 1.2455 1.2505 1.1403 1.062 1.0473 1.024 1.0319 1.0678 1.1308
MEAN 0.95232 1.1219 1.2154 1.1683 1.1178 1.0774 1.087 1.0468 1.0781 1.0961
Griffin Sept Oct Nov Dec Jan Feb Mar Apr May MEAN GR-04-51 1.05110 1.1677 1.3124 1.2542 1.1867 1.183 1.1959 1.1849 1.195 1.1923 GR-04-A 1.17706 1.1154 1.2462 1.1698 1.1075 1.0523 1.016 0.9912 1.0139 1.0988 GR-04-B 1.25966 1.4946 1.5755 1.4899 1.3532 1.4082 1.3217 1.2943 1.3036 1.389 GR-04-C 1.01199 1.1343 1.3977 1.362 1.2779 1.2944 1.2933 1.2191 1.2655 1.2507 GR-04-D 0.95602 1.3219 1.4598 1.3821 1.2988 1.3109 1.147 1.3192 1.3961 1.288 MEAN 1.09117 1.2468 1.3983 1.3316 1.2448 1.2498 1.1948 1.2017 1.2348 1.2438
Orange Sept Oct Nov Dec Jan Feb Mar Apr May MEAN
OR-04-12 0.78744 1.0712 1.165 1.105 1.0405 0.999 0.9785 0.985 1.026 1.0175 OR-04-13 0.51497 0.8102 1.0353 1.0101 1.0077 1.0107 1.0663 0.9947 1.009 0.9399 OR-04-B 2.94167 1.4562 1.4706 1.4429 1.346 1.3432 1.3341 1.2683 1.2874 1.5434
OR-04-W1 0.77147 1.0547 1.1855 1.1606 1.1091 1.1101 1.062 1.0742 1.1135 1.0713 OR-04-W5 1.20455 1.3867 1.4210 1.3716 1.2823 1.3337 1.3012 1.2719 1.2736 1.3163
MEAN 1.24402 1.1558 1.2555 1.218 1.1571 1.1593 1.1484 1.1188 1.1419 1.1777

82
Table 2-2. Snout-vent length growth rates among and within sites. Apopka Sept Oct Nov Dec Jan Feb Mar Apr May MEAN
AP-04-10 0.41725 0.5400 0.4251 0.4391 0.513 0.5115 0.5123 0.4711 0.4985 0.4809 AP-04-W2 0.29293 0.3679 0.4742 0.4943 0.4633 0.4845 0.4915 0.5021 0.5209 0.4546
AP-04-W10 0.35694 0.6228 0.6875 0.5936 0.594 0.5738 0.5838 0.562 0.579 0.5726 MEAN 0.35571 0.5102 0.529 0.509 0.5234 0.5233 0.5292 0.5117 0.5328 0.5027
Emeralda Sept Oct Nov Dec Jan Feb Mar Apr May MEAN EM-04-01 0.35677 0.5489 0.6454 0.612 0.5553 0.5518 0.5424 0.4982 0.5136 0.536 EM-04-02 0.0239 0.4779 0.6486 0.6905 0.645 0.6256 0.6075 0.5411 0.5434 0.5337 EM-04-03 0.30013 0.4205 0.4855 0.4862 0.4772 0.4622 0.4723 0.4821 0.4935 0.4533 EM-04-04 0.31928 0.4267 0.5154 0.525 0.4989 0.5042 0.4818 0.4978 0.5114 0.4756 EM-04-11 0.70714 0.6343 0.6458 0.6089 0.543 0.5394 0.5204 0.5207 0.5309 0.5834
MEAN 0.34145 0.5017 0.5881 0.5845 0.5439 0.5366 0.5249 0.508 0.5185 0.5164
Griffin Sept Oct Nov Dec Jan Feb Mar Apr May MEAN GR-04-51 0.45901 0.5561 0.6835 0.6408 0.592 0.5932 0.5952 0.5848 0.5841 0.5876 GR-04-A 0.49338 0.5452 0.6354 0.5891 0.5478 0.5264 0.6536 0.4852 0.4899 0.5518 GR-04-B 0.51534 0.684 0.7696 0.7288 0.6537 0.6817 0.6582 0.6192 0.6277 0.6598 GR-04-C 0.41335 0.5216 0.6842 0.6815 0.6404 0.6308 0.6271 0.5895 0.6091 0.5997 GR-04-D 0.36947 0.5993 0.7288 0.6933 0.6338 0.6469 0.7693 0.6421 0.6752 0.6398 MEAN 0.45011 0.5813 0.7003 0.6667 0.6135 0.6158 0.6607 0.5842 0.5972 0.6078
Orange Sept Oct Nov Dec Jan Feb Mar Apr May MEAN
OR-04-12 0.31765 0.4799 0.5794 0.5471 0.5018 0.4862 0.4729 0.4669 0.4829 0.4816 OR-04-13 0.31012 0.3886 0.5214 0.5114 0.4996 0.4954 0.5174 0.4926 0.4879 0.4694 OR-04-B 0.52337 0.6927 0.7193 0.7192 0.6548 0.658 0.6483 0.6109 0.6211 0.6497
OR-04-W1 0.36559 0.5127 0.5961 0.5916 0.5435 0.5632 0.5356 0.5445 0.5561 0.5343 OR-04-W5 0.51056 0.6264 0.6669 0.6606 0.6066 0.6115 0.6203 0.5984 0.5876 0.6099
MEAN 0.40546 0.54 0.6166 0.606 0.5613 0.5629 0.5589 0.5427 0.5471 0.549

83
Table 2-3. Head length growth rates among and within sites.
Apopka Sept Oct Nov Dec Jan Feb Mar Apr May MEAN AP-04-10 0.10576 0.1288 0.0943 0.0990 0.1227 0.1183 0.1178 0.11 0.1175 0.1127 AP-04-W2 0.08664 0.0973 0.1133 0.1126 0.1096 0.1122 0.1137 0.116 0.1232 0.1094
AP-04-W10 0.12184 0.1536 0.1593 0.1474 0.1394 0.1374 0.1388 0.134 0.1385 0.1411 MEAN 0.10475 0.1266 0.1223 0.1197 0.1239 0.1227 0.1235 0.12 0.1264 0.1211
Emeralda Sept Oct Nov Dec Jan Feb Mar Apr May MEAN EM-04-01 0.11993 0.1372 0.1445 0.1366 0.1283 0.1237 0.1216 0.1127 0.1196 0.1271 EM-04-02 0.11278 0.1434 0.1605 0.1619 0.1549 0.1477 0.1471 0.1319 0.1348 0.1439 EM-04-03 0.07988 0.11 0.1101 0.1104 0.1112 0.108 0.1109 0.1115 0.1172 0.1077 EM-04-04 0.15792 0.1075 0.118 0.1175 0.1152 0.1158 0.1142 0.1167 0.1202 0.1203 EM-04-11 0.1484 0.1422 0.1386 0.1300 0.1212 0.1175 0.1167 0.117 0.1219 0.1282
MEAN 0.12378 0.1281 0.1344 0.1313 0.1262 0.1225 0.1221 0.118 0.1228 0.1254
Griffin Sept Oct Nov Dec Jan Feb Mar Apr May MEAN GR-04-51 0.13007 0.1454 0.1532 0.1466 0.1412 0.1375 0.1373 0.1374 0.1397 0.1409 GR-04-A 0.05335 0.1392 0.1373 0.1371 0.1288 0.1223 0.1181 0.1149 0.1178 0.1188 GR-04-B 0.12613 0.159 0.1683 0.1600 0.1502 0.1551 0.1523 0.1439 0.1459 0.1512 GR-04-C 0.12601 0.138 0.1556 0.1511 0.1448 0.1325 0.1445 0.1368 0.1458 0.1417 GR-04-D 0.08718 0.1407 0.1511 0.1448 0.1402 0.1392 0.1375 0.1404 0.1501 0.1368 MEAN 0.10455 0.1445 0.1531 0.1479 0.141 0.1373 0.138 0.1347 0.1399 0.1379
Orange Sept Oct Nov Dec Jan Feb Mar Apr May MEAN
OR-04-12 0.10978 0.1278 0.1300 0.1223 0.1168 0.1126 0.1095 0.1085 0.1139 0.1168 OR-04-13 0.06736 0.0980 0.1125 0.1144 0.1125 0.1105 0.1169 0.1099 0.1132 0.1061 OR-04-B 0.12861 0.1578 0.1572 0.1567 0.1499 0.1492 0.1472 0.14 0.1441 0.1479
OR-04-W1 0.03139 0.0911 0.1105 0.1136 0.1119 0.116 0.1141 0.1154 0.1215 0.1028 OR-04-W5 0.14353 0.1569 0.1543 0.1482 0.1409 0.1396 0.1398 0.1388 0.142 0.1449
MEAN 0.09613 0.1263 0.1329 0.1311 0.1264 0.1256 0.1255 0.1225 0.1269 0.1237

84
Table 2-4. Body weight growth rates among and within sites.
Apopka Sept Oct Nov Dec Jan Feb Mar Apr May MEAN AP-04-10 -0.142 0.3339 0.4028 0.5629 0.664 0.8235 0.9383 0.9884 1.2239 0.6439 AP-04-W2 -0.186 0.2751 0.5495 0.7342 0.6933 0.9298 1.1494 1.2807 1.483 0.7677
AP-04-W10 -0.192 0.4847 0.8331 1.0648 0.9643 1.157 1.4169 1.5286 1.7323 0.9989 MEAN -0.173 0.3646 0.5951 0.7873 0.7739 0.9701 1.1682 1.2659 1.4797 0.8035
Emeralda Sept Oct Nov Dec Jan Feb Mar Apr May MEAN EM-04-01 -0.096 0.4238 0.6937 0.8715 0.814 0.9782 1.1183 1.1024 1.3155 0.8024 EM-04-02 -0.053 0.565 0.9901 1.3877 1.2348 1.4202 1.7494 1.4623 1.6692 1.1584 EM-04-03 -0.060 0.2368 0.3948 0.5283 0.5246 0.6456 0.8348 0.9462 1.1025 0.5725 EM-04-04 -0.244 0.2415 0.5107 0.7018 0.6939 0.8735 1.0231 1.1602 1.3324 0.6992 EM-04-11 -0.125 0.3893 0.6335 0.7705 0.7107 0.8668 0.9828 1.1521 1.2867 0.7408
MEAN -0.116 0.3713 0.6445 0.8519 0.7956 0.9569 1.1417 1.1646 1.3412 0.7947
Griffin Sept Oct Nov Dec Jan Feb Mar Apr May MEAN GR-04-51 -0.085 0.4041 0.7652 1.0108 0.9695 1.2064 1.3834 1.5226 1.5575 0.9705 GR-04-A -0.196 0.3000 0.6267 0.8584 0.7982 0.9064 1.0218 1.0647 1.2059 0.7318 GR-04-B -0.048 0.5038 0.8912 1.1153 1.0485 1.3593 1.5635 1.6191 1.8298 1.0981 GR-04-C -0.097 0.4397 0.8715 1.1457 1.0766 1.3123 1.5465 1.5398 1.8769 1.0791 GR-04-D -0.034 0.5374 0.8623 1.1058 1.0394 1.2682 1.5675 1.7796 2.18 1.1451 MEAN -0.092 0.4370 0.8034 1.0472 0.9864 1.2106 1.4165 1.5051 1.73 1.0049
Orange Sept Oct Nov Dec Jan Feb Mar Apr May MEAN
OR-04-12 -0.118 0.3779 0.6099 0.7557 0.7193 0.8099 0.8451 0.9966 1.1556 0.6836 OR-04-13 -0.102 0.2698 0.5399 0.6947 0.6913 0.8461 1.0955 1.0616 1.1855 0.698 OR-04-B -0.113 0.5184 0.8935 1.1375 1.0759 1.3295 1.6161 1.6289 1.8493 1.104
OR-04-W1 -0.127 0.2920 0.5567 0.7012 0.6772 0.8885 1.0224 1.1775 1.348 0.7263 OR-04-W5 0.008 0.4602 0.7101 0.9814 0.9218 1.1863 1.4461 1.5617 1.7317 1.0008
MEAN -0.09 0.3837 0.662 0.8541 0.8171 1.0121 1.2051 1.2853 1.454 0.8426

85
Table 2-5. Hatchling alligator thyroid (TSI) and liver (LSI) somatic indices among sites over time. No differences were observed in TSI among sites. Temporal differences were observed in LSI among sites. Significant differences determined utilizing Wilkoxon analysis with the Kruskal –Wallis Test (p < .05).
TSI among Sites
LSI among Sites
Date Chi Square Pr > Chi Square Date Chi Square Pr > Chi Square
Sept 4.2855 0.2322 Sept 6.8526 0.0767 Nov 5.936 0.1148 Nov 17.0271 0.0007 Jan 1.1091 0.7749 Jan 6.1687 0.1037 Mar 4.8678 0.1817 Mar 9.786 0.0205 May 1.0038 0.8003 May 6.3759 0.0947

86
Table 2-6. Hatchling alligator thyroid somatic indices (TSI) within sites over time. No significant differences were observed. Significant differences determined utilizing Wilkoxon analysis with the Kruskal –Wallis Test (p < .05). Apopka Chi-Square Pr> Chi Square Sept 3.4667 0.1767 Nov 3.2000 0.2019 Jan 0.3556 0.8371 Mar 5.0667 0.0794 May 5.0667 0.0794 Emeralda Chi-Square Pr> Chi Square Sept 5.1434 0.2729 Nov 10.8945 0.0278 Jan 9.5667 0.0484 Mar 5.5667 0.2339 May 4.9333 0.2942 Griffin Chi-Square Pr> Chi Square Sept 9.1747 0.0569 Nov 6.8706 0.1429 Jan 4.7667 0.3121 Mar 7.2667 0.1224 May 9.7333 0.0452 Orange Chi-Square Pr> Chi Square Sept 4.2000 0.3796 Nov 8.9667 0.0619 Jan 10.7667 0.0293 Mar 2.5796 0.6304 May 7.0000 0.1359

87
Table 2-7. Hatchling alligator liver somatic indices (LSI) within sites over time. No significant differences were observed. Significant differences determined utilizing Wilkoxon analysis with the Kruskal –Wallis Test (p < .05).
Apopka Chi-Square Pr> Chi Square Sept 3.2889 0.1931 Nov 3.2000 0.2019 Jan 4.6222 0.0992 Mar 0.8000 0.6703 May 5.9556 0.0509 Emeralda Chi-Square Pr> Chi Square Sept 10.4333 0.0337 Nov 4.4667 0.3465 Jan 4.6333 0.3270 Mar 10.833 0.0285 May 3.9000 0.4197 Griffin Chi-Square Pr> Chi Square Sept 12.0333 0.0171 Nov 8.1667 0.0857 Jan 11.7000 0.0197 Mar 7.9667 0.0928 May 3.7000 0.4481 Orange Chi-Square Pr> Chi Square Sept 7.1711 0.1271 Nov 9.2333 0.0555 Jan 5.3000 0.2579 Mar 2.5000 0.6446 May 2.7667 0.5976
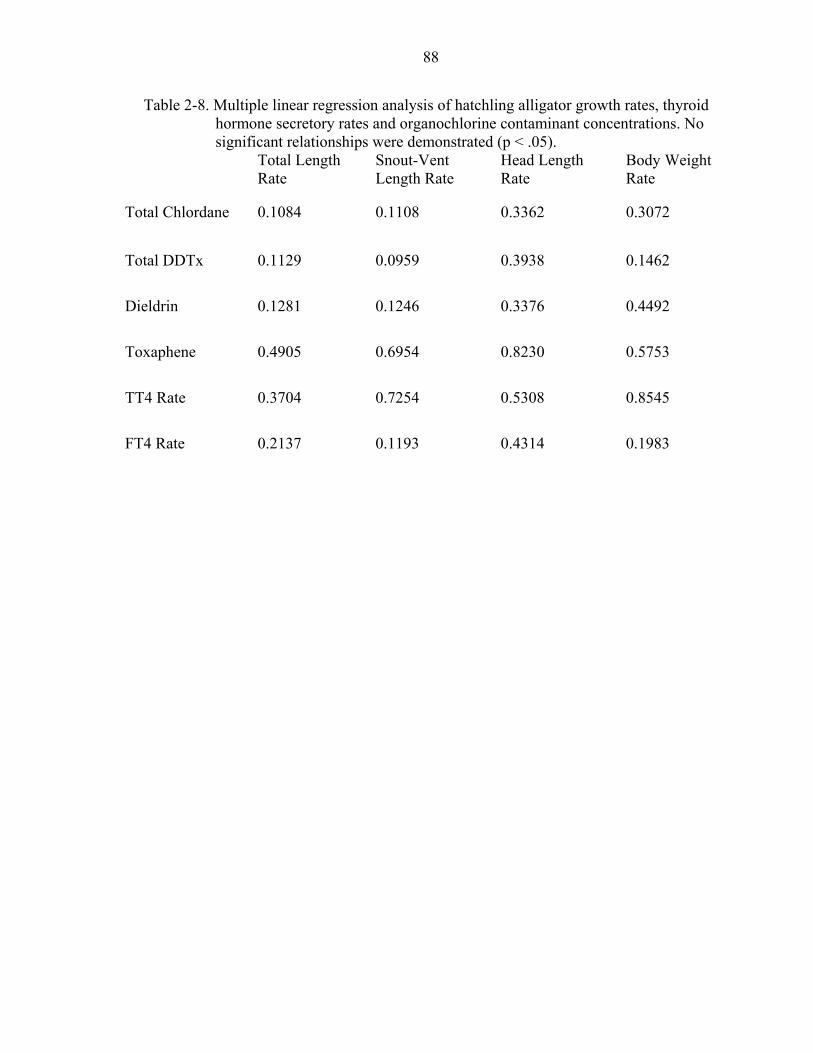
88
Table 2-8. Multiple linear regression analysis of hatchling alligator growth rates, thyroid hormone secretory rates and organochlorine contaminant concentrations. No significant relationships were demonstrated (p < .05).
Total Length Rate
Snout-Vent Length Rate
Head Length Rate
Body Weight Rate
Total Chlordane 0.1084 0.1108 0.3362 0.3072
Total DDTx 0.1129 0.0959 0.3938 0.1462
Dieldrin 0.1281 0.1246 0.3376 0.4492
Toxaphene 0.4905 0.6954 0.8230 0.5753
TT4 Rate 0.3704 0.7254 0.5308 0.8545
FT4 Rate 0.2137 0.1193 0.4314 0.1983

89
LIST OF REFERENCES
Bjöornsson, B.T., Johansson, V., Benedet, S., Einarsdottir, I.E., Hildahl, H., Agustsson, T., Jönsson, E. (2002) Growth hormone endocrinology of salmonids: regulatory mechanisms and mode of action. Fish Physiology and Biochemistry 27: 227-242.
Blanar, C.A., Curtis, M.A., Chan, H.M. (2005) Growth, nutritional composition, and hematology of Artic Charr (Salvelinus alpinus) exposed to toxaphene and tapeworm (Diphyllobothrium dendriticum) larvae. Archives of Environmental Contamination and Toxicology 48: 397-404.
Bona-Gallo, A., Licht, P., MacKenzie, D.S., Lofts, B. (1980) Annual cycles in levels of pituitary and plasma gonadotropin, gonadal steroids, and thyroid activity in the Chinese cobra (Naja naja). General and Comparative Endocrinology 42: 477-493.
Brouwer, A., Morse, D.C., Lans, M.C., Schuur, G., Murk, A.J., Klasson-Wehler, E., Bergman, A., Visser, T.J. (1998) Interactions of persistent environmental organohalogens with the thyroid hormone system: mechanisms and possible consequences for animal and human health. Toxicology and Industrial Health 14(1/2): 59-84.
Brown, S.B., Adams, B.A., Cyr, D.G., Eales, J.G. (2004) Contaminant effects on the teleost fish thyroid. Environmental Toxicology and Chemistry 23(7): 1680-1701.
Brown, S.B., Fisk, A.T., Brown, M., Vinella, M., Muir, D.C.G., Evans, R.E., Lockhart, W.L., Metner, D.A., Cooley, H.M. (2002) Dietary accumulation and biochemical responses in juvenile rainbow trout (Oncorhynchus mykiss) to 3,3’4,4’,5- pentachlorobipheyl (PCB 126). Aquatic Toxicology 59(3-4): 139-152.
Brucker-Davis, F. (1998) Effects of environmental synthetic chemicals on thyroid function. Thyroid 8(9): 827-856.
Bustnes, J.O., Miland, O., Fjeld, M., Erikstad, K.E., Skaare, J.U. (2005) Relationships between ecological variables and four organochlorine pollutants in an artic glacous gull (Larus hyperboreous) population. Environmental Pollution 136: 175-185.
Capen, C.C. (2001) Cassarett and Doull’s Toxicology. The Basic Science of Poisons, 6th Edition. Chapter 21: Toxic Responses of the Endocrine System, Thyroid Gland (Follicular Cells). Ed. Curtis D. Klaassen. McGraw-Hill Medical Publishing Division. New York, NY..

90
Chang, L., Munro, L.A., Richardson, S.J., Schreiber, G. (1999) Evolution of thyroid hormone binding by transthyretins in birds and mammals. Eur. J. Biochem. 259: 534-542.
Cheek, A.O., Kow, K., Chen, J., MacLachlan, J.A. (1999) Potential mechanisms of thyroid disruption in humans: interaction of organochlorine compounds with the thyroid receptor, transthyretin, and thyroid-binding globulin. Environmental Health Perspectives 107(4): 273-278.
Conley, A.J., Elf, P., Corbin, C.J., Dubowsky, S., Fivizzani, A., Lang, J.W. (1997) Yolk steroids decline during sexual differentiation in the alligator. General and Comparative Endocrinology 107: 191-200.
Cooley, H.M., Fisk, A.T., Wiens, S.C., Tomy, G.T., Evans, R.E., Muir, D.C.G. (2001) Examination of behavior and thyroid histology of juvenile rainbow trout (Oncorhynchus mykiss) exposed to high dietary concentrations of C10
-, C11- , C12
- and C14
- polychlorinated n-alkanes. Aquatic Toxicology 54: 81-99.
Crain, D.A., Guillette, Jr., L.J., Pickford, D.B., Percival, H.F., Woodward, A.R. (1998) Sex-steroid and thyroid hormone concentrations in juvenile alligators (Alligator mississippiensis) from contaminated and reference lakes in Florida, USA. Environmental Toxicology and Chemistry 17(3): 446-452.
Denver, R.J. and Licht, P. (1991) Dependence of body growth on thyroid activity in turtles. The Journal of Experimental Zoology 258: 48-59.
Eales, J.G. and Shostak, S. (1985) Free T4 and T3 in relation to total hormone, free hormone indices, and protein in plasma of Rainbow Trout and Artic Charr. General and Comparative Endocrinology 58: 291-302.
Eales, J.G. (1984) The peripheral metabolism of thyroid hormones and regulation of thyroid status in poikilotherms. Can. J. Zool. 63: 1217-1231.
Elsey, R.M., Joanen, T., McNease, L., Kinler, N. (1992) Growth rates and body condition factors of Alligator mississippiensis in coastal Louisiana wetlands: a comparison of wild and farm-raised juveniles. Comparative Biochemistry and Physiology 103A(4): 667-672.
Elsey, R.M., Joanen, T., McNease, L., Lance, V. (1990) Growth rate and plasma corticosterone levels in juvenile alligators maintained at different stocking densities. The Journal of Experimental Zoology 255: 30-36.
Ferguson, M.W.J. (1985) The reproductive biology and embryology of crocodilians. In Biology of the Reptilia: Vol. 14, Development A: 329-491. Gans, C. (Ed.) New York, NY: John Wiley and Sons.

91
Fowles, J.R., Fairbrother, A., Trust, K.A., Kerkvliet, N.I. (1997) Effects of Arochlor 1254 on the thyroid gland, immune function, and hepatic cytochrome p450 activity in mallards. Environmental Research 75: 119-129.
Fregly, M.J., Waters, I.W., Straw, J.A. (1967) Effect of isomers of DDD on thyroid and adrenal function in rats. Canadian Journal of Physiology and Pharmacology 46:59-66.
Galton, V.A. and Cohen, J.S. (1980) Action of thyroid hormones in premetamorphic tadpoles: an important role for thyroxine?. Endocrinology 107: 1820-1826.
Greenblatt, M., Brown, C.L., Lee, M., Dauder, S., Bern, H.A. (1989) Changes in thyroid hormone levels in eggs and larvae and the iodide uptake of eggs of coho and chinook salmon, Oncorhynchus kisutsch and O. tschawytscha. Fish Physiology and Biochemistry 6(5): 261-278.
Gross, T.S., Guillette, L.J., Percival, H.F., Masson, G.R., Matter, J.M., Woodward, A.R. (1994) Contaminant-induced reproductive anomalies in Florida. Comparative Pathology Bulletin XXVI(4): November.
Guillette, L.J., Jr. (1995) Endocrine disrupting environmental contaminants and developmental abnormalities in embryos. Human and Ecological Risk Assessment 1: 25-36.
Guillette Jr., L.J., Woodward, A.R., Crain, D.A., Pickford, D.B., Rooney, A.A., Percival, H.F. (1999) Plasma steroid concentrations and male phallus size in juvenile alligators from seven Florida lakes. General and Comparative Endocrinology 116: 356-372.
Guillette, L.J., Jr., Crain, D.A., Rooney, A.A., Pickford, D.B. (1995) Organization versus activation: the role of endocrine disrupting contaminants (EDCs) during embryonic development in wildlife. Environmental Health Perspectives 103: 157-164.
Gunderson, M.P., Bermudez, D.S., Bryan, T.A., Crain, D.A., Degala, S., Edwards, T.M., Kools, S.A.E., Milnes, M.R., Guillette, Jr., L.J. (2002) Temporal and spatial variation in plasma thyroxine (T4) concentrations in juvenile alligators collected from lake Okeechobee and the northern Everglades, Florida, USA. Environmental Toxicology and Chemistry 21(5): 914-921.
Heinz, G.H., Percival, H.F., Jennings, M.L. (1991) Contaminants in American alligator eggs from lake Apopka, lake Griffin, and lake Okeechobee, Florida. Environmental Monitoring and Assessment 16: 277-285.
Hewitt, E.A., Crain, D.A., Gunderson, M.P., Guillette Jr., L.J. (2002) Thyroid status in juvenile alligators (Alligator mississippiensis) from contaminated and reference sites on Lake Okeechobee, Florida, USA. Chemosphere 47:1129-1135.

92
Hulbert, A.J. (2000) Thyroid hormones and their effects: a new perspective. Biol. Rev. 75:519-631.
Hulbert, A.J. and Williams, C.A. (1988) Thyroid function in a lizard, a tortoise, and a crocodile, compared with mammals. Comp. Biochem. Physiol. 90A(1): 41-48.
Jallageas, M. and Assemabcher, I. (1979) Further evidence for reciprocal interactions between the annual sexual and thyroid cycles in male Peking ducks. General and Comparative Endocrinology 37: 44-51.
Jallegeas, M., Tamisier, A., Assenmacher, I. (1978) A comparative study of the annual cycles of sexual and thyroid function in male Peking ducks (Anas platyrhynchos) and teal (Anas crecca). General and Comparative Endocrinology 36: 201-210.
Jefferies, D.J. and French, M.C. (1972) Changes induced in the pigeon thyroid by p,p, DDE and dieldrin. Journal of Wildlife Management 36(1): 24-30.
Jefferies, D.J. and Parslow, J.L.F. (1972) Effect of one polychlorinated biphenyl on size and activity of the gull thyroid. Bulletin of Environmental Contamination and Toxicology 8(5): 306-310.
Joanen, T. and McNease, L. (1979) Culture of the American alligator. International Zoo Yearbook 19: 61-66.
Kar, A. and Chandola-Saklani, A. (1984) Circulating thyroid hormone concentrations in relation to seasonal events in the male Indian Garden lizard, Calotes versicolor. General and Comparative Endocrinology 60: 14-19.
Kato, Y., Ikushiro, S., Haraguchi, K., Yamazaki, T., Ito, Y., Suzuki, H. Kimura, R., Yamada, S., Inoue, T., Degawa, M. (2004) A possible mechanism for decrease in serum thyroxine level by polychlorinated biphenyls in Winstar and Gunn rats. Toxicological Sciences 81: 309-315.
Kato, Y., Haraguchi, K., Yamazaki, T., Ito, Y., Shoji, M., Nemoto, K., Koga, N., Kimura, R., Degawa, M. (2003) Effects of polychlorinated biphenyls, Kaechlor-500, on serum thyroid hormone levels in rats and mice. Toxicological Science 72: 235-241.
Kobuke, L., Specker, J.L., Bern, H.A. (1987) Thyroxine content of eggs and larvae of coho salmon, Oncorhynchus kisutch. The Journal of Experimental Zoology 242: 89-94.
Kohel, K.A., MacKenzie, D.S., Rostal, D.C., Grumbles, J.S., Lance, V.A. (2001) Seasonality in plasma thyroxine in the desert tortoise, Gopherus agassizii. General and Comparative Endocrinology 121: 214-222.
Lamai, S.L., Warner, G.F., Walker, C.H. (1999) Effects of dieldrin on life stages of the African catfish (Clarias gariepinus). Ecotoxicology and Environmental Safety 42: 22-29.

93
Licht, P., Denver, R.J., Herrera, B.E. (1991) Comparative survey of blood thyroxine binding in turtles. The Journal of Experimental Zoology 259:43-52.
Licht, P., Denver, R.J., Pavgi, S. (1989) Temperature dependence of in vitro pituitary, testis, and thyroid secretion in a turtle, Pseudemys scripta. General and Comparative Endocrinology 76: 274-285.
Licht, P., Breitenbach, G.L., Congdon, J.D. (1985) Seasonal cycles in testicular activity, gonadotropin, and thyroxine in the Painted Turtle, Chrysemys picta, under natural conditions. General and Comparative Endocrinology 59: 130-139.
Licht, P., Wood, J.F., Wood, F.E. (1985) Annual and diurnal cycles in plasma testosterone and thyroxine in the male Green Sea Turtle, Chelonia mydas. General and Comparative Endocrinology 57: 335-344.
Masson, G.R. (1995) Environmental influences on reproductive potential, clutch viability and embryonic mortality of the American Alligator in Florida. PhD Dissertation, University of Florida.
McNabb, F.M.A., Jang, D.A., Larsen, C.T. (2004) Does thyroid function in developing birds adapt to sustained ammonium perchlorate exposure?. Toxicological Science 82: 106-113.
McNabb, M.A. and Fox, G.A. (2003) Avian thyroid development in chemically contaminated environments: is there evidence of alterations in thyroid function and development?. Evolution and Development 5(1): 76-82.
McNabb, F.M.A. (2000) Sturkie’s Avian Physiology, Chapter 17: Thyroids pp: 461-469. Ed. G. Causey Whittow. Academic Press. San Diego, CA.
McNabb, F.M. (1995) Thyroid hormones, their activation, degradation and effects on metabolism. The Journal of Nutrition 125(6 Suppl.): 1773S-1776S.
Moccia, R.D., Fox, G.A., Britton, A. (1986) A quantitative assessment of thyroid histopathology of Herring gulls (Larus argentatus) from the great lakes and a hypothesis on the causal role of contaminants. Journal of Wildlife Diseases 22(1): 60-70.
Moccia, R.D., Leatherland, J.F., Sonstegard, R.A. (1981) Quantitative comparison of thyroid pathology in Great Lakes Coho (Oncorhynchus kisutch) and Chinook (Oncorhynchus tschawytscha) salmon. Cancer Research 41: 2200-2210.
Mommsen, T.P. (1998) The Physiology of Fishes, 2nd Edition. Ed. David H. Evans. CRC Press. Boca Raton, FL..
Mondou, P.M. and Kaltenbach, J.C. (1979) Thyroxine concentrations in blood serum and pericardial fluid of metamorphosing tadpoles and of adult frogs. General and Comparative Endocrinology 39: 343-349.
94
Monteverdi, G.H. and DiGuilio, R.T. (2000) Vitellogenin association and oocytic accumulation of thyroxine and 3,5,3’- triiodothyronine in gravid Fundulus heteroclitus. General and Comparative Endocrinology 120: 198-211.
Nishimura, N., Miyabara, Y., Sato, M., Yonemoto, J., Tohyama, C. (2002) Immunohistochemical localization of thyroid stimulating hormone induced by a low oral dose of 2,3,7,8-tetrachlorobenzo-p-dioxin in female Sprague-Dawley rats. Toxicology 171(2-3): 73-82.
Norman, A.W. and Litwack, G. (1997) Hormones, 2nd Edition. Academic Press. San Diego, CA.
Olson, J.M., McNabb, F.M.A., Jablonski, M.S., Ferris, D.V. (1999) Thyroid development in relation to the development of endothermy in the red Winged Blackbird (Agelaius phoeniceus). General and Comparative Endocrinology 116: 204-212.
O’Steen, S. and Janzen, F.J. (1999) Embryonic temperature affects metabolic compensation and thyroid hormones in hatchling snapping turtles. Physiol. Biochem. Zool. 72: 520-533.
Parkinson, A. (2001)Cassarett and Doull’s Toxicology. The Basic Science of Poisons, 6th Edition. Chapter 6: Biotransformation of Xenobiotics. Ed. Curtis D. Klaassen. McGraw-Hill Medical Publishing Division. New York, NY..
Plowman, M.M. and Lynn, W.G. (1973) The role of thyroid in testicular function in the gecko, Coleonyx variegatus. General and Comparative Endocrinology 20: 342-346.
Porterfield, S.P. (1994) Vulnerability of the developing brain to thyroid abnormalities: environmental insults to the thyroid system. Environmental Health Perspectives 102 (Suppl. 2): 125-130.
Prapunpoj, P., Richardson, S.J., Schreiber, G. (2002) Crocodile transthyretin: structure, function, and evolution. Am. J. Physiol. Inter. Comp. Physiol. 283: R885-R896.
Prati, M., Calvo, R., Morreale de Escobar, G. (1992) L-thyroxine and 3,5,3’- triiodothyronine concentrations in the chicken egg and in the embryo before and after the onset of thyroid function. Endocrinology 130(5): 2651-2659.
Rauschenberger, R.H. (2004) Developmental mortality in American alligators (Alligator mississippiensis) exposed to organochlorine pesticides. PhD dissertation. University of Florida.
Rauschenberger, H.R., Sepúlveda, M.S., Wiebe, J.J., Szabo, N.J., Gross, T.S. (2004) Predicting maternal body burdens of organochlorine pesticides from eggs and evidence of maternal transfer in Alligator mississippiensis. Environmental Toxicology and Chemistry 23(12): 2906-2915.

95
Rauschenberger, R.H., Wiebe, J.J., Buckland, J.E., Smith, J.T., Sepúlveda, M.S., Gross, T.S. (2004) Achieving environmentally relevant organochlorine pesticide concentrations in eggs through maternal exposure in Alligator mississippiensis. Marine Environmental Research 58: 851-856.
Rice, K.G., Percival, H.F., Woodward, A.R., Abercrombie, C.L. (1998) Population dynamics of Lake Apopka’s alligators. pp. 191-205 in Crocodiles. Proceedings of the 14th Working Meeting of the Crocodile Specialist Group, IUCN – The World Conservation Union, Gland, Switzerland and Cambridge UK.
Richardson, S.J., Monk, J.A., Shepherdley, C.A., Ebbesson, L.O.E., Sin, F., Power, D.M., Frappell, P.B., Köhrle, J., Renfree, M.B. (2005) Developmentally regulated thyroid hormone distributor in marsupials, a reptile and fishes. Am. J. Physiol. Comp. Physiol. 288(5): R1264-R1272.
Rickenbacher, U., McKinney, J.D., Oatley, S.J., Blake, C.C.F. (1986) Structurally specific binding of halogenated biphenyls to thyroxine transport protein. Journal of Medicinal Chemistry 29: 641-648.
Rolland, R.M. (2000) A review of chemically-induced alterations in thyroid and vitamin a status from field studies of wildlife and fish. Journal of Wildlife Diseases 36(4): 615-635.
Rotstein, D.S., Schoeb, T.R., Davis, L.M., Glenn, T.C., Arnold, B.S., Gross, T.S. (2002) Detection by microsatellite analysis of early embryonic mortality in an alligator population in Florida. J. Wildl. Dis. 38:160-165.
Rousset, B.A., Dunn, J.T. (2004) The Thyroid and Its Diseases. Chapter 2: Thyroid Hormone Synthesis and Secretion from www.thyroidmanager.org/Chapter2/2-text.htm on 5/18/04.
Schelske, C.L., Lowe, E.F., Battoe, L.E., Brenner, M., Coveney, M.F., Kenney, W.F. (2005) Abrupt biological response to hydrologic and land-use changes in lake Apopka Florida, USA. Ambio 34(3): 192-198.
Schelske, C. and Brezonik, P. (1992) Can Lake Apopka be restored? from: Restoration of Aquatic Ecosystems: Science, Technology, and Public Policy. pp. 393-398. National Academy Press. Washington, D.C..
Schew, W.A., McNabb, F.M.A., Scanes, C.G. (1996) Comparison of the ontogenesis of thyroid hormones, growth hormone, and insulin-like growth factor-I in ad libitum and food-restricted (altricial) European starlings and (precocial) Japanese quail. General and Comparative Endocrinology 101: 304-316.
Scollon, E.J., Carr, J.A., Cobb, G.P. (2004) The effect of flight, fasting and p,p’-DDT on thyroid hormones and corticosterone in Gambel’s white-crowned sparrow, Zonotrichia leucophrys gambelli. Comparative Biochemistry and Physiology Part C 137: 179-189.

96
Sechman, A. and Bobeck, S. (1988) Presence of iodothyronines in the yolk of a hen’s egg. General and Comparative Endocrinology 69: 99-105.
Sellers, J.C., Wit, L.C., Ganjam, V.K., Ethridge, K.A., Ragland, I.M. (1982) Seasonal plasma T4 titers in the hibernating lizard Cnemidophorus sexlineatus. General and Comparative Endocrinology 46: 24-28.
Shepherdley, C.A., Richardson, S.J., Evans, B.K., Kuhn, E.R., Darras, V.M. (2002) Characterization of outer ring iodothyronine deiodinases in tissues of saltwater crocodiles. General and Comparative Endocrinology 125:387-398.
Sonstegard, R. and Leatherland, J.F. (1976) The epizootiology and pathogenesis of thyroid hyperplasia in Coho salmon (Oncorhynchus kisutch) in Lake Ontario. Cancer Research 36: 4467-4475.
Sullivan, C.G., Iwamoto, R.N., Dickhoff, W.W. (1987) Thyroid hormones in blood plasma of developing salmon embryos. General and Comparative Endocrinology 65: 337-345.
Suzuki, S. and Suzuki, M. (1981) Changes in thyroidal and plasma iodine compounds during and after metamorphosis of the bullfrog, Rana catesbeiana. General and Comparative Endocrinology 45: 74-81.
Tagawa, M. and Hirano, T. (1987) Presence of thyroxine in eggs and changes in its content during early development of chum salmon, Oncorhynchus keta. General and Comparative Endocrinology 68: 129-135.
Van den Berg, K.J., van Raaij, J.A.G.M., Bragt, P.C., Notten, W.R.F. (1991) Interactions of halogenated industrial chemicals with transthyretin and effects on thyroid hormone levels in vivo. Archives of Toxicology 65: 15-19.
Verreault, J., Skaare, J.U., Jenssen, B.M., Gabrielsen, G.W. (2004) Effects of organochlorine contaminants on thyroid hormone levels in artic breeding Glaucous gulls, Larus hyperboreus. Environmental Health Perspectives 112(5): 532-537.
Very, N.M. and Sheridan, M.A. (2002) The role of somatostatins in the regulation of growth in fish. Fish Physiology and Biochemistry 27: 217-226.
Wade, M.G., Parent, S., Finnson, K.W., Foster, W., Younglai, E., McMahon, A., Cyr, D.G., Hughes, C. (2002) Thyroid toxicity due to subchronic mixture of 16 organochlorines, lead, and cadmium. Toxicological Sciences 67: 207-218.
Waritz, R.S., Steinberg, M., Kinoshita, F.K., Kelly, C.M., Richter, W.R. (1996) Thyroid function and thyroid tumors in toxaphene-treated rats. Regulatory Toxicology and Pharmacology 24: 184-192.
Webb, G.J.W. and Manolis, S.C. (1989) Crocodiles of Australia. Reed Books Pty. NSW, Australia.

97
Wiebe, J.J., Sepúlveda, M.S., Buckland, J.S., Harvey, A., Rauschenberger, H.R., Gross, T.S. (2002) Alligator embryo and hatchling growth from contaminated and clean lakes in central Florida. 16th Working Meeting of the Crocodile Specialist Group, Gainesville, FL, Oct 7-10.
Wiebe, J.J., Rotstein, D. Percival, H.F., Woodward, A., Schoeb, T., Gross, T.S. (2001) Evidence of developmental toxicity in the American alligator from central Florida lakes. 20th Annual Meeting of the Society of Environmental Toxicology and Chemistry Abstract Book. November 15-19. San Francisco, CA. pp. 231.
Willingham, E. (2001) Embryonic exposure to low-dose pesticides: effects of growth rate in the hatchling red-eared slider turtle. Journal of Toxicology and Environmental Health, Part A 64: 257-272.
Wilson, F.E. and Reinert, B.D. (1999) Long days and thyroxine program American tree sparrows for seasonality: evidence for temporal flexibility for the breeding of euthyroid females. General and Comparative Endocrinology 113: 136-145.
Woodward, A.R., Percival, H.F., Jennings, M.L., Moore, C.T (1993) Low clutch viability of American alligators on Lake Apopka. Florida Scientist 56(1): 52-63.
Wu, T.H., Rainwater, T.R., Platt, S.G., McMurry, S.T., Anderson, T.A. (2000) Organochlorine contaminants in Morelet’s crocodile (Crocodylus moreletii) from Belize. Chemosphere 40: 671-678.
Yntema, C.L. (1968) A series of stages in embryonic development of Chelydra serpetina. Journal of Morphology 125: 219-252.
Zhou, T., John-Alder, H., Weis, P., Weis, J.S. (1999) Thyroidal status of mummichogs (Fundulus heteroclitus) from polluted versus a reference habitat. Environmental Toxicology and Chemistry 18(12): 2817-2823.

98
BIOGRAPHICAL SKETCH
Jonathan James Wiebe was born on December 15, 1969, in Pensacola, Florida, and
is the son of Ralph and Linda Wiebe. Jon graduated from Gainesville High School in
1986 and received a BS in wildlife management from the University of Florida in 2000.
Jon has spent an extensive amount of his professional career in the care of large and
diverse animal collections among various zoological and private collections. The
majority of Jon’s professional career has been spent in the laboratory of Dr. Tim Gross.
This laboratory specializes in examining the effects of environmental stressors on
reproductive and growth parameters in a variety of different species. Jon is particularly
proud of the collaborative work that he has achieved with Dr. Tim Gross, Dr. Heath
Rauschenberger and Janet Scarborough in the area of alligator ecotoxicology.