An Analysis of Hatchling Resting Metabolism: In Search … ANALYSIS OF HATCHLING METABOLISM 615...
18
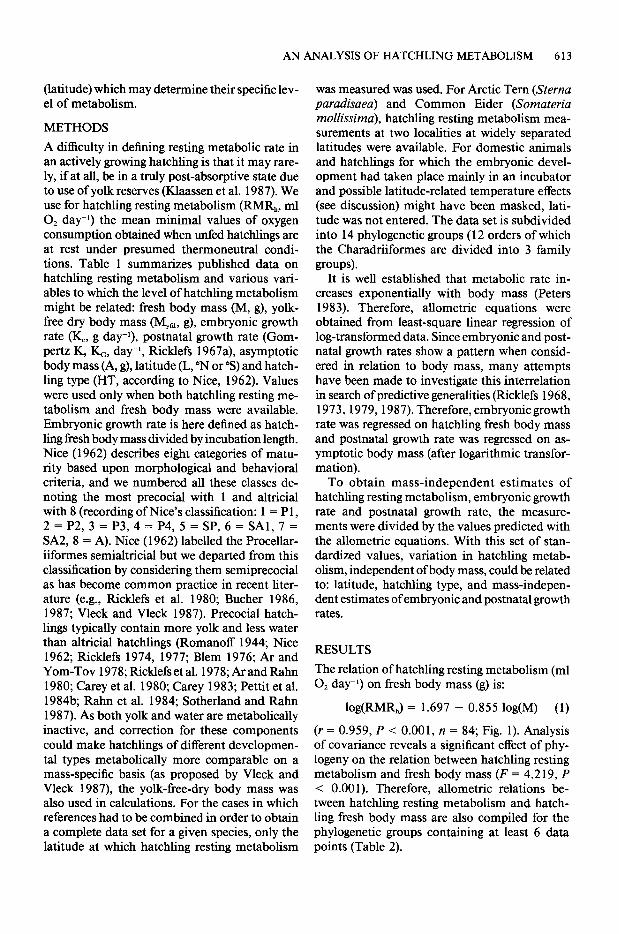
The Condor 93~612-629 0 The CooperOrnithological Society 199 1 AN ANALYSIS OF HATCHLING RESTING METABOLISM: IN SEARCH OF ECOLOGICAL CORRELATES THAT EXPLAIN DEVIATIONS FROM ALLOMETRIC RELATIONS MARCEL KLAASSEN~ AND RUDOLF DRENT Zoological Laboratory, University of Groningen, P.O. Box 14, 9750 AA Haren, The Netherlands and 2Research Institutefor Nature Management (RIN), P.O. Box 9201, 6800 HB Arnhem, The Netherlands Abstract. From data in the literature, an allometric equation is compiled for hatchling resting metabolic rate and an attempt is made to explain residual variation in terms of hatchling type, yolk and water content, embryonic and postnatalgrowth rate, and environ- mental circumstances (latitudinal distribution). The body massexponent for restingmetab- olism in hatchlings was 0.86 and, thus, substantially different from the values compiled for adult birds (0.67475). Relatively high hatchling metabolic rates were found for birds exhibiting high embryonic and postnatal growth rates,aswell asfor thosespecies that hatched at high latitudes.A functional explanationis postulated for the correlations betweenhatchling metabolism and these three variables. Key words: Hatchling; resting metabolic rate; allometric relation; hatchlingtype;growth rate; latitude; chick energetics. INTRODUCTION Birds enter their world under varying circum- stances: close to the poles the tiny neonates have to cope with extreme cold, whereas in the tropics they must deal with high temperatures and pos- sible overheating. Superimposed on these ther- mal challengesof the environment is the unpre- dictability of the food supply. Neonates differ in many respects, categorized in the familiar di- chotomy of altricial/precocial or the more refined gradient proposed by Nice (1962). Attempts to unravel adaptive responses governing avian on- togeny have sufferedfrom the lack of a frame of reference. It is our conviction that resting met- abolic rate can, in fact, provide a standard of comparison, and we will seekto show that adap- tive responses in the level of metabolism do exist and transcend the ontogenetic classification. Historically, the search for an allometric re- lationship of resting metabolic rate with body mass valid for all birds was the goal. Starting with Brody and Proctor (1932), resting metabolic rate has been measured extensively in adults and many analyseshave defined the relationship be- tween this measure of metabolism and body mass. However, it was not until recently that deviation from allometric equations of resting metabolism 1Received 17 December 1990. Final acceptance 8 May 1991. for specific groups of birds, species, or even in- dividuals claimed attention. Often these meta- bolic deviations are related to phylogeny in ad- dition to the specific physiology, morphology, behavior and ecologyof the adult birds (e.g., Ellis 1984; Kersten and Piersma 1987; Bennett and Harvey 1987; McNab 1988; Daan et al. 1989, 1990). During growth, an individual animal changes drastically in an array of ways. To easeinterpre- tation of the variation in resting metabolism be- tween species, one prerequisite is that the ani- mals in the analysis should be in a comparable developmental state. Hatching is a well-defined time point during growth from zygote to adult and is a logical choice. So far, analyses of hatch- ling resting metabolism have been restricted to relatively few bird speciesand have dealt with only a few possible correlates(e.g., Ackerman et al. 1980; Dawson and Bennett 1980; Bryant and Hails 1983; Bucher 1983, 1986, 1987; Brown and Adams 1988; Drent and Klaassen 1989; Klaassen et al. 1989a, 1989~). In this review, we determine an allometric equation from the data now available on hatchling resting metabolism. In addition, we provide an interpretation of de- viation in metabolic rate from predicted values in the light of some specific physiological, mor- phological, behavioral and ecological character- isticsof the hatchlings (namely: ontogenetictype, water and yolk content, embryonic and postnatal growth rate) and environmental circumstances [6121
Transcript of An Analysis of Hatchling Resting Metabolism: In Search … ANALYSIS OF HATCHLING METABOLISM 615...

The Condor 93~612-629 0 The Cooper Ornithological Society 199 1
AN ANALYSIS OF HATCHLING RESTING METABOLISM: IN SEARCH OF ECOLOGICAL CORRELATES THAT EXPLAIN
DEVIATIONS FROM ALLOMETRIC RELATIONS
MARCEL KLAASSEN~ AND RUDOLF DRENT Zoological Laboratory, University of Groningen, P.O. Box 14, 9750 AA Haren, The Netherlands
and 2Research Institute for Nature Management (RIN), P.O. Box 9201, 6800 HB Arnhem, The Netherlands
Abstract. From data in the literature, an allometric equation is compiled for hatchling resting metabolic rate and an attempt is made to explain residual variation in terms of hatchling type, yolk and water content, embryonic and postnatal growth rate, and environ- mental circumstances (latitudinal distribution). The body mass exponent for resting metab- olism in hatchlings was 0.86 and, thus, substantially different from the values compiled for adult birds (0.67475). Relatively high hatchling metabolic rates were found for birds exhibiting high embryonic and postnatal growth rates, as well as for those species that hatched at high latitudes. A functional explanation is postulated for the correlations between hatchling metabolism and these three variables.
Key words: Hatchling; resting metabolic rate; allometric relation; hatchling type; growth rate; latitude; chick energetics.
INTRODUCTION
Birds enter their world under varying circum- stances: close to the poles the tiny neonates have to cope with extreme cold, whereas in the tropics they must deal with high temperatures and pos- sible overheating. Superimposed on these ther- mal challenges of the environment is the unpre- dictability of the food supply. Neonates differ in many respects, categorized in the familiar di- chotomy of altricial/precocial or the more refined gradient proposed by Nice (1962). Attempts to unravel adaptive responses governing avian on- togeny have suffered from the lack of a frame of reference. It is our conviction that resting met- abolic rate can, in fact, provide a standard of comparison, and we will seek to show that adap- tive responses in the level of metabolism do exist and transcend the ontogenetic classification.
Historically, the search for an allometric re- lationship of resting metabolic rate with body mass valid for all birds was the goal. Starting with Brody and Proctor (1932), resting metabolic rate has been measured extensively in adults and many analyses have defined the relationship be- tween this measure of metabolism and body mass. However, it was not until recently that deviation from allometric equations of resting metabolism
1 Received 17 December 1990. Final acceptance 8 May 1991.
for specific groups of birds, species, or even in- dividuals claimed attention. Often these meta- bolic deviations are related to phylogeny in ad- dition to the specific physiology, morphology, behavior and ecology of the adult birds (e.g., Ellis 1984; Kersten and Piersma 1987; Bennett and Harvey 1987; McNab 1988; Daan et al. 1989, 1990).
During growth, an individual animal changes drastically in an array of ways. To ease interpre- tation of the variation in resting metabolism be- tween species, one prerequisite is that the ani- mals in the analysis should be in a comparable developmental state. Hatching is a well-defined time point during growth from zygote to adult and is a logical choice. So far, analyses of hatch- ling resting metabolism have been restricted to relatively few bird species and have dealt with only a few possible correlates (e.g., Ackerman et al. 1980; Dawson and Bennett 1980; Bryant and Hails 1983; Bucher 1983, 1986, 1987; Brown and Adams 1988; Drent and Klaassen 1989; Klaassen et al. 1989a, 1989~). In this review, we determine an allometric equation from the data now available on hatchling resting metabolism. In addition, we provide an interpretation of de- viation in metabolic rate from predicted values in the light of some specific physiological, mor- phological, behavioral and ecological character- istics of the hatchlings (namely: ontogenetic type, water and yolk content, embryonic and postnatal growth rate) and environmental circumstances
[6121
AN ANALYSIS OF HATCHLING METABOLISM 613
(latitude) which may determine their specific lev- el of metabolism.
METHODS
A difficulty in defining resting metabolic rate in an actively growing hatchling is that it may rare- ly, if at all, be in a truly post-absorptive state due to use of yolk reserves (Klaassen et al. 1987). We use for hatchling resting metabolism (RMR,, ml 0, day-‘) the mean minimal values of oxygen consumption obtained when unfed hatchlings are at rest under presumed thermoneutral condi- tions. Table 1 summarizes published data on hatchling resting metabolism and various vari- ables to which the level of hatchling metabolism might be related: fresh body mass (M, g), yolk- free dry body mass (M,,, g), embryonic growth rate (K, g day-‘), postnatal growth rate (Gom- pertz K, I(G, day-‘, Ricklefs 1967a), asymptotic body mass (A, g), latitude (L, “N or “S) and hatch- ling type (HT, according to Nice, 1962). Values were used only when both hatchling resting me- tabolism and fresh body mass were available. Embryonic growth rate is here defined as hatch- ling fresh body mass divided by incubation length. Nice (1962) describes eight categories of matu- rity based upon morphological and behavioral criteria, and we numbered all these classes de- noting the most precocial with 1 and altricial with 8 (recording of Nice’s classification: 1 = P 1, 2 = P2, 3 = P3,4 = P4, 5 = SP, 6 = SAl, 7 = SA2, 8 = A). Nice (1962) labelled the Procellar- iiformes semialtricial but we departed from this classification by considering them semiprecocial as has become common practice in recent liter- ature (e.g., Ricklefs et al. 1980; Bucher 1986, 1987; Vleck and Vleck 1987). Precocial hatch- lings typically contain more yolk and less water than altricial hatchlings (Romanoff 1944; Nice 1962; Ricklefs 1974, 1977; Blem 1976; Ar and Yom-Tov 1978; Ricklefs et al. 1978; Ar and Rahn 1980; Carey et al. 1980; Carey 1983; Pettit et al. 19846 Rahn et al. 1984; Sotherland and Rahn 1987). As both yolk and water are metabolically inactive, and correction for these components could make hatchlings of different developmen- tal types metabolically more comparable on a mass-specific basis (as proposed by Vleck and Vleck 1987) the yolk-free-dry body mass was also used in calculations. For the cases in which references had to be combined in order to obtain a complete data set for a given species, only the latitude at which hatchling resting metabolism
was measured was used. For Arctic Tern (Sterna paradisaea) and Common Eider (Somateria mollissima), hatchling resting metabolism mea- surements at two localities at widely separated latitudes were available. For domestic animals and hatchlings for which the embryonic devel- opment had taken place mainly in an incubator and possible latitude-related temperature effects (see discussion) might have been masked, lati- tude was not entered. The data set is subdivided into 14 phylogenetic groups (12 orders of which the Charadriiformes are divided into 3 family groups).
It is well established that metabolic rate in- creases exponentially with body mass (Peters 1983). Therefore, allometric equations were obtained from least-square linear regression of log-transformed data. Since embryonic and post- natal growth rates show a pattern when consid- ered in relation to body mass, many attempts have been made to investigate this interrelation in search of predictive generalities (Ricklefs 1968, 1973,1979,1987). Therefore, embryonicgrowth rate was regressed on hatchling fresh body mass and postnatal growth rate was regressed on as- ymptotic body mass (after logarithmic transfor- mation).
To obtain mass-independent estimates of hatchling resting metabolism, embryonic growth rate and postnatal growth rate, the measure- ments were divided by the values predicted with the allometric equations. With this set of stan- dardized values, variation in hatchling metab- olism, independent of body mass, could be related to: latitude, hatchling type, and mass-indepen- dent estimates of embryonic and postnatal growth rates.
RESULTS
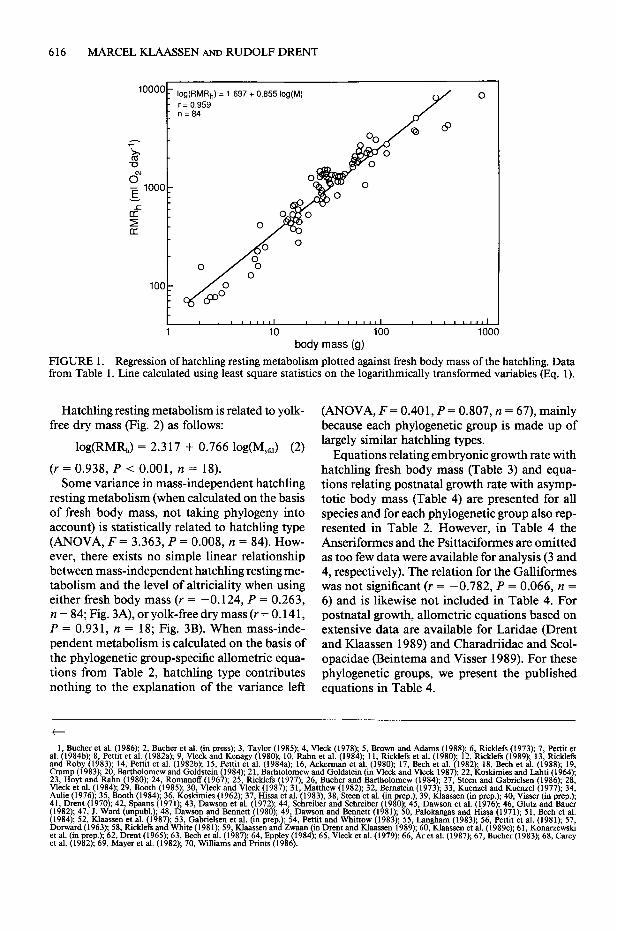
The relation of hatchling resting metabolism (ml 0, day-l) on fresh body mass (g) is:
log(RMRd = 1.697 + 0.855 log(M) (1)
(r = 0.959, P < 0.001, n = 84; Fig. 1). Analysis of covariance reveals a significant effect of phy- logeny on the relation between hatchling resting metabolism and fresh body mass (F = 4.219, P < 0.001). Therefore, allometric relations be- tween hatchling resting metabolism and hatch- ling fresh body mass are also compiled for the phylogenetic groups containing at least 6 data points (Table 2).
614 MARCEL KLAASSEN AND RUDOLF DRENT
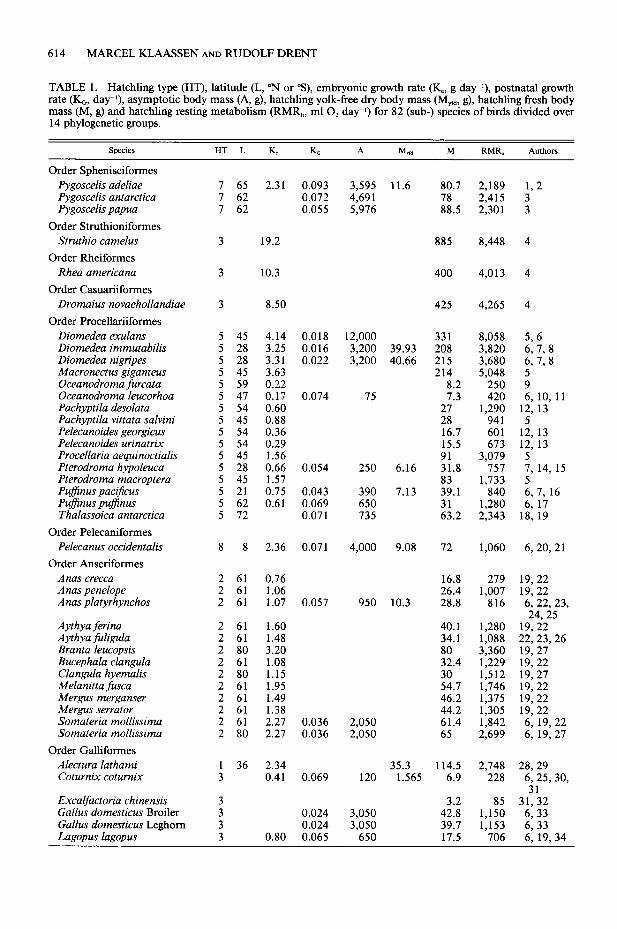
TABLE 1. Hatchling type (HT), latitude (L, “N or “s), embryonic growth rate (K_ g day-‘), postnatal growth rate (I(G, day-*), asymptotic body mass (A, g), hatchling yolk-free dry body mass (Myfd, g), hatchling fresh body mass (M, g) and hatchling resting metabolism (RMR,, ml 0, day-r) for 82 (sub-) species of birds divided over 14 phylogenetic groups.
Species HT L K K, A M, M RMR, Authon
Order Sphenisciformes
Pygoscelis adeliae Pygoscelis antarctica Pygoscelis Papua
Order Struthioniformes
Struthio camelus
Order Rheiformes
Rhea americana
Order Casuariiformes
Dromaius novaehollandiae
Order Procellariiformes
Diomedea exulans Diomedea immutabilis Diomedea nigripes Macronectus giganteus Oceanodroma jiurcata Oceanodroma leucorhoa Pachyptila desolata Pachyptila vittata salvini Pelecanoides georgicus Pelecanoides urinatrix Procellaria aequinoctialis Pterodroma hypoleuca Pterodroma macroptera Pufjinus pactjicus Pufinus pufinus Thalassoica antarctica
Order Pelecaniformes
Pelecanus occidentalis
Order Anseriformes
Anas crecca Anas penelope Anas platyrhynchos
Aythya ferina Aythya fuligula Branta leucopsis Bucephala clangula Clangula hyemalis Melanitta fusca Mergus merganser Mergus serrator Somateria mollissima Somateria mollissima
Order Galliformes
Alectura lathami Coturnix coturnix
Excalfactoria chinensis Gallus domesticus Broiler Gallus domesticus Leghorn Lagopus lagopus
7 65 2.31 0.093 3,595 11.6 80.7 2,189 I 62 0.072 4,691 78 2,415 I 62 0.055 5,916 88.5 2,301
1, 2
i
3 19.2 885 8.448 4
3 10.3 400 4,013 4
3 8.50 425 4,265 4
5 45 4.14 0.018 5 28 3.25 0.016 5 28 3.31 0.022 5 45 3.63 5 59 0.22 5 41 0.17 0.074 5 54 0.60 5 45 0.88 5 54 0.36 5 54 0.29 5 45 1.56 5 28 0.66 0.054 5 45 1.57 5 21 0.75 0.043 5 62 0.61 0.069 5 72 0.071
12,000 3,200 39.93 3,200 40.66
15
250 6.16
390 7.13 650 135
331 8,058 208 3,820 215 3,680 214 5,048
8.2 250 7.3 420
27 1,290 28 941 16.7 601 15.5 673 91 3,079 31.8 757 83 1,733 39.1 840 31 1,280 63.2 2,343
?!: 8 6: 7: 8
; 6, 10, 11
12,13 5
12,13 12,13
5 7, 14, 15
2 7 16 6: li
18, 19
8 8 2.36 0.071 4,000 9.08 72 1,060 6, 20,21
2 61 0.16 2 61 1.06 2 61 1.07 0.051
2 61 1.60 2 61 1.48 2 80 3.20 2 61 1.08 2 80 1.15 2 61 1.95 2 61 1.49 2 61 1.38 2 61 2.27 0.036 2 80 2.27 0.036
950 10.3
16.8 279 26.4 1,001 28.8 816
19,22 19,22 6, 22,23, 24,25
19,22 22,23,26 19,27 19,22 19; 27 19.22
2,050 2,050
40.1 34.1
ii.4 30 54.1 46.2 44.2 61.4 65
1,280 1,088 3,360 1,229 1,512 1,746 1,375 1,305 1,842 2,699
19; 22 19,22 6, 19,22 6, 19,27
1 36 2.34 3 0.41 0.069
: 0.024 3 0.024 3 0.80 0.065
35.3 114.5 2,148 120 1.565 6.9 228
3,050 3,050
650
3.2 85 42.8 1,150 39.7 1,153 17.5 706
28,29 6, 25, 30, 31
31.32 6, 33 6, 33 6, 19, 34

AN ANALYSIS OF HATCHLING METABOLISM 615
TABLE 1. Continued.
Species HT L K. I<G A MY, M RMR, AlIthOTS
Leipoa ocellata 1 34 1.84 Lophortyx caltfornica 3 0.039 Phasianus colchinus 3 0.71 0.032
Tetrao urogallus 3 1.28
Order Charadriifonnes, family Charadiidae and Scolopacidae
Galinago media 3 62 0.65 Haematopus ostralegus 3 54 1.19 0.081 Limosa limosa - 3 53 1.21 0.085 Numenius arauata Philomachus pugnax
3 53 1.97 0.051 3 53 0.58 0.092 _ -
Tringa totanus 3 53 0.62 0.070 Vanellus vanellus 3 53 0.61 0.054
Order Charadriiformes, family Laridae
Larus argentatus 5 54 2.13 0.083 Larus atricilla 5 29 1.23 0.088
Larus delawarensis 5 45 0.099 Larus glaucescens 5 49 0.094 Larus occidentalis livens 5 29 0.080 Larus occidentalis wymani 5 33 2.15 Larus ridibundus 5 61 1.12 0.115 Rissa tridactvla 5 79 1.23 0.097 Anous minu& 5 23 0.48 0.152 Anous stolidus 5 23 0.81 0.103 Gygis alba 5 28 0.42 0.064 Sterna fuscata 5 25 0.55 0.073 Sterna hirundo 5 54 0.65 0.204
Sterna paradisaea 5 79 0.55 0.230 Sterna paradisaea 5 54 0.59 0.196 Sterna sandvicensis 5 54 1.05 0.175
Order Charadriiformes, family Alcidae
Alle alle 5 79 0.77 0.187 Cepphus columba 5 49 0.112 Fratercula arctica 5 65 1.07 0.101 Synthliboramphus 5 34
hypoleucus Uria lomvia 5 79 2.21
Order Columbiformes
Columba livia 8 0.88
Order Psittaciformes
Agapornis personata Agapornis roseicollis
! 0.11 0.24 0.12 0.23
Aratinga solstitialis 8 0.22 Bolborhynchus lineola
: 0.11 0.22
Enicognathus ferruginous 0.24 0.18 Melopsittacus undulatus 8 0.09
Order Passeriformes
Agelaius phoeniceus 8 35 0.32 Carduelis tristis 8 40 Passerculus 8 30
sandwichensis
170 900 3.65
114 2,216 7.0 161
17 367
31.9 1,520
466 273 990 125 137 236
3.70 15 648 30.93 1,392 27.8 873 55.2 1,603 13.4 480 14.2 441 17.1 449
1,150 350 5.149
57.4 1,901 28.4 1.356
403 927 900
281 449 117 190 115 205 130
105 110 180
3.82 5.58 3.60
34.6 1,345 60.3 1,766 65.4 2,119 58.0 2,060 26.8 1,460 33.1 1,123 16.8 524 28.52 690 16.1 470 21.0 529 14.9 537
12.0 547 13.03 457 25.25 763
125 425 390
22.4 1,258 37.5 1.332 41.9 1:317 24.8 1,071
74.1 2.240
1.634 15.0 384 30, 65, 66
48 2.51 77 67 52 0.359 2.76 77
63 187
6.02 130 2.32 70 6.57 190 1.67 65
31.4
3.50 103 68 1.51 72 69 2.05 158 70
28.35 6; 36 6. 23. 24. 36
19,37
19,38 39 40 40
6, 40 40 40
41,42 25, 30,43,
44 45,46 41.47
6; 48 30,49 19,46, 50 51, 52, 53 7, 54, 55 6, 7, 54 7, 56, 57 6, 58 6, 23, 58,
6’960 6: 59 6. 59
19,61 62
6, 19,63 64
19,63
30,67 26,67 67 67 67
616 MARCEL KLAASSEN AND RUDOLF DRENT
1 10 100 1000
body mass (g)
FIGURE 1. Regression of hatchling resting metabolism plotted against fresh body mass of the hatchling. Data from Table 1. Line calculated using least square statistics on the logarithmically transformed variables (Eq. 1).
Hatchling resting metabolism is related to yolk- free dry mass (Fig. 2) as follows:
log(RMR,) = 2.317 + 0.766 log(M,,) (2)
(r = 0.938, P < 0.001, n = 18). Some variance in mass-independent hatchling
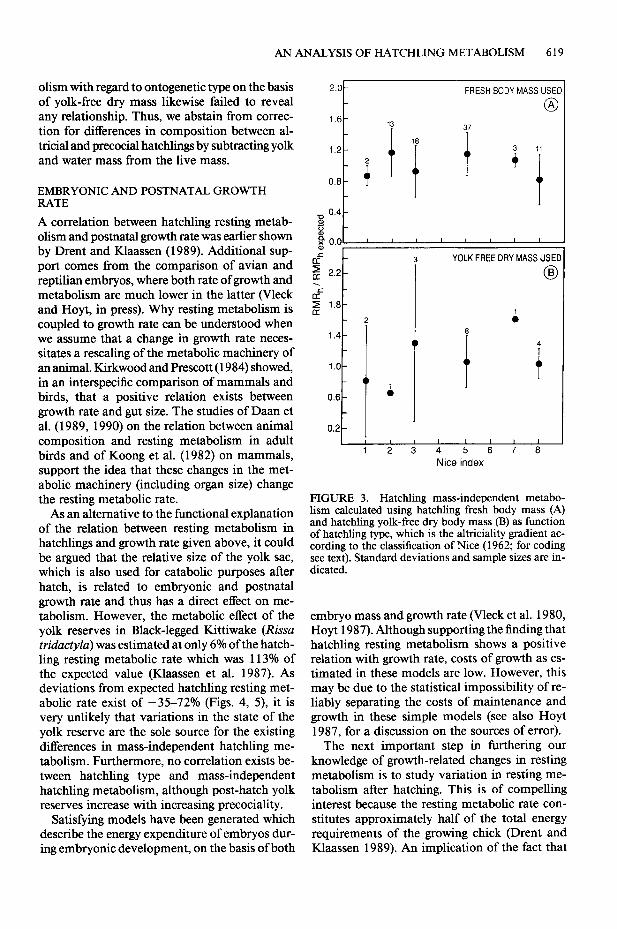
resting metabolism (when calculated on the basis of fresh body mass, not taking phylogeny into account) is statistically related to hatchling type (ANOVA, F = 3.363, P = 0.008, n = 84). How- ever, there exists no simple linear relationship between mass-independent hatchling resting me- tabolism and the level of altriciality when using either fresh body mass (r = -0.124, P = 0.263, n = 84; Fig. 3A), or yolk-free dry mass (r = 0.14 1, P = 0.931, n = 18; Fig. 3B). When mass-inde- pendent metabolism is calculated on the basis of the phylogenetic group-specific allometric equa- tions from Table 2, hatchling type contributes nothing to the explanation of the variance left
(ANOVA, F = 0.40 1, P = 0.807, n = 67) mainly because each phylogenetic group is made up of largely similar hatchling types.
Equations relating embryonic growth rate with hatchling fresh body mass (Table 3) and equa- tions relating postnatal growth rate with asymp- totic body mass (Table 4) are presented for all species and for each phylogenetic group also rep- resented in Table 2. However, in Table 4 the Anseriformes and the Psittaciformes are omitted as too few data were available for analysis (3 and 4, respectively). The relation for the Galliformes was not significant (r = -0.782, P = 0.066, n = 6) and is likewise not included in Table 4. For postnatal growth, allometric equations based on extensive data are available for Laridae (Drent and Klaassen 1989) and Charadriidae and Scol- opacidae (Beintema and Visser 1989). For these phylogenetic groups, we present the published equations in Table 4.
t
al. I, Bucher et al. (1986); 2, Bucher et al. (in press); 3, Taylor (1985); 4, Vleck (1978); 5, Brown and Adams (1988); 6, Ricklefs (1973); 7, Pettit et (1984b): 8, Pettit et al. (1982a); 9, Vleck and Kenagy (1980); 10, Rahn et al. (1984); 11, Ricklefs et al. (1980); 12, Ricklefs (1989); 13, Ricklefs
and Roby (1983); 14, Petit et al. (1982b); 15, Pettit et al. (1984a); 16, Ackerman et al. (1980); 17, Beth et al. (1982); 18, Beth et al. (1988); 19, Cramp (1983); 20, Bartholomew and Goldstein (1984); 21, Barhtolomew and Goldstein (in Vleck and Vleck 1987); 22, Koskimies and Lahti (1964); 23, Hoyt and Rahn (1980); 24, Romanoff (1967); 25, Ricklefs (1977); 26, Bucher and Bartholomew (1984); 27, Steen and Gabrielsen (1986); 28, Vleck et al. (1984); 29, Booth (1985); 301 Vleck and Vleck (1987); 31, Matthew (1982); 32, Bernstein (1973); 33, Kuenzel and Kuenzel (1977); 34, Aulie (1976); 35, Booth (1984); 36, Koslumies (1962); 37, Hissa et al. (1983); 38, Steen et al. (in prep.); 39, Khssen (in prep.); 40, Visser (in prep.); 41, Drent (1970); 42, Spans (1971); 43, Dawson et al. (1972); 44, Schreiber and Scbreiber (1980); 45, Dawson et al. (1976); 46, Glutz and Bauer (1982); 47, J. Ward (unpubl.); 48, Dawson and Bennett (1980); 49, Dawsan and Bennett (1981); 50, Palokangas and Hissa (1971); 51, Beth et al. (1984); 52, Klaassen et al. (1987); 53, Gabrielsen et al. (in prep.); 54, Pettit and Whittow (1983); 55, Langham (1983); 56, Pettit et al. (1981); 57, Dorward (1963); 58, Ricklefs and Wblte (1981); 59, Klaassen and Zwaan (in Drew and Klaassen 1989); 60, Klaassen et al. (1989~); 61, Konarzewslu et al. (in prep.): 62, Drent (1965); 63, Beth et al. (1987); 64, Eppley (1984); 65, Vleck et al. (1979); 66, Ar et al. (1987); 67, Bucher (1983); 68, Carey et al. (1982); 69, Mayer et al. (1982); 70, Williams and Pnnts (1986).

AN ANALYSIS OF HATCHLING METABOLISM 617
TABLE 2. Equations relating hatchling resting metabolism (RMR,, ml 0, day-l) with fresh body mass (M, g; log(RMRJ = a + b log(M)) for 6 phylogenetic groups containing at least 6 data points.
Phylogenetic group
Order Procellariiformes Order Anseriformes Order Galliformes
Order Charadriifomres Family Laridae Family Charadrlidae and Scolopacidae
Order Psittaciformes
a b n f
1.838 0.785 16 0.965 1.054 1.289 13 0.919 1.506 0.958 10 0.972
1.601 0.955 16 0.927 1.596 0.951 7 0.928 1.599 0.737 6 0.958
*In all cases P < 0.005.
Regressing mass-independent hatchling me- tabolism on mass-independent embryonic growth rate (Fig. 4) results in a positive correlation (r = 0.284, P = 0.028, n = 60) if only those species are used for which phylogenetic group-specific allometric equations are available. For the six phylogenetic groups treated here, a clear corre- lation between embryonic growth rate and hatch- ling metabolism is apparent within the phylo- genetic group only in the case of the Laridae (r = 0.686, P = 0.010, n = 13). The same analysis for mass-independent postnatal growth rate with hatchling metabolism (Fig. 5) revealed an in- crease in metabolism with growth rate (r = 0.465, P = 0.0 11, n = 29) if only those species are used for which phylogenetic group-specific equations are available.
Mass-independent hatchling metabolism is positively correlated with latitude both when Eq. 1 is used on all species for the calculation of mass-independent hatchling resting metabolism (r = 0.558, P < 0.001, n = 56) and when the phylogenetic group-specific allometric equations (Table 2) are used (r = 0.407, P = 0.003, n = 50; Fig. 6). Within the order Procellariiformes this correlation also is apparent (r = 0.552, P = 0.033, n = 15). Within the family Laridae, the only other phylogenetic group with enough data points and variation in latitude to allow the analysis, the relation is not significant (r = 0.442, P = 0.13 1, n = 13), although for the subfamily Ster- ninae it is (r = 0.899, P = 0.002, n = 8).
DISCUSSION
BODY SIZE
The exponent of the allometric equation relating hatchling resting metabolism with fresh body mass (0.855, Eq. 1) is well above the range of values so far found in adult birds (0.67-0.75).
The allometric equations within the phylogenetic groups (Table 2) show exponents in the range 0.7-1.3 and slightly higher than the exponents found in phylogenetic analyses of adult birds (Bennett and Harvey 1987). However, any at- tempt to explain the value of the exponent in the allometric relations of resting metabolism by a general principle is likely to fail (Calder 1987, Heusner 1987). One should, therefore, take Me- dawar’s (1950) advice, and ask whether the re- lationships found are expedient and useful.
Because the relation between resting metabo- lism and body mass of hatchlings (Eq. 1) is so different from that in adult birds, one should be careful to use the appropriate equation before attempting to generalize metabolic processes on a mass-specific basis. Heusner (1983, 1985) pro- posed dividing adult resting metabolic rate by body mass to the power 0.67 to allow direct com- parison between species. Applying this proce- dure for hatchling resting metabolic rate without adjusting the exponent from 0.67 to 0.86 (as em- pirically found here) would overestimate mass- independent hatchling resting metabolic rate val- ues.
PHYLOGENETIC CATEGORY
Discrimination for phylogenetic groups in adult birds results in different allometric relations for resting metabolism (e.g., Bennett and Harvey 1987). As shown by analysis of covariance (see results and Table 2), this also holds for hatch- lings. In addition to differences in embryonic and postnatal growth rate (Tables 3, 4), each phylo- genetic group has its specific habitat, mode of prey capture, daily rhythm, etc. Indeed, in adult birds it has been shown that confounding asso- ciations exist between resting metabolic rate among families and these behavioral and eco-

618 MARCEL KLAASSEN AND RUDOLF DRENT
10000 r
-7
D xl
0” E. loo0 :
.c
I
100:
lW(R’“‘Rh) r = 0.936 “=16
= 2.317 + 0.766 bg(b.$f,,)
t t I I I
0.1 1 10 100 yolk free dry body mass (g)
FIGURE 2. Hatchling resting metabolism plotted against hatchling yolk-free dry body mass. Data from Table 1. The least square regression line on the logarithmically transformed variables is indicated (Eq. 2).
logical variables. Probing analyses such as Ben- nett and Harvey (1987) conducted on the resting metabolism of adult birds are not yet possible for hatchlings as too few data are available. Thus, the metabolic implications of phylogeny related characteristics are not further examined here. By using the phylogenetic group-specific allometric equations from Tables 2, 3 and 4, variations in hatchling resting metabolic rate and embryonic and postnatal growth rate due to accidents of phylogeny are largely corrected for in our anal- yses.
HATCHLINd MATURITY AND BODY COMPOSITION
In an analysis of hatchling mass-independent resting metabolism, Bucher (1987) concluded that the level of metabolism at hatching varied as much between as within Nice’s categories. This agrees with Rahn and Whittow’s (1984) conclu- sion based on more limited data. Although no correlation exists, analysis of variance reveals a significant effect of hatchling type on hatchling resting metabolism, when phylogeny is not taken into account. When this is incorporated, no un- ambiguous effect of ontogenetic type on hatch- ling resting metabolism is apparent in our anal- ysis. This would suggest that ontogenetic novelties, as far as they are metabolically ex- pressed, arise in phylogenetic steps and not with- in phylogenetic lines.
Hatchlings of altricial species differ dramati- cally from precocial species in their yolk and water content (Romanoff 1944; Nice 1962; Rick- lefs 1974, 1977; Blem 1976; Ar and Yom-Tov 1978; Ricklefs et al. 1978; Ar and Rahn 1980; Careyetal. 1980;Carey 1983;Pettitetal. 1984b; Rahn et al. 1984; Sotherland and Rahn 1987). Water is metabolically inactive, and yolk has not been shown to exhibit any oxidative capacity (Steen and Gabrielsen 1986). Therefore, it has been practice to use yolk-free dry mass in met- abolic studies on hatchlings (Bucher 1986, 1987; Vleck and Vleck 1987) and embryos (Hoyt 1987). However, yolk reserves in hatchlings do increase metabolic rates (Klaassen et al. 1987), although the relationship between the absolute amount of yolk reserve and its metabolic effect remains un- analyzed. Water per se may be metabolically in- active, but this does not imply that the metabolic function of tissue is independent of water con- tent. For example, growth rates of chicks have been found to be closely related with water con- tent (Ricklefs 1967b, O’Connor 1977, Ricklefs and Webb 1985) and water content might there- fore be closely linked to metabolic performance. This is relevant to the concept of describing water content as an index of maturity (see Ricklefs 1979, Ricklefs and Webb 1985). Finally, in reptilian embryos the hydric conditions of the egg affect growth and metabolism (Vleck and Hoyt, in press). In any case, analysis of hatchling metab-
AN ANALYSIS OF HATCHLING METABOLISM 619
olism with regard to ontogenetic type on the basis of yolk-free dry mass likewise failed to reveal any relationship. Thus, we abstain from correc- tion for differences in composition between al- tricial and precocial hatchlings by subtracting yolk and water mass from the live mass.
EMBRYONIC AND POSTNATAL GROWTH RATE
A correlation between hatchling resting metab- olism and postnatal growth rate was earlier shown by Drent and Klaassen (1989). Additional sup- port comes from the comparison of avian and reptilian embryos, where both rate of growth and metabolism are much lower in the latter (Vleck and Hoyt, in press). Why resting metabolism is coupled to growth rate can be understood when we assume that a change in growth rate neces- sitates a resealing of the metabolic machinery of an animal. Kirkwood and Prescott (1984) showed, in an interspecific comparison of mammals and birds, that a positive relation exists between growth rate and gut size. The studies of Daan et al. (1989, 1990) on the relation between animal composition and resting metabolism in adult birds and of Koong et al. (1982) on mammals, support the idea that these changes in the met- abolic machinery (including organ size) change the resting metabolic rate.
As an alternative to the functional explanation of the relation between resting metabolism in hatchlings and growth rate given above, it could be argued that the relative size of the yolk sac, which is also used for catabolic purposes after hatch, is related to embryonic and postnatal growth rate and thus has a direct effect on me- tabolism. However, the metabolic effect of the yolk reserves in Black-legged Kittiwake (Rissa tridactyla) was estimated at only 6% of the hatch- ling resting metabolic rate which was 113% of the expected value (Klaassen et al. 1987). As deviations from expected hatchling resting met- abolic rate exist of -35-72% (Figs. 4, 5), it is very unlikely that variations in the state of the yolk reserve are the sole source for the existing differences in mass-independent hatchling me- tabolism. Furthermore, no correlation exists be- tween hatchling type and mass-independent hatchling metabolism, although post-hatch yolk reserves increase with increasing precociality.
Satisfying models have been generated which describe the energy expenditure of embryos dur- ing embryonic development, on the basis of both
LO- FRESH BODY MASS USE[
@ 1.6
1.2
i "
0.8
t
.o.o~ YOLK FREE DRY MASS USEC
2.2 @
I I I I I I I I
1 2 3 4 5 6 7 6 Nice index
FIGURE 3. Hatchling mass-independent metabo- lism calculated using hatchling fresh body mass (A) and hatchling yolk-free dry body mass (B) as function of hatchling type, which is the altriciality gradient ac- cording to the classification of Nice (1962; for coding see text). Standard deviations and sample sizes are in- dicated.
embryo mass and growth rate (Vleck et al. 1980, Hoyt 1987). Although supporting the finding that hatchling resting metabolism shows a positive relation with growth rate, costs of growth as es- timated in these models are low. However, this may be due to the statistical impossibility of re- liably separating the costs of maintenance and growth in these simple models (see also Hoyt 1987, for a discussion on the sources of error).
The next important step in furthering our knowledge of growth-related changes in resting metabolism is to study variation in resting me- tabolism after hatching. This is of compelling interest because the resting metabolic rate con- stitutes approximately half of the total energy requirements of the growing chick (Drent and Klaassen 1989). An implication of the fact that
620 MARCEL KLAASSEN AND RUDOLF DRENT
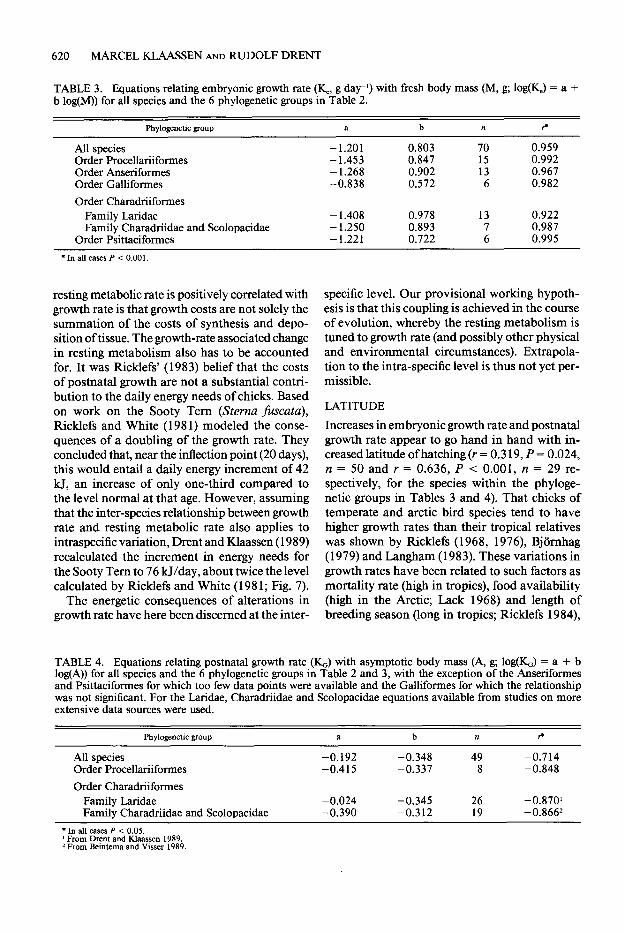
TABLE 3. Equations relating embryonic growth rate (K_ g day-l) with fresh body mass (M, g; log(&) = a + b log(M)) for all species and the 6 phylogenetic groups in Table 2.
Phylogenetic group
All species Order Procellariiformes Order Anseriformes Order Galliformes
Order Charadriiformes Family Iaridae Family Charadriidae and Scolopacidae
Order Psittaciformes
a b
- 1.201 0.803 - 1.453 0.847 - 1.268 0.902 -0.838 0.572
- 1.408 0.978 - 1.250 0.893 - 1.221 0.722
n ?
70 0.959 15 0.992 13 0.967 6 0.982
13 0.922 0.987
2 0.995
resting metabolic rate is positively correlated with growth rate is that growth costs are not solely the summation of the costs of synthesis and depo- sition of tissue. The growth-rate associated change in resting metabolism also has to be accounted for. It was Ricklefs’ (1983) belief that the costs of postnatal growth are not a substantial contri- bution to the daily energy needs of chicks. Based on work on the Sooty Tern (Sterna jiiscata), Ricklefs and White (198 1) modeled the conse- quences of a doubling of the growth rate. They concluded that, near the inflection point (20 days), this would entail a daily energy increment of 42 kJ, an increase of only one-third compared to the level normal at that age. However, assuming that the inter-species relationship between growth rate and resting metabolic rate also applies to intraspecific variation, Drent and Klaassen (1989) recalculated the increment in energy needs for the Sooty Tern to 76 W/day, about twice the level calculated by Ricklefs and White (198 1; Fig. 7).
The energetic consequences of alterations in growth rate have here been discerned at the inter-
specific level. Our provisional working hypoth- esis is that this coupling is achieved in the course of evolution, whereby the resting metabolism is tuned to growth rate (and possibly other physical and environmental circumstances). Extrapola- tion to the intra-specific level is thus not yet per- missible.
LATITUDE
Increases in embryonic growth rate and postnatal growth rate appear to go hand in hand with in- creased latitude of hatching (r = 0.3 19, P = 0.024, n = 50 and r = 0.636, P -C 0.001, n = 29 re- spectively, for the species within the phyloge- netic groups in Tables 3 and 4). That chicks of temperate and arctic bird species tend to have higher growth rates than their tropical relatives was shown by Ricklefs (1968, 1976), Bjomhag (1979) and Langham (1983). These variations in growth rates have been related to such factors as mortality rate (high in tropics), food availability (high in the Arctic; Lack 1968) and length of breeding season (long in tropics; Ricklefs 1984),
TABLE 4. Equations relating postnatal growth rate (KJ with asymptotic body mass (A, g; log&) = a + b log(A)) for all species and the 6 phylogenetic groups in Table 2 and 3, with the exception of the Anseriformes and Psittacifotmes for which too few data points were available and the Galliformes for which the relationship was not significant. For the Laridae, Charadriidae and Scolopacidae equations available from studies on more extensive data sources were used.
Phylogenetic group a b n f
All species -0.192 -0.348 49 -0.714 Order Procellariiformes -0.415 -0.337 8 -0.848
Order Charadriiformes Family Laridae -0.024 -0.345 26 -0.870’ Family Charadriidae and Scolopacidae -0.390 -0.312 19 -0.8662
*In all cases P < 0.05. ’ From Drent and Klaassen 1989. * From Beintema and Visser 1989

AN ANALYSIS OF HATCHLING METABOLISM 621
1.8 Oall points y=O.49 + 0.53x, r=0.284, ~~0.028, n&O l Laridae y=O.l3 + 0.89x, k0.686, p=O.OlO, n=13 I
n I- 1.6
0.6-
0
I I I I I I 1 I I I
0.6 0.8 1 .o 1.2 1.4
Ke/ Ke expected
FIGURE 4. Relationship between mass-independent hatchling metabolism and mass-independent embryonic growth rate. Closed symbols: Laridae; open symbols: all other species for the phylogenetic groups in Table 3. Indicated is the calculated least square regression line.
which all favor increasing growth rates with lat- phylogenetic groups in Tables 3 and 4 (Y = 0.474, itude. P = 0.017, n = 25). The relation is significant
In addition, hatchling metabolism likewise in- within a phylogenetic group only for the Laridae creases as place of birth approaches the poles (r = 0.792, P = 0.002, n = 12). Other studies (Fig. 6). Post-hatch growth rate also is higher supporting a close link between embryonic and when embryonic growth rate is high. This rela- postnatal growth include Lack (1968), Drent tionship is significant for the species within the (1975) and Drent and Klaassen (1989). Thus,
y=O.65 + 0.38x, kO.465, p=O.Oii, n=29
1.6 0
0.2 0.4 0.6 0.8 1.0 1.2 1.4 1.6 1
KG'KGexpected
FIGURE 5. Relationship between mass-independent hatchling metabolism and mass-independent postnatal growth rate for all species of the phylogenetic groups in Table 4. The calculated least square regression line is indicated.

622 MARCEL KLAASSEN AND RUDOLF DRENT
all data y=O.70 + 0.006x, r=0.407, p=O.O03. n=50 1.8 - A Procellariiformes y=O.53 +0.011x, r=O.552, p=O.O33, n=15
l Sterninae y=O.57+ 0.008x, k0.899, p=O.O02, n= 8 0
1.6 - 0 TJ 0) u %1.4- 0 A
A 0
0.6 -
1 I I I I I I I
10 20 30 40 50 60 70 80 ! latitude (“N & ‘3)
FIGURE 6. Mass-independent hatchling metabolism plotted as a function of latitude for all species of the phylogenetic groups in Table 2 (closed dots: Steminae; closed triangles: Procellariiformes; open dots: all other species). The least square regression line is drawn over all data points.
hatchling resting metabolism, embryonic growth rate, postnatal growth rate and latitude all appear interrelated.
Several studies have established a relation be- tween hatchling metabolism and latitude (Rick- lefs 1976; Bryant and Hails 1983; Kahn and Whittow 1984; Taylor 1985; Brown and Adams 1988; Klaassen et al. 1989a, 1989~). Also, in adult birds a positive correlation exists between latitude and resting metabolism (Weathers 1979, Hails 1983, Ellis 1984). Clearly, latitude in itself is not important to the bird, but is here used to subsume important environmental information. Environmental conditions for three species of terns at three different latitudes are illustrated in Figure 8. Ambient temperature decreases to- wards the pole while the yearly fluctuation in ambient temperature increases. These two lati- tude-coupled meteorological phenomena togeth- er with the change in day length contribute to the shortening of the breeding season at high latitudes.
The adaptive advantage of the latitudinal dif- ference in resting metabolism for adults has been interpreted as a mechanism of avoiding heat stress by reducing endogenous heat production (Weathers 1979, Ellis 1984). Evaporative heat loss is a major pathway in dissipating heat but operates at the expense of water. An increase of evaporative heat loss of a chick can thus entail
a disruption in water economy necessitating ad- justments of parental behavior (some species de- liver water directly; others provide water only in the form of food items). Low-latitude hatchlings
200
t
DRENT & RICKLEFS & WHITE KLAASSEN
150
50 DRMR
m Esyn
standard 2xstandard growth rate
FIGURE 7. Comparison of daily net energy require- ment (exclusive of activity) for growth in the Sooty Tern (Sterna ficata) at 20 days of age estimated for normal field conditions (standard, Ricklefs and White 198 1) and as predicted for a doubling of growth rate by the model of Ricklefs and White (198 1) or alter- natively according to Drent and Klaassen (1989; calling for the adjustment of RMR). Net energy requirement is partitioned into resting metabolic rate (RMR), en- ergy deposited in body tissue (Etis) and energy required for synthesis (Esyn).

AN ANALYSIS OF HATCHLING METABOLISM 623
01 I I I I I I I I I 24 LIGHT PERIOD
20-
16 -
12’~ I I
AMBIENT TEMPERATURE
3o YEARLY FLUCTUATION IN AMBIENT TEMPERATURE
20-
10 20 30 40 50 60 70 60 90
latitude (“C)
FIGURE 8. Schematic overview of implications of latitude for breeding birds: from equator to pole length of breeding season, daylight period, ambient temperature and its yearly fluctuation are shown. The trend lines are interrupted at 26”N (Hawaii), 54”N (Netherlands) and 79”N (Spitsbergen) as depicted in the insets. These exemplify sites where terns representative for the geographical region breed (Sterna fuscuta, S. hirundo and S. paradisaea, respectively).
seem to have metabolic rates that are 30% below normal for their mass (Fig. 6). This would yield a 30% reduction in evaporation water loss if am- bient temperature approaches body temperature (Fig. 9), which may occur at low latitudes.
An environmental factor closely linked with latitude is air temperature. Ellis (1984) and Ker- sten and Piersma (1987) argued that relatively high resting metabolism is associated with high working capacity, which might be advantageous in the arctic, where seasons are short and harsh
weather prevails. Relevant to the hatchling is the thermogenic potential, i.e., the metabolic scope that can be deployed in producing heat to main- tain body temperature. Assuming that for hatch- lings a sustained level of two times RMR, is a realistic estimate of this potential (Ricklefs 1989) we calculated the impact that the adjustment of RMR, exerts on the lower temperature threshold of the domain of thermoregulation. The lower limit at which the hatchling can maintain body temperature when exposed to the environment
624 MARCEL IUAASSEN AND RUDOLF DRENT
I I I 1 I 0.0 0.1 0.2 0.3 0.4
mass specific water loss at Ta=Tb (ml day-’ g-l)
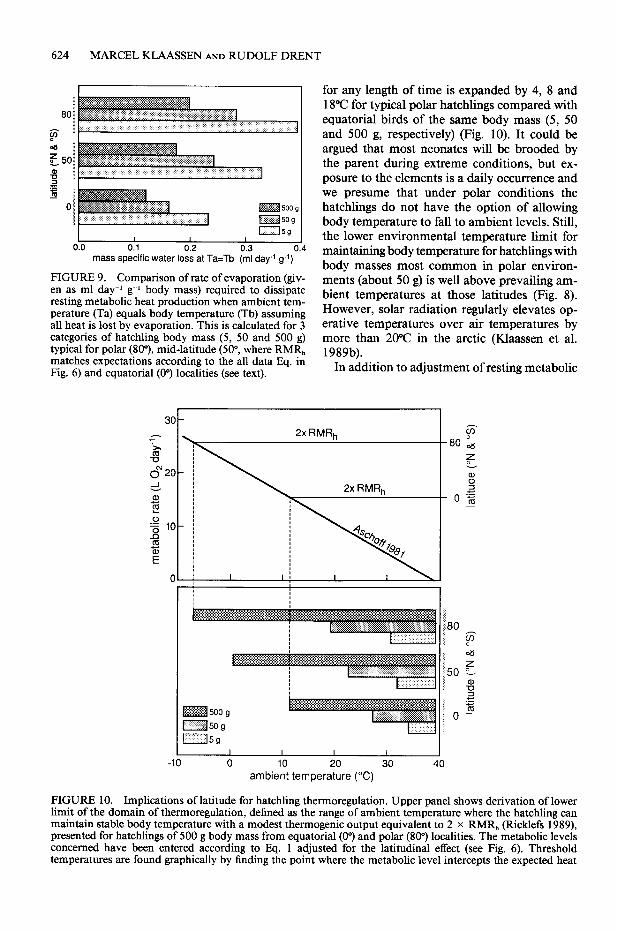
FIGURE 9. Comparison of rate of evaporation (giv- en as ml day-’ g-l body mass) required to dissipate resting metabolic heat production when ambient tem- perature (Ta) equals body temperature (Tb) assuming all heat is lost by evaporation. This is calculated for 3 categories of hatchling body mass (5, 50 and 500 g) typical for polar (SO”), mid-latitude (SO”, where RMR, matches expectations according to the all data Eq. in Fig. 6) and equatorial (0’) localities (see text).
for any length of time is expanded by 4, 8 and 18°C for typical polar hatchlings compared with equatorial birds of the same body mass (5, 50 and 500 g, respectively) (Fig. 10). It could be argued that most neonates will be brooded by the parent during extreme conditions, but ex- posure to the elements is a daily occurrence and we presume that under polar conditions the hatchlings do not have the option of allowing body temperature to fall to ambient levels. Still, the lower environmental temperature limit for maintaining body temperature for hatchlings with body masses most common in polar environ- ments (about 50 g) is well above prevailing am- bient temperatures at those latitudes (Fig. 8). However, solar radiation regularly elevates op- erative temperatures over air temperatures by more than 20°C in the arctic (Klaassen et al. 1989b).
In addition to adjustment of resting metabolic
0 10 20 30 40 ambient temperature (“C)
FIGURE 10. Implications of latitude for hatchling thermoregulation. Upper panel shows derivation of lower limit of the domain of thermoregulation, defined as the range of ambient temperature where the hatchling can maintain stable body temperature with a modest thermogenic output equivalent to 2 x RMR, (Ricklefs 1989), presented for hatchlings of 500 g body mass from equatorial (0”) and polar (809 localities. The metabolic levels concerned have been entered according to Eq. 1 adjusted for the latitudinal effect (see Fig. 6). Threshold temperatures are found graphically by finding the point where the metabolic level intercepts the expected heat
AN ANALYSIS OF HATCHLING METABOLISM 625
weather conditions length of season
daylength
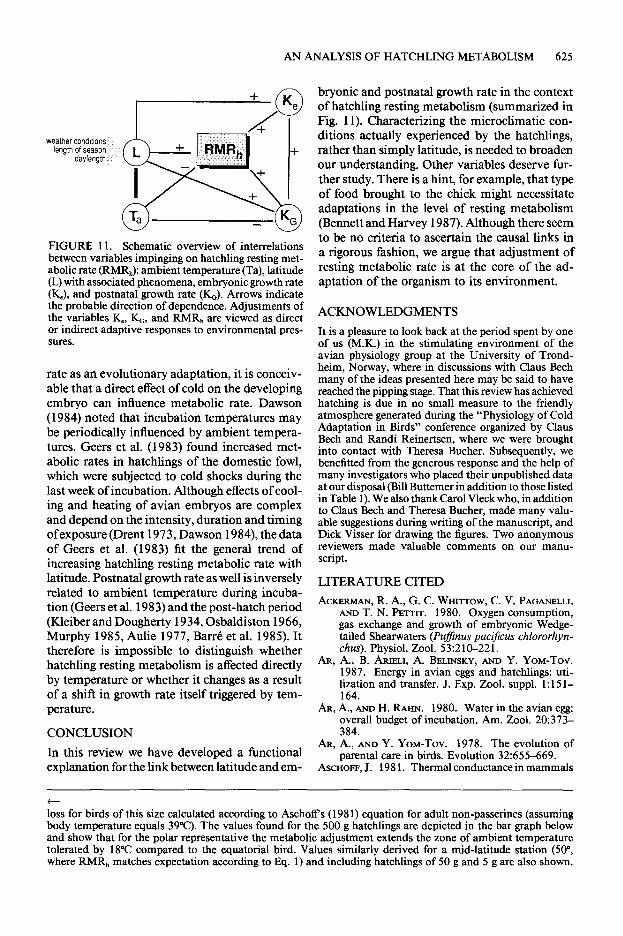
FIGURE 11. Schematic overview of interrelations between variables impinging on hatchling resting met- abolic rate (RMR,,): ambient temperature (Ta), latitude (L) with associated phenomena, embryonic growth rate (K& and postnatal growth rate (Ic;). Arrows indicate the probable direction of dependence. Adjustments of the variables Id. L, and RMR, are viewed as direct or indirect adaptiveresponses to environmental pres- sures.
rate as an evolutionary adaptation, it is conceiv- able that a direct effect of cold on the developing embryo can influence metabolic rate. Dawson (1984) noted that incubation temperatures may be periodically influenced by ambient tempera- tures. Geers et al. (1983) found increased met- abolic rates in hatchlings of the domestic fowl, which were subjected to cold shocks during the last week of incubation. Although effects of cool- ing and heating of avian embryos are complex and depend on the intensity, duration and timing of exposure (Drent 1973, Dawson 1984), the data of Geers et al. (1983) fit the general trend of increasing hatchling resting metabolic rate with latitude. Postnatal growth rate as well is inversely related to ambient temperature during incuba- tion (Geers et al. 1983) and the post-hatch period (IUeiber and Dougherty 1934, Osbaldiston 1966, Murphy 1985, AuIie 1977, Barrt et al. 1985). It therefore is impossible to distinguish whether hatchling resting metabolism is affected directly by temperature or whether it changes as a result of a shift in growth rate itself triggered by tem- perature.
CONCLUSION
In this review we have developed a functional explanation for the link between latitude and em-
btyonic and postnatal growth rate in the context of hatchling resting metabolism (summarized in Fig. 11). Characterizing the microclimatic con- ditions actually experienced by the hatchlings, rather than simply latitude, is needed to broaden our understanding. Other variables deserve fur- ther study. There is a hint, for example, that type of food brought to the chick might necessitate adaptations in the level of resting metabolism (Bennett and Harvey 1987). Although there seem to be no criteria to ascertain the causal links in a rigorous fashion, we argue that adjustment of resting metabolic rate is at the core of the ad- aptation of the organism to its environment.
ACKNOWLEDGMENTS
It is a pleasure to look back at the period spent by one of us (MR.) in the stimulatina environment of the avian physiology group at the University of Trond- heim, Norway, where in discussions with Claus Beth many of the ideas presented here may be said to have reached the pipping stage. That this review has achieved hatching is due in no small measure to the friendly atmosphere generated during the “Physiology of Cold Adaptation in Birds” conference organized by Claus Beth and Randi Reinertsen, where we were brought into contact with Theresa Bucher. Subsequently, we benefitted from the generous response and the help of many investigators who placed their unpublished data at our disposal (Bill Buttemer in addition to those listed in Table 1). We also thank Carol Vleck who, in addition to Claus Beth and Theresa Bucher, made many valu- able suggestions during writing of the manuscript, and Dick Visser for drawing the figures. Two anonymous reviewers made valuable comments on our manu- script.
LITERATURE CITED
ACKERMAN, R. A., G. C. WHII-TOW, C. V. PAGANELLI, AND T. N. PEITIT. 1980. Oxygen consumption, gas exchange and growth of embryonic Wedge- tailed Shearwaters (Pz&inus pacificus chlororhyn- thus). Physiol. Zool. 53:210-221.
AR. A.. B. ARIELI, A. BELINSKY. AND Y. YOM-TOV. 1987. Energy in avian eggs’and hatchlings: uti- lization and transfer. J. Exp. Zool. suppl. 1:151- 164.
Aa, A., AND H. RAHN. 1980. Water in the avian egg: overall budget of incubation. Am. Zool. 20:373- 384.
Aa, A., AND Y. YOM-Tov. 1978. The evolution of parental care in birds. Evolution 32:655-669.
ASCHOFF, J. 198 1. Thermal conductance in mammals
t loss for birds of this size calculated according to Ascholl’s (198 1) equation for adult non-passerines (assuming body temperature equals 39°C). The values found for the 500 g hatchlings are depicted in the bar graph below and show that for the polar representative the metabolic adjustment extends the zone of ambient temperature tolerated by 18°C compared to the equatorial bird. Values similarly derived for a mid-latitude station (50”, where RMR, matches expectation according to Eq. 1) and including hatchlings of 50 g and 5 g are also shown.
626 MARCEL KLAASSEN AND RUDOLF DRENT
and birds: its dependence on body size and cir- cadian phase. Comp. Biochem. Physiol. 69A:6 1 l- 619.
AULIE, A. 1976. The pectoral muscles and the de- velopment of thermoregulation in chicks of Wil- low Ptarmigan (Lugopus lugopus). Comp. Bio- them. Physiol. 53A343-346.
AULIE, A. 1977. The effect of intermittent cold ex- posure on the thermoregulatory capacity of Ban- tam chicks, Gallus domesticus. Comp. Biochem. Physiol. 56A545-549.
Bm, H., A. GELOEN, J. CHATONNET, A. DI~~MAR, AND J. L. ROUANET. 1985. Potentiated muscular thermogenesis in cold-acclimated Muscovy Duck- ling. Am. J. Physiol. 249:R533-R538.
BARTHOLOMEW, G. A., AND D. L. GOLDSTEIN. 1984. The energetics of development in a very large al- tricial bird, the Brown Pelican, p. 347-357. In R. S. Seymour [ed.], Respiration and metabolism of embryonic vertebrates. Junk, Dordrecht, The Netherlands.
BECH, C., F. J. AARVIK, AND D. VONGRAVEN. 1987. Temperature regulation in hatchling Puffins (Fru- tercula arctic& J. Omithol. 128: 163-l 70.
BECH, C., R. Baa&, P. F. F’EDERSN, J. G. RASMUSSEN, AND K. JOHANSEN. 1982. Temperature regula- tion in chicks of the Manx Shearwater @‘u&us pu#inus). Omis Stand. 13:206-210.
BECH, C., S. MARTINI, R. BRENT, AND J. RASMUSSEN. 1984. Thermoregulation in newly hatched Black- legged Kittiwakes. Condor 86:339-341.
BECH, C., F. MEHLUM, AND S. HAFTORN. 1988. De- velopment of chicks during extreme cold condi- tions: the Antarctic Petrel (ThaZussoicu antarcti- cu). Acta XIX Congr. Int. Om. 11:1447-1456.
BEINTEMA, A., AND H. VISSER. 1989. Growth param- eters in chicks of charadriiform birds. Ardea 77: 169-180.
BENNETT, P. M., AND P. H. HARVEY. 1987. Active and resting metabolism in birds: allometry, phy- logeny and ecology. J. Zool. Lond. 213:327-363.
BERNSTEIN, M. H. 1973. Development of thermo- regulation in Painted Quail, Excalfactoria chinen- sii Comp. Biochem. Physiol. 44A:355-366.
BJ&NHAG. G. 1979. Growth in newlv hatched birds. Swedish J. Agric. Res. 9:121-125:
BLEM, C. R. 1976. Patterns of lipid storage and uti- lization in birds. Am. Zool. 16:671-684.
Boo-q D. T. 1984. Thermoregulation in neonate Mallee Fowl Leipou ocellata. Physiol. Zool. 57: 25 l-260.
BOOTH, D. T. 1985. Thermorenulation in neonate Brush Turkeys (Alecturu luthkni). Physiol. Zool. 581374-379.
BRODY, S., AND T. C. PROCTOR. 1932. Growth and development with special reference to domestic animals-XXIII. Relation between basal metab- olism and mature body weight in different species of birds and mammals. Univ. Miss. Agr. Exp. Sta. Res. Bull. 166:89-101.
BROWN, C. R., AND N. J. ADAMS. 1988. Egg temper- ature, embryonic metabolism, and waterloss from the eggs of subantarctic procellariiformes. Physiol. Zool. 61:126-136.
BRYANT, D. M., AND C. J. IIAIrs. 1983. Energetics and growth patterns of three tropical bird species. Auk 100:425439.
BUCHER, T. L. 1983. Parrot eggs, embryos and nest- lings: patterns and energetics of growth and de- velopment. Physiol. Zool. 56:465283.
BUCHER. T. L. 1986. Ratios of hatchlina and adult mass-independent metabolism: a physyological in- dex to the altricial-precocial continuum. Respir. Physiol. 65:69-83.
BUCHER, T. L. 1987. Patterns in the mass-indepen- dent energetics of avian development. J. Exp. Zool. Suppl. 1:139-150.
BUCHER, T. L., AND G. A. BARTHOLOMEW. 1984. Analysis of variation in gas exchange, growth pat- terns, and energy utilization in a parrot and other avian embryos, p. 359-372. In R. S. Seymour [ed.], Respiration and metabolism of embryonic ver- tebrates. Junk, Dordrecht, The Netherlands.
BUCHER, T. L., G. A. BARTHOLOMEW, W. Z. TRIVEL- PIECE, AND N. J. VOLKMAN. 1986. Metabolism, growth and activity in Adelie and Emperor Pen- guin embryos. Auk 103:485493.
BUCHER, T. L., M. A. CHAPPELL, AND K. R. MORGAN. In press. The ontogeny of oxygen consumption and ventilation in the Adelie Penguin Pygoscelis adeliae. Respir. Physiol.
CALDER, W. A. 1987. Scaling energetics of homeo- thermic vertebrates: an operational allometry. AM. Rev. Physiol. 49: 107-120.
CAREY, C. 1983. Structure and function ofavian eggs, p. 69-103. In R. F. Johnston [ed.], Current omi- thology. Vol. 1. Plenum Press, New York.
CAREY, C., H. RAHN, AND P. PARISI. 1980. Calories, water lipid and yolk in avian eggs. Condor 82: 335-343.
CAREY, C., E. L. THOMPSON, C. M. VLECK, AND F. C. JAMES. 1982. Avian reproduction over an alti- tudinal gradient: incubation period, hatchling mass, and embryonic oxygen consumption. Auk 99~7 1 O- 718.
CRAMP, S. 1983. Handbook of the birds of Europe, the Middle East and North Africa. The birds of the western Palearctic. Oxford Univ. Press, Ox- ford, London and New York.
DAAN, S., D. M&MAN, AND A. GROENEWOLD. 1990. Avian basal metabolic rates: their association with body composition and energy expenditure in na- ture. Am. J. Phvsiol. 259:R333-R340.
DAAN, S., D. MADMAN, A. STRIJKSTRA, AND S. VERHULST. 1989. Intraspecific allometry of basal metabolic rate: relations with body size, temper- ature, composition and circadian phase in the Kes- trel, Fake tinnunculus. J. Biol. Rhythms 4:267- 284.
DAWSON, W. R. 1984. Metabolic response of embry- onic seabirds to temperature, p. 139-158. In G. C. Whittow and H. Rahn [eds.], Seabird energetics. Plenum Press, New York and London.
DAWSON, W. R., AND A. F. BENNETT. 1980. Metab- olism and thermoregulation in hatchling Western Gulls (Lams occidentalis livens). Condor 82: 103- 105.
DAWSON, W. R., AND A. F. BENNETT. 198 1. Field and

AN ANALYSIS OF HATCHLING METABOLISM 627
laboratory studies of the thermal regulations of hatchling Western Gulls. Physiol. Zool. 54:155- 164.
DAWSON, W. R., A. F. BENNETT, AND J. W. HUDSON. 1976. Metabolism and thermoregulation in hatching Ring-billed Gulls. Condor 78:49-60.
DAWSON, W. R., J. W. HUDSON, AND R. W. HILL. 1972. Temperature regulation in newly hatched Laugh- ing Gulls (Larus atricilla). Condor 74: 177-l 84.
DORWARD, D. F. 1963. The Fairy Tern Gynis alba on Ascension Island. Ibis 103b:365-378.-
D~ENT. R. H. 1965. Breedine bioloav of the Piaeon Guillemot, Cepphus coluibu. Arxea 53:99-160.
DRENT, R. H. 1970. Functional aspects of incubation in the Herring Gull (Larus urgentatus Pont). Be- haviour suppl. 17:1-132.
DRENT, R. H. 1973. The natural history of incuba- tion, p. 262-322. In D. S. Famer [ed.], Breeding biology of birds. National Academy of Sciences, Washington, D.C.
DRENT, R. H. 1975. Incubation, p. 333-420. In D. S. Famer and J. R. King leds.1. Avian bioloav. Vol. V. Academic Press, New York.
__
DRENT, R., AND M. KLAASSEN. 1989. Energetics of avian growth: the causal link with bmr and met- abolic scope, p. 349-359. In C. Beth and R. E. Reinertsen [eds.], Physiology of cold adaptation in birds. Plenum Press, New York and London.
ELLIS, H. I. 1984. Energetics of free-ranging seabirds, p. 203-234. In G. C. Whittow and H. Rahn [eds.], Seabird energetics. Plenum Press, New York and London.
EPPLEY, Z. A. 1984. Development of thermoregula- tory abilities in Xanthus Murrelet chicks Synth- liborumphus hypoleucus. Physiol. Zool. 57:307- 317.
GEERS, R., H. MICHELS, G. NACKAERTS, AND F. KONINGS. 1983. Metabolism and growth of chickens before and after hatch in relation to in- cubation temperatures. Poult. Sci. 62: 1869-l 875.
GLUTZ VON BL~TZHEIM, U. N., AND K. M. BAUER. 1982. Handbuch der Vijael Mitteleuronas 8:1: l- 699. Akad. Verlag, Wiesbaden, Germany.
HAILS, C. J. 1983. The metabolic rate of tropical birds. Condor 85:61-65.
HEUSNER, A. A. 1983. Body size, energy metabolism, and the lunas. J. ADDS. Phvsiol. 54:867-940.
HEUSNER, A. A.- 1985. _ Body size and energy metab- olism. Annu. Rev. Nutr. 5:267-360.
HEUSNER, A. A. 1987. What does the power function reveal about structure and function in animals of different size? Annu. Rev. Phvsiol. 49: 12 l-l 33.
HISSA, R., S. SAARELA, H. RINTAM& H. LINDEN, AND E. HOHTOLA. 1983. Energetics and development of temperature regulation-in Capercaillie Tetruo uroaullus. Phvsiol. Zool. 56: 142-l 5 1.
HOYT, D. F. 1987. A new model of avian embryonic metabolism. J. Exp. Zool. Suppl. 1:127-138.
HOYT, D. F., AND H. RAHN. 1980. Respiration of avian embryos-a comparative analysis. Respir. Physiol. 39~255-264.
KERSTEN, M., AND T. PIERSMA. 1987. High levels of energy expenditure in shorebirds: metabolic ad-
aptations to an energetically expensive way of life. Ardea 75:175-187.- _ _
KIRKWOOD. J. K.. AND N. J. Paascorr. 1984. Growth rate and pattern of gut development in mammals and birds. Livest. Prod. Sci. 11:46 l-474.
KLAASSEN, M., C. BECH, D. MASMAN, AND G. SLAGSVOLD. 1989a. Energy partitioning in Arctic Tern chicks (Sternupurudisueu) and possible met- abolic adaptations in high latitude chicks, p. 339- 347. In C. Beth and R. E. Reinertsen [eds.], Phys- iology of cold adaptation in birds. Plenum Press, New York and London.
KLAASSEN, M., C. BECH, D. MASMAN, AND G. SLAGSVOLD. 1989b. Growth and energetics of Arctic Tern chicks (Sterna parudisueu). Auk 106: 240-248.
KLAUSEN, M., C. BECH, AND G. SLAGSVOLD. 1989~. Basal metabolic rate and thermal conductance in Arctic Tern chicks and the effect of heat increment of feeding on thermoregulatory expenses. Ardea 77:193-200.
KLAASSEN, M., G. SLAGSVOLD, AND C. BECH. 1987. Metabolic rate and thermostability in relation to availabilitv of volk in hatchlinas of Black-leased kittiwake and domestic chick& Auk 104:787- 789.
KLEIBER, M., AND J. E. DOUGHERTY. 1934. The in- fluence of environmental temperature on the uti- lization of food energy in baby chicks. J. Gen. Physiol. 17:701-726.
KOONG, L. J., C. L. FERRELL, AND J. A. NIENABER. 1982. Effects of plane of nutrition on organ size and fasting heat production in swine and sheep, p. 245-248. In A. Ehem, and F. Sundstol [eds.], European Association for Animal Production No. 29. Agricultural University of Norway.
KOSKIMIES, J. 1962. Ontogeny of thermoregulation and energy metabolism in some gallinaceous birds. Ric. Zool. Appl. Caccia 4 suppl: 149-160.
KOSKIMIES, J., AND L. LAHTI. 1964. Cold-hardiness of the newly hatched young in relation to ecology and distribution in ten species of European ducks. Auk 81:281-307.
KUENZEL, W. J., AND N. T. KUENZEL. 1977. Basal metabolic rate in growing chicks (GuNus domes- ticus). Poult. Sci. 56:619-627.
LACK, D. 1968. Ecological adaptations for breeding in birds. Methuen, London, England.
LANGHAM, N. P. 1983. Growth strategies in marine terns. Stud. Avian Biol. 8:73-83.
MATTHEW, K. K. 1982. Comparative growth rates and oxygen consumption in young gallifomres. Comp. Biochem. Physiol. 75A249-253.
MAYER, L., S. LUSTICK, AND B. BATTERSBY. 1982. The development of endothermy in the American Goldfinch. Comp. Biochem. Physiol. 72A:42 l- 424.
MCNAB, B. K. 1988. Food habits and basal rate of metabolism in birds. Oecologia (Berl.) 77:343-349.
MEDAWAR, P. B. 1950. Transformation of shape. Proc. R. Sot. London Ser. B. Biol. Sci. 137:474-553.
MURPHY, M. T. 1985. Nestling Eastern Kingbird growth: effects of initial size and ambient temper- ature. Ecology 66: 162-l 70.

628 MARCEL KLAASSEN AND RUDOLF DRENT
NICE, M. M. 1962. Development of behavior in pre- cocial birds. Trans. Linn. Sot. New York 8: l-2 11.
G’CONNOR, R. J. 1977. Differential growth and body composition in altricial passerines. Ibis 119: 147- 166.
OSBALDISTON, G. W. 1966. The response of the im- mature chicken to ambient temperature, p. 228- 234. In C. Horton-Smith and E. C. Amoroso [eds.], Physiology of the domestic fowl. Oliver and Boyd, Edinburgh and London.
PALOKANGAS, R., AND R. HISSA. 197 1. Thermoreg- ulation in young Black-headed Gull (Lams ridi- bundus L.). Comp. Biochem. Physiol. 38A:743- 750.
PETERS, R. H. 1983. The ecological implications of body size. Cambridge University Press, Cam- bridge.
PEI-TIT, T. N., G. S. GRANT, G. C. WHITTOW, H. RAHN, AND C. V. PAGANELLI. 198 1. Respiratory gas ex- change and growth of White Tern embryos. Con- dor 83:355-361.
PElTIT, T. N., G. S. GRANT, G. C. WHITTOW, H. RAHN, AND C. V. PAGANELLI. 1982a. Embryonic oxygen consumption and growth of the Laysan and Black- footed Albatross. Am. J. Physiol. 242:R121-R128.
PElTIT, T. N., G. S. GRANT, G. C. WHITTOW, H. RAHN, AND C. V. PAGANELLI. 1982b. Respiratory gas exchange and growth of Bonin Petrel embryos. Physiol. Zool. 55:162-170.
PE~T~T, T. N., AND G. C. WHITTOW. 1983. Embryonic respiration and growth in two species of noddy terns. Physiol. Zool. 56:455-464.
PETTIT, T. N., G. C. WHITTOW, AND H. I. ELLIS. 1984a. Food and energetic requirements of seabirds at French Frigate Shoals, Hawaii, p. 265-282. In R. W. Grigg and K. Y. Tanoue [eds.], Proceedings of the second symposium on resource investigations in the north western Hawaiian Islands. Univ. Ha- waii, Sea Grant Col. Prog., Honolulu.
PETTIT, T. N., G. C. WHITTOW, AND G. S. GRANT. 1984b. Caloric content and energetic budget of tropical seabird eggs, p. 113-137. In G. C. Whit- tow and H. Rahn [eds.], Seabird energetics. Ple- num Press, New York.
RAHN, H., R. A. ACKERMAN, AND C. V. PAGANELLI. 1984. Eggs, yolk, and embryonic growth rate, p. 89-l 11. In G. C. Whittow and H. Rahn [eds.], Seabird energetics. Plenum Press, New York.
RAHN, H., AND G. C. WHITTOW. 1984. Introduction, p. l-32. In G. C. Whittow and H. Rahn [eds.], Seabird energetics. Plenum Press, New York and London.
RICKLEFS, R. E. 1967a. A graphical method of fitting equations to growth curves. Ecology 48:978-983.
R~CKLE~, R. E. 1967b. Relative growth, body con- stituents and energy content of nestling Barn Swal- lows and Red-winged Blackbirds. Auk 84:56&570.
RICKLEFs, R. E. 1968. Patterns of growth in birds. Ibis 110:419451.
RXKLEFS, R. E. 1973. Patterns of growth in birds. II. Growth rate and mode of development. Ibis 115: 177-201.
RKKLEFS, R. E. 1974. Energetics of reproduction in birds, p. 152-297. In R. A. Paynter [ed.], Avian energetics. Nuttall Omithol., Cambridge, MA.
RICKLEFS, R. E. 1976. Growth rates of birds in the humid new world troeics. Ibis 118: 179-207.
RICKLEFS, R. E. 1977. Composition of eggs of several bird species. Auk 94:350-356.
RICKLEFS, R. E. 1979. Patterns of growth in birds. V. A comparative study of development in the star- ling, common tern and japanese quail. Auk 96: 10-30.
R~CKLEFS, R. E. 1983. Avian postnatal development, p. l-83. In D. S. Famer, and J. R. King [eds.], Avian biology, Vol. VII. Academic Press, New York.
RICKLEFS, R. E. 1984. The optimization of growth rate in altricial birds. Ecoloav 65: 1602-l 6 16.
RICIUEFS, R. E. 1987. Comparitive analysis of avian embryonic growth. J. Exp. Zool. Suppl. 1:309- 323.
RICKLEFS, R. E. 1989. Adaptations to cold in bird chicks, p. 329-338. In C.Bech and R. E. Reinert- sen leds.1. Phvsioloav of cold adautation in birds. Plenum Press; Newkork and London.
RICKLE~, R. E., D. C. HAHN, AND W. A. MONTEVEC- CHI. 1978. The relationship between egg size and chick size in the Laughing Gull and Japanese Quail. Auk 95:135-144.
RICKLEFS, R. E., AND 0. D. ROBY. 1983. Develop- ment of homeothermy in the diving petrels Pele- canoides urinatrix exsul and P. georgicus, and the Antarctic Prion Pachyptila desolata. Comp. Bio- them. Physiol. 75A:307-3 11.
RICKLEF~, R. E., AND T. WEBB. 1985. Water content, thermogenesis, and growth rate of skeletal muscles in the European Starling. Auk 102:369-376.
RICKLEFS, R. E., AND S. C. WHITE. 198 1. Growth and energetics of chicks of the Sooty Tern (Sternafus- cata) and Common Tern (S. hirundo). Auk 98: 3611378.
RICKLEFS, R. E., S. C. WHITE, AND J. CULLEN. 1980. Energetics of postnatal growth in Leach’s Storm Petrel. Auk 971566-575.
ROMANOFF, A. L. 1944. Avian spare yolk and its assimilation. Auk 6 1:23 5-24 1.
ROMANO~, A. L. 1967. Biochemistry of the avian embryo. John Wiley & Sons, New York.
SCHREIBER, E. A., AND R. W. SCHREIBER. 1980. Breed- ing biology of Laughing Gulls in Florida. J. Field Omithol. 51:340-355.
SOTHERLAND, P. R., AND H. RAHN. 1987. On the composition of bird eggs. Condor 89:48-65.
SPAANS, A. L. 197 1. On the feeding ecology of the Herring Gull in the northern part of the Nether- lands. Ardea 59:73-188.
STEEN, J. B., AND G. W. GABRIELSEN. 1986. Ther- mogenesis in newly hatched Eider (Somateria mollissima) and Long-tailed (Clangula hyemalis) Ducklings and Barnacle (Branta Zeucopsis) Gos- lings. Polar Research 4: 18 l-l 86.
TA~WR, J. R. E. 1985. Ontogeny ofthermoreaulation and energy metabolism- in- pygoscelid penguin chicks. J. Comn. Phvsiol. 155B:6 15-627.
VLECK, C. M., AND D. F. HOYT. In press. Metabolism and energetics of reptile and avian embryos. In M.W.J. Ferguson and D. C. Deeming [eds.], Egg incubation and its effects in embryonic develop-

AN ANALYSIS OF HATCHLING METABOLISM 629
ment in birds and reptiles. Cambridge University Press, Cambridge, England.
VLECK, C. M., D. F. HOYT, AND D. VLECK. 1979. Metabolism of avian embryos: patterns in altricial and precocial birds. Physiol. Zool. 52~363-377.
VLECK, C. M., AND G. J. KENAGY. 1980. Embryonic metabolism of the Fork-tailed Storm Petrel: phys- iological nattems during prolonged and interrupt- ed incubation. Physiol.-Zool. 53:32-42. _
VLECK. C. M.. AND D. VLECK. 1987. Metabolism and energetic; of avian embryos. J. Exp. Zool. Suppl. l:lll-126.
VLECK, C. M., D. VLECK, AND D. F. HOYT. 1980. Patterns of metabolism and growth in avian em- bryos. Am. Zool. 20:405416.
V~cx, D. 1978. The energetics of activity and growth:
the energy cost of burrowing by Pocket Gophers and energy metabolism during growth and hatch- ing of Emu, Rhea, and Ostrich eggs. Ph.D. diss. Univ. California, Los Angeles.
VLECK, D., C. M. VLECK, AND R. S. SE~MOLJR. 1984. Energetics of embryonic development in the ma- gapode birds, Mallee Fowl Leipoa ocellata and Brush Turkey Alectura lathami. Physiol. Zool. 57: 44ti56.
WEATHERS, W. W. 1979. Climatic adaptations in avi- an standard metabolic rate. Oecologia 42:8 l-89.
WILLIAMS, J. B., AND A. PRINTS. 1986. Energetics of growth in nestling Savannah Sparrows: a compar- ison of doubly labeled water and laboratory esti- mates. Condor 88:74-83.