Effects of Optical Brightening Agents on Color ...
32
Effects of Optical Brightening Agents on Color Reproduction in Digital Printing A Senior Project presented to the Faculty of the Graphic Communication Department California Polytechnic State University, San Luis Obispo In Partial Fulfillment of the Requirements for the Degree Bachelor of Science by Sandra Chaikovsky and Jaimie Garrison June, 2012 © 2012 Chaikovsky and Garrison
Transcript of Effects of Optical Brightening Agents on Color ...
Effects of Optical Brightening Agents on Color Reproduction in Digital Printing
A Senior Project
presented to
the Faculty of the Graphic Communication Department
California Polytechnic State University, San Luis Obispo
In Partial Fulfillment
of the Requirements for the Degree
Bachelor of Science
by
Sandra Chaikovsky and Jaimie Garrison
June, 2012
© 2012 Chaikovsky and Garrison
Effects of Optical Brightening Agents on Color Reproduction in Digital Printing 2
Table of Contents
Abstract.........................................................................................................................................4
Chapter 1 – Introduction...............................................................................................................5
Chapter 2 - Literature Review ......................................................................................................7
Chapter 3 – Methodology ...........................................................................................................17
Chapter 4 – Results.....................................................................................................................20
Chapter 5 – Conclusion ..............................................................................................................28
References...................................................................................................................................31

Effects of Optical Brightening Agents on Color Reproduction in Digital Printing 3
List of Figures and Tables
Figure 2.19
Figure 3.1....................................................................................................................................17
Table 4.1 .....................................................................................................................................20
Table 4.2 .....................................................................................................................................21
Table 4.3 .....................................................................................................................................22
Figure 4.1....................................................................................................................................23
Figure 4.2....................................................................................................................................23
Figure 4.3....................................................................................................................................24
Figure 4.4....................................................................................................................................24
Figure 4.5....................................................................................................................................24
Figure 4.6....................................................................................................................................24
Figure 4.7....................................................................................................................................25
Figure 4.8....................................................................................................................................25
Figure 4.9....................................................................................................................................26
Figure 4.10..................................................................................................................................26
Figure 4.11..................................................................................................................................26
Figure 4.12..................................................................................................................................26
Figure 4.13..................................................................................................................................27
Figure 4.14..................................................................................................................................27
Effects of Optical Brightening Agents on Color Reproduction in Digital Printing 4
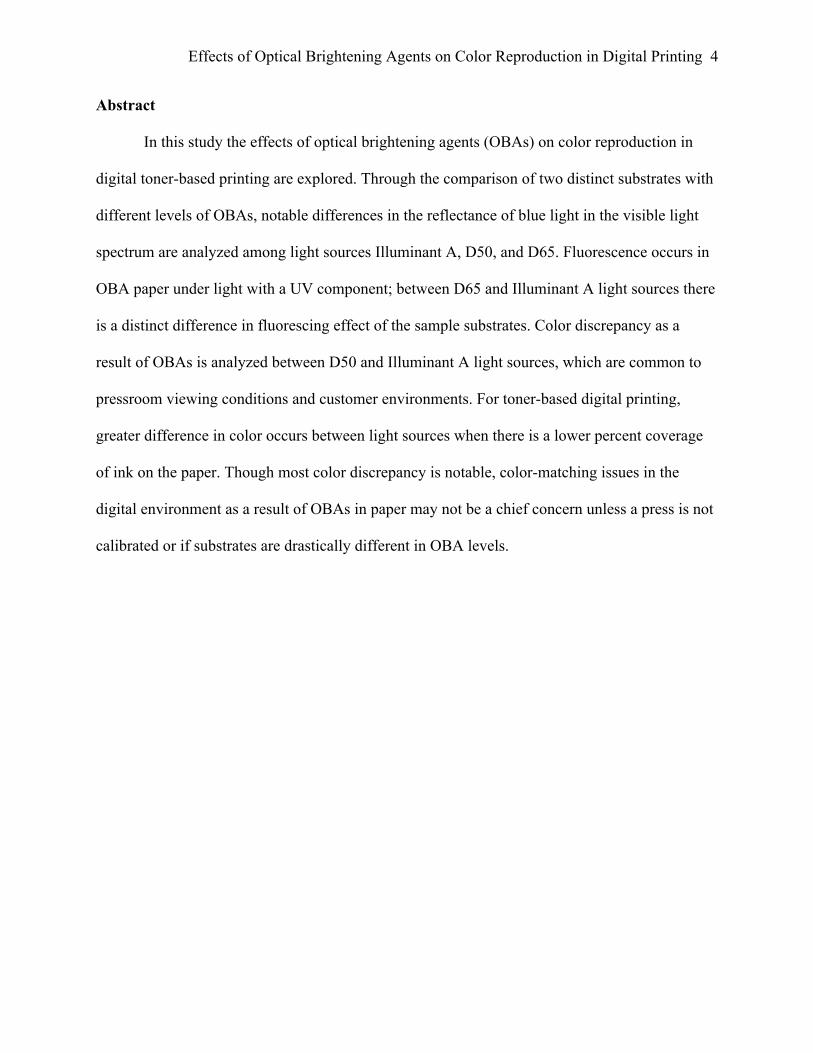
Abstract
In this study the effects of optical brightening agents (OBAs) on color reproduction in
digital toner-based printing are explored. Through the comparison of two distinct substrates with
different levels of OBAs, notable differences in the reflectance of blue light in the visible light
spectrum are analyzed among light sources Illuminant A, D50, and D65. Fluorescence occurs in
OBA paper under light with a UV component; between D65 and Illuminant A light sources there
is a distinct difference in fluorescing effect of the sample substrates. Color discrepancy as a
result of OBAs is analyzed between D50 and Illuminant A light sources, which are common to
pressroom viewing conditions and customer environments. For toner-based digital printing,
greater difference in color occurs between light sources when there is a lower percent coverage
of ink on the paper. Though most color discrepancy is notable, color-matching issues in the
digital environment as a result of OBAs in paper may not be a chief concern unless a press is not
calibrated or if substrates are drastically different in OBA levels.
Effects of Optical Brightening Agents on Color Reproduction in Digital Printing 5
Chapter 1 – Introduction
Optical brightening agents (OBAs), or fluorescent whitening agents (FWAs), are
chemicals added to papers, plastics, and other materials to increase the blue light reflectance. The
increased reflectance of blue light increases the perceived whiteness of the material. “A ‘bluer’
white is perceived as ‘cleaner’, but a white material that has aged or become dirty appears to be
yellow and is less acceptable to the eye. As a result, OBAs are commonly added to white fabrics
and other white materials to make them appear ‘bluer’ or ‘cleaner’” (Datacolor, 2012).
Until recently, the impact of OBAs in paper on printed image color has not been well
understood of accurately measured. Spectrodensitometers traditionally use an incandescent
illuminant, a light source that does not contain a UV component, to measure the differences in
color of a printed product. As a result, no UV light reflectance occurs, and the effects of OBAs
on perceived color remain unknown (Keif, 2012). This creates a problem when using the
measurement to match a defined color standard or when matching color across different
substrates. Measurements taken using a standard spectrodensitometer may indicate a match
between the printed piece’s color values and a defined standard or proof, but when viewed with
the human eye under UV component lighting, they may appear to not match at all.
In 2011, Konica Minolta introduced a spectrodensitometer featuring a UV light
component that enables measurements accounting for the influence of OBAs. The Konica
Minolta FD-7 spectrodensitometer accurately evaluates color, including the effect of OBAs,
because it illuminates the sample using an LED illuminant that replicates D50 lighting
conditions, which is the standard for light booths used for color matching in the pressroom.
Konica Minolta claims it is the first instrument capable of providing measurement results under
this standard light source, which corresponds to ISO 13655 Measurement Condition M1 (Konica
Effects of Optical Brightening Agents on Color Reproduction in Digital Printing 6
Minolta, 2012). The D50 illuminant includes a UV light component, which excites the OBAs
and causes them to reflect light in the blue spectrum, and therefore the result is captured in the
spectral reflectance curve. The FD-7 is capable of taking multiple measurements with different
illuminants and recording the different reflectance values in a table. These values can be
transferred into Excel to generate a graph for visual comparison of different reflectance values of
the paper under different illuminants.
The purpose of this study is to compare the affects of OBAs on the perceived and
numerical differences in paper brightness, and to highlight the need for more accurate color
management across different substrates due to OBAs. Using the Konica Minolta FD-7 for
numerical analysis, this study examined the effect OBAs have on perceived brightness and
brightness measured under ISO 13655 Measurement Condition M1 standards with a UV
illuminant. Graphical analysis reflected measured data to show the different reflection spectra
under different illuminants due to OBAs.
Effects of Optical Brightening Agents on Color Reproduction in Digital Printing 7
Chapter 2 – Literature Review
Optical Brightening Agents
Optical brightening agents (OBAs) are chemicals added to paper during the papermaking
process to increase the brightness of paper. Brightness is “the percentage reflectance of blue light
only at a wavelength of 457 nm” (Goyal, 2000). OBAs, also known as fluorescent whitening
agents (FWAs) when used in textiles, increase an object’s reflectance of blue light under
ultraviolet (UV) light sources, such as daylight and D65 lighting. OBAs were first added to paper
to make it seem brighter and cleaner, increasing the value to the customer. Color appears more
vivid on paper containing OBAs, making OBA paper more desirable in terms of image quality.
“Optical brightening agents…enhance appearance under certain lighting conditions. They trick
the eye into thinking the medium is brighter and whiter than it really is by shifting invisible
ultraviolet light found in daylight and many light sources into visible blue light. In the case of
paper, the blue light masks the natural yellow color of paper only as long as the UV-containing
light source shines on the paper or print. Observers then perceive this blueness as whiteness
(Wales, 2008).
OBAs at some level are added to most printing papers today, including offset, digital, and
home copier varieties of paper. Varying levels of OBAs across different papers may result in a
problem: while the perceived color in sunlight or D65 lighting reflects more blue with increased
OBAs, white papers with different levels of OBAs will be perceived differently and will read
differently under a standard spectrodensitometer. “Today's instruments and light booths attempt
to simulate a reference lighting condition, such as D50, but do not duplicate the prescribed UV
component. This is not critical unless the paper contains OBAs. When the paper contains OBAs
the measurement of printed color is unpredictable, particularly in the highlight and mid-tones;
Effects of Optical Brightening Agents on Color Reproduction in Digital Printing 8
and matching proof and press is problematic” (Wales, 2008). If the paper is not comparatively
measured in D65 lighting, or simulated sunlight, the customer may disagree with the color match
despite signing off on the press proof.
Fluorescence versus Phosphorescence
OBAs affect the brightness of the paper by increasing the amount of fluorescence the
paper has. Fluorescence is the conversion of non-visible light into visible light. A common way
to view fluorescence is under a black light. Clothing dyes, usually whites, often have FWAs in
them, making them distinctly “glow” under a black light. OBAs absorb UV light and re-emit it as
visible blue light, making the paper appear more blue and bright under a light featuring a UV
component (Goyal, 2000). Often, fluorescence is confused with phosphorescence. Commonly
seen in glow-in-dark items, phosphorescence stores light and then releases it gradually as the
electrons relax back to a ground state from their excited state when interacting with the light
source previously (Weiss, 2001). Phosphorescence can be seen without a black light in a dark
room. Eventually, phosphorescence will stop emitting light after prolonged removal from a light
source and the electrons have returned to their ground state.
Spectrodensitometry
Spectrodensitometers measure the spectral distribution of light and use the data to display
densitometric information that allows for easier and more accurate calculation of density and
colorimetric readings among other things (Myers, 2009). “There are several advantages to
calculating densitometric information from spectral data, including the ability to calculate
reflection density and any status” (Myers, 2009). Similar to a spectrodensitometer,

Effects of Optical Brightening Agents on Color Reproduction in Digital Printing 9
spectrophotometers measure the visible spectrum of light; however they are limited in the depth
of their readings and math capabilities compared to spectrodenistometers (Myers, 2009).
Light itself is measured in a spectrum beyond visible light; it belongs to a larger spectrum
of electromagnetic waves. The visible range of light in the electromagnetic spectrum is from
about 390 to 780 nanometers, with violet being on the low end of the visible spectrum and red on
the high end (The Physics Classroom, 2012). All visible light falls into the color range of
ROYGBIV (red, orange, yellow, green, blue, indigo, and violet) with “white” light being a
combination of all the wavelengths or colors and black being the absence of visible light.
Invisible light and other electromagnetic waves fall on either side of the visible spectrum range,
from gamma rays on the low end of the spectrum to radio waves on the high end of the spectrum.
Figure 1 illustrates the electromagnetic spectrum and the ranges of visible light and other
electromagnetic waves.
Figure 2.1 – The Electromagnetic Spectrum (Irvine, 2011)
By adding OBAs into paper, invisible UV light is converted into the blue range of visible
light, increasing the perceived optical brightness of the paper. When measured under a UV light
source, OBAs cause light that is absorbed in the 300- to 400-nanometer range to be reflected

Effects of Optical Brightening Agents on Color Reproduction in Digital Printing 10
back as blue light at a wavelength of up to 460 nanometers (Gill, 2011). Standard
spectrodensitometers are UV-cut, meaning they take measurements without accounting for the
reflectance of UV light into the visible spectrum; this results in measurements that differ when
taken under UV and non-UV lighting conditions. Newer spectrodensitometers, such as the
Konica Minolta FD-7 used in this study, offer measurement illuminants that mimic spectral
illuminant standards, such as D50 and D65. They allow more accurate color measurements for
different light sources, reducing metameric color matching frustrations. “Because the amount of
OBA fluorescence is directly related to the amount of energy absorbed by the fluorescent
molecule, a UV-enhanced spectrophotometer…must have a light source that emits the right
amount of ultra-violet light—typical of normal daylight, which standard bodies have agreed to be
CIE Illuminant D65” (Datacolor, 2012). This new technology helps combat metamerism as well,
keeping color in mind with the different light reflectance measurements.
Metamerism
Metamerism is the effect light has on the perception of color. A good example of
metamerism is commonly found in clothing shopping: when a shirt appears to be one color in the
department store, and another outside the store in daylight after purchase. The lighting in the
department store is different from the natural outdoor light. Metamerism causes the object to
look one color under one type of lighting but under a different light it appears to be a different
color, or when two colors appear the same under one light source and different under another
light source. In the case of the shirt, the use of OBAs or FWAs in the clothing dye may have
impacted the metamerism that resulted. Depending on what light sources are being used,
metamerism is more likely to occur with objects with OBAs in them because they reflect UV

Effects of Optical Brightening Agents on Color Reproduction in Digital Printing 11
light. Until recently, only ink metamerism was a primary concern in image reproduction. Recent
research of OBAs has shown that they also contribute to metamerism.
When using two different light sources, one with a UV component such as daylight and
the other without, illuminant metamerism is because of the increased blue light under one light
source versus the other, especially when fluorescing occurs. “Illuminant metamerism is
witnessed when there are a number of spectrally matched—exactly the same—samples, but
when each is independently yet simultaneously illuminated and viewed under lights whose
spectral power distributions differ, significant variations of the color can be perceived” (“What Is
Metamerism?,” 2012). New advances in color management technologies, such as X-Rite’s
i1Profiler, help reduce the impact of metamerism for print and color matching. “i1Profiler also
includes X-Rite’s groundbreaking Optical Brightener Correction technology (OBC)...[which]
can effectively and precisely compensate for color shifts in International Color Consortium
(ICC) output profiles typically caused by optical brightening agents (OBAs) in papers and other
printing substrates. This results in prints with an improved visual match and reduces undesirable
colorcasts caused by the brightening agents” (“X-Rite,” 2010). Recent spectrodensitometer
technologies help with color matching customer specifications and viewing conditions so that
metamerism is addressed.
CIE Standard Illuminants
The Commission Internationale de L’eclairage (CIE), or International Commission of
Illumination, has established different standard lighting conditions, used to define and compare
Effects of Optical Brightening Agents on Color Reproduction in Digital Printing 12
environments in which to make different measurements. CIE standard illuminant D50 is
specified as the standard lighting environment for pressroom light booths, under which the most
accurate color matches can be made. This standard is “an average of the most extreme lighting,
and has the most neutral spectral response of all standard daylight illuminants” (Tappi, 2007).
The color temperature of Illuminant D50 is 5000 Kelvin, which is the unit of measurement for
color temperature. Its color temperature is otherwise described as “the average office fluorescent
light mixed with north sky” (Tappi, 2007). D50 was based on another standard, Illuminant D65,
which represents noon daylight, or 6500 Kelvin color temperature. However, most
spectrodensitometers on the market today use Illuminant A, at 2856 Kelvin, an incandescent
tungsten lamp, to make color measurements. This was considered acceptable until the effects of
OBAs in paper were better understood. If one of two prints that match under Illuminant A had
more OBAs in the paper, fluorescing would not be seen because the light source does not contain
a UV component. Once the prints are viewed in any other environment with a light source
containing UV, the substrate with more OBAs would fluoresce and appear bluer. Now that it is
understood that the OBAs affect perceived color, this new variable has to be accounted for when
measuring to specified color standards. Thus, Illuminant D50 is the preferred standard for
measuring and viewing environments.
Measurement Conditions
In 2009, the International Organization for Standardization (ISO) developed standardized
measurement conditions for printed material called the M series, which defined standard
Effects of Optical Brightening Agents on Color Reproduction in Digital Printing 13
illuminants for different situations based on the light sources defined above. The M series of
measurement conditions were designed “to minimize measurement variability, and to provide a
way to communicate the illumination source used for measurement” (Cheydleur & O’Connor,
2012). The current industry practice for illuminating printed substrates for measurement is M0,
though it ignores the effects of OBAs. “M0 is the illuminant source that most closely matches
standard Illuminant A, which provides consistency with existing instrumentation” (International
Organization for Standardization, 2009).
However, the process of conversion to a matching color in D50 standard is where M0 can
go wrong. “Usually, instruments illuminate a sample of the colorant and paper with a known
intensity and measure the quantity of light reflected by the sample at each wavelength, then
divide by the illuminant intensity, thus measuring the reflectance factor at each wavelength of
the sample” (Gill & Melbourne, 2011). This is the Source Independence Model of conversion.
This model assumes that if the source is placed in a different illuminant environment, the
intensity of the viewing illuminant and the sample reflectivity at each wavelength can simply be
multiplied to compute the spectrum of the light emitted by the sample (Gill & Melbourne, 2011).
However, the principle behind the OBAs is that they absorb UV light and reflect it back in the
blue range of the visible spectrum. “A key assumption of [the Source Independence Model] is
that the light that impinges on the sample at a given wavelength is reflected back at exactly the
same wavelength at a diminished intensity. Notice also that any sort of fluorescent material
breaks this model, since fluorescent materials emit light at a different wavelengths to which they
absorb it” (Gill, 2011). This discrepancy when OBAs are involved creates “serious challenges
for people trying to measure and manage color consistency in a variety of workflows,” when M0
is the standard (Cheydleur & O’Connor, 2012). Therefore, according to ISO 13655, “M0 is not
Effects of Optical Brightening Agents on Color Reproduction in Digital Printing 14
recommended for use when measured sheets exhibit fluorescence and there is a need to exchange
measurement data between facilities” (Cheydleur & O’Connor, 2012). The only time M0 can
provide accurate reflectance values is when neither the substrate nor the colorants fluoresce.
According to the International Color Consortium (ICC) recommendations for color
management, “ISO 13655 specifies how color measurements and calculations for use in Graphic
Technology are to be conducted, and specifically calls for a D50 illuminant for accurate
measurement” (International Color Consortium, 2004). Though light booth standards in the
pressroom matched D50, the illuminant in M0 reflectance measurement devices did not. In
response to the issues created by the limitations of the M0 standard, the M1 standard was
created. “ISO 13655-2009 defined Measurement Condition M1 as having illumination
corresponding to CIE Illuminant D50 to minimize differences in measurement results due to
paper fluorescence” (Konica Minolta, 2012). M1 condition specifies that the light source must
match D50, in order to reduce variation in measurement caused by fluorescence of the substrate.
This way, measurements on different substrates will have to match based on the light reflected
from both visible and UV incident light. Defining and controlling the UV component of the
illumination source is the only way to effectively manage color on OBA-enhanced substrates.
“When viewing paper containing fluorescent whitening/brightening agents, the illumination must
have a suitable form, must be continuous (energy balanced on all spectral lines), and must
contain a sufficient amount of UV radiation to excite the fluorescent agent” in order to meet M1
specifications (Tappi, 2007).
There are two other standards that are used less often, because they only apply to
standardized communication of color for specific situations. The M2 standard excludes any UV
incident light from the measurement, also referred to as UV filter or UV-cut. For an M2 standard
Effects of Optical Brightening Agents on Color Reproduction in Digital Printing 15
illuminant, “spectral power distribution of the specimen illumination must be provided in the
wavelength range from 420nm to at least 700 nm and have no substantial radiation power in the
wavelength range below 400 nm,” the region in which UV light is transmitted (International
Organization for Standardization, 2009). M2 is useful when the potential effects of UV light on
the substrate are to be purposefully ignored, because “to be able to measure the FWA in the
paper, the instrument has to be able to trigger fluorescence, which it cannot do if it is fitted with
a UV filter, or uses a light source that emits no UV (e.g. a white LED)” (Gill, 2011). For
instance, when matching a proof to a final, the proof paper’s effects are not accounted for
because its sole purpose is to provide an accurate example of how the final print will look. If the
proof paper does not have the same fluorescence as the final paper, the proof must simulate with
ink how the final print will appear. Another uncommon standard, M3, has the same basic sample
illumination as M2, but it is used for special cases when surface reflections need to be
minimized. M3 includes a “linear polarizer in the influx and efflux portions of the optical path
with tier principal axes of polarization in the orthogonal or ‘crossed’ orientation” (International
Organization for Standardization, 2009).
G7 Print Specification
G7 is a print specification created by IDEAlliance that focus on visual color consistency
across different print processes. A proof-to-print device-independent specification, G7 focuses
on achieving a neutral gray for color control through analyzing LAB color values and neutral
print density curves (NPDC). This specification provides “both a definition of grayscale…and a
calibration method for adjusting any CMYK imaging device to simulate the G7 grayscale
definition” (IDEAlliance, 2012). In this study, G7 calibration is used to create a consistent color
Effects of Optical Brightening Agents on Color Reproduction in Digital Printing 16
profile in order to reduce color balance issues and allow the focus to remain on fluorescence and
its effect on reflectance values.
Konica Minolta FD-7
The instrument used for measurement in this study is the Konica Minolta Fluorescent
Spectrodensitometer FD-7. The progressive aspect of this measurement tool is that it “uses
technology to enable color evaluation taking into consideration the fluorescence of the paper
under Illuminant D50…[and is one of] the first instruments [along with the FD-5] to provide
measurement results corresponding to ISO 13655 Measurement Condition M1. In addition, color
measurements corresponding to ISO 13655 Measurement Conditions M0 and M2 can also be
taken” (Konica Minolta, 2012). The device can be connected to a computer so the software can
simultaneously display data from the different measurements in one line graph for easy
comparison. The machine can also measure ambient lighting, and then calculate data under that
source, so the printed materials can be evaluated appropriately for their environment.
Measurement results obtained with the FD-7 more closely match visual evaluation based on the
ambient light source, as it takes the effects of OBAs into account. It takes the precision of visual
evaluation and makes it measurable.
Effects of Optical Brightening Agents on Color Reproduction in Digital Printing 17
Chapter 3 – Methodology
Overview
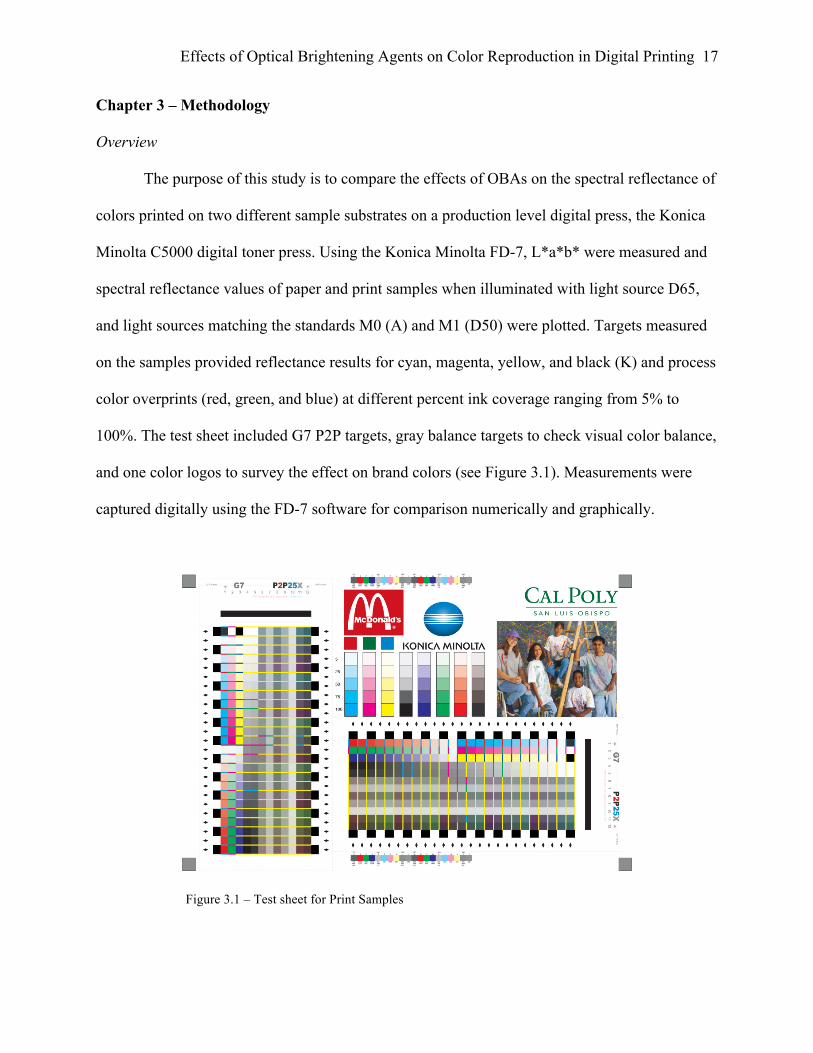
The purpose of this study is to compare the effects of OBAs on the spectral reflectance of
colors printed on two different sample substrates on a production level digital press, the Konica
Minolta C5000 digital toner press. Using the Konica Minolta FD-7, L*a*b* were measured and
spectral reflectance values of paper and print samples when illuminated with light source D65,
and light sources matching the standards M0 (A) and M1 (D50) were plotted. Targets measured
on the samples provided reflectance results for cyan, magenta, yellow, and black (K) and process
color overprints (red, green, and blue) at different percent ink coverage ranging from 5% to
100%. The test sheet included G7 P2P targets, gray balance targets to check visual color balance,
and one color logos to survey the effect on brand colors (see Figure 3.1). Measurements were
captured digitally using the FD-7 software for comparison numerically and graphically.
Figure 3.1 – Test sheet for Print Samples

Effects of Optical Brightening Agents on Color Reproduction in Digital Printing 18
Paper Samples
Two select paper samples were tested. Sample 1 was 100# Gloss Cover Futura Laser
paper from New Page with 96 Brightness. Sample 2 was 80# Text Kelly Digital Coated Paper
from Kelly Paper with 91 Brightness. The samples’ brightness levels were significantly different
to emphasize the impact of different OBA levels of the substrates on the difference in reflectance
values under different light sources.
Hypothesis
While both samples appear bright white, numerical and graphical analysis may reveal
significant differences in UV reflectance between the samples. Sample 1, the sample with higher
brightness as dictated by the manufacturer, should have a higher difference in reflectance
(ΔE2000, also referred to as ΔE00) between samples illuminated with UV and non-UV
component light sources D50 and A than Sample 2, the sample with a lower brightness value.
This difference in reflectance under UV component light sources is impacted by the level of
OBAs added to the substrates to augment brightness by increasing the fluorescence of the paper.
A ΔE00 less than 1 reflectance is important data to be aware of, but data not exceeding this limit
is not controversial, as the human eye starts to distinguish differences in perceived color at a
ΔE00 of 1. It should be noted that the results in this study are isolated from other factors
contributing to an increased ΔE00, such as lack of press calibration and natural variation, and
when all factors combine, they make the ΔE00 even higher.
According to ISO 13655 measurement standard, the qualification of each substrate as
fluorescent is determined by the ΔE00 between the Illuminant A and D65 L*a*b* values. The
authors of this paper, supported by Dr. Malcolm Keif (California Polytechnic State University
San Luis Obispo), propose that a ΔE00 between light sources of greater than 0.5 reflectance is

Effects of Optical Brightening Agents on Color Reproduction in Digital Printing 19
significant enough to assume the paper is fluorescing as result of OBAs and is not because of
natural variation in the measurement process. Analysis through this proposition may confirm that
Sample 1 fluoresces more than Sample 2 as result of OBAs.
Because contract and press proofs are viewed under D50 viewing conditions, yet are
often measured numerically under Illuminant A, the ΔE00 between Illuminants A and D50 were
compared to prove the difference in fluorescing capability is significant enough to affect color
perception for the print customer.
Methods
Both samples were printed on a Konica Minolta C5000 with multiple ink coverage test
targets, images, brand color logos, and G7 test targets. G7 methodology was followed and a
GRACoL 2006 color profile was built using the EFI Fiery Color Profiler Suite by printing and
measuring an ECI2000 target on each sample to obtain balanced grays. This allowed for the
focus in any visual color shift to be directly related to the substrate instead of any color cast
issues.
Each sample was measured with the Konica Minolta FD-7, which measures the
reflectance of the paper using the different light sources A, D50, and D65. The 25% and 100%
coverage color patches for CMYK and the process color overprints RGB were measured and
analyzed. The FD-7 device was used with the FD-7 DemoApp to capture spectral and L*a*b*
data with the specified light sources. Resultant data from each test were then plotted and ΔE00s
calculated in Microsoft Excel for numerical and graphical analysis.
Effects of Optical Brightening Agents on Color Reproduction in Digital Printing 20
Chapter 4 – Results
Delta-E 2000
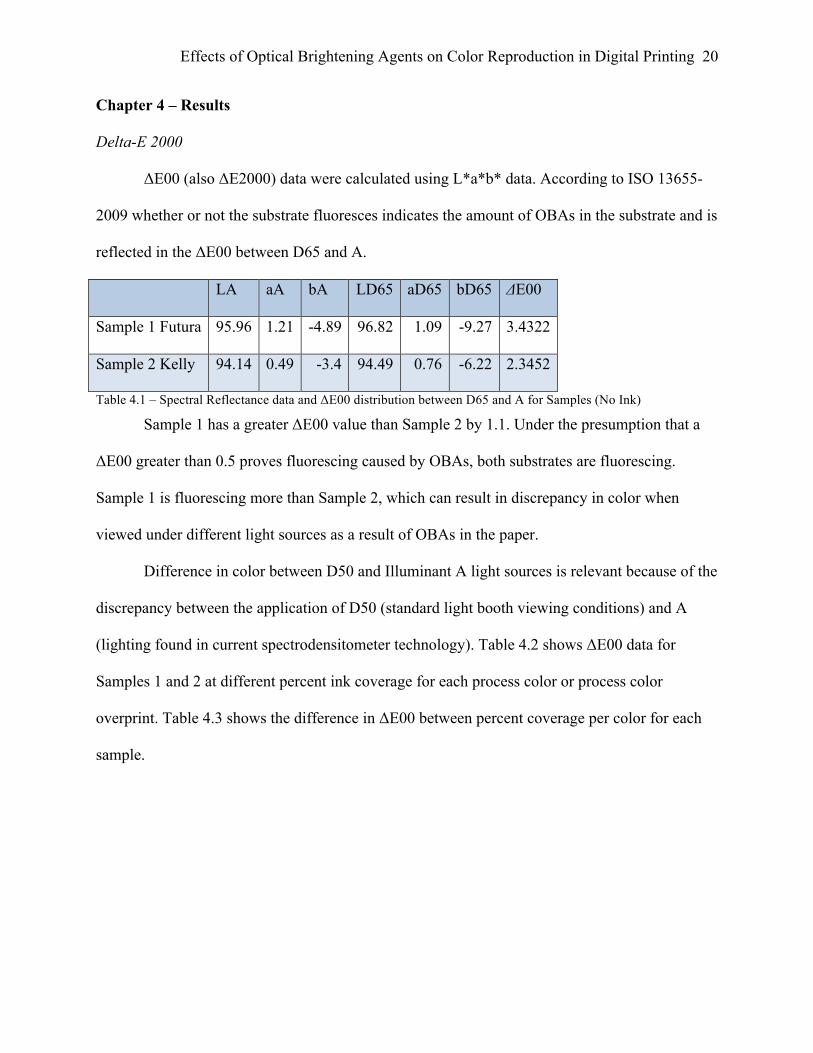
ΔE00 (also ΔE2000) data were calculated using L*a*b* data. According to ISO 13655-
2009 whether or not the substrate fluoresces indicates the amount of OBAs in the substrate and is
reflected in the ΔE00 between D65 and A.
LA aA bA LD65 aD65 bD65 ΔE00
Sample 1 Futura 95.96 1.21 -4.89 96.82 1.09 -9.27 3.4322
Sample 2 Kelly 94.14 0.49 -3.4 94.49 0.76 -6.22 2.3452
Table 4.1 – Spectral Reflectance data and ΔE00 distribution between D65 and A for Samples (No Ink)
Sample 1 has a greater ΔE00 value than Sample 2 by 1.1. Under the presumption that a
ΔE00 greater than 0.5 proves fluorescing caused by OBAs, both substrates are fluorescing.
Sample 1 is fluorescing more than Sample 2, which can result in discrepancy in color when
viewed under different light sources as a result of OBAs in the paper.
Difference in color between D50 and Illuminant A light sources is relevant because of the
discrepancy between the application of D50 (standard light booth viewing conditions) and A
(lighting found in current spectrodensitometer technology). Table 4.2 shows ΔE00 data for
Samples 1 and 2 at different percent ink coverage for each process color or process color
overprint. Table 4.3 shows the difference in ΔE00 between percent coverage per color for each
sample.
Effects of Optical Brightening Agents on Color Reproduction in Digital Printing 21
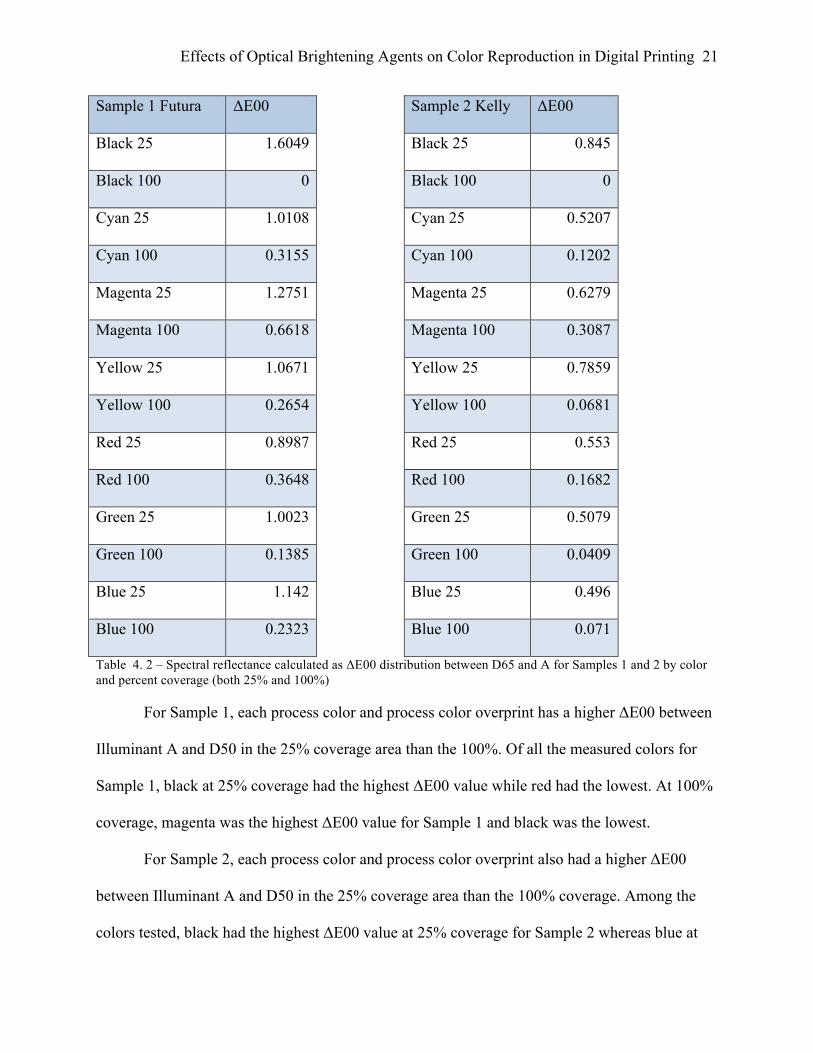
Sample 1 Futura ΔE00 Sample 2 Kelly ΔE00
Black 25 1.6049 Black 25 0.845
Black 100 0 Black 100 0
Cyan 25 1.0108 Cyan 25 0.5207
Cyan 100 0.3155 Cyan 100 0.1202
Magenta 25 1.2751 Magenta 25 0.6279
Magenta 100 0.6618 Magenta 100 0.3087
Yellow 25 1.0671 Yellow 25 0.7859
Yellow 100 0.2654 Yellow 100 0.0681
Red 25 0.8987 Red 25 0.553
Red 100 0.3648 Red 100 0.1682
Green 25 1.0023 Green 25 0.5079
Green 100 0.1385 Green 100 0.0409
Blue 25 1.142 Blue 25 0.496
Blue 100 0.2323
Blue 100 0.071
Table 4. 2 – Spectral reflectance calculated as ΔE00 distribution between D65 and A for Samples 1 and 2 by color and percent coverage (both 25% and 100%)
For Sample 1, each process color and process color overprint has a higher ΔE00 between
Illuminant A and D50 in the 25% coverage area than the 100%. Of all the measured colors for
Sample 1, black at 25% coverage had the highest ΔE00 value while red had the lowest. At 100%
coverage, magenta was the highest ΔE00 value for Sample 1 and black was the lowest.
For Sample 2, each process color and process color overprint also had a higher ΔE00
between Illuminant A and D50 in the 25% coverage area than the 100% coverage. Among the
colors tested, black had the highest ΔE00 value at 25% coverage for Sample 2 whereas blue at
Effects of Optical Brightening Agents on Color Reproduction in Digital Printing 22
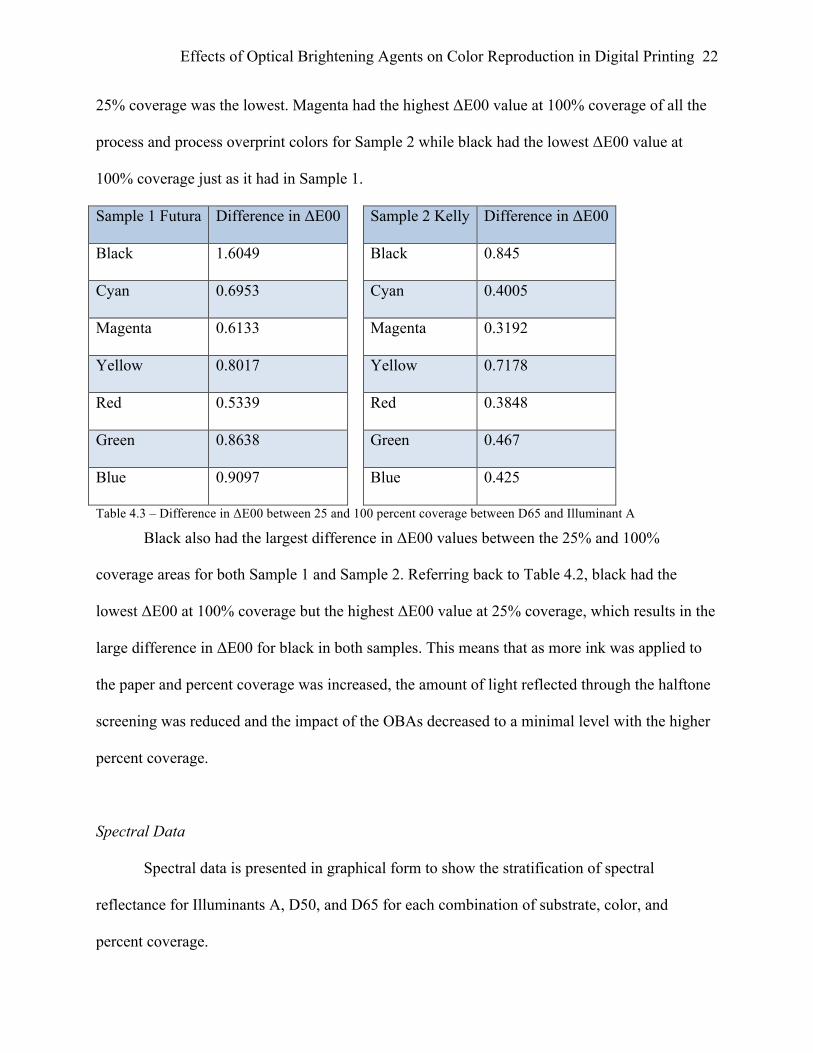
25% coverage was the lowest. Magenta had the highest ΔE00 value at 100% coverage of all the
process and process overprint colors for Sample 2 while black had the lowest ΔE00 value at
100% coverage just as it had in Sample 1.
Sample 1 Futura Difference in ΔE00 Sample 2 Kelly Difference in ΔE00
Black 1.6049 Black 0.845
Cyan 0.6953 Cyan 0.4005
Magenta 0.6133 Magenta 0.3192
Yellow 0.8017 Yellow 0.7178
Red 0.5339 Red 0.3848
Green 0.8638 Green 0.467
Blue 0.9097
Blue 0.425
Table 4.3 – Difference in ΔE00 between 25 and 100 percent coverage between D65 and Illuminant A
Black also had the largest difference in ΔE00 values between the 25% and 100%
coverage areas for both Sample 1 and Sample 2. Referring back to Table 4.2, black had the
lowest ΔE00 at 100% coverage but the highest ΔE00 value at 25% coverage, which results in the
large difference in ΔE00 for black in both samples. This means that as more ink was applied to
the paper and percent coverage was increased, the amount of light reflected through the halftone
screening was reduced and the impact of the OBAs decreased to a minimal level with the higher
percent coverage.
Spectral Data
Spectral data is presented in graphical form to show the stratification of spectral
reflectance for Illuminants A, D50, and D65 for each combination of substrate, color, and
percent coverage.
Effects of Optical Brightening Agents on Color Reproduction in Digital Printing 23
Substrate
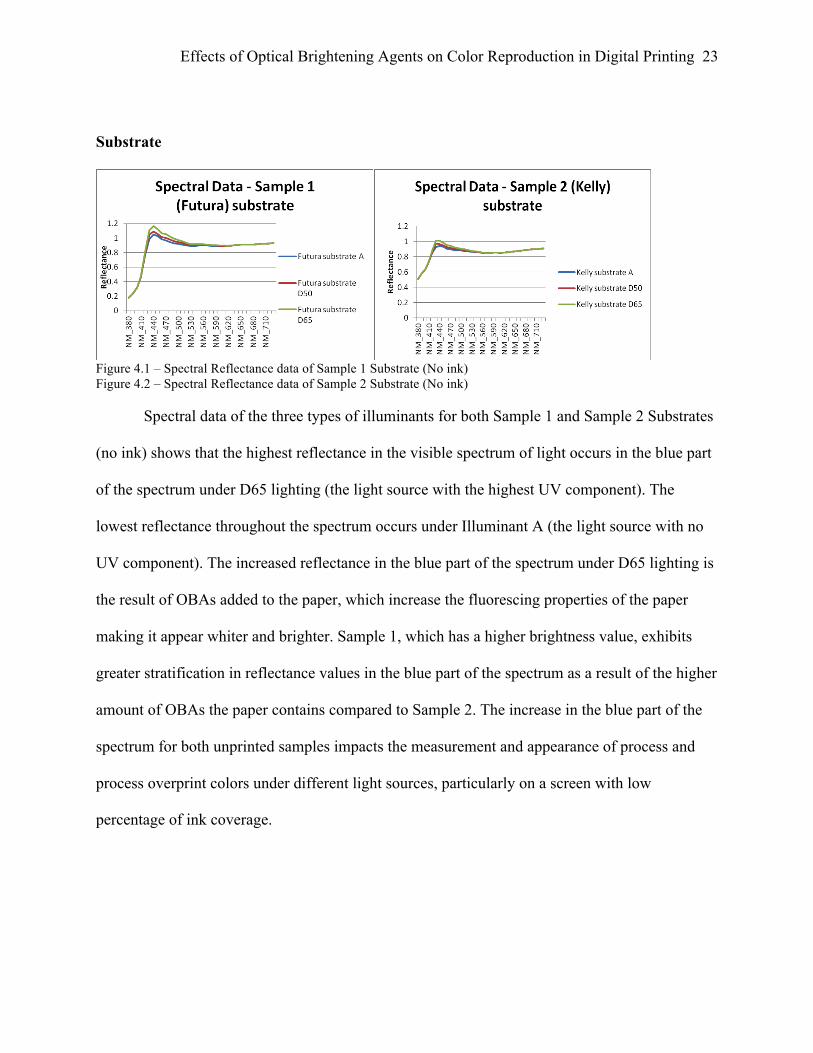
Figure 4.1 – Spectral Reflectance data of Sample 1 Substrate (No ink) Figure 4.2 – Spectral Reflectance data of Sample 2 Substrate (No ink)
Spectral data of the three types of illuminants for both Sample 1 and Sample 2 Substrates
(no ink) shows that the highest reflectance in the visible spectrum of light occurs in the blue part
of the spectrum under D65 lighting (the light source with the highest UV component). The
lowest reflectance throughout the spectrum occurs under Illuminant A (the light source with no
UV component). The increased reflectance in the blue part of the spectrum under D65 lighting is
the result of OBAs added to the paper, which increase the fluorescing properties of the paper
making it appear whiter and brighter. Sample 1, which has a higher brightness value, exhibits
greater stratification in reflectance values in the blue part of the spectrum as a result of the higher
amount of OBAs the paper contains compared to Sample 2. The increase in the blue part of the
spectrum for both unprinted samples impacts the measurement and appearance of process and
process overprint colors under different light sources, particularly on a screen with low
percentage of ink coverage.
Effects of Optical Brightening Agents on Color Reproduction in Digital Printing 24
Process Cyan
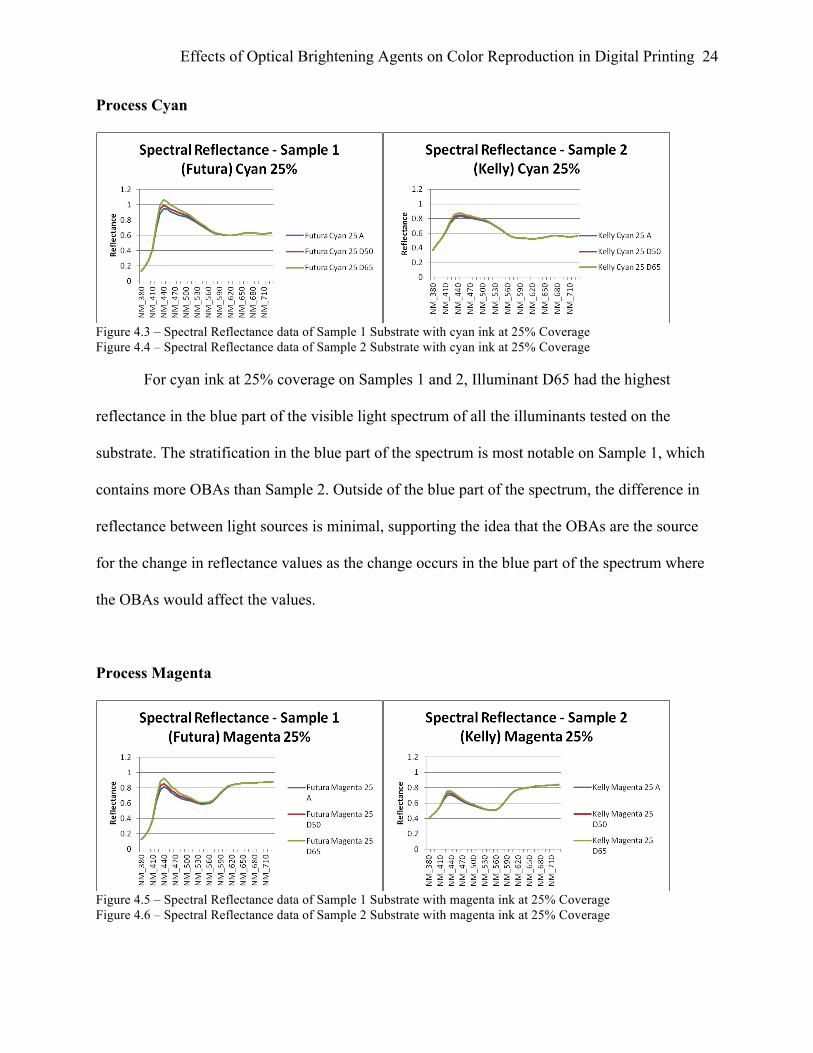
Figure 4.3 – Spectral Reflectance data of Sample 1 Substrate with cyan ink at 25% Coverage Figure 4.4 – Spectral Reflectance data of Sample 2 Substrate with cyan ink at 25% Coverage
For cyan ink at 25% coverage on Samples 1 and 2, Illuminant D65 had the highest
reflectance in the blue part of the visible light spectrum of all the illuminants tested on the
substrate. The stratification in the blue part of the spectrum is most notable on Sample 1, which
contains more OBAs than Sample 2. Outside of the blue part of the spectrum, the difference in
reflectance between light sources is minimal, supporting the idea that the OBAs are the source
for the change in reflectance values as the change occurs in the blue part of the spectrum where
the OBAs would affect the values.
Process Magenta
Figure 4.5 – Spectral Reflectance data of Sample 1 Substrate with magenta ink at 25% Coverage Figure 4.6 – Spectral Reflectance data of Sample 2 Substrate with magenta ink at 25% Coverage

Effects of Optical Brightening Agents on Color Reproduction in Digital Printing 25
For both Samples 1 and 2, the greatest change in reflectance throughout the visible light
spectrum occurs in the blue part of the spectrum for magenta ink at 25% coverage. The highest
reflectance for magenta in Sample 1 occurs under the D65 light source, whereas in Sample 2 the
peak in the reflectance curve occurs in the red part of the visible spectrum of light. To address
the notable decrease in the reflectance at 470-590nm (the green part of the spectrum), magenta
absorbs green light, so the reflectance in this region of the curve is to be expected.
Process Yellow
Figure 4.7 – Spectral Reflectance data of Sample 1 Substrate with yellow ink at 25% Coverage Figure 4.8 – Spectral Reflectance data of Sample 2 Substrate with yellow ink at 25% Coverage
For yellow at 25% coverage on Sample 1, D65 reflects more in the blue part of the visible
spectrum, however, when approaching the transition between the green and red part of the
spectrum, D50 reflects more light than D65. This data seems to be potentially skewed, as no
other color’s graph behaved this way, including the same ink on the other substrate. Also, the
very low D50 reflectance at the beginning of the spectrum was not expected. Sample 2 shows
less stratification throughout the visible spectrum than Sample 1, with D65 lighting providing the
greatest difference in reflectance values in the blue part of the spectrum, but the green to red
portion of the spectrum still reflected the most, due to the fact that yellow ink absorbs blue light.

Effects of Optical Brightening Agents on Color Reproduction in Digital Printing 26
Process Overprint Red
Figure 4.9 – Spectral Reflectance data of Sample 1 Substrate with Process Overprint red at 25% Coverage Figure 4.10 – Spectral Reflectance data of Sample 2 Substrate with Process Overprint red at 25% Coverage
Process overprint red is a combination of halftone screenings of process magenta and
process yellow. For both Sample 1 and Sample 2, reflectance values are relatively consistent
throughout the visible spectrum except in the blue part of the spectrum. Sample 1 features greater
stratification between reflectance values under the different illuminants than Sample 2, however
both have the highest reflectance values occuring under the D65 light source. The highest overall
reflectance occurs in the red part of the visible spectrum, which is to be expected because this is
what makes the color appear red.
Process Overprint Blue
Figure 4.11 – Spectral Reflectance data of Sample 1 Substrate with Process Overprint blue at 25% Coverage Figure 4.12 – Spectral Reflectance data of Sample 2 Substrate with Process Overprint blue at 25% Coverage

Effects of Optical Brightening Agents on Color Reproduction in Digital Printing 27
Process overprint blue is a combination of halftone screenings of process cyan and
process magenta. Comparing Sample 1 and Sample 2, Sample 1 exhibits greater stratification
between light sources in the blue part of the spectrum than Sample 2. Both samples’ greatest
reflectance occurs in the blue part of the spectrum under the D65 light source. The greater
presence of OBAs in Sample 1 boosts the blue reflectance more than in Sample 2.
Process Overprint Green
Figure 4.13 – Spectral Reflectance data of Sample 1 Substrate with Process Overprint green at 25% Coverage Figure 4.14 – Spectral Reflectance data of Sample 2 Substrate with Process Overprint green at 25% Coverage
Process overprint green is a combination of halftone screenings of process cyan and
process yellow. The greatest reflectance for Sample 1 and Sample 2 occurs in the green part of
the spectrum of light, however for both samples the greatest stratification in reflectance values
occurs in the blue part of the spectrum. Under the D65 light source, both samples fluoresce and
reflect more blue light, but overall the reflectance values are relatively stable throughout the
visible spectrum.
Effects of Optical Brightening Agents on Color Reproduction in Digital Printing 28
Chapter 5 – Conclusion
Brightness values affect reflectance because of the amount of OBAs in paper. Paper with
more OBAs increases the fluorescence, and therefore, the UV reflectance of the substrate. In this
study, the sample images appeared similar under visual comparison due to G7 methodology
used. However, the impact of increased OBAs still created a quantitative difference in the ΔE00
reflectance values between Illuminant A and D50.
The ΔE00 of 3.4322 between Illuminants A and D65 in Sample 1 and of 2.3452 in
Sample 2 reveals that both substrates fluoresce according to ISO 13655, because both ΔE00
measurements are higher than .5. Sample 1 had a greater ΔE00 than Sample 2, meaning it
fluoresces more and is a brighter paper. This is consistent with Sample 1’s higher brightness
number as dictated by the manufacturer, which, with support of ΔE00 findings, means that it
contains more OBAs than Sample 2. Comparison of Figures 4.1 & 4.2 supports the idea that the
substrate with more OBAs will then have a greater variability in reflectance values between light
sources, causing discrepancies when measured or viewed under different light sources. Because
Sample 1 will appear brighter under UV component D50 lighting, colors may appear different
not only between substrates under the same light, but in the same substrate under different light
sources. Because D50 and A light sources are commonly used in standard light booths and
spectrodensitometer tools respectively, a ΔE00 difference between these light sources is a
relevant source of concern when it comes to color matching.
The 25% coverage areas for each color on both substrates had higher ΔE00 results than
the 100% coverage areas. In fact, the substrate without ink had the highest ΔE00 for Sample 1
(0.9332) and the second highest ΔE00 for Sample 2 (1.4134). The greater the ink coverage on
high OBA substrates, the less the spectral reflectance under different illuminants. This means
Effects of Optical Brightening Agents on Color Reproduction in Digital Printing 29
that profile adjustments for accurate color reproduction cannot simply be made based on the ink
color and substrate, but must also consider the coverage percentage.
It was initially assumed that the yellow ink would have greater ΔE00 between light
sources because yellow is blue’s complimentary color; they are opposites on the RGB color
wheel. This means that yellow absorbs the most blue light and reflects the least, so it was
expected that the ΔE00 in the blue region would have less variation than other colors would.
However, the data indicates this assumption was inaccurate. On Sample 1, the yellow 25% ΔE00
was 1.0671, higher than cyan, but lower than black, magenta, and the substrate itself. However,
yellow had a higher difference between the 25% ΔE00 and the 100% ΔE00 than the cyan or
magenta (0.8017), though lower than black, reinforcing the fact that the unprinted substrate
fluoresces enough to influence the overall perceived color of the area. On Sample 2, the
difference between yellow’s 25% and 100% ΔE00 was 0.7178; again, second highest after black.
This is because the 100% black on both substrates reflects so little light either way that there was
no ΔE00 between light sources.
Yellow was not affected the most overall by the fluorescence, but was affected the most
(except for black) compared to its solid area counterpart. Additionally, the ΔE00 values were
determined from the L*a*b* values measured, not from spectral data specific to the blue region.
Isolating this section for further analysis could prove a greater difference in reflectance between
light sources compared to the same region for other colors. Further study is needed to determine
if specific colors are more influenced by OBAs substrates under different illuminants.
As a group, the overprinted colors (red, green and blue) had lower ΔE00 measurements
than the individual process colors. Among Sample 1 measurements, red had the lowest ΔE00 at
25% screening at 0.8987, while blue 25% had the lowest for Sample 2, at 0.4960. This can be
Effects of Optical Brightening Agents on Color Reproduction in Digital Printing 30
attributed to the fact that layering screens of multiple colors can muddy the effect of reflectance,
resulting in a lower ΔE00.
Overall, the majority of the ΔE00 measurements were under 1, with some slightly over,
but none reaching 2. The highest ΔE00 for both substrates was black 25%, at 1.6049 for Sample
1 0.845 for Sample 2. Therefore, when measuring for accurate color for one job or process with
machinery of differing light sources, the effect on color may not vary drastically when different
light sources are used. However, the information is valuable because, when compounded with
natural variation or other contributing factors to an increased ΔE00, this could create a problem
when it comes to color matching specifications of a customer between press and proof.
Effects of Optical Brightening Agents on Color Reproduction in Digital Printing 31
References
Cheydleur, R., & O’Connor, K. (2011). The M factor…what does it mean? X-Rite Incorporated.
1-3.
Datacolor. (2012). UV calibration and whiteness FAQs. Datacolor. Retrieved from
http://knowledgebase.datacolor.com/admin/attachments/uv_calibration_and_whiteness_f
aqs15.pdf
Gill, Graeme. (2011). Fluorescent Whitener Additive Compensation (FWA Compensation).
Argyll CMS. Retrieved from http://www.argyllcms.com/doc/FWA.html
Gill, G. W., & Melbourne, C.P.L. (2011). A practical approach to measuring and modeling paper
fluorescence for improved colorimetric characterization of printing processes. 1.
Goyal, Hari. (2000). Properties of Paper. Pulp & Paper Resources on the Web. Retrieved from
http://www.paperonweb.com/paperpro.htm
IDEAlliance. (2012). What is G7?. IDEAlliance. Retrieved from
http://www.idealliance.org/specifications/g7/what-g7.
International Color Consortium. (2004). ICC recommendations for color measurement. ICC.
Retrieved from www.color.org/ICC_white_paper3measurement.pdf
International Organization for Standardization. (2009). Graphic technology — spectral
measurement and colorimetric computation for graphic arts images. ISO. Retrieved from
http://www.iso.org/iso/catalogue_detail?csnumber=39877
Irvine, James. (2011). Topic 5 What are the uses and hazards of waves that form the
Electromagnetic Spectrum?. Antonine Education Website. Retrieved from
http://www.antonine-
education.co.uk/physics_gcse/Unit_1/Topic_5/topic_5_what_are_the_uses_and_ha.htm
Effects of Optical Brightening Agents on Color Reproduction in Digital Printing 32
Keif, M. (2012). Get out of the dark with optical brighteners? N/A. Word document.
Konica Minolta. (2012). FD-7 / FD-5 Spectrodensitometers. Konica Minolta. Retrieved from
http://www.konicaminolta.com/instruments/products/color-
measurement/spectrodensitometer/fd-7/index.html
Myers, Bruce. (2009). Reflection Densitometers and SpectroDensitometers, a review of
terminology. Printing Color & Process Control. Retrieved from
http://colorprocesscontrol.typepad.com/printing_color_process_co/2009/11/reflection-
densitometers-and-spectrodensitometers-a-review-of-terminology.html
N/A. (2012). What Is Metamerism? wiseGeek.com. Retrieved from
http://www.wisegeek.com/what-is-metamerism.htm.
N/A. (2010). X-Rite introduces next generation color profiling. American Printer. Retrieved
from http://search.proquest.com/docview/304730890/fulltext?source=
fedsrch&accountid=10043
Tappi. (2007). Light sources for evaluating papers including those containing fluorescent
whitening agents. Tappi. Retrieved from ww.tappi.org/content/tag/sarg/t1212.pdf
The Physics Classroom. (2012). Visible Light and the Eye’s Response. The Physics Classroom.
Retrieved from http://www.physicsclassroom.com/class/
light/U12L2b.cfm
The Printery. (2012). G7 Printing. The Printery. Retrieved from
http://www.printerywi.com/resources/g7-printing.html.
Wales, Trish. (2008). Making It White and Brighter. Graphic Arts Monthly, 80.7, 34.
Weiss, Michael. (2001). Phosphorescence. Retrieved from http://math.ucr.edu/home/
baez/spin/node17.html