EFFECTS OF MAIN ROOF FRACTURING ON ENERGY ......EFFECTS OF MAIN ROOF FRACTURING ON ENERGY EVOLUTION...
11
Acta Geodyn. Geomater., Vol. 14, No. 4 (188), 377–387, 2017 DOI: 10.13168/AGG.2017.0019 journal homepage: https://www.irsm.cas.cz/acta ORIGINAL PAPER EFFECTS OF MAIN ROOF FRACTURING ON ENERGY EVOLUTION DURING THE EXTRACTION OF THICK COAL SEEMS IN DEEP LONGWALL FACES Jun WANG, Jianguo NING *, Lishuai JIANG *, Qingheng GU, Qiang XU and Jinquan JIANG State Key Laboratory of Mining Disaster Prevention and Control, Co-founded by Shandong Province and the Ministry of Science and Technology, College of Mining and Safety Engineering, Shandong University of Science and Technology, 579 Qianwangang Road, Qingdao 266590, China *Corresponding author‘s e-mail: [email protected]; [email protected] ABSTRACT During the extraction of coal from thick seams in deep longwall faces, both high in-situ stress and a massive main roof are common. The progressive fracturing in this massive main roof leads to an increase in the front abutment stress and changes in the strain energy of the coal seam which can lead to dynamic disasters such as rockbursts. Based on the mining conditions observed in Panel 5301 of the Xinhe Coal Mine, microseismic (MS) and borehole stress monitoring, along with numerical simulations, was used to propose an evolution law for coal mine roof fracture, front abutment stress, and strain energy. Results indicate that as the roof collapses during the progress of extraction, the transmission point for overburden load moves forward such that the peak front abutment stress advances to 20–25 m in front of the working face. The coal mass within 22–90 m in front of the working face was observed to accumulate 176.2 kJ of strain energy, with the peak strain energy increasing from 80.15 kJ to 136 kJ. The data collected and analyzed in this research provides a theoretical basis for forecasting the location of mining-induced rockburst based on observed fracturing in the main roof. ARTICLE INFO Article history: Received 18 April 2017 Accepted 26 July 2017 Available online 1 September 2017 Keywords: Deep coal mining Microseismic monitoring Roof fracturing Numerical simulation Energy evolution than 500 m until the 20 th century. As a result, the main tasks required in most underground coal mines were strata behavior control, roof management, and etc. (Ren et al., 2014; Wang et al., 2015). The key to addressing these issues is understood the influence of roof beam movement on the evolution of abutment stress. Many theoretical and numerical models, as well as technical methods, have been developed to analyze the change rule for the abutment stress distribution, stress concentration regions, and the relocation of the peak abutment stress as the main roof moves (Zhang et al., 2014; Ning et al., 2017). At present, the depletion of shallow coal resources and the capabilities of new technologies have led to a remarkable increase in the depth of underground coal mines. Many coal mines are now developed more than 1000 m underground (Liu et al., 2016). Because of the significantly higher magnitude of stress, rockbursts occur more often in the longwall faces of the excavations, posing a very serious risk to equipment and worker safety. Many authors have noted that rockbursts are an energy phenomenon, generally associated with evolution of strain energy in mining-disturbed zones. As a result, many scholars have attempted to develop an evolution and redistribution law for strain energy in mining- disturbed zones to assess the potential danger of rockbursts. Wang et al. (2016) assessed dynamic INTRODUCTION When extracting coal from deep underground, the movement of overlying strata induced by mining activities, especially the fracturing of the main roof, results in stress redistribution (Tan et al., 2017). This stress redistribution changes the strain energy of the surrounding rock in mining-disturbed zones. If the change in the energy of the coal-rock system is severe enough, it can result in dynamic disasters (Wang et al., 2013; Lu et al., 2015; Zhu et al., 2016). It has been demonstrated that once main roof fracturing occurs, the stress concentration factor and strain energy of the loaded coal-rock increases, frequently resulting in rockbursts, particularly when the deep coal seam is very thick. Therefore, quantitatively relating the fracturing of the main roof to the change in strain energy in the rock around the longwall not only helps to predict the development of stress-induced dynamic disasters, but also helps to improve future design proposals for pre-reinforcement of the mine roadway. In the past 50 years, in order to uncover the mechanism of different mining-induced disasters (roof fall, roadway instability, rockburst, and etc.), many researchers have studied the relationship between the movement of overlying strata and the evolution of abutment stress/strain energy in mining-disturbed zones (Kong, 2014; Jiang et al., 2016). In China, the average depth of an underground coal mine was less Cite this article as: Wang J, Ning J, Jiang L et al: Effect of main roof fracturing on energy evolution during the extraction of thick coal seems in deep longwall faces. Acta Geodyn. Geomater., 14, No. 4 (188), 377–387, 2017. DOI: 10.13168/AGG.2017.0019
Transcript of EFFECTS OF MAIN ROOF FRACTURING ON ENERGY ......EFFECTS OF MAIN ROOF FRACTURING ON ENERGY EVOLUTION...
Acta Geodyn. Geomater., Vol. 14, No. 4 (188), 377–387, 2017
DOI: 10.13168/AGG.2017.0019
journal homepage: https://www.irsm.cas.cz/acta
ORIGINAL PAPER
EFFECTS OF MAIN ROOF FRACTURING ON ENERGY EVOLUTION DURING THE EXTRACTION OF THICK COAL SEEMS IN DEEP LONGWALL FACES
Jun WANG, Jianguo NING *, Lishuai JIANG *, Qingheng GU, Qiang XU and Jinquan JIANG
State Key Laboratory of Mining Disaster Prevention and Control, Co-founded by Shandong Province and the Ministry of Science and Technology, College of Mining and Safety Engineering, Shandong University of Science and Technology,
579 Qianwangang Road, Qingdao 266590, China
*Corresponding author‘s e-mail: [email protected]; [email protected]
ABSTRACT
During the extraction of coal from thick seams in deep longwall faces, both high in-situ stressand a massive main roof are common. The progressive fracturing in this massive main roof leadsto an increase in the front abutment stress and changes in the strain energy of the coal seamwhich can lead to dynamic disasters such as rockbursts. Based on the mining conditionsobserved in Panel 5301 of the Xinhe Coal Mine, microseismic (MS) and borehole stressmonitoring, along with numerical simulations, was used to propose an evolution law for coalmine roof fracture, front abutment stress, and strain energy. Results indicate that as the roofcollapses during the progress of extraction, the transmission point for overburden load movesforward such that the peak front abutment stress advances to 20–25 m in front of the workingface. The coal mass within 22–90 m in front of the working face was observed to accumulate176.2 kJ of strain energy, with the peak strain energy increasing from 80.15 kJ to 136 kJ. Thedata collected and analyzed in this research provides a theoretical basis for forecasting thelocation of mining-induced rockburst based on observed fracturing in the main roof.
ARTICLE INFO
Article history:
Received 18 April 2017 Accepted 26 July 2017 Available online 1 September 2017
Keywords: Deep coal mining Microseismic monitoring Roof fracturing Numerical simulation Energy evolution
than 500 m until the 20th century. As a result, the maintasks required in most underground coal mines werestrata behavior control, roof management, and etc.(Ren et al., 2014; Wang et al., 2015). The key toaddressing these issues is understood the influence ofroof beam movement on the evolution of abutmentstress. Many theoretical and numerical models, aswell as technical methods, have been developed toanalyze the change rule for the abutment stressdistribution, stress concentration regions, and therelocation of the peak abutment stress as the main roofmoves (Zhang et al., 2014; Ning et al., 2017).
At present, the depletion of shallow coalresources and the capabilities of new technologieshave led to a remarkable increase in the depth ofunderground coal mines. Many coal mines are nowdeveloped more than 1000 m underground (Liu et al.,2016). Because of the significantly higher magnitudeof stress, rockbursts occur more often in the longwallfaces of the excavations, posing a very serious risk toequipment and worker safety. Many authors havenoted that rockbursts are an energy phenomenon,generally associated with evolution of strain energy inmining-disturbed zones. As a result, many scholarshave attempted to develop an evolution andredistribution law for strain energy in mining-disturbed zones to assess the potential danger ofrockbursts. Wang et al. (2016) assessed dynamic
INTRODUCTION
When extracting coal from deep underground,the movement of overlying strata induced by miningactivities, especially the fracturing of the main roof,results in stress redistribution (Tan et al., 2017). Thisstress redistribution changes the strain energy of thesurrounding rock in mining-disturbed zones. If thechange in the energy of the coal-rock system is severeenough, it can result in dynamic disasters (Wang etal., 2013; Lu et al., 2015; Zhu et al., 2016). It has beendemonstrated that once main roof fracturing occurs,the stress concentration factor and strain energy of theloaded coal-rock increases, frequently resulting inrockbursts, particularly when the deep coal seam isvery thick. Therefore, quantitatively relating thefracturing of the main roof to the change in strainenergy in the rock around the longwall not only helpsto predict the development of stress-induced dynamicdisasters, but also helps to improve future designproposals for pre-reinforcement of the mine roadway.
In the past 50 years, in order to uncover themechanism of different mining-induced disasters (rooffall, roadway instability, rockburst, and etc.), manyresearchers have studied the relationship between themovement of overlying strata and the evolution ofabutment stress/strain energy in mining-disturbedzones (Kong, 2014; Jiang et al., 2016). In China, theaverage depth of an underground coal mine was less
Cite this article as: Wang J, Ning J, Jiang L et al: Effect of main roof fracturing on energy evolution during the extraction of thick coalseems in deep longwall faces. Acta Geodyn. Geomater., 14, No. 4 (188), 377–387, 2017.
DOI: 10.13168/AGG.2017.0019

J. Wang et al.
378
siltstone, and mudstone) with a mean thickness of29.8 m, which directly caved into the gob followingthe advance of the shield support. The main roof wasprimarily composed of fine sandstone and siltstonewith a mean thickness of 41.8 m.
The exact magnitudes of the in-situ stresses wereunknown in the mine region. So that the ensuingnumerical simulation would accurately reflect the in-situ stress orientation and magnitude, stressmeasurements were conducted as part of this study.These measurements were carried out at two locations(A and B) along longwall Face 5301, as shown inFigure 1a. The stress relief method was employed tomeasure stresses with the results listed in Table 1. Itcan be seen in these measurement results that themajor horizontal stress (28.41 MPa–28.66 MPa) washigher than the vertical stress, with the ratio ofσhmax/σv varying from 1.15-1.19.
changes in strain energy due to mining using the finitedifference software package FLAC3D in attempt todefine the relationship between the change in energyand the periodic weight. Similarly, Rezaei et al.(2015) evaluated an accumulation and dissipation lawof energy on a longwall mining face.
According to the available literature, themovement of overlying strata is associated with thedevelopment of abutment stress and strain energywhich can interact to establish the necessaryconditions for dynamic disasters. Much of theaccumulation and release of energy whichaccompanies mining activities is developed by theconcentration and redistribution of abutment stress(Hu et al., 2017). In the case of longwall mining,which proceeds under the constantly shifting effectsof overburden weight, abutment stress is continuouslyformed and changed by the movement of the mainroof (Zhu et al., 2016). Therefore, it is necessary tounderstand the relationship between the movement ofthe main roof and the changes in the energy of thesurrounding rock as longwall mining is conducted.
The present study, based on geologicalconditions observed in a typical longwall panel fromthe Xinhe Mine in the city of Jining, China,investigates the main roof separation and fracturing byusing in-situ microseismic observations. Theevolution of abutment stress is then quantified byborehole stress monitoring, and an analysis of therelationship between the observed stress and themovement of the main roof is conducted. Finally, anaccumulation and release law of strain energy due tomain roof fracturing is obtained, providing a basis forrockburst risk evaluation and improved rock supportdesign.
CASE STUDY
ENGINEERING BACKGROUND
Geographically, the Xinhe Mine is located inJining City, Shandong province, China and hasa designed annual production of 90,000 tones. Thereare three key mineable coal seams in this mine,labelled #3, #16 and #17, of which Seam #3 was theonly one being actively mined at the time of thisstudy. Coal Seam #3 has a mean thickness of 10.2 m,a buried depth of 940 m, and is nearly horizontal withan average dip angle of 6º, varying from 5 to 9º. Thetypical layout of the working face is shown in Figure1a, which depicts longwall Face 5301, 844 m long and100 m wide. Both the northeast and northwest sides ofthe longwall Face 5301 consist of unmined solid coal,and the southwest side abuts longwall Face 5302.Longwall Face 5301 was mined using the inclinedlongwall-retreating all-caving fully mechanizedmining method with a mining speed of 4–5 m/d alongthe wall. A simplified stratigraphic column, based oncore logging of this panel, is shown in Figure 1b. Theroof strata of this panel was mainly composed ofmudstone, fine sandstone, sandstone & siltstone, andsiltstone, etc. The immediate roof consisted of a four-rock layer (sandstone & siltstone, fine sandstone,
Table 1 In-situ stress measurement results.
Station σhmax (MPa)
σhmin (MPa)
σv (MPa)
σhmax/σv
A 28.41 23.18 24.72 1.15 B 28.66 24.53 24.91 1.19 Mean 28.54 23.86 24.82 1.17
FIELD MONITORING SCHEME
To conduct an in-depth investigation of mining-induced strata movement, stress change behaviors atlongwall Face 5301 were measured by three differentfield monitoring programs, described as follows: 1. For the field monitoring of overburden
movement, a 16-channel ARAMIS M/E MSsystem developed by the Poland Institute ofInnovative Techniques was used. The ARAMISMS system consists of a real-time monitoringrecorder server, an analyzer, accelerometers, anda seismic data transmission system. Themonitoring frequency range of a typical sensorused was 0-150 Hz, a sampling rate of 500 Hz,a response range of 100 m, and a minimumpositioning energy of 100 J. To determine thespatial location of seismic sources, the constantvelocity model (VP = 4000 m/s for geophones#1–6, VP = 3000 m/s for geophones #7–10, andVP = 2800 m/s for geophone #16) was used. Thesensor readings were converted into a digitalsignal by digital transmission system which thentransmitted the data to a real-time monitoringrecorder server using optical fiber cables.
The horizontal and vertical location errors ofthe MS sensors were significantly reduced byoptimizing their arrangement with considerationof the spatial characteristics of rock mass fractureand the convenience of sensor installation. A totalof nine geophones, numbered #1–9 in Figure 1a,were installed underground in the mine: #1-8were installed in longwall Face 5301, while #9was located in a bedrock borehole to satisfy theD-value optimization criteria (Li et al., 2017).The geophones were attached to rebar bolts

EFFECTS OF MAIN ROOF FRACTURING ON ENERGY EVOLUTION DURING THE … .
379
Setup entry
Taigate of 5301
Longwall face 5302
100m
40m
Stop line
Thickness(m)
Lithology
Fine sandstone & siltstone
3# coal seam
Mudstone
Fine sandstone
Siltstone
18.2
3.2
22.5
5.47
1.38
15.9
6.5
1.56
10.2
1.44
6.10
0.90
6.25
1.1
Thickness(m)
Lithology
Fine sandstone & siltstone
3# coal seam
Mudstone
Fine sandstone
Siltstone
18.2
3.2
22.5
5.47
1.38
15.9
6.5
1.56
10.2
1.44
6.10
0.90
6.25
1.1
50m 50m
30m …… ……
18m
……5m
……
MS sensorMS sensor
Borehole stress meter
1# 10# 11#
1# 11# 12#
50m 40m
(a) (b)
(c)
20#
844m AA
B
-902.536.12
-902.536.12
20#
Direction of mining
Headentry of 5301
Fine sandstone
Mudstone
Siltstone
Mudstone
Fine sandstone
Fine sandstone
Medium sandstone
Mudstone
Mudstone
Column
North
Fig. 1 Plan view of local panel layout; (b) Typical geological column; (c) Monitoring stations for frontabutment stress.
Table 2 Locating results of the blasting events.
Blast Number
location Blasting location (m) Event location (m) Error (m)
1 x 3918680.521 3918678
7.3 y 39451447.423 39451454 z -954.056 -956
2 x 3918681.435 3918683
10.2 y 39451448.126 39451458 z -955.032 -953
3 x 3918679.211 3918682
6.4 y 39451446.769 39451453 z -956.159 -958
was less than 5 m from a meter, the meter wasremoved, and a new station was installedfollowing the station furthest from the advancingworking face.
3. To monitor shield leg support pressures in real-time, a KJ216 support pressure monitoringsystem, produced by UROICAC. LTD., wasoperated. The monitoring range of the pressuresensor was 0–60 MPa.
MOVEMENT EVOLUTION OF OVERBURDEN WITH MINING
Using the temporal-spatial distribution of MSevents, the fracturing morphology of the overburdenstrata accompanying mining activities on longwallFace 5301 can be identified. Figure 2 shows thevertical distribution of MS events from 28 November,2015 to 5 January, 2016 (over which period theworking face advanced 175.3 m from setup entry). Itshould be noted that in Figure 2, the interval betweenadjacent horizontal lines is 20 m, and the main roof islocated in the area between the two red lines.
As shown in Figure 2, MS events were occurredin the #3 coal seam, as well as in its floor and roof,
installed in the intact roof structures of thegateroads using tight screw thread connections,which allowed staff to remove a sensor froma readily fracturing zone. With the advancementof the working face, the geophone nearest theadvancing face was relocated to the next unusedsensor location. Before using the monitoringsystem to detect MS events, the system needed tobe calibrated for the particular working conditionsin the mine. To calibrate the sensors for thisresearch, we conducted a program of site blastingat known locations. The calibration experimentsindicated that the sensor results were close to theknown locations, indicating that the sourcelocation accuracy satisfied the necessaryengineering requirements (Table 2).
2. To monitor the redistribution of abutment stress,twenty borehole stress meters, located 18 m intothe coal seam, were set up at the tailgate (Fig. 1c).The interval between adjacent monitoring stationswas set at 5 m along the axial direction of thelongwall, and the first monitoring station wasplaced 50 m from the working face setup entry.To protect the stress meters, once the coal face

J. Wang et al.
380
-950
-970
-990
-1010
-930
-910
-890
-870
-850
-830
-810
-790
-950
-970
-990
-1010
-930
-910
-890
-870
-850
-830
-810
-790
GobGob
C oa lfac e of 5301
Adva nc ing of mining
3# coal sea m
Main roofMain roof
-950
-970
-990
-1010
-930
-910
-890
-870
-850
-830
-810
-790
-950
-970
-990
-1010
-930
-910
-890
-870
-850
-830
-810
-790
3# coal sea m
Adva nc ing of mining
C oa lfac e of 5301
GobGob
Main roofMain roof
-950
-970
-990
-1010
-930
-910
-890
-870
-850
-830
-810
-790
-950
-970
-990
-1010
-930
-910
-890
-870
-850
-830
-810
-790
3# coal sea m
C oa lfac e of 5301
Gob
Main roofMain roof
Adva nc ing of mining
(a) Nov. 28, 2015- Nov. 30, 2015 (b) Nov. 1, 2015- Nov. 3, 2015 (c) Nov. 4, 2015- Nov. 6, 2015
-950
-970
-990
-1010
-930
-910
-890
-870
-850
-830
-810
-790
-950
-970
-990
-1010
-930
-910
-890
-870
-850
-830
-810
-790
C oa lfac e of 5301
3# coal sea m
C oa lfac e of 5301
3# coal sea m
Adva nc ing of miningGob
Main roofMain roof
-950
-970
-990
-1010
-930
-910
-890
-870
-850
-830
-810
-790
-950
-970
-990
-1010
-930
-910
-890
-870
-850
-830
-810
-790
C oa lfac e of 5301
Adva nc ing of mining
3# coal sea m
Gob
Main roofMain roof
-950
-970
-990
-1010
-930
-910
-890
-870
-850
-830
-810
-790
-950
-970
-990
-1010
-930
-910
-890
-870
-850
-830
-810
-790
C oa lfac e of 5301
3# coal sea m
Gob
Main roofMain roof
Adva nc ing of mining
(d) Dec. 7, 2015- Dec. 10, 2015 (e) Dec. 11, 2015- Dec. 12, 2015 (f) Dec. 13, 2015- Dec. 15, 2015
-950
-970
-990
-1010
-930
-910
-890
-870
-850
-830
-810
-790
-950
-970
-990
-1010
-930
-910
-890
-870
-850
-830
-810
-790
Coa lfac e of 5301
Adva nc ing of mining
3# coal sea m
Gob
Main roofMain roof
-950
-970
-990
-1010
-930
-910
-890
-870
-850
-830
-810
-790
-950
-970
-990
-1010
-930
-910
-890
-870
-850
-830
-810
-790
C oa lfac e of 5301
Adva nc ing of mining
3# coal sea m
C oa lfac e of 5301
Adva nc ing of mining
3# coal sea m
Gob
-950
-970
-990
-1010
-930
-910
-890
-870
-850
-830
-810
-790
-950
-970
-990
-1010
-930
-910
-890
-870
-850
-830
-810
-790
C oa lfac e of 5301
Adva nc ing of mining
3# coal sea m
Gob
Main roofMain roof
(g) Dec. 16, 2015- December 17, 2015 (h) Dec. 18, 2015- Dec.19, 2015 (i) Dec. 20, 2015- Dec. 21, 2015
-950
-970
-990
-1010
-930
-910
-890
-870
-850
-830
-810
-790
-950
-970
-990
-1010
-930
-910
-890
-870
-850
-830
-810
-790
C oa lfac e of 5301
Adva nc ing of mining
3# coal sea m
Gob
Main roofMain roof
C oa lfac e of 5301
3# coal sea m
Adva nc ing of mining
-950
-970
-990
-1010
-930
-910
-890
-870
-850
-830
-810
-790
-950
-970
-990
-1010
-930
-910
-890
-870
-850
-830
-810
-790
Gob
Main roofMain roof
-950
-970
-990
-1010
-930
-910
-890
-870
-850
-830
-810
-790
-950
-970
-990
-1010
-930
-910
-890
-870
-850
-830
-810
-790
Gob
C oa lfac e of 5301
3# coal sea m
Adva nc ing of mining
Main roofMain roof
(j) Dec. 24, 2015- December 25, 2015 (k) Dec. 26, 2015- December 27, 2015 (l) Dec. 28, 2015- Dec. 30, 2015
-950
-970
-990
-1010
-930
-910
-890
-870
-850
-830
-810
-790
-950
-970
-990
-1010
-930
-910
-890
-870
-850
-830
-810
-790
C oa lfac e of 5301
Adva nc ing of min ing
3# coal sea m
Gob
Main roofMain roof
-950
-970
-990
-1010
-930
-910
-890
-870
-850
-830
-810
-790
-950
-970
-990
-1010
-930
-910
-890
-870
-850
-830
-810
-790
C oa lfac e of 5301
Adva nc ing of mining
3# coal sea m
Gob
Main roofMain roof
-950
-970
-990
-1010
-930
-910
-890
-870
-850
-830
-810
-790
-950
-970
-990
-1010
-930
-910
-890
-870
-850
-830
-810
-790
C oa lfac e of 5301
Adva nc ing of min ing
3# coal sea m
Gob
Main roofMain roof
(m) Dec. 31, 2015- Jan. 2, 2016 (n) Jan. 3, 2016- Jan. 4, 2016 (p) Jan. 5, 2016- Jan. 7, 2016
Fig. 2 Temporal-spatial distribution of MS events. (small circle: 0-3×10³ J; big circle: > 3×10³ J).
longwall 5301, indicating that little failure or large-scale caving activity did occurred at this time. From11 December to 12 December, 2015 (Fig. 2e), thedaily MS events and energy releases began to rise.Some MS events were located in roof. Interestingly,a considerable portion of the high-energy MS eventswere located inside the main roof. Especially on 11December, 2015 (by which time the working face hadadvanced 40.25 m), the maximum energy of a singleMS event located inside the main roof was greaterthan 1×10⁴ J, implying that the main roof was likelyfirst fractured in a broken step of 40.25 m. It also can
owing to the deformation and failure of the roof-coal-floor structure induced by mining activity on longwallFace 5301. It also can be seen that the MS activity insurrounding rock has obvious spatial and temporalcharacteristics and which develop with the advance ofmining along the longwall face. It can be deduced thatthese MS events were mainly impacted by theworking face mining. From 28 November to 20December 2015, the working face advanced 37.25 mfrom setup entry, in Figures 2a-d. As shown inFigures 2a-d, the MS events were relatively sparsearound the coal seam, floor, and immediate roof of

EFFECTS OF MAIN ROOF FRACTURING ON ENERGY EVOLUTION DURING THE … .
381
0 25 50 75 100 125 150 1750
10
20
30
40
50
32.1m29.2m31.2m 29.8m42.5m
Sup
port
pre
ssur
e/M
Pa
Advancing distance/m
0
10
20
30
40
50
MS
cou
nt/N
Fig. 3 Typical support pressure curve.
Table 3 High-energy MS events inside the main roof location, energy release.
Date L (m) L0 (m) MS event inside main roof
E (J) X (m) December 11, 2015 40.25 40.25 12641 16.3 December 18, 2015 70.85 29.60 4962 16.2 December 26, 2015 101.55 30.70 4301 15.6 January 1, 2016 132.40 30.85 4652 15.3 January 11, 2016 163.30 30.90 4896 16.2 Note: L represents the advancing distance of longwall face 5301; X represents horizontal spacing between the coalface of
5301 and the high-energy MS event location; E represents the high-energy MS event energy release; L0 represents the broken step of the main roof.
30.7 m) and 30.85 m (131.4 - 100.55 = 30.85 m),respectively.
In past investigations, it has been found that thesupport pressure is violently affected when the mainroof is fractured. The length of the fractured main roofis referred to as the weighting step. In order toestimate the weighting step, support pressures weremonitored with typical results as shown in Figure 3. Itcan be observed that the first weighting step wasaround 42 m and the periodic weighting steps wasabout 30 m. Note that the energy release sharplyincreases at weighting time, with energy releasesrelatively stable at other times. Therefore, by using thetemporal-spatial distribution of high-energy MSevents located inside main roof, the fracturingmorphology of the main roof of longwall Face 5301during mining activities can be identified.
The horizontal distances between the high-energy MS events inside the main roof and the coalface are listed in Table 3. It can be seen that as theworking face advanced to a distance of 175.3 m, thehorizontal distance from fracture event to coal facevaried from 15.3–16.3 m, or about 15 m on average. ABUTMENT STRESS EVOLUTION WITH THE FRACTURING OF THE MAIN ROOF
In conjunction with average behavioralobservations, monitoring results can be used todetermine the evolution of abutment stress induced by
be deduced that the main roof was fractured followingthe large-scale structural instability. From 13December to 17 December, 2015, the MS events andenergy releases decreased, with most MS eventsscattered in the surrounding rock beneath the mainroof (Figs. 2e-f). The maximum energy of individualMS events was smaller than 3×10³ J, which indicatesthat large scale failure, did not occur. However, inFigure 2h, covering the time between 18 December to19 December, 2015, high-energy MS events againbegan to increase, with three notable high-energyevents in the main roof on 18 December, 2015 (bywhich time the working face had advanced 69.85 m).Most low-energy MS events were located behind theworking face 5301, mainly in the roof and floor.Additionally, the maximum energy of a single MSevent exceeded 8×10³ J, indicating that the main roofhad fractured in a broken step of 29.6 m (69.85 -40.25 = 29.6m). As show in Figures 2i-p, as thelongwall face advanced, MS events and energyreleases fluctuated periodically. Interestingly, whenthe incidence of MS events and energy releases beganto increase, high-energy MS events were mainlyconcentrated in the main roof. For example, inFigures 2k and 2n, by which time the longwall facehad advanced 100.55 m, and 131.4 m, respectively,larger energy sources were mainly concentrated in themain roof, indicating that the corresponding brokensteps of the main roof were 30.7 m (100.55 - 69.85 =
J. Wang et al.
382
Stre
ss (
MP
a)St
ress
(M
Pa)
0 10 20 30 40 50 60 70 80 90 100 110 120
Distance between the coalface and borehole stress meter (m)
11
2
3
4
5
6
7
8
9
11
2
3
4
5
6
7
8
9
0 10 20 30 40 50 60 70 80 90 100 110 120
4
6
8
10
12
14
16
Stre
ss (
MPa
)
Distance between the coalface and borehole stress meter (m)
Main roof
3# coal seam
Immediate roof
Main roof
3# coal seam
Immediate roof
Main roof
3# coal seam
Immediate roof
Main roof
3# coal seam
Immediate roof
Coalface
End-fracturing line
Broken block
Hanging block
Coalface
Direction of mining
Direction of mining
Stre
ss (
MP
a)
0 10 20 30 40 50 60 70 80 90 100 110 120
Distance between the coalface and borehole stress meter (m)
11
2
3
4
5
6
7
8
9
0 10 20 30 40 50 60 70 80 90 100 110 120
4
6
8
10
12
14
16
Stre
ss (
MPa
)
Distance between the coalface and borehole stress meter (m)
Main roof
3# coal seam
Immediate roof
Main roof
3# coal seam
Immediate roof
Coalface
End-fracturing line
Broken block
Hanging block
Coalface
Direction of mining
Direction of mining
(a)
0 10 20 30 40 50 60 70 80 90 100 110 1202
3
4
5
6
7
8
9
10
Stre
ss (
MPa
)
Distance between the coalface and borehole stress meter (m)
0 10 20 30 40 50 60 70 80 90 100 110 1202
4
6
8
10
12
14
Str
ess
(MP
a)
Distance between the coalface and borehole stress meter (m)
End-fracturing line
Broken block Main roof
3# coal seam
Immediate roof
Main roof
3# coal seam
Immediate roof
Dircetion of mining
Coalface
Previously broken block
Previously broken block
Coalface
Direction of mining
Hanging block
(b)
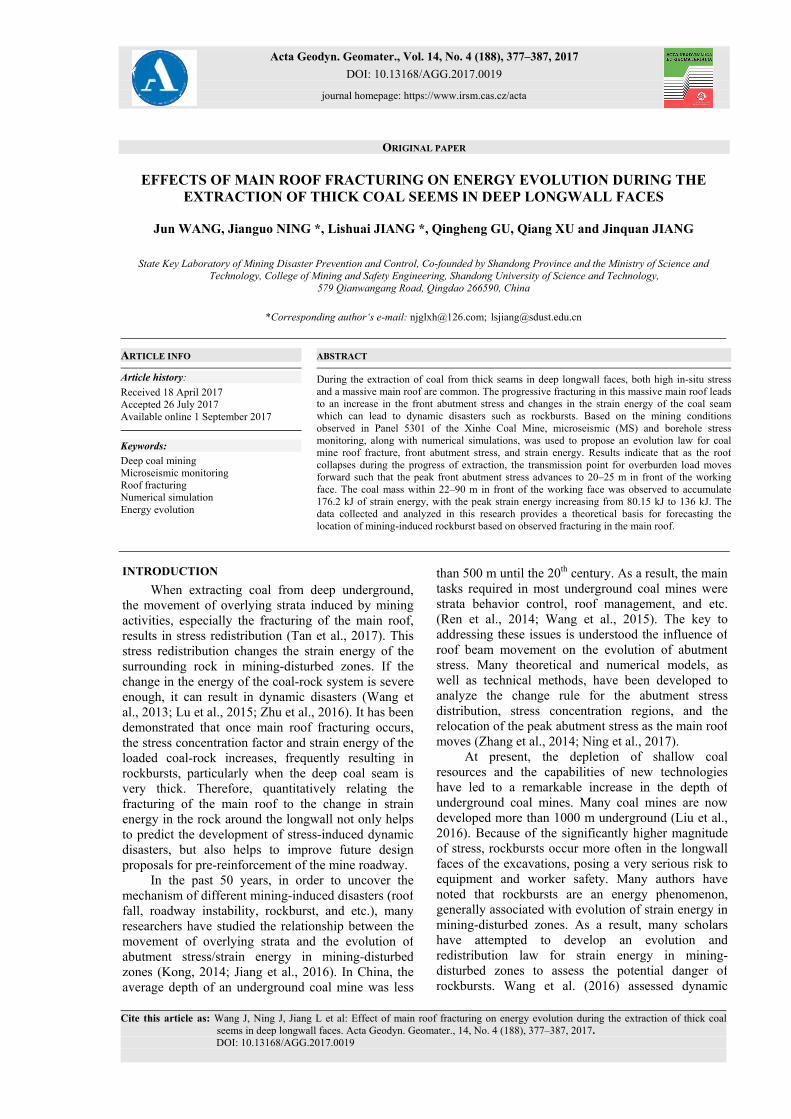
Fig. 4 Front abutment distribution obtained from in-situ monitor. (a) Front abutment distribution, 10 Decemberto 11 December, 2015; (b) Front abutment distribution, 17 December to 18 December, 2015.
Figure 4 shows the stress distribution in theabutment of longwall Face 5301 as the working faceapproached. It can be seen that on 10 December, 2015(Fig. 4a, when the working face had advanced37.25 m from the setup room), the largest stressincrease of 3.96 MPa was measured at a distance of15.8 m in front of the working face, indicating thelocation of the peak front abutment stress. With thefurther advance of the working face to 40.25 m (on 11December, 2015), the largest stress increase of9.8 MPa was measured at a distance of 26.6 m in front
the fracturing of the main roof. Figures 4a and 4bpresent the monitoring results obtained from 10December to 11 December, 2015, and from 17December to 18 December, 2015, respectively. Theblue line in these figures represents the change inabutment stress. In order to better understand how theevolution of abutment stress is affected by thefracturing of the main roof, we will also describe thestructural failure models of the main roof of longwallFace 5301, as deduced from the MS monitoringresults.

EFFECTS OF MAIN ROOF FRACTURING ON ENERGY EVOLUTION DURING THE … .
383
Table 4 Rock strata properties used in the numerical model.
Lithology Density (kg/m3) K (GPa) G (GPa) C (MPa) σt (MPa) ϕ (°) Medium sandstone 2500 9.30 6.8 1.9 0.98 31 Mudstone 1700 5.70 4.1 0.4 0.01 14 Fine sandstone 2650 11.60 8.5 3.2 1.2 33 3# coal seam 1900 2.15 1.29 2.2 1.6 38 Siltstone 2600 13.60 9.7 2.1 0.7 30 Mudstone & fine sandstone 2500 8.30 6.6 1.8 0.7 35
Note: K is bulk modulus, G is shear modulus, C is cohesion, ϕ is friction angle
Table 5 Cap pressures’ in the numerical gob model.
Strain (mm/mm) 0 0.025 0.05 0.075 0.1 0.125 0.15 0.175 0.2 0.225 0.25
Stress (MPa) 0 0.1 0.8 1.3 2.1 3.1 4.6 6.8 10.2 18.5 32.2
Table 6 Material parameters for gob model.
Parameter Density (kg/m3) K (GPa) G (GPa) ϕ (°) Dilation (°) Value 1000 7.69 6.21 21 6
mine. The length, width, and height of the model was300 m, 210 m, and 160 m, respectively. The modelwas consisted of 387,300 elements. Considering thatthe top of the modelled region was located about900 m below the ground surface, a compressive stressof 22.5 MPa was loaded to the top of the model toreplicate the overburden. Horizontal restraints wereapplied in the X- and Y-directions of the model, whiledownward vertical restraint was applied in the Z-direction. Initial stresses were applied accordancewith the in-situ stress test results, with the horizontal-to-vertical stress ratio set to 1.17 in both the X- and Y-directions. Considering the scale effect, the rock massproperties used in the numerical simulation were aslisted in Table 4.
The strain-softening model, based on the Flac3DMohr–Coulomb failure model with nonassociatedshear and associated tension flow rules, was chosen asthe failure criterion for the coal seam and itsoverburden strata (Maleki, 2017; Zhao et al., 2017). Inaccordance with practice observed in the literature, theresidual-to-peak cohesion ratio used in the strain-softening model was 1/10 (Jiang et al., 2016 and2017). Based on previous experience simulating coalseams and surrounding strata, a plastic shear strainthreshold of 0.3 % was established.
According to the results of the MS fieldmonitoring of overburden movement, the first brokenstep of the main roof occurred at 40.25 m, followed byperiodic broken steps of, on average, 30.5 m. Formodelling convenience, the first and periodic brokensteps were assumed at 40 m and 30 m, respectively,and the horizontal distance from the main roof beamend-fracture to the coal face was assumed to be 16 m.To simulate the caving of the immediate roof, thedouble-yield model was used with the calibrated inputparameters shown in Tables 5 and 6 (Esterhuizen etal., 2010; Mahdi et al., 2012; Lawson et al., 2017).
of the working face. From 10 December to 11December, 2015, the working face advanced 3 m butthe peak front abutment stress shifted 10.8 m. On 11December, 2015, once the main roof was fractured(based on the MS monitoring results, the horizontaldistance from main roof beam end-fracturing to coalface was 16.3 m), the broken main roof saggeddownward. As a result, the coal mass located beneaththe broken main roof could be confirmed to havefailed, resulting in the redistribution of stress, againadvancing the location of peak front abutment stress.
To investigate the reproducibility of themonitoring results, the data obtained between 17December and 18 December, 2015, shown inFigure 4b, was also analyzed. It can be seen from thisfigure that on 18 December, 2015, the main roof wasfractured at a distance of 16.2 m in front of theworking face, causing the location of peak frontabutment stress to advance from 14.5 m to 25.6 m infront of the working face. This data illustrates andconfirms that as the working face of the longwalladvances, the peak front abutment stress alsogradually advances in the direction of working faceprogress. However, when the main roof beamfractures, the stress in the surrounding rock isredistributed, further shifting the location of peakfront abutment stress.
ENERGY EVOLUTION IN FRONT OF WORKING FACE INDUCED BY MAIN ROOF FRACTURING
In this section, longwall Face 5301 isnumerically modelled to improve the understanding ofthe energy change law resulting from the fracturing ofthe main roof.
MODEL DESCRIPTION
The model was built according to the geologicalconditions of longwall Face 5301 in the Xinhe coal

J. Wang et al.
384
Pre
viou
s A
dvan
ced
Sti
(kJ)
10
15
25
35
45
55
65
75
10
15
25
35
45
55
65
75
Sti
(kJ)
10
15
25
35
45
55
65
75
Peak strain energy
14m
Headgate
Tailgate
Coalface of 5301Direction of mining Setup entry
Sti
(kJ)
10
15
25
35
45
55
65
75
Peak strain energy
14m
Headgate
Tailgate
Coalface of 5301Direction of mining Setup entry
85
Gob
32m
90m90m
Gob
16m10
15
25
35
45
55
65
75
Gob
16m10
15
25
35
45
55
65
75
90
66m 105
90m
Coalface of 5301Direction of mining Setup entry
Peak strain energy
Headgate
Tai lgate
Stra
in e
nerg
y (k
J)
Mai
n ro
of f
ract
urin
g
14m14m 10
20
30
40
50
60
70
80
9036m
90m90m
Peak strain energy
Headgate
Tailgate
Coalface of 5301Direction of mining Setup entry
Stra
in e
nerg
y (k
J)
Gob
16m
10
15
25
35
45
55
65
75
10
15
25
35
45
55
65
75
16m10
15
25
35
45
55
65
75
90
70m110
90m
Peak strain energy
Headgate
Tailgate
Coalface of 5301Direction of mining Setup entry
Gob
Peak strain energy
Headgate
Tailgate
Coalface of 5301Direction of mining Setup entry
Gob
Stra
in e
nerg
y (k
J)
Fur
ther
adv
ance
d
24m24m10
25
40
55
70
85
105
115
13040m
90m90m
Peak strain energy
Headgate
Tailgate
Coalface of 5301Direction of mining Setup entry
Peak strain energy
Headgate
Tailgate
Coalface of 5301Direction of mining Setup entry
Stra
in e
nerg
y (k
J)
Gob
26m26m
155
10
25
45
65
85
105
125
145
74m
90m
Peak strain energy
Headgate
Tai lgate
Coalface of 5301Direction of mining Setup entry
Stra
in e
nerg
y (k
J)
Gob
(a) Frist fracturing (b) Frist periodic fracturing
Fig. 5 Distribution of strain energy in coal seam.
weighting steps. Note that the plastic failure coalelement in front of the working face is referred to asthe energy release zone (ERZ), owing to the energyreleased in events occurring here.
Figure 5 shows that as the working faceadvances, the immediate roof caves directly into thegob. However, main roof remains hanging in a largearea though it is thoroughly fractured, resulting instrain energy accumulation and release, as well asstress redistribution. In other words, when thelongwall working face further advances, the peakstrain energy also gradually advances and the ERZ isextended.
Taking the first periodic weighting step as anexample, it should be noted that due to the main rooffracturing, the coal element in front of the workingface fails as a result of the strain energy accumulationand release. As shown in Figure 5, once the workingface had advanced 66 m from the setup entry, thestrain energy reached a peak value (about 110 kJ) ata distance of 18 m in front of the working face. Theregion of plastic failure induced by the panelextraction was also located approximately 18 m infront of the working face, making the ERZ in the
During the advancement of the longwall working face,a very soft elastic material was used to simulate thebroken main roof. The Young’s modulus of thismaterial was set at 190 MPa, and the Poisson’s ratiowas set to 0.3 (Jiang et al., 2012; Cheng et al., 2010).
ENERGY REDISTRIBUTION IN FRONT OF THE LONGWALL WORKING FACE
The strain energy stored in the rock mass at alarge buried depth is:
1=
2ij ij ijE σ ε (1)
when combined with the generalized form of Hooke'slaw, the strain energy of a coal mass after the longwallworking face is advanced is:
( )2 21 2 1 2 2 3 1 3
1= 2
2U
Eσ σ μ σ σ σ σ σ σ + − + + (2)
When implemented with FISH, the strain energydensity can be obtained using Eq. (2). Figure 5illustrates the energy redistribution in front of the coalworking face during the first and periodic roof
EFFECTS OF MAIN ROOF FRACTURING ON ENERGY EVOLUTION DURING THE … .
385
Curve Aσ
x0 L1
End fracturing line
o
AE
C
D
F
G
H
x1
I
JMain roof
Coalface
Gob
3# coal seam
Curve B
Broken block
Previously broken block
Move forward
Direction of mining
Curve Aσ
x0 L1
End fracturing line
o
AE
C
D
F
G
H
x1
I
JMain roof
Coalface
Gob
3# coal seam
Curve B
Broken block
Previously broken block
Move forward
Direction of mining
γh
Supporting point
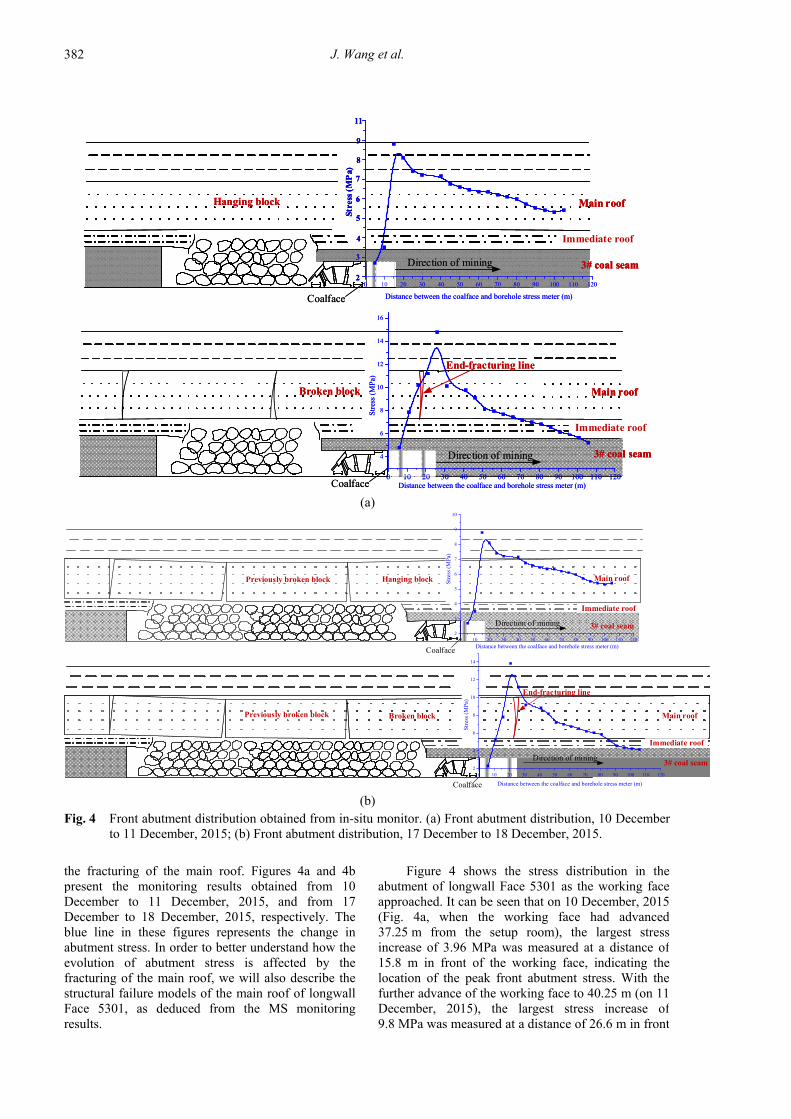
Fig. 6 Relationship between the front abutment stress and main roof fracturing.
transmitted into the coal seam through a supportingpoint (the contact point between the hanging blockand the upper layer). As a result, the front abutmentstress (Curve A in Figure 6) forms in the coal seamunder the influence of the overburden load, witha value of σA, and a horizontal distance of x0 in frontof the coal face. As the working face is furtheradvanced, the limit span of the hanging block isreached and fracturing occurs. Owing to the largebulking factor of the immediate roof, after a smallrotation, the broken block of the main roof remainsconnected to the previously broken block, developinga voussoir beam structure. The separation between thebroken block and upper layers is increased, causingthe supporting point to further advance with lowercoal mass failure accompanying energy release. Asa result, the stress originating from the overburdenload also moves forward, and front abutment stressredistribution occurs. In other words, the peak frontabutment stress moves forward from x0 to x1 on CurveB in Figure 6. As this occurs, the hanging area of theupper layer is gradually enlarged, and the stressconcentration factor at the clamped edges increases,potentially resulting in the increase in accumulatedenergy. Thus, main roof fracturing can be understoodto serve two functions in mining-induced energyevolution: the driving of coal mass energy release, andthe increase in accumulated energy.
Energy evolution results from the evolution ofthe front abutment stress. Therefore, we can calculatethe released and accumulated energy according to thedistribution of front abutment stress. For simplicity,assuming that front abutment stress is a lineardistribution, these energies can be expressed by Eqs.(3) and (4). Immediately prior to main roof fracturing,the strain energy W1 stored in the coal mass withina horizontal distance L1 in front of working face isdescribed by the trapezoidal area SOAHI. After mainroof fracturing, the coal mass within this ERZ isfailed, and residual strain energy W2 that stored inERZ was triangle area of SODHI. Therefore, thereleased energy W3 is the difference in the stored
longwall panel located within 0–18 m of the workingface, while in coal further than 18–90 m from theworking face, the strain energy in the coal seamdecreased slowly with distance to a steady value(about 36.2 kJ) owing to the low degree of disturbanceof the longwall face. However, as the working faceadvanced to 70 m, the main roof again reached itsspan limit and fracturing occurred, as alsodemonstrated by MS monitoring (the horizontaldistance from main roof beam end-fracturing toworking face was about 16 m). Meanwhile, the energystored inside the main roof was released in a shorttime interval, and some of this energy was convertedinto kinetic impact energy which propagated into thecoal seam in the form of elastic waves. As a result, thecoal mass around the broken main roof failed,accompanied by strain energy changes. Generally, thepeak strain energy released in roof fractures was up tothree times that of the unfractured main roof, and thewidth of the ERZ was enlarged to 26 m. Further than26–90 m away from the working face, strain energyfrom roof fractures was also larger than that of theunfractured main roof by about 145.6 kJ.
THE RELATIONSHIP BETWEEN ENERGY EVOLUTION AND MAIN ROOF FRACTURING
The immediate roof collapses directly into thecaved zone, so the immediate roof does not exist inthe gob. However, past field observations haveindicated that the main roof may continue to hang inthe form of a voussoir beam and only collapse into thecaved zone after the working face has been advancedfurther. Field MS monitoring indicated that in theXinhe coal mine, the main roof was periodicallyfractured at a step of about 30 m. Using to thesefindings, the relationship between the energyevolution of the rock and the fracturing of the mainroof can be further understood.
As shown in Figure 6, immediately prior to mainroof fracturing, the hanging block that is going tobreak begins to sag downward. The overburden load(including the main roof and upper layer loads) is

J. Wang et al.
386
1
1 1 2
2 1
, 0 x x ;, ;
;
axcd d x x x
e x xσ
≤ ≤= − + < <<
3. During the extraction of a thick coal seam ina deep longwall face, the movement of rock(including fracturing and rotation) generated twodifferent effects on the energy evolution: thedriving of coal mass energy release near the end-fracturing line, and the increase in accumulatedenergy in the coal mass away from the end-fracturing line.
ACKNOWLEDGMENTS
This study was supported by the NationalNatural Science Foundation of China (Nos. 51574154,51574155, 51474137, 51704182); Tai’shan ScholarEngineering Construction Fund of Shandong Provinceof China, Taishan Scholar Talent Team Support Planfor Advantaged & Unique Discipline Areas.
REFERENCES
Cheng, Y.M., Wang, J.A., Xie, G.X. et al.: 2010, Three-dimensional analysis of coal barrier pillars in tailgatearea adjacent to the fully mechanized top cavingmining face. International Journal of Rock Mechanicsand Mining Sciences, 47, 8, 1372–1383. DOI: 10.1016/j.ijrmms.2010.08.008
Esterhuizen, E., Mark, C. and Murphy, M.M.: 2010,Numerical model calibration for simulating coalpillars, gob and overburden response. Proceeding ofthe 29th International conference on Ground Controlin Mining, Morgantown, WV, 46–57.
Kong, L.H.: 2014, Relationship between microseismicevents and abutment pressure distribution in coalmining. Journal of Mining and Safety Engineering, 4,525–531. DOI: 10.13545/j.issn1673-3363.2014.04.005
Hu, S.C., Tan, Y.L., Ning, J.G. et al.: 2017, Multi-parametermonitoring and prevention of fault-slip rock burst.Shock and Vibration, 4, 1–8. DOI: 10.1155/2017/7580109
Jiang, Y.D., Wang, H.W., Xue, S. et al.: 2012, Assessmentand mitigation of coal bump risk during extraction ofan island longwall panel. International Journal of CoalGeology, 95, 1, 20–33. DOI: 10.1016/j.coal.2012.02.003
Jiang, F.X., Liu, Y., Zhang, Y.C. et al.: 2016, A three-zonestructure loading model of overlying strata and itsapplication on rockburst prevention. Chinese Journalof Rock Mechanics and Engineering, 35, 12, 2398–2408, (in Chinese). DOI: 10.13722/j.cnki.jrme.2016.0255
Jiang, L.S., Sainoki, A. and Mitri, H.S.: 2016, Influence offracture-induced weakening on coal mine gateroadstability. International Journal of Rock Mechanics andMining Sciences, 88, 307–317. DOI: 10.1016/j.ijrmms.2016.04.017
Jiang, L.S., Zhang, P.P., Chen, L.J. et al.: 2017, Numericalapproach for goaf-side entry layout and yield pillardesign in fractured ground conditions. RockMechanics and Rock Engineering, 1–23. DOI: 10.1007/s00603-017-1277-0
Lu, C.P., Liu Y., Wang H.Y. et al.: 2016, Microseismicsignals of double-layer hard and thick igneous strataseparation and fracturing. International Journal ofCoal Geology, 160–161, 28–41. DOI: 10.1016/j.coal.2016.04.011
strain energy and the residual strain energy, SOAHI-SODHI. Additionally, because the peak front abutmentstress moves forward from x0 to x1, the accumulatedstrain energy W4 beyond L1 from the coalface is givenby the triangular area SEHJ.
1
1 1 2
2 1
, 0 x x ;, ;
;
axcd d x x x
e x xσ
≤ ≤= − + < << (3)
1
2 1 2
2 1
, 0 x x ;, ;
;
mxkx l x x x
e x xσ
′≤ ≤ ′ ′= − + < <′ <
(4)
Where, a, c, d, e, m, k, and l are constants obtainedfrom an experiment
As discussed above, the released energy W3 andthe accumulated strain energy W4 can be obtained by:
1 1
3 1 20 0
L L
OAHI ODHIW S S dx dxσ σ= − = − (5)
1 14 2 1
J JL L
HIKJE HIKJ L LW S S dx dxσ σ= − = − (6)
According to on-site measurements, theparameters a, c, d, e, m, k, and l are 2.93, 0.24, 47.57,80, 1.84, 0.32, and 53.94, respectively. From the fieldinvestigation and numerical simulation, the
parameters L1, L2, σA, σB, σJ, x1, x2, 1x′ , and 2x′ , are
22.9 m, 80 m, 44 MPa, 46 MPa, 28.54 MPa, 15 m,80 m, 25 m and 80 m, respectively. With theintegration of Eqs. (5) and (6), the released energy W3
and the accumulated strain energy W4 are 188.05 kJ,125.58 kJ, respectively, demonstrating that thetheoretical results are similar to those determinedusing numerical modelling.
CONCLUSIONS
In order to understand the energy evolutioninduced by the fracturing of the main roof of longwallcoal mines, in-situ investigations and numericalmodelling of longwall Face 5301 of the Xinhe coalmine were conducted. The results of theseinvestigations presented in this paper can besummarized in follows: 1. With the advancement of longwall Face 5301, the
main roof periodically fractured, as indicated byperiodic MS event counts located inside the mainroof. MS monitoring results suggest that theperiodic broken step of the main roof was about30 m, and the end-fracturing line was typicallyabout 15 m in front of the working face.
2. According to in-situ monitoring of stress changeand numerical modelling, when the main rooffractures, the coal mass around the end-fracturingline fails as a result of the rotation of the brokenblock. Meanwhile, the previously stored strainenergy is released. With the increasing separationbetween the broken block and adjacent upperlayers, the supporting point for overburden loadtransmission is driven forward, which results inthe redistribution of front abutment stress.

EFFECTS OF MAIN ROOF FRACTURING ON ENERGY EVOLUTION DURING THE … .
387
Tan, Y.L., Liu, X.S., Ning, J.G. and Lu, Y.W.: 2017, In situinvestigations on failure evolution of overlying stratainduced by mining multiple coal seams. GeotechnicalTesting Journal, 40, 2, 244–257. DOI: 10.1520/GTJ20160090
Wang, H.W., Jiang, Y.D., Gao, R.J. et al.: 2013, Evolutionof energy field instability of island longwall panelduring coal bump. Rock and Soil Mechanics Journal,34(S1), 479–485, (in Chinese).
Wang, D.C., Wang Q. and Li, S.C.: 2015, Stress distributioncharacteristics of deep mine in fully-mechanizedsublevel caving face based on microseismic and onlinestress monitoring system. Journal of Mining andSafety Engineering, 32, 3, 382–388. DOI: 10.13545/j.cnki.jmse.2015.03.006
Wang, J., Ning, J.G., Jiang, J.Q. et al.: 2017, Research onthe energy criterion for rockbursts induced by brokenhard and thick rock strata and its application.Geotechnical and Geological Engineering, 35, 731–746. DOI: 10.1007/s10706-016-0137-0
Zhang, N., Zhang, N.C., Han, C.L. et al.: 2014, Boreholestress monitoring analysis on advanced abutmentpressure induced by longwall mining. Arabian Journalof Geosciences, 7, 2, 457–463. DOI: 10.1007/s12517-013-0831-7
Zhu, S.T., Feng, Y., Jiang, F.X. et al.: 2016, Determinationof abutment pressure in coal mines with extremelythick alluvium stratum: A typical kind of rockburstmines in China. Rock Mechanics and RockEngineering, 49, 5, 1943–1952. DOI: 10.1007/s00603-015-0868-x
Zhao, Y.X., Jiao, Z.H. and Liu, H.B.: 2017, Simulation ofground pressure distribution at large mining heightface based on GIS techniques. International Journal ofMining Science and Technology, Journal of ChinaUniversity of Mining and Technology, 46, 33–40.DOI: 10.13247/j.cnki.jcumt.000623
Liu, X.S., Ning, J.G., Tan, Y.L. et al.: 2016, Damageconstitutive model for rocks under cyclic loadingbased on energy dissipation. International Journal ofRock Mechanics and Mining Sciences, 85, 27–32.DOI: 10.1016/j.ijrmms.2016.03.003
Lawson, H.E., Tesarik, D., Larson, M.K. et al.; 2017,Effects of overburden characteristics on dynamicfailure in underground coal mining. InternationalJournal of Mining Science and Technology, 27, 121–129. DOI: 10.1016/j.ijmst.2016.10.001
Li, N., Wang, E.Y., Li, B.L. et al.: 2017, Research on theinfluence law and mechanisms of sensors networklayouts for the source location, Journal of ChinaUniversity of Mining and Technology, 46, 229–236,(in Chinese). DOI:10.13247/j.cnki.jcumt.000640
Mahdi, S. and Li, C.C.: 2012, Numerical modelling oflongwall mining and stability analysis of the gates in acoal mine. International Journal of Rock Mechanicsand Mining Sciences, 51, 24–34. DOI: 10.1016/j.ijrmms.2012.02.002
Maleki, H.: 2017, Coal pillar mechanics of violent failure inUS Mines. International Journal of Mining Scienceand Technology, 27, 387–392. DOI: 10.1016/j.ijmst.2017.03.001
Ning, J.G., Wang, J., Tan, Y.L. et al.: 2017, In situinvestigations into mining-induced overburdenfailures in close multiple-seam longwall mining: Acase study. Geomechanics and Engineering, 12, 4,657–673. DOI: 10.12989/gae.2017.12.4.657
Ren, Y.F. and Ning, Y.: 2014, Changing feature ofadvancing abutment pressure in shallow long wallworking face. Journal of China Coal Society, S1, 38–42, (in Chinese). DOI: 10.13225/j.cnki.jccs.2012.1280
Rezaei, M., Hossaini, M.F. and Majdi, A.: 2015,Determination of longwall mining-induced stressusing the strain energy method. Rock Mechanics andRock Engineering, 48, 6, 2421-2433. DOI: 10.1007/s00603-014-0704-8