The Effects of Roof Reflectance on Air Temperatures ...uc-ciee.org/downloads/CoolRoof_RTU_Expt...
31
LBNL- 62297 11 January 2007 1 The Effects of Roof Reflectance on Air Temperatures Surrounding a Rooftop Condensing Unit Craig Wray and Hashem Akbari Environmental Energy Technologies Division Lawrence Berkeley National Laboratory Berkeley, CA 94720 ABSTRACT Recent anecdotal information suggests that “cool” roofs might produce significant energy savings by reducing the temperature of air entering rooftop air-conditioner (RTU) condensers. Unfortunately, measurements to support this claim are not well documented. To overcome this problem, we carried out a set of six rigorous field experiments to determine the effects of roof reflectance on the heating of condenser inlet air by the roof, and to assess the effects of condenser fan operation on the potential recirculation of hot discharge air from the condenser. The experiments involved combinations of two roof conditions (a “hot” roof and then the same roof with a “cool” coating) and three RTU operation modes (condenser fan and compressor both operating, condenser fan operating without the compressor, and condenser fan and compressor both not operating). For each case, we continuously measured outdoor air temperature at 26 locations near and far from the RTU, as well as roof surface temperatures at two locations (one near and one far from the RTU), wind speed and direction, and solar radiation. With a “hot” roof and the compressor and condenser fan both operating, the air temperature at the condenser inlet was only 0.3ºC warmer on average during peak solar radiation times compared to a reference located far from the RTU. Applying a “cool” roof coating around the RTU eliminated this small temperature rise. The temperature rise was not significantly different when the condenser fan operated without the compressor, which suggests that hot air discharged by the condensing unit was not recirculated. Based on published relationships for cooling capacity and system power versus condenser inlet air temperature (normalized, respectively, by the capacity and power at the ARI outdoor temperature rating point of 35ºC), the 0.3ºC reduction in inlet air temperature associated with installing a cool roof corresponds to a decrease in RTU energy consumption of about 0.3 to 0.6% and an increase in EER of about 0.6 to 0.7%. Energy codes such as ASHRAE Standards 90.1 and 90.2 and California Title 24 already include energy saving credits related to cool roofs. Additional energy savings from reducing condenser inlet air temperature by installing a cool roof would only slightly increase these credits. INTRODUCTION The substantial energy saving benefits of using solar-reflective (“cool”) exterior coatings or cool roofing materials (e.g., white membranes) to reduce heat gains through roofs are already well understood (Akbari and Konopacki 1998; Konopacki et al. 1998; Konopacki and Akbari 2001; Akbari et al. 2005). As discussed below, several building industry reports have suggested that cool roofs might also produce significant additional energy savings by lowering the temperature of outdoor air that is used to cool unitary air-conditioning equipment located on roofs.
-
Upload
truongdien -
Category
Documents
-
view
216 -
download
0
Transcript of The Effects of Roof Reflectance on Air Temperatures ...uc-ciee.org/downloads/CoolRoof_RTU_Expt...

LBNL- 62297 11 January 2007
1
The Effects of Roof Reflectance on Air Temperatures Surrounding
a Rooftop Condensing Unit Craig Wray and Hashem Akbari
Environmental Energy Technologies Division Lawrence Berkeley National Laboratory
Berkeley, CA 94720
ABSTRACT Recent anecdotal information suggests that “cool” roofs might produce significant energy savings by reducing the temperature of air entering rooftop air-conditioner (RTU) condensers. Unfortunately, measurements to support this claim are not well documented. To overcome this problem, we carried out a set of six rigorous field experiments to determine the effects of roof reflectance on the heating of condenser inlet air by the roof, and to assess the effects of condenser fan operation on the potential recirculation of hot discharge air from the condenser. The experiments involved combinations of two roof conditions (a “hot” roof and then the same roof with a “cool” coating) and three RTU operation modes (condenser fan and compressor both operating, condenser fan operating without the compressor, and condenser fan and compressor both not operating). For each case, we continuously measured outdoor air temperature at 26 locations near and far from the RTU, as well as roof surface temperatures at two locations (one near and one far from the RTU), wind speed and direction, and solar radiation.
With a “hot” roof and the compressor and condenser fan both operating, the air temperature at the condenser inlet was only 0.3ºC warmer on average during peak solar radiation times compared to a reference located far from the RTU. Applying a “cool” roof coating around the RTU eliminated this small temperature rise. The temperature rise was not significantly different when the condenser fan operated without the compressor, which suggests that hot air discharged by the condensing unit was not recirculated.
Based on published relationships for cooling capacity and system power versus condenser inlet air temperature (normalized, respectively, by the capacity and power at the ARI outdoor temperature rating point of 35ºC), the 0.3ºC reduction in inlet air temperature associated with installing a cool roof corresponds to a decrease in RTU energy consumption of about 0.3 to 0.6% and an increase in EER of about 0.6 to 0.7%. Energy codes such as ASHRAE Standards 90.1 and 90.2 and California Title 24 already include energy saving credits related to cool roofs. Additional energy savings from reducing condenser inlet air temperature by installing a cool roof would only slightly increase these credits.
INTRODUCTION The substantial energy saving benefits of using solar-reflective (“cool”) exterior coatings or cool roofing materials (e.g., white membranes) to reduce heat gains through roofs are already well understood (Akbari and Konopacki 1998; Konopacki et al. 1998; Konopacki and Akbari 2001; Akbari et al. 2005). As discussed below, several building industry reports have suggested that cool roofs might also produce significant additional energy savings by lowering the temperature of outdoor air that is used to cool unitary air-conditioning equipment located on roofs.

LBNL- 62297 11 January 2007
2
A roof exposed to the sun acts as a solar energy collector and heats the air in the boundary layer adjacent to its exterior surface. For example, a “hot” opaque roof with a solar reflectance of 0.05 will absorb 95% of the incident solar flux. Measured data from Konopacki and Akbari (2001) indicate that such a roof can have a surface temperature as much as 60ºC warmer than the outdoor air beyond the boundary layer.1 Using surface-averaged heat transfer correlations described by Clear et al. (2003) for roof convection, we estimate that this large temperature difference, combined with wind, causes a large fraction (about 40%) of the absorbed solar energy to be dissipated to the air in the boundary layer. In contrast, a “cool” roof with a solar reflectance of 0.8 absorbs only 20% of the incident solar flux. In turn, the decreased absorption reduces the surface to outdoor air temperature difference to about 13ºC and the amount of heat dissipated to the boundary layer by a factor of about 6 (compared to the “hot” roof). Interactions between roof reflectance and air temperatures within the boundary layer, however, are not well understood. A primary reason is that current engineering calculations are not precise enough to predict the complex spatial and temporal distribution of air temperatures when there is mixed natural and forced turbulent convection in the boundary layer.
The boundary layer mixing problem is compounded by the operation of mechanical equipment on the roof. Most RTUs are air-cooled, vapor-compression, direct-expansion devices. RTUs reject heat that has been removed from conditioned space by using a fan to draw outdoor air across a refrigerant condenser coil. Typically, the outdoor air is drawn in from the sides of the unit with average velocities near 1 m/s. The heated air is discharged back to outdoors in a vertical jet through the top of the RTU with average velocities about five to ten times larger than at the inlet. Some RTUs also draw ventilation air from above the roof and discharge relief air toward the roof. Because RTUs are typically mounted on platforms above the roof surface (ARI 1997), it is unclear to what extent the cooling- and ventilation-related airflows disrupt natural and forced convective processes that would occur near the roof surface in the absence of the RTU. Also, for some wind conditions, it is possible that the condenser inlet air temperature could be affected by recirculation of hot discharge air from the condenser.
Recent reports involving field measurements have suggested that condenser inlet air can be heated by several degrees Celsius as it passes over a roof. For example, Faramarzi (2004) has reported outdoor air, condenser inlet air, and roof surface temperatures measured over the course of one day by Southern California Edison (SCE) staff on top of their facility in Irwindale, California. These data indicate that the condenser inlet air temperature was as much as 4.0ºC (7.5°F) greater than the outdoor air temperature near solar noon, which is when the temperature difference between the roof surface and outdoor air was greatest (9.2ºC). The condenser inlet air temperature (36.9ºC) was about midway between the outdoor air temperature (32.8ºC) and the temperature measured at the roof surface (41.9ºC). The measurement apparatus, measurement locations, roof conditions, and weather conditions were not stated.
1 The 60ºC temperature difference corresponds to a total horizontal solar flux of about 1,000 W/m2; outdoor dry-bulb and dew-point temperatures of about 35ºC and 28ºC, respectively; a wind speed of about 2 m/s; and a roof assembly with a conductance of 0.353 W/(m2 K). This difference can also be estimated using a heat balance for the exterior surface of the roof (Akbari and Konopacki 1998), correlations for sky temperature as a function of outdoor air dry-bulb and dew-point temperatures (Berdahl and Fromberg 1982), and surface-averaged convection heat transfer correlations of Clear et al. (2003). For the same conditions, assuming turbulent flow across the entire roof and a 25% uncertainty in the convection heat transfer, the estimated temperature difference is 59±5ºC.

LBNL- 62297 11 January 2007
3
Cua (2005) measured several temperatures before and after applying a cool coating to black EPDM roofs on a hotel and on a restaurant in La Grange, Georgia. The measurements included air temperature near the ground, air temperature above the roof, roof surface temperature, and “rooftop a/c” temperature (location “near the A/C units”). Insufficient information is provided to correlate the before and after coating temperature data, but Cua states that the “non-reflective roof raises the ambient air temperature on the roof about 10ºF” (5.6ºC) and that “air around the coated and uncoated A/C units had a temperature differential of almost 5ºF” (2.8 ºC). Reportedly, shaded thermocouples were used for the air temperature measurements. Weather conditions at the time of the measurements were not described.
Leonard and Leonard (2006) measured air temperatures near two RTUs on top of a manufacturing and office facility in Rockford, Minnesota. The roof is used as a “working laboratory” to study roofing material performance and is covered by four different materials. Two of the materials are a black EPDM membrane and a white PVC membrane. Their data suggest that a reflective roof can reduce outdoor air temperatures at a height of 0.76 m (30 in) by as much as 7.8ºC (14ºF). It appears from their published photographs that the thermocouples used to measure air temperatures at the RTUs were shielded at least from direct solar radiation using white tubes, but with limited air movement inside the tubes. Weather conditions at the time of the measurements were not described.
Because the measurement instrumentation, procedures, and conditions are not well described in any of these three reports, it is unclear whether the actual condenser inlet air temperature rises are as large as is suggested. For example, Cua and Leonard and Leonard appear to have addressed temperature sensor shielding from direct solar radiation2, but it is unknown if any of the field studies addressed errors caused by radiation heat transfer between temperature sensors and hot surroundings (e.g. a hot roof or hot shield). Using heat transfer relations described by Erell et al. (2003) and ASHRAE (2005), it appears that these errors can be as much as 10ºC on a sunny day, particularly when air movement over the temperature sensor and shield is small.
Sonne et al. (1993) have demonstrated the importance of maintaining adequate airflow between a radiation shield and the temperature sensor that it shields. In particular, they compared air temperatures measured inside a naturally-ventilated radiation shield (Parker et al. 1996) and inside a mechanically-aspirated shield. For a wind speed of 0.7 m/s, the temperature measured inside the naturally-ventilated shield was about 1ºC warmer. The solar radiation corresponding to the maximum observed error was not stated, but is likely no greater than about 700 W/m2, because the maximum error occurred at 9:00 am. Consequently, if low wind speeds were to occur near solar noon when solar radiation is at its peak, one expects that even larger errors would occur. Anderson and Baumgartner (1997) have observed these greater errors: 3.4ºC during “low wind and high solar insolation” periods. Sonne et al. indicate that increased air movement can substantially reduce the errors: with wind speeds of 3 to 4.5 m/s, errors were about 0.1ºC or less, even around solar noon. It is important to note that Sonne et al. tested several commercially-available mechanically-aspirated shields and found significant differences (as much as 0.4ºC) between air temperatures measured using these devices.
If the reported condenser inlet air temperature rises do indeed occur, they could significantly affect RTU performance. Increasing the condenser inlet air temperature increases refrigerant
2 Smith and Braun (2003) have demonstrated that shielding temperature sensors from direct solar radiation can reduce measurement errors by 5.6 to 8.3ºC (10 to 15ºF) when the solar radiation is not “very intense”.

LBNL- 62297 11 January 2007
4
temperature and pressure inside the condenser (and therefore increases compressor discharge pressure), which in turn reduces the cooling capacity of the RTU, increases compressor run-time, increases compressor power consumption, and reduces system efficiency. For example, based on laboratory tests of six nominal 5-ton RTUs3 by Faramarzi (2004), per degree Celsius rise in condenser inlet air temperature, cooling capacity decreases about 0.6 to 0.9%, system power consumption4 increases about 1.0 to 1.9%, and the energy efficiency ratio (EER, which is the ratio between capacity and power consumption) decreases about 1.7 to 2.0%, all relative to measured values at outdoor rating conditions (35ºC). Therefore, a 5.6ºC (10ºF) potential rise in condenser inlet air temperature, as Cua suggested for a hot roof, would reduce cooling capacity about 3 to 5%, increase system power consumption about 5 to 11%, and decrease EER about 10 to 12%. The reduced capacity means that the RTU would need to run 3 to 5% longer to meet a given cooling load. With the run time and power consumption increases combined, the RTU energy consumption would increase about 5 to 11%.
It remains unclear whether roof reflectance has a significant effect on condenser inlet air temperature. As a step toward clarifying this issue, we carried out a set of rigorous field experiments using research grade instruments to measure the outdoor air temperature at many locations surrounding an RTU. This paper summarizes the results of our experiment.
EXPERIMENT DESIGN Our “proof-of-concept” experiment is designed (1) to demonstrate the effects of roof reflectance on the heating of condenser inlet air by the roof, and (2) to isolate the effects of RTU condenser fan operation on the potential recirculation of hot discharge air from the condenser. To quantify each of these effects, we carried out the experiment using six specific combinations of roof reflectance and RTU operation, each of which was implemented primarily during weekends to minimize disruptions to building occupants:
1. Hot roof with the condenser fan and compressor both operating.
2. Hot roof with the condenser fan operating without the compressor.
3. Hot roof with the condenser fan and compressor both not operating.
4. Cool roof with the condenser fan and compressor both operating.
5. Cool roof with the condenser fan operating without the compressor.
6. Cool roof with the condenser fan and compressor both not operating.
For each of these six cases, we continuously measured outdoor air temperature, roof surface temperature (at two locations: one near and one far from the RTU), relative humidity, wind speed, wind direction, and solar radiation. In particular, outdoor air temperatures were measured at 26 locations around the RTU in four groups:
1. 12 points at three elevations (10, 50, 100 cm above the roof) at a distance of about 1 m from each of the four sides (N,S,E,W) of the RTU (hereinafter referred to as “Tfar”),
3 In terms of units sold, an RTU with a 5 ton cooling capacity is the most popular size in California (Jacobs 2003). 4 System power consumption includes the power used by the evaporator and condenser fans, the compressor, and controls.

LBNL- 62297 11 January 2007
5
2. 12 points at three elevations (30, 59, 87 cm above the roof) at each of the four sides of the condenser inlet5 (hereinafter referred to as “Tnear”),
3. One point at the top of the RTU in the middle of the discharge airflow (hereinafter referred to as “Texit”), and
4. One point at a weather tower (1.5 m above the roof) located near the center of the roof, which is about 8 m from the RTU (hereinafter referred to as “Tout”).
Compared to daytime air temperatures with a cool roof, daytime temperatures Tfar and Tnear are expected to be greater with a hot roof in all RTU operating modes. Regardless of roof reflectance, it is expected that:
• Tout and Tfar will be unaffected by RTU operation,
• During the day, Tfar will be greatest at its lowest elevation (10 cm) and, depending on the wind speed and wind direction, will approach Tout at its highest elevation (100 cm),
• Tnear will be greater than Tout when the condenser fan is operating, and
• If hot discharge air at Texit is recirculated into the inlet when the compressor is operating, then we expect that Tnear (especially at the highest elevation) when the compressor and condenser fan are operating will be greater than when only the fan is operating.
Test Building and RTU Description We identified a test building using the following criteria: (a) willingness of the building operator or building owner to participate in the project, (b) RTU cooling capacity in the range of 3 to 7 tons, and (c) the building owner will allow us to install a cool roof. The selected two-story building is located at the University of California, Davis. It contains laboratories and administrative offices that are cooled using several split-system unitary air-conditioners with rooftop condensing units. The test site is characterized by hot, sunny weather during late spring, summer, and early fall. Figure 1 shows a scale view of the roof. Figure 2 shows several photographs of the rooftop and test RTU location.
The exterior surface of the approximately 1,400 m2 roof is an aluminum-coated single-ply membrane. Using a field procedure defined in ASTM Standard E1918 (1997), we determined that the average solar reflectance of the roof “as found” was 0.37. Figure 3 shows the three locations where we measured reflectance to determine the average reflectance. We did not measure the roof thermal emissivity; however, using the experimental linear relation between solar reflectance and thermal emissivity for aluminum coatings described by Berdahl and Bretz (1997), we estimate that it had an emissivity of about 0.53 to 0.63.
After monitoring the air temperatures around the RTU with this “hot” roof, we applied a white coating to an approximately 100 m2 region of the roof near the test RTU, which increased the solar reflectance of the roof to about 0.8 and thermal emissivity to about 0.85. Figures 1 and 4 show the region of the roof that was painted. We did not paint the entire roof, because our flow visualization tests (described in the Discussion section) with the hot roof indicated that the air entering the RTU was coming from a region closer than 1 m away from the RTU.
5 These three elevations were selected to correspond approximately to the 10%, 50%, and 90% heights of the condenser coil relative to its bottom.

LBNL- 62297 11 January 2007
6
Figure 1. Scale view of the roof showing mechanical equipment locations around the test RTU, the region that was coated white to create a cool surface, and the locations of various sensors.
Test RTURTU
RTU
RTURTU
Circle indicates exhaust
Region with white coating
20.0
m
72.4 m
Weather tower
PyranometerWall locationunder roof
38.6 m
3.5
mTriangle indicatessurface temperaturemeasurement location
NORTH
10.0 m
Hatch
A concrete slab is located beneath the roof membrane and above a 1.4 m high ceiling plenum space. The plenum space contains leaky supply ducts from the RTU that is located west of the test RTU. No insulation was visible on the underside of the concrete slab or on the ceiling below. It is unknown whether insulation is located between the slab and the roof membrane.
The RTU that we tested serves laboratory and office spaces located on the ground floor. This RTU is located about midway along the east-west axis of the roof and about 3.5 m from its south edge. The nominal total cooling capacity of the RTU is 44 kW (4 tons) at a rated outdoor temperature of 35ºC (95ºF). Its rated energy efficiency ratio6 (EER) is in the range of 10 to 11.
An axial three-blade fan near the RTU top draws outdoor air through the four sides of the RTU across a 1.5 m2 single-row, finned condenser coil, and blows the air upward through a 0.19 m2 annular opening. The fan is direct-driven by a nominal 0.25 kW (1/3 hp) permanent-split-capacitor motor, which is located just upstream of the fan. We did not measure the RTU airflow, but the manufacturer lists the rated airflow as 3,100 cfm (1.5 m3/s). Corresponding average velocities at the inlet and outlet of the RTU are 0.9 m/s and 7.9 m/s, respectively.
The RTU is approximately square (0.75 m by 0.83 m) and is supported by an 18 cm high split curb. The bottom and top of the condenser coil, respectively, are located about 23 cm and 94 cm above the roof; the top of the RTU is located about 1 m above the roof. Several large drainage holes are located in the bottom of the RTU. These holes also act as unintentional leaks that allow outdoor air to be drawn into the RTU without passing across the condenser coil. Figure 5 shows the RTU curb and drainage holes.
A thermostat in the conditioned space cycles the fan and scroll compressor inside the RTU on and off as needed to provide space cooling. To maintain adequate head pressure for the compressor when space cooling is required during cool weather, a “low ambient” control disables the fan when the air temperature inside the RTU is less than about 15ºC. To obtain specific operating modes for our experiment, we temporarily modified the RTU wiring so that we could operate the condenser fan without operating the compressor. 6 The rated EER (and cooling capacity) depends in part on evaporator coil characteristics. We do not know the characteristics of the installed coil, so we do not precisely know the rated cooling capacity or EER.

LBNL- 62297 11 January 2007
7
Figure 2. Locations of the test RTU (arrow) and surrounding mechanical equipment.
a) View from south wing of the building.
b) View from east edge of the roof.
c) View from west edge of the roof.

LBNL- 62297 11 January 2007
8
Figure 3. Views of the three roof reflectance measurement locations (before the white roof coating was applied): west of the test RTU, adjacent to the weather tower near the center of the roof, and near the north surface temperature sensor (marked by an arrow).

LBNL- 62297 11 January 2007
9
Figure 4. Views of the white coating that was applied to the roof surrounding the RTU. Surface temperature sensor locations are indicated by arrows in the southeast view.
a) View from west.
b) View from northwest.
c) View from southeast.

LBNL- 62297 11 January 2007
10
Figure 5. A view of the RTU curb from the north (about one year after the experiment) and a view from the top of the RTU drain holes. Examples of the holes are marked by arrows.

LBNL- 62297 11 January 2007
11
Instrumentation Specifications Various research-grade sensors were used to measure air temperature, roof surface temperature, relative humidity, wind speed and direction, and solar radiation. Table 1 summarizes the measurement points, sensor types, and measurement locations. More detailed descriptions of the sensors follow after Table 1.
Table 1: Measurement point summary
Measurement Point Sensor Type Location Air temperatures surrounding RTU condenser inlet
Shielded and aspirated Omega Engineering THX-400-AP-12 air probe with thermistor
12 adjacent to RTU and 12 about 1 m away from RTU (3 different elevations for each of the 2 radial locations and 4 cardinal directions)
RTU discharge air temperature
Shielded and aspirated Omega Engineering THX-400-AP-12 air probe with thermistor
1 at top of RTU in middle of discharge annulus
Roof surface temperature
Omega Engineering ON-409-PP surface probe with thermistor
1 near RTU and 1 far from RTU
Outdoor air temperature
Shielded and aspirated Omega Engineering THX-400-AP-12 air probe with thermistor
2 inside weather tower near center of roof (one near tower inlet at 1.5 m above roof and one adjacent to downstream relative humidity sensor)
Outdoor relative humidity
Shielded and aspirated Vaisala HMD70U transmitter with HUMICAP thin-film polymer capacitive sensor
1 inside weather tower near center of roof
Wind speed and direction
Gill Instruments WindSonic two-axis ultrasonic wind speed and direction sensor
1 near center of roof at top of weather tower
RTU operation Current transducers 2 transducers, one for each motor Total horizontal solar radiation
Eppley PSP pyranometer 1 just east of RTU
Air Temperatures Air temperatures were measured using Omega Engineering THX-400-AP-12 air probes. Each probe contains a small epoxy-encapsulated thermistor element at its tip inside an integral perforated radiation shield. Omega claims the response time is at most 10 seconds in still air.
To reduce radiation-induced temperature measurement errors, we constructed mechanically-aspirated “towers” to shield the air probes from solar radiation and hot surrounding surfaces. Figures 6 and 7 show the towers surrounding the test RTU.
Each 30 cm long, 5 mm diameter probe was located inside a rigid horizontal pipe, with the probe tip located about 15 cm downstream of the pipe inlet. A downward facing nominal 1-1/2 inch diameter “1/4-bend street” pipe fitting with a screen was attached to the upstream end of the pipe to prevent rain and insect entry.

LBNL- 62297 11 January 2007
12
Figure 6. Views of the aspirated air temperature towers surrounding the test RTU. The plastic box attached near the bottom of each tower contains the aspirator fan and discharges downward. Sandbags were used on the tower bases to prevent wind from moving the towers.

LBNL- 62297 11 January 2007
13
Figure 7. Details of the aspirated air temperature towers near, at, and above the RTU. An arrow indicates the location of a surface temperature sensor location just south of the “near” tower.
LBNL- 62297 11 January 2007
14
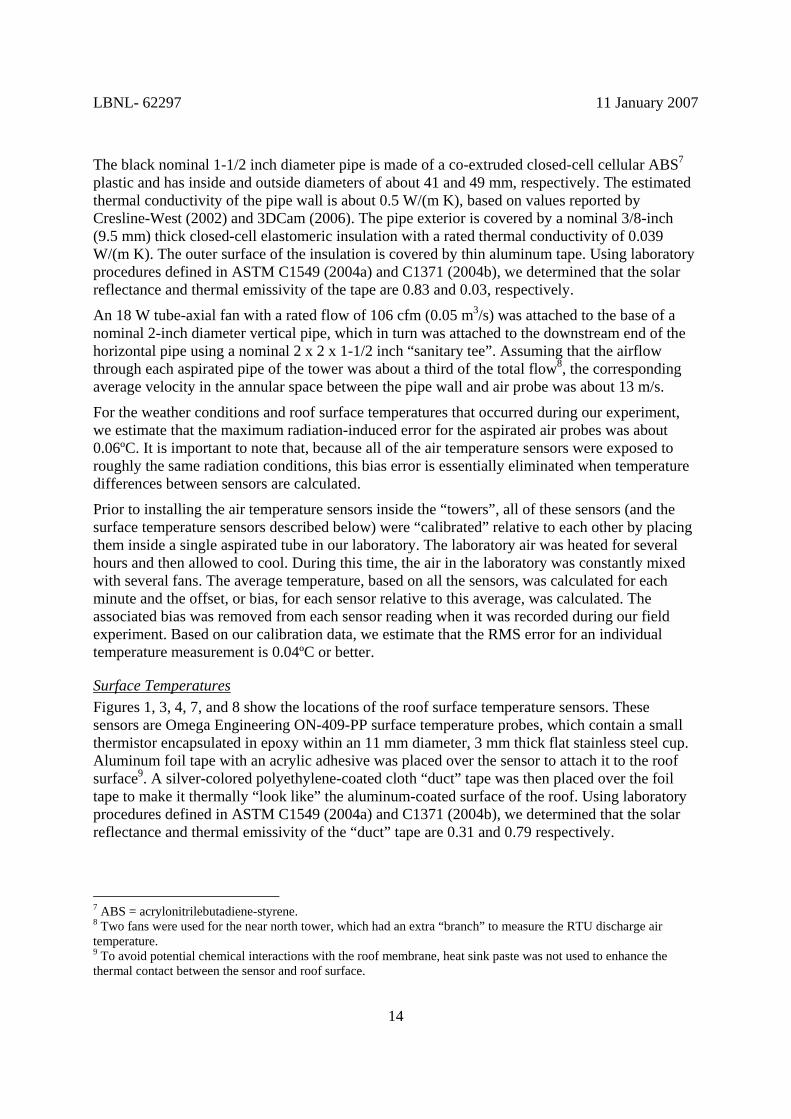
The black nominal 1-1/2 inch diameter pipe is made of a co-extruded closed-cell cellular ABS7 plastic and has inside and outside diameters of about 41 and 49 mm, respectively. The estimated thermal conductivity of the pipe wall is about 0.5 W/(m K), based on values reported by Cresline-West (2002) and 3DCam (2006). The pipe exterior is covered by a nominal 3/8-inch (9.5 mm) thick closed-cell elastomeric insulation with a rated thermal conductivity of 0.039 W/(m K). The outer surface of the insulation is covered by thin aluminum tape. Using laboratory procedures defined in ASTM C1549 (2004a) and C1371 (2004b), we determined that the solar reflectance and thermal emissivity of the tape are 0.83 and 0.03, respectively.
An 18 W tube-axial fan with a rated flow of 106 cfm (0.05 m3/s) was attached to the base of a nominal 2-inch diameter vertical pipe, which in turn was attached to the downstream end of the horizontal pipe using a nominal 2 x 2 x 1-1/2 inch “sanitary tee”. Assuming that the airflow through each aspirated pipe of the tower was about a third of the total flow8, the corresponding average velocity in the annular space between the pipe wall and air probe was about 13 m/s.
For the weather conditions and roof surface temperatures that occurred during our experiment, we estimate that the maximum radiation-induced error for the aspirated air probes was about 0.06ºC. It is important to note that, because all of the air temperature sensors were exposed to roughly the same radiation conditions, this bias error is essentially eliminated when temperature differences between sensors are calculated.
Prior to installing the air temperature sensors inside the “towers”, all of these sensors (and the surface temperature sensors described below) were “calibrated” relative to each other by placing them inside a single aspirated tube in our laboratory. The laboratory air was heated for several hours and then allowed to cool. During this time, the air in the laboratory was constantly mixed with several fans. The average temperature, based on all the sensors, was calculated for each minute and the offset, or bias, for each sensor relative to this average, was calculated. The associated bias was removed from each sensor reading when it was recorded during our field experiment. Based on our calibration data, we estimate that the RMS error for an individual temperature measurement is 0.04ºC or better.
Surface Temperatures Figures 1, 3, 4, 7, and 8 show the locations of the roof surface temperature sensors. These sensors are Omega Engineering ON-409-PP surface temperature probes, which contain a small thermistor encapsulated in epoxy within an 11 mm diameter, 3 mm thick flat stainless steel cup. Aluminum foil tape with an acrylic adhesive was placed over the sensor to attach it to the roof surface9. A silver-colored polyethylene-coated cloth “duct” tape was then placed over the foil tape to make it thermally “look like” the aluminum-coated surface of the roof. Using laboratory procedures defined in ASTM C1549 (2004a) and C1371 (2004b), we determined that the solar reflectance and thermal emissivity of the “duct” tape are 0.31 and 0.79 respectively.
7 ABS = acrylonitrilebutadiene-styrene. 8 Two fans were used for the near north tower, which had an extra “branch” to measure the RTU discharge air temperature. 9 To avoid potential chemical interactions with the roof membrane, heat sink paste was not used to enhance the thermal contact between the sensor and roof surface.
LBNL- 62297 11 January 2007
15
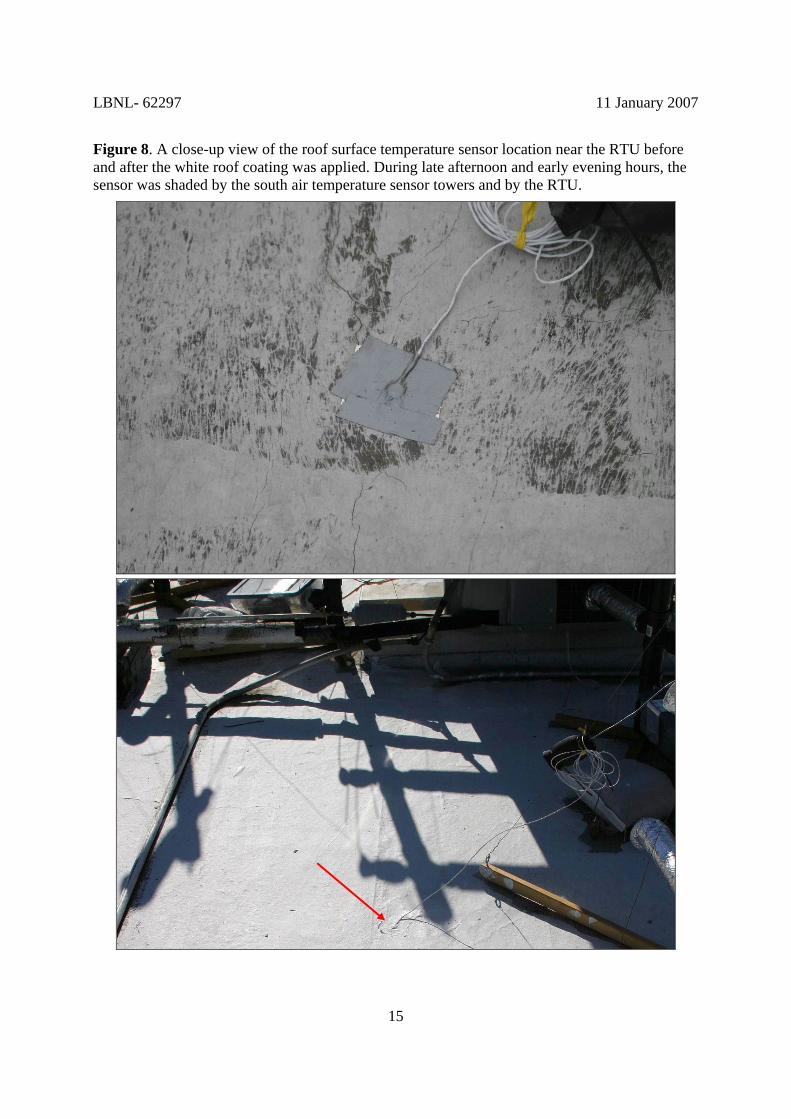
Figure 8. A close-up view of the roof surface temperature sensor location near the RTU before and after the white roof coating was applied. During late afternoon and early evening hours, the sensor was shaded by the south air temperature sensor towers and by the RTU.
LBNL- 62297 11 January 2007
16
The measured solar reflectance of the “duct” tape is slightly lower than the average solar reflectance that we determined for the “as found” roof surface (0.37), and the emissivity is greater than our estimated value for the roof (0.53 to 0.63). For the weather conditions that occurred during our experiment, we estimate that the combined effect of the low reflectance and high emissivity of the “duct” tape will result in surface temperature measurements within about 2 to 3ºC of the temperature that would occur if the sensor and tape were not present on the hot roof. For the cool roof part of the experiment, the roof near the test RTU and the “duct” tape covering the surface temperature sensors were both coated white, so no significant error is expected in this case.
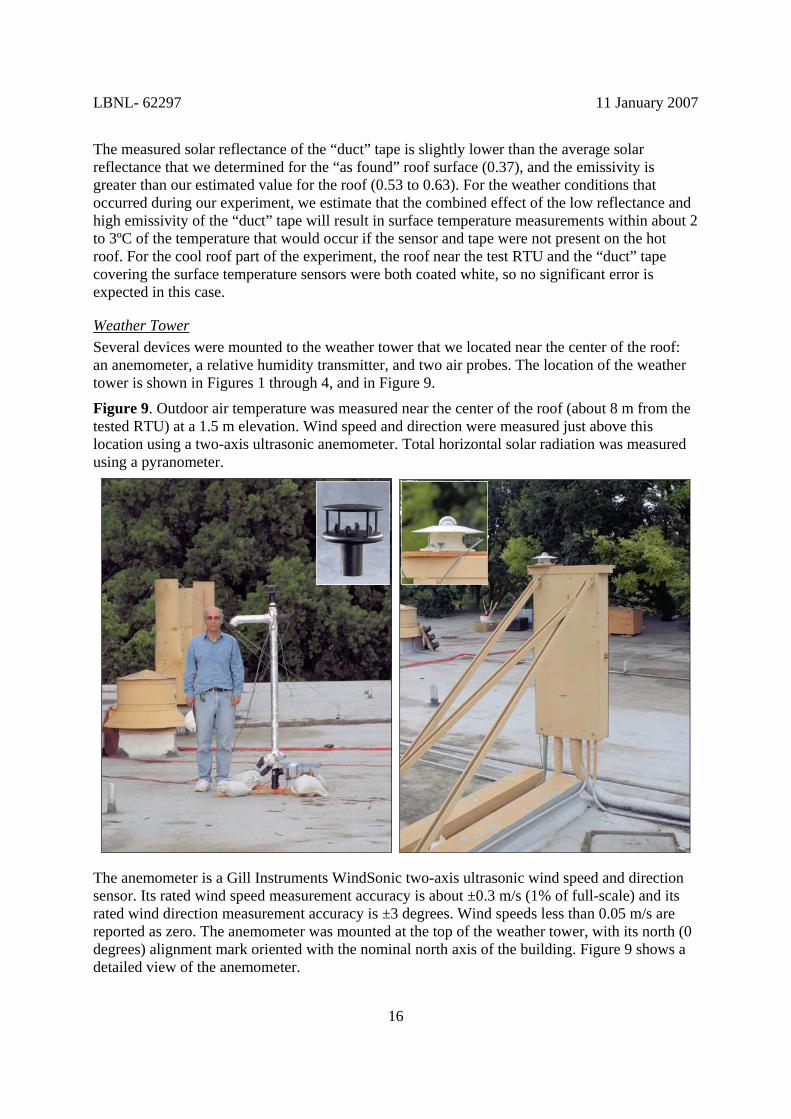
Weather Tower Several devices were mounted to the weather tower that we located near the center of the roof: an anemometer, a relative humidity transmitter, and two air probes. The location of the weather tower is shown in Figures 1 through 4, and in Figure 9.
Figure 9. Outdoor air temperature was measured near the center of the roof (about 8 m from the tested RTU) at a 1.5 m elevation. Wind speed and direction were measured just above this location using a two-axis ultrasonic anemometer. Total horizontal solar radiation was measured using a pyranometer.
The anemometer is a Gill Instruments WindSonic two-axis ultrasonic wind speed and direction sensor. Its rated wind speed measurement accuracy is about ±0.3 m/s (1% of full-scale) and its rated wind direction measurement accuracy is ±3 degrees. Wind speeds less than 0.05 m/s are reported as zero. The anemometer was mounted at the top of the weather tower, with its north (0 degrees) alignment mark oriented with the nominal north axis of the building. Figure 9 shows a detailed view of the anemometer.
LBNL- 62297 11 January 2007
17
The relative humidity (RH) transmitter is a Vaisala HMD70U that includes a HUMICAP thin-film polymer capacitive sensor. Vaisala claims an accuracy of ±2% RH from 0 to 90% RH and then increasing to ±3% RH at 95% RH. The rated temperature-dependent uncertainty in the RH measurement is zero up to 40ºC and then increases to ±0.5% RH at about 55ºC.
Note that we measured the air temperature adjacent to the RH sensor near the bottom of the weather tower so that the humidity ratio of the air could be determined, if needed for subsequent analyses. This “RH” air temperature measurement was in addition to the outdoor air temperature measurement at 1.5 m above the roof, near the top of the tower. Both of the air temperature probes and the RH sensor were located inside the tower, which provided an aspirated, shielded environment for the sensors.
Total Horizontal Solar Radiation Total horizontal solar radiation was measured using an Eppley PSP pyranometer, which was installed on top of an electrical panel that is located just east of the test RTU, as shown in Figures 1 and 9.
RTU Operation The “on” and “off” status of the condensing unit fan and compressor motors was monitored using current transformers attached to wires leading to each of these two motors.10
Data Collection An ADAC 5000, 12-bit data acquisition board installed in a portable computer (PC) was used to collect the data. An “interface” attached by a cable to the data acquisition board provided easy plug-in connections for extension cords from the sensors. The “interface” also controlled relays to provide more channels than the ADAC 5000 had available. Both the PC and the “interface” were mounted in a ventilated plywood box for weather protection. The box was located far away from the test RTU, near the north side of the roof and approximately midway along the roof.
Each sensor was read approximately every 3 to 4 seconds and averaged values were recorded every 60 seconds. Data were downloaded manually about once a week. Out-of-range data were investigated to determine whether a sensor or monitoring error existed, and appropriate corrective actions were taken if needed.
The instrumentation and data logger were installed on June 15, 2005 and the monitoring system was commissioned during the period up to July 15, 2005. For each of the six test conditions described in the Experiment Design section, we collected data for at least two hot, sunny days. We also continuously collected data during “normal” system operation periods. “Normal” here means that the RTU compressor cycled on and off as needed to satisfy cooling loads in the conditioned spaces on the ground floor. Except when we manually disabled the condenser fan or when the RTU’s “low ambient” control caused the fan to stop operating in response to low air temperatures, this fan operated continuously throughout the experiment.
10 We did not measure RTU power consumption, because we did not try to control or monitor cooling loads in the conditioned spaces served by the RTU. Without knowing the cooling loads imposed upon the RTU, it would be impossible to correlate changes in power consumption with changes in roof conditions. Such an experiment is much more complex than the one that we carried out.
LBNL- 62297 11 January 2007
18
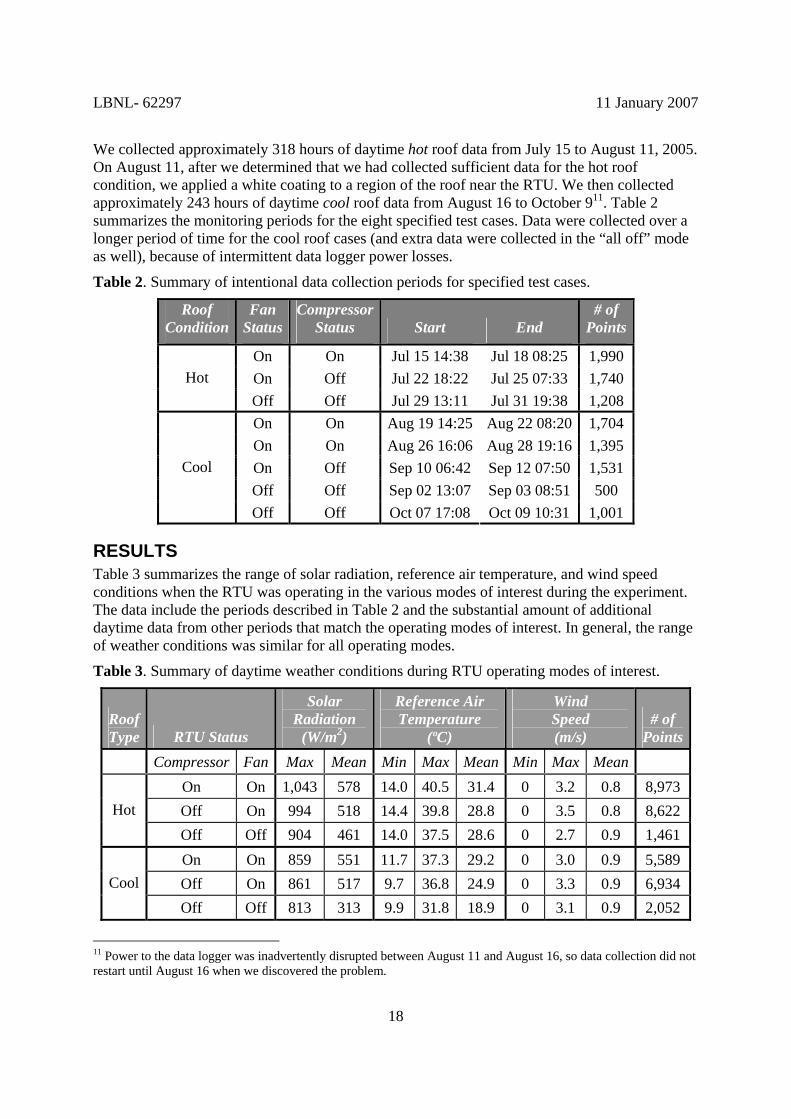
We collected approximately 318 hours of daytime hot roof data from July 15 to August 11, 2005. On August 11, after we determined that we had collected sufficient data for the hot roof condition, we applied a white coating to a region of the roof near the RTU. We then collected approximately 243 hours of daytime cool roof data from August 16 to October 911. Table 2 summarizes the monitoring periods for the eight specified test cases. Data were collected over a longer period of time for the cool roof cases (and extra data were collected in the “all off” mode as well), because of intermittent data logger power losses.
Table 2. Summary of intentional data collection periods for specified test cases.
Roof Condition
Fan Status
CompressorStatus Start End
# of Points
On On Jul 15 14:38 Jul 18 08:25 1,990 On Off Jul 22 18:22 Jul 25 07:33 1,740 Hot Off Off Jul 29 13:11 Jul 31 19:38 1,208 On On Aug 19 14:25 Aug 22 08:20 1,704 On On Aug 26 16:06 Aug 28 19:16 1,395 On Off Sep 10 06:42 Sep 12 07:50 1,531 Off Off Sep 02 13:07 Sep 03 08:51 500
Cool
Off Off Oct 07 17:08 Oct 09 10:31 1,001
RESULTS Table 3 summarizes the range of solar radiation, reference air temperature, and wind speed conditions when the RTU was operating in the various modes of interest during the experiment. The data include the periods described in Table 2 and the substantial amount of additional daytime data from other periods that match the operating modes of interest. In general, the range of weather conditions was similar for all operating modes.
Table 3. Summary of daytime weather conditions during RTU operating modes of interest.
Roof Type RTU Status
Solar Radiation
(W/m2)
Reference Air Temperature
(ºC)
Wind Speed (m/s)
# of Points
Compressor Fan Max Mean Min Max Mean Min Max Mean On On 1,043 578 14.0 40.5 31.4 0 3.2 0.8 8,973 Off On 994 518 14.4 39.8 28.8 0 3.5 0.8 8,622 Hot Off Off 904 461 14.0 37.5 28.6 0 2.7 0.9 1,461 On On 859 551 11.7 37.3 29.2 0 3.0 0.9 5,589 Off On 861 517 9.7 36.8 24.9 0 3.3 0.9 6,934 Cool Off Off 813 313 9.9 31.8 18.9 0 3.1 0.9 2,052
11 Power to the data logger was inadvertently disrupted between August 11 and August 16, so data collection did not restart until August 16 when we discovered the problem.

LBNL- 62297 11 January 2007
19
The reference air temperature listed in Table 3 is the arithmetic average of the four temperatures measured at the top of the “far” towers (about 1 m from the RTU at an elevation of 100 cm). We used this spatial average air temperature as a reference, because the temperatures at the “far” towers appeared to be unaffected by RTU operation (as is discussed later in this section), and the average was slightly cooler during the daytime compared to the air temperature measured at the weather tower (on average, 0.2ºC cooler for the hot roof period and 0.5ºC cooler for the cool roof period). This means that outdoor air temperature rises based on the cooler reference will be slightly larger than if the weather tower air temperature was used as a reference instead.
Table 4 summarizes the range of roof surface temperatures when the RTU was operating in the various modes of interest during the experiment. It also summarizes the differences between the roof surface temperature and the reference air temperature (hereinafter called the “convection temperature difference”). This temperature difference is a key factor for determining the convection heat transfer from the roof to the air above.
Table 4. Summary of daytime roof conditions for RTU operating modes of interest. The temperature difference is the roof surface temperature minus the reference outdoor air temperature.
Roof Type RTU Status
Roof Surface Temperature
(ºC)
Temperature Difference
(ºC) # of
Points Compressor Fan Min Max Mean Min Max Mean
On On 15.7 67.8 51.1 0.3 31.8 19.6 8,973 Off On 16.2 66.7 46.1 -0.1 31.4 17.4 8,622 Hot Off Off 15.7 64.6 44.0 1.1 29.6 15.4 1,461 On On 12.4 40.0 31.1 -6.1 8.7 1.9 5,589 Off On 8.9 40.1 27.7 -5.9 10.3 2.8 6,934 Cool Off Off 8.5 36.9 21.5 -2.4 11.8 2.6 2,052
The roof surface temperature in Table 4 is based only on the location far from the RTU. As shown in Figure 8, the surface temperature sensor nearest to the test RTU was shaded sometimes during late afternoon and early evening hours. This shading resulted in afternoon surface temperatures at this location as much as 7ºC lower than the far surface temperature sensor. Consequently, the temperature measured nearest to the test RTU was not a reliable indicator of the general roof surface temperature.
Compared to the respective maximum roof surface temperature with a hot roof in each operating mode, the maximum roof surface temperatures with a cool roof were substantially lower (about 26 to 28ºC), as expected. The cool roof also significantly reduced the maximum temperature difference between the roof surface and the outdoor air reference (about 18 to 23ºC). Because wind speeds were low and did not change significantly throughout the experiment, the reduced temperature differences mean that the driving force for natural convection heat transfer was reduced by the cool roof. In turn, less heat was convected to the air above the cool roof, which suggests that the air temperature above the roof should also be cooler with a cool roof.

LBNL- 62297 11 January 2007
20
Figure 10 shows the average outdoor air temperature rises adjacent to and about 1 m away from the RTU versus the convection temperature difference (Troof – Tfar,100_avg) for all RTU operating modes during daytime periods. The air temperature rises are in relation to the reference outdoor air temperature (Tfar,100_avg), which is the arithmetic average of the four temperatures measured at the top of the “far” towers (about 1 m from the RTU at an elevation of 100 cm). Tfar,avg is the arithmetic average of the 12 air temperatures measured about 1 m from the RTU. Tnear,wt is a weighted average of the 12 air temperatures measured adjacent to the RTU. The rationale for using a weighting scheme rather than arithmetic averaging for air temperatures measured adjacent to the RTU is described in the subsequent “Discussion” section.
For both the hot and cool roofs, the upper graph of Figure 10 shows two distinct air temperature rises adjacent to the RTU as a function of the convection temperature difference: a slight linear rise and a non linear rise. The cooler, linear band of data corresponds to times when the condenser fan is operating and the condenser inlet airflow is cooling the RTU; the warmer, non-linear band of data corresponds to times when the fan is off and the solar-heated RTU surfaces are heating the nearby air. Data points in between these two sets correspond to times when the fan has just turned on and the RTU is beginning to be cooled by the condenser inlet airflow. The lower graph in Figure 10 shows that this behavior does not occur “far” from the RTU (about 1 m away). As we show later in this section, the RTU operation does not affect the outdoor air temperature at this distance from the RTU.
Figure 10 shows that the maximum outdoor air temperature rises “near” and “far” from the RTU, which occur during peak solar radiation times, are lower with the cool roof than with a hot roof. However, the quantity of data makes it difficult to visibly discern the exact differences. By binning the data, we generated the statistical data in Table 5, which disaggregates the maximum daytime outdoor air temperature rises by roof type and RTU operating mode. The maximum rises listed in Table 5 correspond to the largest temperature bin with 20 or more data points. In some cases, a few points occur in one or two bins larger than those listed, but the differences in temperature rise are not statistically significant. The “Bin Midpoint” represents the midpoint of a 1ºC wide temperature rise bin. “RMS Deviation” is the root-mean-square deviation of all data points in the bin about the bin average for the associated roof type and RTU operating mode.
Table 5. Summary of daytime maximum outdoor air temperature rises disaggregated by roof type and RTU operating mode for all wind directions.
Roof Type RTU Status
Bin Midpoint
(ºC) # of
Points
“Near” MaximumTemperature Rise
(ºC)
“Far” MaximumTemperature Rise
(ºC)
Compressor Fan Mean RMS
Deviation Mean RMS
DeviationOn On 30.5 148 0.3 0.15 1.4 0.16 Off On 30.5 110 0.3 0.12 1.5 0.17 Hot Off Off 29.5 25 2.1 0.39 1.3 0.16 On On 7.5 27 0.0 0.09 0.9 0.17 Off On 9.5 278 0.0 0.13 1.0 0.10 Cool Off Off 11.5 82 1.4 0.18 0.9 0.08

LBNL- 62297 11 January 2007
21
Figure 10. Daytime outdoor air temperature rises adjacent to the RTU (upper graph) and about 1 m away from the RTU (lower graph) versus the convection temperature difference for all RTU operating modes and all wind directions.
LBNL- 62297 11 January 2007
22
With a hot roof and the RTU compressor and condenser fan both operating, Table 5 shows that the temperature rise for the air entering the RTU (“near” case) was only 0.3ºC on average (0.15ºC RMS deviation) during peak solar radiation times. Applying the cool roof coating eliminated this small temperature rise (0.0ºC rise on average, 0.09ºC RMS deviation), but the reduction was only 0.3ºC on average.
Compared to the temperature rises when the RTU compressor and condenser fan were both operating, Table 5 shows that the air temperature rises were not significantly different when the RTU fan operated without the compressor. The average and maximum discharge air temperatures when the compressor was operating were 7.6ºC and 10.7ºC warmer than the reference air temperature, respectively. Given these large temperature rises, one would expect to observe some warming of the condenser inlet air if recirculation was occurring. The lack of a significant difference suggests that hot air discharged by the RTU was not recirculated.
With a hot roof and the RTU fan and compressor both off, Table 5 shows that the air temperature rise adjacent to the RTU (“near” case) was about 2.1ºC on average during peak solar radiation times. Applying the cool roof coating reduced this temperature rise to about 1.4ºC. Neither air temperature rise will significantly affect RTU performance when the RTU restarts, because the entire volume of heated air located no more than 1 m from the RTU sides will likely cross the condenser within 1 second of fan start up.
Table 5 also shows that the temperature rises for the air far from the RTU differed only slightly (0.1 to 0.2ºC) between all operating modes, regardless of roof type. These small differences suggest that the temperature rises at least 1 m from the RTU are independent of RTU operation.
Although the localized effect described in this report is very small, it is important to note that there is a heat island effect caused by the low solar reflectance of urban surfaces that should not be ignored. Akbari et al. (2001) estimate that the broader effect increases urban air temperatures by 0.5 to 2.0ºC and increases cooling-related electricity use by 5 to10% for U.S. urban buildings.
DISCUSSION
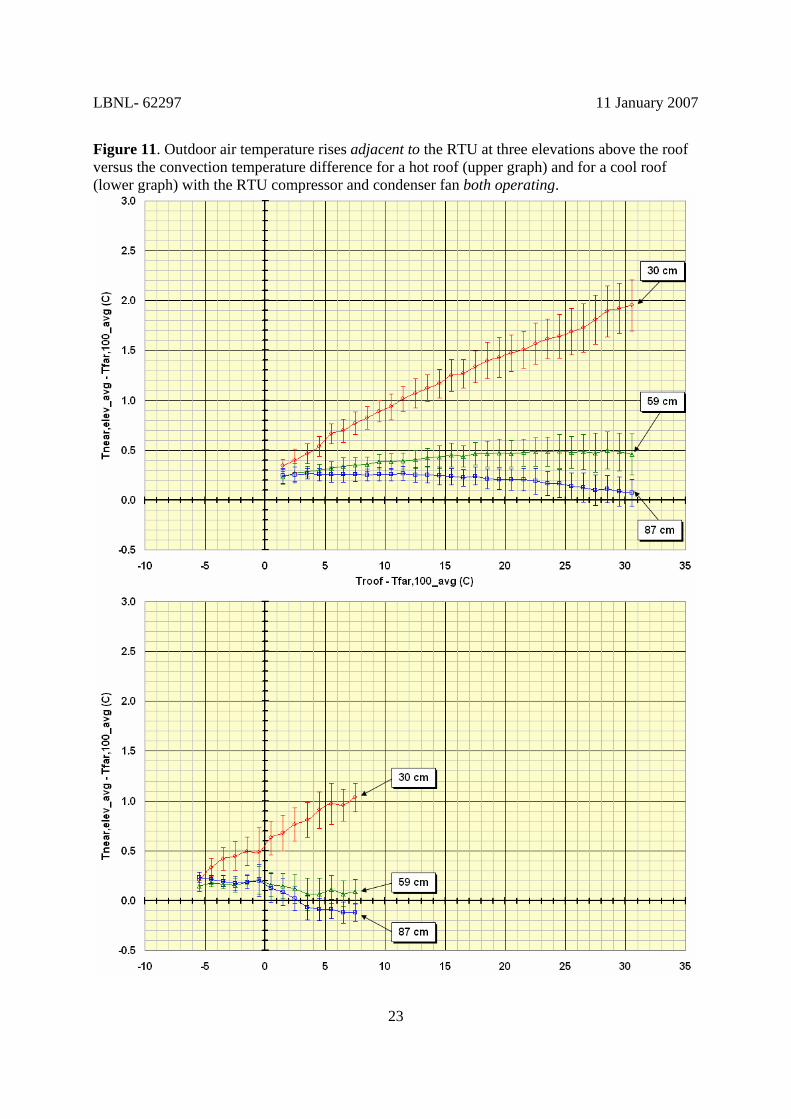
Temperature Distribution and Airflow Patterns Figure 11 shows the average outdoor air temperature rise at each of the three elevations adjacent to the RTU versus the convection temperature difference for hot (upper graph) and cool (lower graph) roofs. At each elevation, the temperature rise is the arithmetic average of the four air temperatures measured at that elevation (Tnear,elev_avg) minus the arithmetic-average reference outdoor air temperature (Tfar,100_avg). The error bars for each bin represent the root-mean-square deviation of all data points in the bin about the associated bin average. Regardless of roof type, Figure 11 shows that the inlet air closer to the roof (30 cm elevation) is significantly warmer than the inlet air near the middle and top of the RTU (59 and 87 cm elevations, respectively).
A substantial reason why the roof reflectance and warm lower air have such a small effect on the weighted average inlet air temperatures is that the RTU appears to draw substantial amounts of air from well above the roof and little from near the roof. Figure 12 illustrates this behavior. It shows several views of a flow visualization test that we carried out on the hot roof using a theatrical smoke generator while the condenser fan operated. Wind speeds during the test were low and approximately constant (average of 0.5 m/s with an RMS deviation of 0.2 m/s and a maximum of 1.1 m/s).
LBNL- 62297 11 January 2007
23
Figure 11. Outdoor air temperature rises adjacent to the RTU at three elevations above the roof versus the convection temperature difference for a hot roof (upper graph) and for a cool roof (lower graph) with the RTU compressor and condenser fan both operating.

LBNL- 62297 11 January 2007
24
Figure 12. Views of smoke movement near the RTU with the condenser fan operating during flow visualization tests before the white roof coating was applied.

LBNL- 62297 11 January 2007
25
In Figure 12, substantial amounts of the smoke appear to bypass the RTU when the smoke is discharged near the roof, only about 30 cm away from the RTU. In this case, it is unclear how much of the smoke that is drawn into the RTU enters through the condenser and how much enters through the holes in the bottom of the RTU (which bypass the coil). At higher elevations, smoke is drawn into the condenser from locations at least as distant as the “far” towers (1 m away from the RTU), and even from above the top of those towers (100 cm above the roof).
Figure 13 shows several views of chaotic smoke patterns far away from the RTU (near the center of the roof). Similar patterns occurred near the RTU when the condenser fan was not operating. These patterns suggest turbulent mixing of the air at the roof with the air above. The lack of chaotic smoke patterns near the RTU when the condenser fan is operating suggests that the airflows induced by the fan are dominating the nearby flow regime (as one might expect).
Figure 13. Views of smoke movement near the center of the roof far away from the RTU during flow visualization tests before the white roof coating was applied.
Our observation that more air enters near the top of the RTU than at the bottom is consistent with Elgowainy’s (2003) measurements of the velocity of air entering a residential heat pump that has a configuration similar to the RTU that we tested. In particular, Elgowainy found that the velocity of air entering near the top of the condenser was about 1.8 times larger than the velocity at the bottom. He also found that the airflow at any particular elevation is uniform around the perimeter of the condenser.
Because the airflow entering the RTU is not uniform with height, one cannot simply use arithmetic averaging to determine the average temperature of the air entering the RTU. Instead, one needs to calculate the flow weighted average, which is the sum of the products of the

LBNL- 62297 11 January 2007
26
arithmetic average temperature at each elevation and the mass flow fraction associated with that elevation:
, ,30_ ,59_ ,87 _* * *near wt near avg near avg near avgT a T b T c T= + +
Due to the limited scope of our “proof-of-concept” experiment, we did not measure the airflows associated with each temperature measurement; however, the measured inlet air temperatures adjacent to the RTU and associated discharge air temperature data provide sufficient information to estimate the flow fractions for each temperature measurement elevation.
In particular, for periods when the RTU fan operated without the compressor and the condenser was cool12, one can observe that using the arithmetic average inlet air temperature is incorrect by plotting the difference between the arithmetic average temperature of air entering the RTU and the temperature of air discharged from the RTU. Ideally, in this operating mode, the discharge air temperature should be slightly warmer than the arithmetic average if the airflow is uniform13. If, however, more cool air enters near the top than hot air near the bottom as we have observed, then the discharge temperature will appear to be cooler than the arithmetic average inlet air temperature; this indeed is the case, as shown in the upper graph of Figure 14.
For the same operating mode that is described above, one can also calculate the flow weighted average (also shown in Figure 14, lower graph) using the relation above and a least squares fit to minimize the root mean square of the differences between the discharge temperature (less the fan temperature rise) and the flow weighted average. Using this procedure, we determined that the best fit for the coefficients was: a=8.7%, b=25.6%, and c=65.7%.
These coefficients mean that on average only about 9% of the air entering the RTU is warm air from an elevation of 30 cm; the remainder of the air (about 91%) is comprised of the cooler air at the mid and top elevations of the RTU (59 and 87 cm, respectively). This finding is consistent with our qualitative observation during the flow visualization tests that the RTU appears to draw substantial amounts of air from well above the roof and little from near the roof.
Wind Effects Although the temperature rises shown in Table 5 are small, we further reduced the data to only include directions with wind flowing toward the RTU from across the roof, so that we could determine whether wind direction affected the results. Using the building north axis as a reference, and defining positive directions as clockwise from this axis, the range of directions for wind flowing toward the RTU from across the roof is -95 to 101 degrees. Table 6 summarizes the filtered data.
12 This operating mode represents periods when the condenser fan was operating continuously and residual heat remaining in the condenser (after the compressor stopped circulating hot refrigerant through the condenser) had been rejected by condenser-fan-induced airflow. After 5 minutes of air cooling with the compressor off, more than 99% of the time, the change in RTU discharge air temperature from one minute to the next was less than 0.2°C. During the few remaining times in this mode, the discharge air temperature was no more than 0.4°C warmer than the previous minute; it was almost never any cooler the following minute. 13 Fan energy that is lost due to fan and motor inefficiencies will slightly raise the temperature of the air passing through the RTU. Given that the motor power is 0.25 kW and the nominal total flow is 1.5 m3/s, and assuming that the combined fan and motor inefficiencies are about 50%, then the loss to the airstream is about 125 W and the associated temperature rise is about 0.1°C.

LBNL- 62297 11 January 2007
27
Figure 14. Comparison of averaging schemes for determining average air temperature rise through RTU versus the convection temperature difference when the RTU fan operated without the compressor and the condenser was cool (compressor had been off for at least 5 minutes).

LBNL- 62297 11 January 2007
28
Table 6. Summary of daytime maximum outdoor air temperature rises disaggregated by roof type and RTU operating mode for wind flowing toward the RTU from across the roof.
Roof Type RTU Status
Bin Midpoint
(ºC) # of
Points
“Near” MaximumTemperature Rise
(ºC)
“Far” MaximumTemperature Rise
(ºC)
Compressor Fan Mean RMS
Deviation Mean RMS
DeviationOn On 30.5 62 0.3 0.14 1.5 0.17 Off On 30.5 54 0.3 0.12 1.5 0.17 Hot Off Off 27.5 35 1.9 0.21 1.4 0.15 On On 6.5 71 0.0 0.12 0.9 0.09 Off On 9.5 101 0.0 0.12 1.0 0.09 Cool Off Off 11.5 39 1.4 0.15 1.0 0.07
Comparing the data in Tables 5 and 6, one can observe that there are no significant differences between the respective air temperature rises, regardless of where the wind originates. The absence of a significant difference further supports our findings that the condenser inlet air temperatures are only weakly dependent on roof conditions.
The wind speeds that we measured were low (usually less than 1 m/s). Instances of near zero wind speed (less than 0.05 m/s) rarely occurred (14 times with the hot roof and 15 times with the cool roof), and no conclusions of statistical significance can be drawn from these occurrences.
Comparison with Other Studies The condenser inlet air temperature rises that we measured in our experiment are an order of magnitude lower than those reported by others. A likely reason is a difference in measurement techniques and instruments; we carried out the measurements over a wide range of conditions at multiple locations and took great care to minimize radiation induced temperature measurement errors. The other studies did not report how these errors were addressed.
A contributing but less likely reason is that our “hot” roof has a greater solar reflectance (0.37) and is cooler than some, and perhaps all, of the “hot” roofs involved in the other experiments. In particular, the measurements by Cua and by Leonard and Leonard both involved black EPDM roofs, which may have a solar reflectance of about 0.05. A smaller solar reflectance will have correspondingly larger solar absorptance, and the roof surface will be hotter than what we observed in our experiment (maximum of 67.8ºC). For example, Cua reported roof surface temperatures as high as 83ºC (about 15ºC greater than the maximum that we observed).
A linear fit (R2=0.83) approximates the upper 95% confidence level for the inlet air temperature rises shown in the upper graph of Figure 10 with the RTU fan and compressor both operating:
( ), ,100 _ ,100 _0.0096 0.38near wt far avg roof far avgT T T T− = − +
Using this relation and assuming that the maximum roof temperature is coincident with the maximum reference air temperature (40.5ºC) that we measured, we estimate that the 83ºC

LBNL- 62297 11 January 2007
29
maximum roof surface temperature would result in an inlet air temperature rise only 0.2ºC warmer than the 0.6ºC that would occur at 67.8ºC.
Energy Saving Potential Based on the tests by Faramarzi (2004) that are described in the Introduction, we expect that the 0.3 to 0.5ºC reduction in condenser inlet air temperature associated with using a roof with a solar reflectance of 0.8 instead of one with a reflectance of 0.05 to 0.37 will improve RTU capacity about 0.2 to 0.5%, reduce system power consumption about 0.3 to 1.0%, and improve EER about 0.6 to 1.1%, all relative to values at outdoor rating conditions (35ºC). The increased capacity means that the RTU would need to run 0.2 to 0.4% less time to meet a given cooling load. With the run time and power consumption decreases combined, the RTU energy consumption would decrease about 0.3 to 1.0%.
Energy codes such as ASHRAE Standards 90.1 and 90.2 and California Title 24 already include energy saving credits related to cool roofs. Additional energy savings from reducing condenser inlet air temperature by installing a cool roof would only slightly increase these credits.
CONCLUSION Several recent building industry reports have suggested that cool roof coatings might produce significant energy savings by lowering the temperature of outdoor air that is used to cool unitary air-conditioning equipment located on roofs. However, the measurement instrumentation, procedures, and roof conditions are not well described in any of these studies. As a step toward clarifying this issue, we carried out a rigorous field experiment using research grade instruments to demonstrate the effects of roof reflectance on the heating of condenser inlet air by the roof, and to isolate the effects of RTU condenser fan operation on the potential recirculation of hot discharge air from the condenser.
With a “hot” roof and the compressor and condenser fan both operating, the air temperature at the condenser inlet was only 0.3ºC warmer on average during peak solar radiation times compared to a reference located far from the RTU. Applying a “cool” roof coating around the RTU eliminated this small temperature rise. The temperature rise was not significantly different when the condenser fan operated without the compressor, which suggests that hot air discharged by the RTU was not recirculated.
With a hot roof and the RTU fan and compressor both off, the air temperature rise adjacent to the RTU was about 2.1ºC on average during peak solar radiation times. Applying the cool roof coating reduced this temperature rise to about 1.4ºC. Neither air temperature rise will significantly affect RTU performance when the RTU restarts, because the entire volume of heated air adjacent to the RTU will likely cross the condenser within 1 second of fan start up.
The temperature rises for the air far from the RTU differed only slightly (0.1 to 0.2ºC) between all operating modes, regardless of roof type. These small differences suggest that the temperature rises at least 1 m from the RTU are independent of RTU operation.
Based on published relationships for cooling capacity and system power versus condenser inlet air temperature (normalized, respectively, by the capacity and power at the ARI outdoor temperature rating point of 35ºC), the 0.3ºC reduction in inlet air temperature associated with installing a cool roof corresponds to a decrease in RTU energy consumption of about 0.3 to 0.6% and an increase in EER of about 0.6 to 0.7%.

LBNL- 62297 11 January 2007
30
Energy codes such as ASHRAE Standards 90.1 and 90.2 and California Title 24 already include energy saving credits related to cool roofs. Additional energy savings from reducing condenser inlet air temperature by installing a cool roof would only slightly increase these credits.
ACKNOWLEDGEMENTS This work was supported by the California Energy Commission (CEC) through its Public Interest Energy Research Program (PIER), and by the Assistant Secretary for Energy Efficiency and Renewable Energy under Contract No. DE-AC02-05CH11231. We thank Chris Scruton and Nancy Jenkins of the CEC for their guidance and support. We extend our appreciation to Steve Schmidt of the University of California, Davis for his coordination of facilities on campus; to Keith Buter for his logistical assistance in identifying monitoring sites and coating the roof; and to Darryl Dickerhoff from LBNL for his invaluable assistance in designing and installing the measurement apparatus, and in providing support for the data collection and analysis.
REFERENCES
Akbari, H., R.M. Levinson, and L. Rainer. 2005. “Monitoring the Energy-Use Effects of Cool Roofs on California Commercial Buildings,” Energy and Buildings (in press). Excerpt from Lawrence Berkeley National Laboratory Report LBNL-54770, Berkeley, CA.
Akbari, H., M. Pomerantz, and H. Taha. 2001. “Cool Surfaces and Shade Trees to Reduce Energy Use and Improve Air Quality in Urban Areas,” Solar Energy, Vol. 70, No. 3.
Akbari, H.A. and S.J. Konopacki. 1998. “The Impact of Reflectivity and Emissivity of Roofs on Building Cooling and Heating Energy Use”. Proceedings of the Thermal Performance of the Exterior Envelopes of Buildings VII. Clearwater Beach, FL. December
Anderson, S.P. and M.F. Baumgartner. 1997. “Radiative Heating Errors in Naturally Ventilated Air Temperature Measurements Made from Buoys”. Journal of Atmospheric and Oceanic Technology: Vol. 15, No. 1.
ARI. 1997. “Guidelines for Roof Mounted Outdoor Air-Conditioner Installations”. Air-Conditioning and Refrigeration Institute and Sheet Metal and Air-Conditioning Contractors National Association.
ASHRAE Handbook of Fundamentals. 2005. “Chapter 3: Heat Transfer”. Atlanta, GA: American Society of Heating, Refrigerating, and Air-Conditioning Engineers.
ASTM. 2004a. “C1549: Standard Test Method for Determination of Solar Reflectance Near Ambient Temperature Using a Portable Solar Reflectometer”. West Conshohocken, PA: ASTM International.
ASTM. 2004b. “C1371: Standard Test Method for Determination of Emittance of Materials Near Room Temperature Using Portable Emissometers”. West Conshohocken, PA: ASTM International.
ASTM. 1997. “E1918: Standard Test Method for Measuring the Solar Reflectance of Horizontal and Low-Sloped Surfaces in the Field”. West Conshohocken, PA: ASTM International.
Berdahl, P. and S.E. Bretz. 1997. “Preliminary Survey of the Solar Reflectance of Cool Roofing Materials”. Energy and Buildings, Vol. 25, 149-158.

LBNL- 62297 11 January 2007
31
Berdahl, P. and R. Fromberg. 1982. “The Thermal Radiance of Clear Skies”. Solar Energy, Vol. 29, No. 4.
Clear, R.D., L. Gartland, and F.C. Winkelmann. 2003. “An Empirical Correlation for the Outside Convective Air-Film Coefficient for Horizontal Roofs”. Energy and Buildings, Vol. 35, Number 8, September. LBNL-47275.
Cresline-West. 2002. “Typical Properties of Plastic Pipe”. Bulletin No. CWT-3. May. www.cresline.com/pdf/cresline-west/productapplication&techdata/cwt3.pdf
Cua, A. 2005. “Reflective Roof Coatings Improve Efficiency”. Advanced Coating Systems. http://www.advanced-coatings.com/reflective-roof-coatings.php
Elgowainy, A. 2003. “Effect of Airflow Maldistribution on Pressure Drop and Thermal Performance of Heat Exchangers in Residential Heat Pump Systems”. ASHRAE Transactions, Vol. 109, Part 2.
Erell, E., V. Leal, and E. Maldonado. 2003. “On the Measurement of Air Temperature in the Presence of Strong Solar Radiation”. Fifth International Conference on Urban Climate; Lodz, Poland. September.
Faramarzi, R. 2004. “Performance Evaluation of Typical Five Ton Roof Air Conditioning Units Under High Ambient Temperatures”. Seminar Presentation at the Food Marketing Institute (FMI) Energy and Technical Services Conference; Dallas, TX. September.
Jacobs, P. 2003. “Small HVAC System Design Guide”. Architectural Energy Corporation Report to the California Energy Commission. Contract 400-99-013.
Konopacki, S. and H. Akbari. 2001. “Measured Energy Savings and Demand Reduction from a Reflective Roof Membrane on a Large Retail Store in Austin”. Lawrence Berkeley National Laboratory Report. LBNL-47149. June.
Konopacki, S., L. Gartland, H. Akbari, and L. Rainer. 1998. “Demonstration of Energy Savings of Cool Roofs”. Lawrence Berkeley National Laboratory Report LBNL-40673, Berkeley, CA.
Leonard, T. and T. Leonard. 2006. “Stay Cool: A Roof System on a Minnesota Building Demonstrates Energy-Saving Technology”. Professional Roofing. April.
Parker, D.S., S.F. Barkaszi, and J.K. Sonne. 1996. “Measured Impacts of Air Conditioner Condenser Shading”. Proceedings of the Tenth Symposium on Improving Building Systems in Hot and Humid Climates, Texas A&M University, Fort Worth, TX. May.
Smith, V. and J. Braun. 2003. “Fault Detection and Diagnostics for Rooftop Air Conditioners”. Final Report to the California Energy Commission. Contract 400-99-011.
Sonne, J.K., R.K. Vieira, and A.F. Rudd. 1993. “Limiting Solar Radiation Effects on Outdoor Air Temperature Measurement”. ASHRAE Transactions, Vol. 99, Part 1.
3DCam. 2006. “Thermal Properties, ABS Molded”. 3D-Cam, Inc., Chatsworth, CA. http://www.3d-cam.com/materials/abs_molded.asp