EFFECTS OF LANDUSE AND LANDCOVER DYNAMICS ON THE …um.ase.ro/no143/5.pdf · blocks located within...
21
Kathwas A. K., Patel N. EFFECTS OF LANDUSE AND LANDCOVER DYNAMICS ON THE MIGRATION AND DEMOGRAPHIC PATTERN OF TRIBAL POPULATION USING GEOSPATIAL TECHNIQUES 77 Theoretical and Empirical Researches in Urban Management Volume 14 Issue 3 / August 2019 ent EFFECTS OF LANDUSE AND LANDCOVER DYNAMICS ON THE MIGRATION AND DEMOGRAPHIC PATTERN OF TRIBAL POPULATION USING GEOSPATIAL TECHNIQUES Amar Kumar KATHWAS Department of Remote Sensing, Birla Institute of Technology, Mesra, Ranchi, Jharkhand, India [email protected] Nilanchal PATEL Department of Remote Sensing, Birla Institute of Technology, Mesra, Ranchi, Jharkhand, India [email protected] Abstract Demography is considered as the major influencing parameter for landuse and landcover (LULC) change. LULC dynamics is invariably associated with various forms of land and ecological degradation. Identification of drivers and mechanism of LULC dynamics is also crucial for alleviation of land degradation. This paper investigates the spatio-temporal dynamics of LULC and demography and their inter-relationship in the different administrative blocks located within parts of Subarnarekha watershed, Jharkhand state, India, which comprises a large concentration of tribal population. The investigation was conducted in two successive time gradients i.e. 1987- 2000 and 2000-2013 corresponding to the pre- and post-state formation in order to assess the impact of urbanization on the LULC dynamics and demographic characteristics subsequent to the formation of the state. Three indices viz. Net Change Ratio, Annual Rate of Change and Single Index of Dynamic Extent were used to determine the spatio-temporal dynamics of five major LULC categories viz. builtup, builtup with vegetation, cropland, dense vegetation, and sparse vegetation with scrubs, while the demographic parameters used are namely Population Density, House Hold Density and percent Tribal Population. The analyses revealed considerable increase in the builtup area from the pre-state to post-state period and distinct pattern of association between the demographic parameters and different LULC categories. The percent tribal population exhibits significantly high correlation with dense vegetation, whereas the population density and household density exhibit strong correlation with the builtup category. The findings are insightful and can be implemented towards sustainable development of the land resources in the study area. Keywords: Demography, Landuse landcover, Tribal Population, Land Degradation 1. INTRODUCTION The landuse and landcover (LULC) dynamics in a region is largely representative of the existing and changing socio-economic conditions in space and time (Rahdary et al. (2008); Bhagawat 2012). The main factors that lead to LULC changes include optimal utilization of the existing land and improvement of the socio-economic conditions of the population living in the region (Banzhaf et al. 2013; Cui and
Transcript of EFFECTS OF LANDUSE AND LANDCOVER DYNAMICS ON THE …um.ase.ro/no143/5.pdf · blocks located within...

Kathwas A. K., Patel N.
EFFECTS OF LANDUSE AND LANDCOVER DYNAMICS ON THE MIGRATION AND DEMOGRAPHIC PATTERN OF TRIBAL POPULATION USING GEOSPATIAL TECHNIQUES
77
Theor
etica
l and
Empirical Rese
arc
hes
in U
rban
Mana
gement
Volum
e 1
4
Iss
ue 3
/ A
ugus
t 2019
Theor
etica
l and
Empirica
l Rese
arc
hes
in U
rban
Mana
gement
EFFECTS OF LANDUSE AND LANDCOVER DYNAMICS ON THE MIGRATION AND DEMOGRAPHIC PATTERN OF TRIBAL
POPULATION USING GEOSPATIAL TECHNIQUES
Amar Kumar KATHWAS Department of Remote Sensing, Birla Institute of Technology, Mesra, Ranchi, Jharkhand, India
Nilanchal PATEL Department of Remote Sensing, Birla Institute of Technology, Mesra, Ranchi, Jharkhand, India
Abstract Demography is considered as the major influencing parameter for landuse and landcover (LULC) change. LULC dynamics is invariably associated with various forms of land and ecological degradation. Identification of drivers and mechanism of LULC dynamics is also crucial for alleviation of land degradation. This paper investigates the spatio-temporal dynamics of LULC and demography and their inter-relationship in the different administrative blocks located within parts of Subarnarekha watershed, Jharkhand state, India, which comprises a large concentration of tribal population. The investigation was conducted in two successive time gradients i.e. 1987-2000 and 2000-2013 corresponding to the pre- and post-state formation in order to assess the impact of urbanization on the LULC dynamics and demographic characteristics subsequent to the formation of the state. Three indices viz. Net Change Ratio, Annual Rate of Change and Single Index of Dynamic Extent were used to determine the spatio-temporal dynamics of five major LULC categories viz. builtup, builtup with vegetation, cropland, dense vegetation, and sparse vegetation with scrubs, while the demographic parameters used are namely Population Density, House Hold Density and percent Tribal Population. The analyses revealed considerable increase in the builtup area from the pre-state to post-state period and distinct pattern of association between the demographic parameters and different LULC categories. The percent tribal population exhibits significantly high correlation with dense vegetation, whereas the population density and household density exhibit strong correlation with the builtup category. The findings are insightful and can be implemented towards sustainable development of the land resources in the study area. Keywords: Demography, Landuse landcover, Tribal Population, Land Degradation
1. INTRODUCTION
The landuse and landcover (LULC) dynamics in a region is largely representative of the existing and
changing socio-economic conditions in space and time (Rahdary et al. (2008); Bhagawat 2012). The
main factors that lead to LULC changes include optimal utilization of the existing land and improvement
of the socio-economic conditions of the population living in the region (Banzhaf et al. 2013; Cui and

78
Kathwas A. K., Patel N.
EFFECTS OF LANDUSE AND LANDCOVER DYNAMICS ON THE MIGRATION AND DEMOGRAPHIC PATTERN OF TRIBAL POPULATION USING GEOSPATIAL TECHNIQUES
Theor
etica
l and
Empirical Rese
arc
hes
in U
rban
Mana
gement
Volum
e 1
4
Iss
ue 3
/ A
ugus
t 2019
Theor
etica
l and
Empirica
l Rese
arc
hes
in U
rban
Mana
gement
Wang 2015). In the rural areas, where the main source of livelihood is agriculture, traditionally farmers
follow the practice of converting the natural vegetation into croplands in order to expand the existing
cropland and improve their living and economic conditions (Bandopadhyay 1999; Liu et al. 2015). This
leads to serious deterioration of the pristine ecology of the region (Ramankutty and Foley 1999).
However, extensive urbanization in the last few decades has forced rampant conversion of the natural
vegetation and fertile agricultural lands in order to create space for development and growth (Deng and
Srinivasan 2016; Patra, Sahoo, Mishra, & Mahapatra, 2018). This process is also accompanied by the
migration of rural people to the urban areas in search of employment and better livelihood (El Garouani,
Mulla, El Garouani, & Knight, 2017; Reenberg and Lund 1998). Therefore, the major LULC dynamics
occurring in the urbanizing watersheds include conversion of the existing natural vegetation into
croplands and second, conversion of the existing croplands and natural vegetation into builtup lands.
The occurrence of different types of LULC transitions is dependent upon the population density and
also, the socio-economic conditions of the population (Lambin et al. 2001; Zanganeh Shahraki et al.
2011). In the present study area (parts of Subarnarekha watershed, Jharkhand, India), the native
population used to be dominantly tribal (Areeparampil 2002). In the past, the major source of
sustenance of the tribal people used to be forest and cropland, however, recently, considerable
proportion of them have undertaken different kinds of employment, especially as unskilled and semi-
skilled workforce in the agricultural sector and various other sectors such as construction, mining etc.
(Maharatna 2005). In view of the above reasons, it is imperative to carry out spatio-temporal
assessment of the nature and magnitude of the LULC transitions and also, the pattern of association of
the native inhabitants with the various LULC categories (Prakash 1999, 2007; Toh, Angwafo, Ndam, &
Antoine, 2018). The findings determined from such investigations would provide meaningful insights
pertaining to the habitat pattern of the native population, and further, help towards sustainable
conservation of the natural resources.
A number of studies have been conducted in the different parts of the world pertaining to the
relationship between demography and natural resources (Shiferaw and Singh 2011; Ningal et al. 2008;
Lambin et al. 2001; WoldeYohannes, Cotter, Kelboro, & Dessalegn, 2018). Lambin et al. (2003) have
reported that in the developing countries, population growth is the prime factor responsible for
deforestation and expansion of agricultural lands. (Bilsborrow 1992) established that demography-
economic response leads to migration and degradation of environment. It is evident from the studies
conducted by (Reenberg and Lund 1998; Chen et al. 2017) that rural-rural migration also leads to
deforestation and expansion of agricultural lands for cultivation and food production. In developing
countries like India, the native population mainly tribals are highly associated with forest cover areas, as

Kathwas A. K., Patel N.
EFFECTS OF LANDUSE AND LANDCOVER DYNAMICS ON THE MIGRATION AND DEMOGRAPHIC PATTERN OF TRIBAL POPULATION USING GEOSPATIAL TECHNIQUES
79
Theor
etica
l and
Empirical Rese
arc
hes
in U
rban
Mana
gement
Volum
e 1
4
Iss
ue 3
/ A
ugus
t 2019
Theor
etica
l and
Empirica
l Rese
arc
hes
in U
rban
Mana
gement
they are primarily dependent for their food, fuelwood and livelihood (Maharatna 2005; Singh 2005).
However, with the increasing socio-economy, and development of the region, the pressure on forest
area has increased, leading to degradation of forest cover and out-migration of the tribals for search of
livelihoods (Hussain, Haq, & Rahman, 2018; Sharan 2005). The prevalence of anthropogenic intrusion
and consequent degradation of island biodiversity and natural resources has also been noticed in the
Neil Island, Andaman and Nicobar, India (Saravanan et al. 2013).
From the foregoing discussion, it becomes now clear that demography has significant effects on the
LULC dynamics in an area. With this backdrop, the present research was undertaken to investigate the
relationship between the LULC categories and demographic parameters in parts of the Subarnarekha
river basin, Jharkhand state, India. The demographic parameters considered are viz. population density,
house hold density and percent tribal population. The state and newly formed capital, Ranchi witnessed
rapid urbanization subsequent to the formation of the Jharkhand state in the year 2000. The study was
performed for two successive time gradients representing the pre-state (1987-2000) and post-state
formation periods (2000-2013). The various LULC categories were delineated from the analysis of the
satellite data of the corresponding years. The LULC dynamics was determined for each time gradient
and the demographic parameters were retrieved from the nearest year Census data i.e. 1991, 2001 and
2011 respectively.
1.1. Objectives of the Study
The major objective of the present investigation is to determine the relationship of the individual
demographic parameters and LULC present in the different administrative blocks in the study area
based on the Pearson’s correlation coefficient values between them. The different sub-objectives of the
research comprise assessment of the (i) causative factors for LULC change in the respective time
gradients i.e. 1987-2000 and 2000-2013 respectively, (ii) influence of urbanization on the migration of
the tribal population and (iii) nature and extent of association of the tribal population with the different
LULC categories. The results determined from these analyses would be helpful in the sustainable
management of the land resources in the study area.
1.2. Study area
The investigation was conducted in parts of the Subarnarekha river basin situated in Jharkhand state,
India, which extends from 23Ο 52′ to 23Ο 03′ latitude and 85Ο 16′ to 85Ο 86′ longitude covering nearly
2229 sq. km area. The study area comprises eleven administrative blocks covered under two districts

80
Kathwas A. K., Patel N.
EFFECTS OF LANDUSE AND LANDCOVER DYNAMICS ON THE MIGRATION AND DEMOGRAPHIC PATTERN OF TRIBAL POPULATION USING GEOSPATIAL TECHNIQUES
Theor
etica
l and
Empirical Rese
arc
hes
in U
rban
Mana
gement
Volum
e 1
4
Iss
ue 3
/ A
ugus
t 2019
Theor
etica
l and
Empirica
l Rese
arc
hes
in U
rban
Mana
gement
viz. Ranchi and Khunti (Figure 1). Ranchi city, the capital of the state falls within the Ranchi district,
which is located towards the northwestern part of the study area.
FIGURE 1 - LOCATION OF THE STUDY AREA WITH THE STANDARD FALSE COLOR COMPOSITE OF LANDSAT TM (SEPTEMBER
2000).
Agriculture represents the dominant category in the study area, followed by natural vegetation cover.
Agriculture and forest products serve as the chief source of livelihood for bulk of population in the study
area. Forests are exploited for two major utilities such as fire wood and timber. In the post 1970s era,
industrialization has made a rapid progress in the region. The indigenous population still follows the
traditional occupations (Maharatna and Chikte 2004). The non-earning or dependent people comprise
about 64 percent of the total agricultural population and comprise women, children and old persons.

Kathwas A. K., Patel N.
EFFECTS OF LANDUSE AND LANDCOVER DYNAMICS ON THE MIGRATION AND DEMOGRAPHIC PATTERN OF TRIBAL POPULATION USING GEOSPATIAL TECHNIQUES
81
Theor
etica
l and
Empirical Rese
arc
hes
in U
rban
Mana
gement
Volum
e 1
4
Iss
ue 3
/ A
ugus
t 2019
Theor
etica
l and
Empirica
l Rese
arc
hes
in U
rban
Mana
gement
However, a large number of women belonging to the tribal and backward categories work in agricultural
fields and also work as laborers on road and building construction works (Bandopadhyay 1999).
Physiographically, the study area has undulating topography and is comprised of three broad divisions
namely, the north-western pat (flat-topped erosional surfaces), the lower Chotanagpur plateau and the
Ranchi plateau. The processes of deforestation and urbanization have been identified as the major
LULC dynamics in the study area.
2. MATERIALS AND METHODS
The LULC maps of the study area were prepared from the satellite data pertaining to the year of
formation of state (year 2000), and pre- and post-state formation scenario (Figures 4, 3, 5). The satellite
data include Landsat MSS (11 December 1987), Landsat Thematic Mapper (TM) (17 December 2000)
and Landsat 8 OLI (21 December 2013). The various LULC categories comprise Cropland, Dense
Vegetation, Sparse Vegetation with Scrubs, Builtup with Vegetation and Builtup. The demographic
parameters viz. village level total population density, household density and percent tribal population of
the individual blocks were retrieved from the census data for 1991, 2001 and 2011 respectively. Cloud-
free satellite data for the year 2000 was available. However, owing to the non-availability of the cloud-
free satellite data for the years 1991 and 2011, the LULC categories were delineated from the available
cloud-free satellite data of the nearest corresponding years, i.e. 1987 and 2013 respectively.
Prior to the delineation of LULC categories, the satellite imageries were first geo-rectified (UTM Zone
45, WGS 84) followed by image enhancement using ERDAS Imagine 2015® image processing
software. The delineation of the various LULC categories was performed through onscreen digitization
on the enhanced satellite imageries based on the image interpretation keys and field verification. The
three demographic parameters viz. population density, percent tribal population and household density
of the individual administrative blocks were determined by averaging the respective parameters
pertaining to the different villages lying within the corresponding blocks. The demographic parameters of
the different villages were retrieved from the census of India reports pertaining to the years 1991, 2001
and 2011 respectively (http://www.censusindia.gov.in/DigitalLibrary/Tables.aspx). In order to carry out
this task, the vector layer of the village boundary extracted from the census report was spatially joined
with the village demography database in Arc GIS 10.3® software. The villages lying within the individual
administrative blocks were reclassed to block level. The extent of the different LULC categories under
each block was extracted through spatial intersection of the block boundary vector layer with the raster
LULC maps pertaining to the different years. The flowchart depicting the methodology employed in the
present study is presented in figure 2.

82
Kathwas A. K., Patel N.
EFFECTS OF LANDUSE AND LANDCOVER DYNAMICS ON THE MIGRATION AND DEMOGRAPHIC PATTERN OF TRIBAL POPULATION USING GEOSPATIAL TECHNIQUES
Theor
etica
l and
Empirical Rese
arc
hes
in U
rban
Mana
gement
Volum
e 1
4
Iss
ue 3
/ A
ugus
t 2019
Theor
etica
l and
Empirica
l Rese
arc
hes
in U
rban
Mana
gement
FIGURE 2 - METHODOLOGY FLOWCHART.

Kathwas A. K., Patel N.
EFFECTS OF LANDUSE AND LANDCOVER DYNAMICS ON THE MIGRATION AND DEMOGRAPHIC PATTERN OF TRIBAL POPULATION USING GEOSPATIAL TECHNIQUES
83
Theor
etica
l and
Empirical Rese
arc
hes
in U
rban
Mana
gement
Volum
e 1
4
Iss
ue 3
/ A
ugus
t 2019
Theor
etica
l and
Empirica
l Rese
arc
hes
in U
rban
Mana
gement
FIGURE 3 - LANDUSE AND LANDCOVER MAP FOR THE YEAR 1987.
FIGURE 4 - LANDUSE AND LANDCOVER MAP FOR THE YEAR 2000.
84
Kathwas A. K., Patel N.
EFFECTS OF LANDUSE AND LANDCOVER DYNAMICS ON THE MIGRATION AND DEMOGRAPHIC PATTERN OF TRIBAL POPULATION USING GEOSPATIAL TECHNIQUES
Theor
etica
l and
Empirical Rese
arc
hes
in U
rban
Mana
gement
Volum
e 1
4
Iss
ue 3
/ A
ugus
t 2019
Theor
etica
l and
Empirica
l Rese
arc
hes
in U
rban
Mana
gement
FIGURE 5 - LANDUSE AND LANDCOVER MAP FOR THE YEAR 2013.
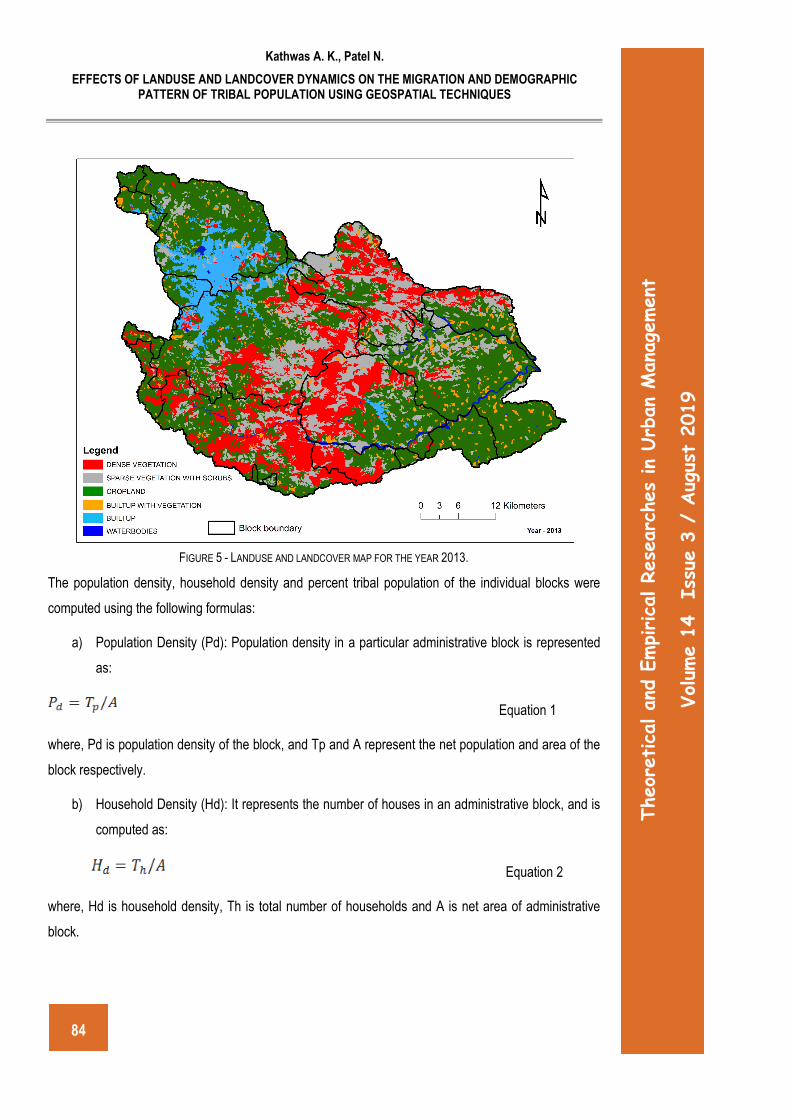
The population density, household density and percent tribal population of the individual blocks were
computed using the following formulas:
a) Population Density (Pd): Population density in a particular administrative block is represented
as:
Equation 1
where, Pd is population density of the block, and Tp and A represent the net population and area of the
block respectively.
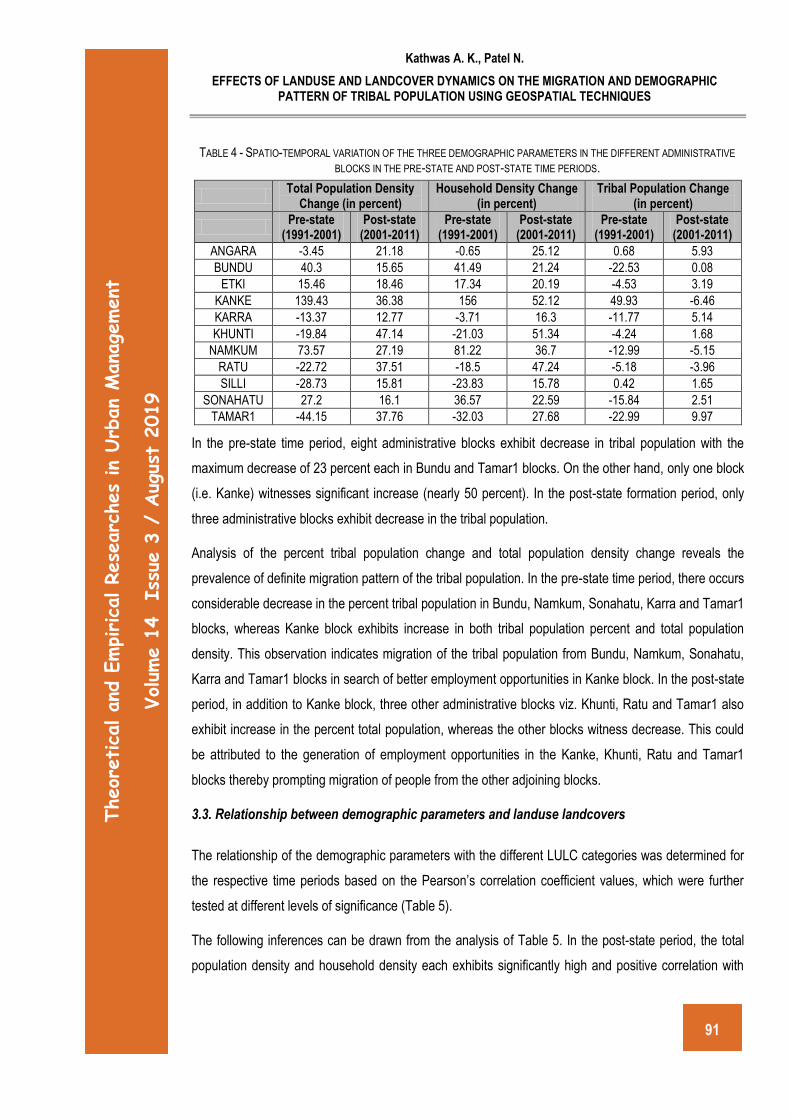
b) Household Density (Hd): It represents the number of houses in an administrative block, and is
computed as:
Equation 2
where, Hd is household density, Th is total number of households and A is net area of administrative
block.

Kathwas A. K., Patel N.
EFFECTS OF LANDUSE AND LANDCOVER DYNAMICS ON THE MIGRATION AND DEMOGRAPHIC PATTERN OF TRIBAL POPULATION USING GEOSPATIAL TECHNIQUES
85
Theor
etica
l and
Empirical Rese
arc
hes
in U
rban
Mana
gement
Volum
e 1
4
Iss
ue 3
/ A
ugus
t 2019
Theor
etica
l and
Empirica
l Rese
arc
hes
in U
rban
Mana
gement
c) Percent Tribal Population (Ptb): It is representative of the proportion of tribal population over
net population in an administrative block and can be determined as:
Equation 3
where, Ptb is percent tribal population, Ttb is net tribal population and Tp is net population in a
block.
LULC dynamics was determined using the following indices.
d) Net Change Ratio (NCR): It represents the proportionate change in a particular LULC category
during a definite time period and is computed as follows.
Equation 4
where Ais is the area of ith LULC type in the starting year and Aie is the area of ith LULC type in the end
year (Dong et al. 2009)
e) Annual Rate of Change (RT): Annual rate of change of any LULC category is calculated using
the following equation (Puyravaud 2003):
Equation 5
where A1 and A2 denote the areas of the LULC category in year t1 (initial time) and year t2 (end time),
respectively.
f) Single Index of Dynamic Extent (K): This index represents the dynamic change in the extent of
a particular LULC category, due to the process of transformation in a landscape. It is quantified
as
Equation 6
where Ua and Ub indicate the extent of a particular LULC type for the starting year and end year of the
period of study (T) respectively, Uc represents the unchanged area of the same LULC type over the
period of study (T) (Dong et al. 2009)

86
Kathwas A. K., Patel N.
EFFECTS OF LANDUSE AND LANDCOVER DYNAMICS ON THE MIGRATION AND DEMOGRAPHIC PATTERN OF TRIBAL POPULATION USING GEOSPATIAL TECHNIQUES
Theor
etica
l and
Empirical Rese
arc
hes
in U
rban
Mana
gement
Volum
e 1
4
Iss
ue 3
/ A
ugus
t 2019
Theor
etica
l and
Empirica
l Rese
arc
hes
in U
rban
Mana
gement
3. RESULTS AND DISCUSSION
3.1. Landuse and landcover dynamics
The LULC change statistics determined for the pre-state and post-state time periods are provided in
Table 1.
TABLE 1 - SPATIO-TEMPORAL DYNAMICS OF LULC CATEGORIES IN RESPECTIVE TIME PERIODS.
The table presents the Net Change Ratio (NCR), Annual Rate of Change (RT) and Single Index of
Dynamic Extent (K) of the different LULC categories corresponding to the two time gradients
respectively. The most significant changes during the pre-state time period comprise increase in the
builtup area and decrease in the extent of builtup with vegetation and dense vegetation categories
(Table 1). The builtup area witnessed expansion by 249 percent, whereas the extent of the builtup with
vegetation category and dense vegetation decreased by 51.3 and 21.7 percent respectively.
The cropland expanded by 8.91 percent. On the other hand, during the post-state time period, except
the cropland, all other LULC categories witnessed expansion.
Cropland area decreased by 10 percent, whereas the builtup and builtup with vegetation categories
expanded by 54 and 45 percent respectively. Dense vegetation expanded by 10 percent, which is found
to be in contrast to its decreasing trend during the pre-state time period.
The net change ratio (NCR) values determined for the different LULC categories are also
complemented by the Annual Rate of Change (RT) and Single Index of Dynamic Extent (K) values.
The salient findings determined from the analysis of the LULC transition matrix pertaining to the pre-
state time period (Table 2) are highlighted in the following.
Landuse/ landcover categories
Area (sq km) Area (percent) NCR (percent) RT (percent) K (percent)
1987 2000 2013 1987 2000 2013 1987-2000
2000-2013
1987-2000
2000-2013
1987-2000
2000-2013
Dense Vegetation
546.68
428.07 470.98 24.53 19.21 21.13 -21.7 10.02 -1.88 0.73 -1.67 0.77
Sparse Vegetation with Scrubs
408.84
412.28 421.45 18.34 18.5 18.91 0.84 2.23 0.06 0.17 0.06 0.17
Cropland 1113.
82 1213.01 1085.93 49.97 54.42 48.72 8.91 -10.48 0.66 -0.85 0.69 -0.81
Builtup with Vegetation
102.1 49.68 72.28 4.58 2.23 3.24 -51.34 45.5 -5.54 2.88 -3.95 3.5
Builtup 27.95 97.49 149.88 1.25 4.37 6.72 248.82 53.75 9.61 3.31 19.14 4.13

Kathwas A. K., Patel N.
EFFECTS OF LANDUSE AND LANDCOVER DYNAMICS ON THE MIGRATION AND DEMOGRAPHIC PATTERN OF TRIBAL POPULATION USING GEOSPATIAL TECHNIQUES
87
Theor
etica
l and
Empirical Rese
arc
hes
in U
rban
Mana
gement
Volum
e 1
4
Iss
ue 3
/ A
ugus
t 2019
Theor
etica
l and
Empirica
l Rese
arc
hes
in U
rban
Mana
gement
TABLE 2 - TRANSITION MATRIX OF LULC CATEGORIES FOR THE PRE-STATE TIME PERIOD (1987-2000).
2000
Dense Vegetation
Sparse Vegetation with Scrubs
Cropland Builtup With Vegetation
Builtup
1987
Dense Vegetation
374.4 (68.48) 117.9 (21.57) 42.4 (7.45) 5.2 (0.95) 6.8 (1.24)
Sparse Vegetation with
Scrubs 40.5 (9.92) 220.8 (54.01)
118.0 (28.87)
18.5 (4.51) 10.2 (2.49)
Cropland 7.3 (0.65) 59.2 (5.31) 1022.5 (91.74)
10.4 (0.93) 13.7 (1.23)
Builtup with Vegetation
5.4 (5.28) 14.1 (13.76) 27.3 (26.74) 14.6 (14.28) 40.3 (39.48)
Builtup 0.1 (0.50) 0.7 (2.62) 0.6 (2.06) 0.0 (0.01) 26.5 (94.95) Figures outside brackets show the actual change in sq. km and shown inside brackets indicate the percent of transition.
Diagonal elements represent No Change and off-diagonal elements show the change from 1987 to 2000
The builtup category remained almost intact with 95 percent of its area remaining unchanged during
1987-2000. However, it gained considerable amount of area due to the transformation of the other
LULC categories such as cropland (13.7 sq. km.), dense vegetation (6.2 sq. km.) and sparse vegetation
with scrubs (10.2 sq. km.) respectively. In addition, a large extent of the builtup with vegetation category
(40.3 sq. km.) was also transformed to the builtup category.
On the other hand, among the different LULC categories, the largest amount of transition (86%) was
exhibited by the builtup with vegetation category, which comprise 39.48 percent transition to builtup, 27
percent transition to cropland, 14 percent transition to sparse vegetation with scrubs and relatively small
proportion of transition (5 percent) to dense vegetation respectively.
Builtup with vegetation category gained substantial amount of area (34.1 sq. km.) at the cost of the
pervious LULC categories such as cropland (10.4 sq. km.), dense vegetation (5.2 sq. km.) and sparse
vegetation with scrubs (18.5 sq. km.) respectively. These observations indicate the prevalence of
extensive urbanization through the conversion of the pervious LULC categories and also, builtup with
vegetation category.
Cropland witnessed considerable amount of expansion due to the conversion of the sparse vegetation
with scrub category (118 sq. km.) and small proportion of the dense vegetation category (42.4 sq. km.).
The transformation of the cropland to the other LULC categories and vice versa resulted in its net gain
of nearly 100 sq. km. area.
There occurred considerable extent of degradation of dense vegetation (118 sq. km) to sparse
vegetation with scrubs category. However, it also gained 41 sq. km. area due to the regeneration of the
sparse vegetation with scrub category.

88
Kathwas A. K., Patel N.
EFFECTS OF LANDUSE AND LANDCOVER DYNAMICS ON THE MIGRATION AND DEMOGRAPHIC PATTERN OF TRIBAL POPULATION USING GEOSPATIAL TECHNIQUES
Theor
etica
l and
Empirical Rese
arc
hes
in U
rban
Mana
gement
Volum
e 1
4
Iss
ue 3
/ A
ugus
t 2019
Theor
etica
l and
Empirica
l Rese
arc
hes
in U
rban
Mana
gement
As a result of the different types of LULC transitions, there occurred considerable gain in the builtup and
cropland areas, whereas dense vegetation witnessed severe decline during the pre-state period. The
expansion in the builtup area is indicative of the process of economic reforms in the study area,
whereas the conversion of the vegetation categories to cropland represents the prevalence of the
dominance of the agrarian activities.
These inferences are also corroborated during the field observations.
The nature and magnitude of the LULC transitions during the post-state time period (2000-2013) (Table
3) are found to be different from the pre-state time period.
TABLE 3 - TRANSITION MATRIX OF LULC CATEGORIES FOR THE POST-STATE TIME PERIOD (2000-2013).
Figures outside brackets show the actual change in sq. km and shown inside brackets indicate the percent of transition. Diagonal elements represent No Change and off-diagonal elements show the change from 2000 to 2013
Both the builtup and builtup with vegetation categories remained intact during 2000-2013, however,
these categories gained respectively 52.4 sq. km. and 23.4 sq. km area from the conversion of
cropland. Remarkably, the vegetation categories, i.e. dense vegetation and sparse vegetation with
scrubs remained unaffected by the anthropogenic forces either for urbanization or agricultural
intensification. The mutual transition between the dense vegetation and sparse vegetation with scrubs
categories resulted in net gain of 43 sq. km. area of the former, which clearly indicates the prevalence of
the process of regeneration of natural vegetation in the study area during the post-state period.
Some studies have also reported similar observations during the last decade ((State of Forest Report
2015; State of Forest Report 2001), http://fsi.nic.in/details.php?pgID=sb_62). The analysis of the LULC
transitions during the post-state time period reveals two prominent findings: first, none of the LULC
categories was converted for agricultural activities, whereas cropland witnessed transformation to the
other LULC categories, which resulted in the net loss of the cropland area. Second, the expansion of
2000
2013
Dense
Vegetation
Sparse Vegetation
with Scrubs Cropland
Builtup with Vegetation
Builtup
Dense Vegetation
409.3 (95.60) 18.8 (4.39) 0.0 (0.0) 0.0 (0.0) 0.0 (0.0)
Sparse Vegetation
with Scrubs 61.7 (14.94) 351.4 (85.06) 0.0 (0.0) 0.0 (0.0) 0.0 (0.0)
Cropland 0.0 (0.0) 51.3 (4.23) 1086.6 (89.53)
23.4 (1.93) 52.4 (4.32)
Builtup with Vegetation
0.0 (0.0) 0.0 (0.0) 0.0 (0.0) 48.9 (100.0) 0.0 (0.0)
Builtup 0.0 (0.0) 0.0 (0.0) 0.0 (0.0) 0.0 (0.0) 97.5
(100.0)

Kathwas A. K., Patel N.
EFFECTS OF LANDUSE AND LANDCOVER DYNAMICS ON THE MIGRATION AND DEMOGRAPHIC PATTERN OF TRIBAL POPULATION USING GEOSPATIAL TECHNIQUES
89
Theor
etica
l and
Empirical Rese
arc
hes
in U
rban
Mana
gement
Volum
e 1
4
Iss
ue 3
/ A
ugus
t 2019
Theor
etica
l and
Empirica
l Rese
arc
hes
in U
rban
Mana
gement
the builtup categories occurred through the consumption of only single category, i.e. cropland. These
observations ascertain the co-existence of two salient activities in the post-state time period: first,
recession from the agrarian activities and second, dominance of the process of urbanization, thereby
facilitating better opportunities for employment and livelihood of the population subsequent to the
formation of the new state of Jharkhand. These observations are also supported by the considerable
increase in the per capita income from INR 12,279 in 2000-2001 to more than INR 25,000 in 2009
(State income book, Directorate of Economics and Statistics
(http://desjharkhand.nic.in/publications.html)).
Comparative analysis of the LULC dynamics between the pre-state and post-state time period reveals
that both urbanization and agricultural intensification were concurrently dominant in the former time
period, whereas the post-state time period witnessed extensive urbanization at the cost of the cropland.
In the pre-state time period, expansion of the builtup area occurred through the consumption of both
cropland and vegetation that resulted in the degradation of dense vegetation. On the other hand, the
post-state time period witnessed extensive regeneration of the sparse vegetation with scrubs, which led
to considerable expansion of the dense vegetation category.
3.2. Demography dynamics
Several researchers have attributed landcover change to population pressure (Kroll and Haase 2010;
Pozzi and Small 2005; Rosero-Bixby and Palloni 1998; Showqi et al. 2014; Tian et al. 2005). Some
researchers suggest that rise in population count has positive effect on the availability of resource;
nonetheless, others argue that population pressure leads to land degradation (Grepperud 1996).
In the present study, three demographic parameters have been considered to determine the population
dynamics in the study area viz. Population Density, Household Density and Percent Tribal Population.
The spatio-temporal variation of these parameters is depicted in Figure 6.
The average population density in the study area is found to be 244 persons/km2 in 1991, 257
persons/km2 in 2001 and 342 persons/km2 in the year 2011, which indicates higher annual rate of
increase (8.5) during the post-state period as compared to the pre-state period (1.3).
Examination of Table 4 reveals that in the pre-state period, five administrative blocks (i.e. Bundu, Etki,
Kanke, Namkum and Sonahatu) show increase in both the total population density and household
density, whereas these parameters exhibit decrease in the remaining six administrative blocks in the
same time period. This observation could be attributed to the migration of the habitants from these six
administrative blocks to the former five blocks. The migration is caused by the availability of adequate

90
Kathwas A. K., Patel N.
EFFECTS OF LANDUSE AND LANDCOVER DYNAMICS ON THE MIGRATION AND DEMOGRAPHIC PATTERN OF TRIBAL POPULATION USING GEOSPATIAL TECHNIQUES
Theor
etica
l and
Empirical Rese
arc
hes
in U
rban
Mana
gement
Volum
e 1
4
Iss
ue 3
/ A
ugus
t 2019
Theor
etica
l and
Empirica
l Rese
arc
hes
in U
rban
Mana
gement
employment opportunity generated through the establishment of small-scale industries and commercial
and residential complexes. In the post-state period, increase in the population density led to
simultaneous increase in the household density in the respective administrative blocks of the study
area.
FIGURE 6 - SPATIO-TEMPORAL VARIATION OF TOTAL POPULATION, PERCENT TRIBAL POPULATION AND HOUSEHOLD
DENSITY IN DIFFERENT BLOCKS IN THE YEARS 1991, 2001 AND 2011.
Kathwas A. K., Patel N.
EFFECTS OF LANDUSE AND LANDCOVER DYNAMICS ON THE MIGRATION AND DEMOGRAPHIC PATTERN OF TRIBAL POPULATION USING GEOSPATIAL TECHNIQUES
91
Theor
etica
l and
Empirical Rese
arc
hes
in U
rban
Mana
gement
Volum
e 1
4
Iss
ue 3
/ A
ugus
t 2019
Theor
etica
l and
Empirica
l Rese
arc
hes
in U
rban
Mana
gement
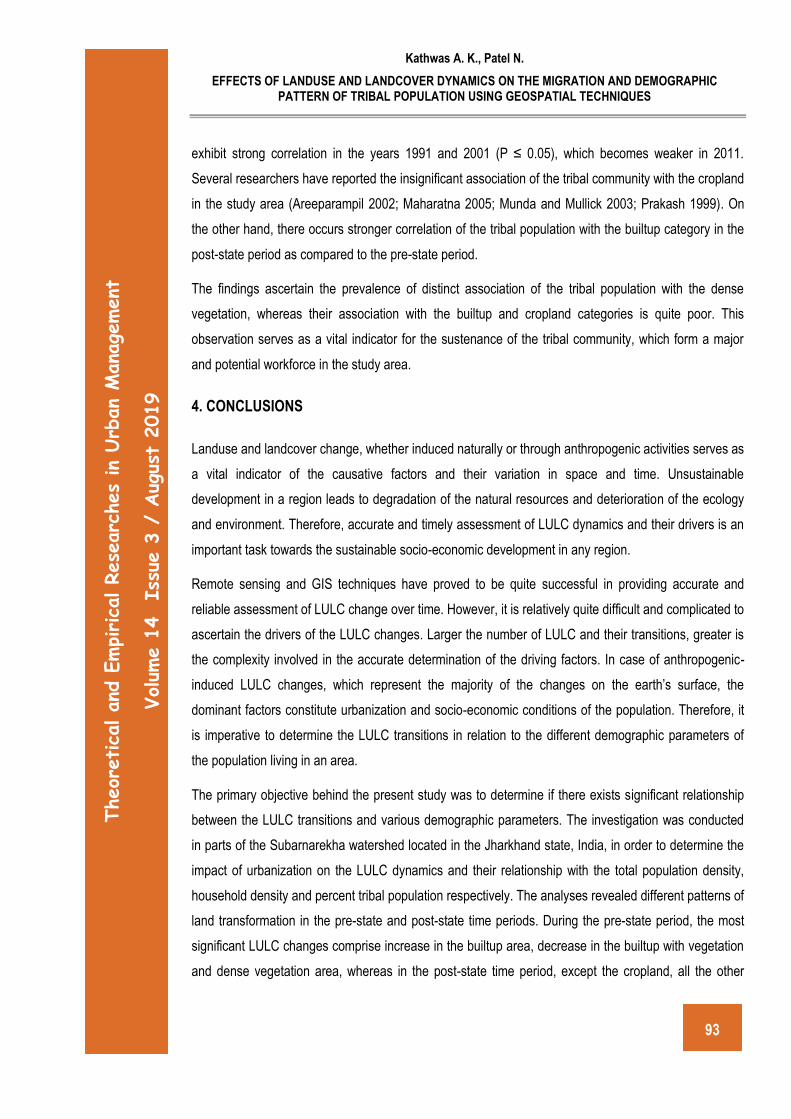
TABLE 4 - SPATIO-TEMPORAL VARIATION OF THE THREE DEMOGRAPHIC PARAMETERS IN THE DIFFERENT ADMINISTRATIVE
BLOCKS IN THE PRE-STATE AND POST-STATE TIME PERIODS.
In the pre-state time period, eight administrative blocks exhibit decrease in tribal population with the
maximum decrease of 23 percent each in Bundu and Tamar1 blocks. On the other hand, only one block
(i.e. Kanke) witnesses significant increase (nearly 50 percent). In the post-state formation period, only
three administrative blocks exhibit decrease in the tribal population.
Analysis of the percent tribal population change and total population density change reveals the
prevalence of definite migration pattern of the tribal population. In the pre-state time period, there occurs
considerable decrease in the percent tribal population in Bundu, Namkum, Sonahatu, Karra and Tamar1
blocks, whereas Kanke block exhibits increase in both tribal population percent and total population
density. This observation indicates migration of the tribal population from Bundu, Namkum, Sonahatu,
Karra and Tamar1 blocks in search of better employment opportunities in Kanke block. In the post-state
period, in addition to Kanke block, three other administrative blocks viz. Khunti, Ratu and Tamar1 also
exhibit increase in the percent total population, whereas the other blocks witness decrease. This could
be attributed to the generation of employment opportunities in the Kanke, Khunti, Ratu and Tamar1
blocks thereby prompting migration of people from the other adjoining blocks.
3.3. Relationship between demographic parameters and landuse landcovers
The relationship of the demographic parameters with the different LULC categories was determined for
the respective time periods based on the Pearson’s correlation coefficient values, which were further
tested at different levels of significance (Table 5).
The following inferences can be drawn from the analysis of Table 5. In the post-state period, the total
population density and household density each exhibits significantly high and positive correlation with
Total Population Density
Change (in percent) Household Density Change
(in percent) Tribal Population Change
(in percent)
Pre-state
(1991-2001) Post-state
(2001-2011) Pre-state
(1991-2001) Post-state
(2001-2011) Pre-state
(1991-2001) Post-state
(2001-2011)
ANGARA -3.45 21.18 -0.65 25.12 0.68 5.93
BUNDU 40.3 15.65 41.49 21.24 -22.53 0.08
ETKI 15.46 18.46 17.34 20.19 -4.53 3.19
KANKE 139.43 36.38 156 52.12 49.93 -6.46
KARRA -13.37 12.77 -3.71 16.3 -11.77 5.14
KHUNTI -19.84 47.14 -21.03 51.34 -4.24 1.68
NAMKUM 73.57 27.19 81.22 36.7 -12.99 -5.15
RATU -22.72 37.51 -18.5 47.24 -5.18 -3.96
SILLI -28.73 15.81 -23.83 15.78 0.42 1.65
SONAHATU 27.2 16.1 36.57 22.59 -15.84 2.51
TAMAR1 -44.15 37.76 -32.03 27.68 -22.99 9.97

92
Kathwas A. K., Patel N.
EFFECTS OF LANDUSE AND LANDCOVER DYNAMICS ON THE MIGRATION AND DEMOGRAPHIC PATTERN OF TRIBAL POPULATION USING GEOSPATIAL TECHNIQUES
Theor
etica
l and
Empirical Rese
arc
hes
in U
rban
Mana
gement
Volum
e 1
4
Iss
ue 3
/ A
ugus
t 2019
Theor
etica
l and
Empirica
l Rese
arc
hes
in U
rban
Mana
gement
the builtup category at significance levels P<0.05, P<0.01, and P<0.001, whereas in the pre-state
period, the correlation coefficient values are found to be smaller and non-significant. The correlation
coefficient values show considerable increase from the year 2001 to 2011, which signifies the
prevalence of increasing urbanization in the post-state period. On the other hand, in both the pre-state
and post-state time periods, there occurs poor and non-significant correlation of the total population
density and household density with the remaining LULC categories. Further, the prevalence of negative
correlation of the total population density and household density with the two vegetation categories i.e.
dense vegetation and sparse vegetation with scrubs indicates the process of urbanization through the
clearance of vegetation on the land. The cropland exhibits positive correlation with the total population
density and household density in the years 1991 and 2001, whereas in the post-state period, the
correlation is found to be negative. This observation indicates the prevalence of contrasting scenario in
the pre- and post-state periods. The formation of the state in the year 2000 led to drastic increase in
population and demand for space for construction of residential, educational and commercial buildings,
which were developed at the cost of the available cropland. As a result, the cropland exhibits negative
correlation with the total population density and household density in the post-state period.
TABLE 5 - PEARSON’S COEFFICIENTS OF CORRELATION BETWEEN DEMOGRAPHIC PARAMETERS AND LANDUSE AND
LANDCOVER CATEGORIES.
Demographic Parameters
Total Population Density Household Density Percent Tribal Population
1991 2001 2011 1991 2001 2011 1991 2001 2011
Dense vegetation -0.50 ns -0.61* -0.42 ns -0.48 ns -0.73* -0.42 ns 0.80** 0.87*** 0.90***
Sparse vegetation with scrubs
-0.39 ns -0.21 ns -0.36 ns -0.28 ns -0.20 ns -0.35 ns 0.21 ns 0.20 ns 0.20 ns
Cropland 0.58 ns 0.51ns -0.25 ns 0.51 ns 0.58 ns -0.25 ns -0.67* -0.69* -0.40 ns
Builtup with vegetation
-0.07 ns 0.16 ns -0.26 ns -0.17 ns 0.30 ns -0.26 ns -0.67* -0.63* -0.35 ns
Builtup 0.50 ns 0.78** 0.97*** 0.28 ns 0.66* 0.97*** -0.34 ns -0.05 ns -0.53 ns
In general, the relationship of the different LULC categories with the percent tribal population is found to
be in contrast to their relationship with the other two demographic parameters, viz. total population
density and household density. For example, there occurs significantly positive correlation of the
percent tribal population with the dense vegetation both in the pre- and post-state time periods (P<0.01
in 1991 and P<0.001 in 2001 and 2011). The association of the tribal population with the dense forest
has also been reported by several researchers (Firdos 2005; Maharatna and Chikte 2004; Prakash
2007; Sharan 2005). The percent tribal population also exhibits positive correlation with the sparse
vegetation with scrubs category, although the correlation is relatively small and non-significant. In
contrast, the percent tribal population portrays negative correlation with the remaining three LULC
categories, i.e. cropland, builtup with vegetation and builtup. Cropland and builtup with vegetation
Kathwas A. K., Patel N.
EFFECTS OF LANDUSE AND LANDCOVER DYNAMICS ON THE MIGRATION AND DEMOGRAPHIC PATTERN OF TRIBAL POPULATION USING GEOSPATIAL TECHNIQUES
93
Theor
etica
l and
Empirical Rese
arc
hes
in U
rban
Mana
gement
Volum
e 1
4
Iss
ue 3
/ A
ugus
t 2019
Theor
etica
l and
Empirica
l Rese
arc
hes
in U
rban
Mana
gement
exhibit strong correlation in the years 1991 and 2001 (P ≤ 0.05), which becomes weaker in 2011.
Several researchers have reported the insignificant association of the tribal community with the cropland
in the study area (Areeparampil 2002; Maharatna 2005; Munda and Mullick 2003; Prakash 1999). On
the other hand, there occurs stronger correlation of the tribal population with the builtup category in the
post-state period as compared to the pre-state period.
The findings ascertain the prevalence of distinct association of the tribal population with the dense
vegetation, whereas their association with the builtup and cropland categories is quite poor. This
observation serves as a vital indicator for the sustenance of the tribal community, which form a major
and potential workforce in the study area.
4. CONCLUSIONS
Landuse and landcover change, whether induced naturally or through anthropogenic activities serves as
a vital indicator of the causative factors and their variation in space and time. Unsustainable
development in a region leads to degradation of the natural resources and deterioration of the ecology
and environment. Therefore, accurate and timely assessment of LULC dynamics and their drivers is an
important task towards the sustainable socio-economic development in any region.
Remote sensing and GIS techniques have proved to be quite successful in providing accurate and
reliable assessment of LULC change over time. However, it is relatively quite difficult and complicated to
ascertain the drivers of the LULC changes. Larger the number of LULC and their transitions, greater is
the complexity involved in the accurate determination of the driving factors. In case of anthropogenic-
induced LULC changes, which represent the majority of the changes on the earth’s surface, the
dominant factors constitute urbanization and socio-economic conditions of the population. Therefore, it
is imperative to determine the LULC transitions in relation to the different demographic parameters of
the population living in an area.
The primary objective behind the present study was to determine if there exists significant relationship
between the LULC transitions and various demographic parameters. The investigation was conducted
in parts of the Subarnarekha watershed located in the Jharkhand state, India, in order to determine the
impact of urbanization on the LULC dynamics and their relationship with the total population density,
household density and percent tribal population respectively. The analyses revealed different patterns of
land transformation in the pre-state and post-state time periods. During the pre-state period, the most
significant LULC changes comprise increase in the builtup area, decrease in the builtup with vegetation
and dense vegetation area, whereas in the post-state time period, except the cropland, all the other

94
Kathwas A. K., Patel N.
EFFECTS OF LANDUSE AND LANDCOVER DYNAMICS ON THE MIGRATION AND DEMOGRAPHIC PATTERN OF TRIBAL POPULATION USING GEOSPATIAL TECHNIQUES
Theor
etica
l and
Empirical Rese
arc
hes
in U
rban
Mana
gement
Volum
e 1
4
Iss
ue 3
/ A
ugus
t 2019
Theor
etica
l and
Empirica
l Rese
arc
hes
in U
rban
Mana
gement
LULC categories witnessed expansion. The investigation also revealed significant variation in the
migration pattern of the tribal population between the pre- and post-state time periods. The generation
of employment opportunities in the Kanke, Khunti, Ratu and Tamar1 blocks subsequent to the formation
of the capital and state prompted the migration of the tribal population from the neighboring rural blocks,
resulting in the increase in the total population density in these blocks.
Further, there also exists distinct pattern of association of the various demographic parameters with the
different LULC categories. The percent tribal population exhibits highly significant positive correlation
with the dense vegetation in contrast to its negative correlation with the cropland and builtup with
vegetation each. This observation ascertains the natural association of the tribal population with the
dense vegetation in spite of their migration to the urban centres. On the other hand, the total population
density and household density each exhibits strong correlation with the builtup category. The various
findings ascertain the impact of urbanization on the LULC dynamics in relation to different demographic
parameters and therefore, can be used for sustainable conservation of the various land resources in
order to augment the socio-economic status of the tribal community in the study area and similar
geographical landscapes in the world.
Acknowledgements
The paper is developed based on original work carried out by the authors; has not been published
before; is not being considered for publication elsewhere at the same time; and all research done by
others is fully acknowledged.
REFERENCES
Areeparampil, M. (2002). Struggle for Swaraj: A History of Adivasi Movements in Jharkhand from the Earliest Times to the Present Day: Tribal Research and Training Centre.
Bandopadhyay, M. (1999). Demographic consequences of non tribals incursion in Chhotanagpur region during colonial period (1850-1950). Social Change, 29, 10-46, doi:10.1177/004908579902900403.
Banzhaf, E., Reyes-Paecke, S., Müller, A., & Kindler, A. (2013). Do demographic and land-use changes contrast urban and suburban dynamics? A sophisticated reflection on Santiago de Chile. Habitat International, 39, 179-191, doi:https://doi.org/10.1016/j.habitatint.2012.11.005.
Bhagawat, R. (2012). Spatiotemporal dynamics of land use pattern response to urbanization in Biratnagar Sub- Metropolitan City, Nepal. Engineering Science and Technology: An International Journal, 2, 2250-3498.
Bilsborrow, R. E. (1992). Population Growth, Internal Migration, and Environmental Degradation in Rural Areas of Developing Countries. European Journal of Population / Revue Europe, 8(2), 125-148.

Kathwas A. K., Patel N.
EFFECTS OF LANDUSE AND LANDCOVER DYNAMICS ON THE MIGRATION AND DEMOGRAPHIC PATTERN OF TRIBAL POPULATION USING GEOSPATIAL TECHNIQUES
95
Theor
etica
l and
Empirical Rese
arc
hes
in U
rban
Mana
gement
Volum
e 1
4
Iss
ue 3
/ A
ugus
t 2019
Theor
etica
l and
Empirica
l Rese
arc
hes
in U
rban
Mana
gement
Chen, C., Gao, J., & Chen, J. (2017). Institutional changes, land use dynamics, and the transition of
rural settlements in suburban China: A case study of Huishan District in Wuxi city. Habitat International, 70, 24-33, doi:https://doi.org/10.1016/j.habitatint.2017.09.011.
Cui, X., & Wang, X. (2015). Urban land use change and its effect on social metabolism: An empirical study in Shanghai. Habitat International, 49, 251-259, doi:https://doi.org/10.1016/j.habitatint.2015.05.018.
Deng, Y., & Srinivasan, S. (2016). Urban land use change and regional access: A case study in Beijing, China. Habitat International, 51, 103-113, doi:https://doi.org/10.1016/j.habitatint.2015.09.007.
Dong, L., Wang, W., Ma, M., Kong, J., & Veroustraete, F. (2009). The change of land cover and land use and its impact factors in upriver key regions of the Yellow River. International Journal of Remote Sensing, 30(5), 1251-1265, doi:10.1080/01431160802468248.
El Garouani, A., Mulla, D. J., El Garouani, S., & Knight, J. (2017). Analysis of urban growth and sprawl from remote sensing data: Case of Fez, Morocco. International Journal of Sustainable Built Environment, 6(1), 160-169, doi: https://doi.org/10.1016/j.ijsbe.2017.02.003.
Firdos, S. (2005). Forest degradation, changing workforce structures and population redistribution: The case of birhors in Jharkhand. Economic and Political Weekly, 40, 773-778.
Grepperud, S. (1996). Population pressure and land degradation: the case of Ethiopia. Journal of Environmental Economics and Management, 30(1), 18-33, doi:10.1006/jeem.1996.0002.
Hussain, K., Haq, F., & Rahman, F. (2018). Shrinking greenery: Land use and land cover changes in Kurram Agency, Kohi Safid Mountains of north-western Pakistan. Journal of Mountain Science, 15(2), 296-306, doi: 10.1007/s11629-017-4451-7.
http://www.censusindia.gov.in/DigitalLibrary/Tables.aspx
Kroll, F., & Haase, D. (2010). Does demographic change affect land use patterns? Land Use Policy, 27(3), 726-737, doi:http://dx.doi.org/10.1016/j.landusepol.2009.10.001.
Lambin, E. F., Geist, H. J., & Lepers, E. (2003). Dynamics of land-use and land-cover change in tropical regions. Annual Review of Environment and Resources, 28, 205-241, doi:10.1146/annurev.energy.28.050302.105459.
Lambin, E. F., Turner, B. L., Geist, H. J., Agbola, S. B., Angelsen, A., Bruce, J. W., et al. (2001). The causes of land-use and land-cover change: moving beyond the myths. Global Environmental Change-Human and Policy Dimensions, 11(4), 261-269, doi:Doi 10.1016/S0959-3780(01)00007-3.
Liu, Y., Luo, T., Liu, Z., Kong, X., Li, J., & Tan, R. (2015). A comparative analysis of urban and rural construction land use change and driving forces: Implications for urban–rural coordination development in Wuhan, Central China. Habitat International, 47, 113-125, doi:https://doi.org/10.1016/j.habitatint.2015.01.012.
Maharatna, A. (2005). Demographic Perspectives on India's Tribes: New York.
Maharatna, A., & Chikte, R. (2004). Demography of Tribal Population in Jharkhand 1951-1991. Economic and Political Weekly, 5053-5062.
Munda, R. D., & Mullick, S. B. (2003). The Jharkhand Movement. Indigenous Peoples' Struggle for Autonomy in India: Birsa & IWGIA.

96
Kathwas A. K., Patel N.
EFFECTS OF LANDUSE AND LANDCOVER DYNAMICS ON THE MIGRATION AND DEMOGRAPHIC PATTERN OF TRIBAL POPULATION USING GEOSPATIAL TECHNIQUES
Theor
etica
l and
Empirical Rese
arc
hes
in U
rban
Mana
gement
Volum
e 1
4
Iss
ue 3
/ A
ugus
t 2019
Theor
etica
l and
Empirica
l Rese
arc
hes
in U
rban
Mana
gement
Ningal, T., Hartemink, A. E., & Bregt, A. K. (2008). Land use change and population growth in the Morobe Province of Papua New Guinea between 1975 and 2000. Journal of Environmental Management, 87(1), 117-124, doi:10.1016/j.jenvman.2007.01.006.
Patra, S., Sahoo, S., Mishra, P., & Mahapatra, S. C. (2018). Impacts of urbanization on land use /cover changes and its probable implications on local climate and groundwater level. Journal of Urban Management, 7(2), 70-84, doi: https://doi.org/10.1016/j.jum.2018.04.006.
Pozzi, F., & Small, C. (2005). Analysis of urban land cover and population density in the United States. Photogrammetric Engineering and Remote Sensing, 71(6), 719-726.
Prakash, A. (1999). Contested Discourses: Politics of Ethnic Identity and Autonomy in the Jharkhand Region of India. Alternatives: Global, Local, Political, 24(4), 461-496.
Prakash, A. (2007). Case Study: Tribal Rights in Jharkhand.
Puyravaud, J. P. (2003). Standardizing the calculation of the annual rate of deforestation. Forest Ecology and Management, 177(1-3), 593-596, doi:Doi 10.1016/S0378-1127(02)00335-3.
Rahdary, V., Soffianian, A., Najfabdai, S. M., Khajeddin, S. J., & Pahlavanravi (2008). Land use and land cover change detection of Mouteh wildlife refuge using remotely sensed data and geographic information system. World Applied Sciences Journal, 3(1), 113-118.
Ramankutty, N., & Foley, J. A. (1999). Estimating historical changes in global land cover: Croplands from 1700 to 1992. Global biogeochemical cycles, 13(4), 997-1027, doi:Doi 10.1029/1999gb900046.
Reenberg, A., & Lund, C. (1998). Land use and land right dynamics - Determinants for resource management options in Eastern Burkina Faso. Human Ecology, 26(4), 599-620, doi:Doi 10.1023/A:1018749409139.
Rosero-Bixby, L., & Palloni, A. (1998). Population and Deforestation in Costa Rica. Population and Environment, 20(2), 149-185, doi:10.1023/a:1023319327838.
Saravanan, Dharanirajan.K, Yuvaraj.E, & Karpoorasundarapandian.N (2013). Quantifying the dynamic changes of landuse and landcover in Neil Island, Andaman and Nicobar, India. International Journal of Geomatics And Geosciences, Volume 4, No 2, 2013(2), 427 - 434.
Sharan, R. (2005). Alienation and Restoration of Tribal Land in Jharkhand: Current Issues and Possible Strategies. Economic and Political Weekly, 40(41), 4443-4446.
Shiferaw, A., & Singh, K. L. (2011). Evaluating the land use and land cover dynamics in Borena Woreda of south Wollo Highlands, Ethiopia. Journal of Sustainable Development in Africa, 13, 87-107.
Showqi, I., Rashid, I., & Romshoo, S. A. (2014). Land use land cover dynamics as a function of changing demography and hydrology. GeoJournal, 79(3), 297-307, doi:10.1007/s10708-013-9494-x.
Singh, S. K. (2005). Inside Jharkhand. Ranchi: Crown Publications.
Tian, Y., Yue, T., Zhu, L., & Clinton, N. (2005). Modeling population density using land cover data. Ecological Modelling, 189(1), 72-88, doi:http://dx.doi.org/10.1016/j.ecolmodel.2005.03.012.
Toh, F. A., Angwafo, T. E., Ndam, L. M., & Antoine, M. Z. (2018). The Socio-Economic Impact of Land Use and Land Cover Change on the Inhabitants of Mount Bambouto Caldera of the Western Highlands of Cameroon. Advances in Remote Sensing, 7(1), 25-45, doi:10.4236/ars.2018.71003.
Kathwas A. K., Patel N.
EFFECTS OF LANDUSE AND LANDCOVER DYNAMICS ON THE MIGRATION AND DEMOGRAPHIC PATTERN OF TRIBAL POPULATION USING GEOSPATIAL TECHNIQUES
97
Theor
etica
l and
Empirical Rese
arc
hes
in U
rban
Mana
gement
Volum
e 1
4
Iss
ue 3
/ A
ugus
t 2019
Theor
etica
l and
Empirica
l Rese
arc
hes
in U
rban
Mana
gement
WoldeYohannes, A., Cotter, M., Kelboro, G., & Dessalegn, W. (2018). Land Use and Land Cover
Changes and Their Effects on the Landscape of Abaya-Chamo Basin, Southern Ethiopia. Land, 7(1), 2, doi:https://doi.org/10.3390/land7010002
Zanganeh Shahraki, S., Sauri, D., Serra, P., Modugno, S., Seifolddini, F., & Pourahmad, A. (2011). Urban sprawl pattern and land-use change detection in Yazd, Iran. Habitat International, 35(4), 521-528, doi:https://doi.org/10.1016/j.habitatint.2011.02.004.