EFFECTS OF EXPLOITATION, ENVIRONMENTAL CHANGES… · EFFECTS OF EXPLOITATION, ENVIRONMENTAL...
46
EFFECTS OF EXPLOITATION, ENVIRONMENTAL CHANGES, AND NEW SPECIES ON THE FISH HABITATS AND RESOURCES OF LAKE ERIE WILBUR L. HARTMAN U.S. Bureau of Sport Fisheries and Wildlife Biological Station Sandusky, Ohio 44870 TECHNICAL REPORT NO. 22 GREAT LAKES FISHERY COMMISSION 1451 Green Road P.O. Box 640 Ann Arbor, Michigan 48 107 April 1973
Transcript of EFFECTS OF EXPLOITATION, ENVIRONMENTAL CHANGES… · EFFECTS OF EXPLOITATION, ENVIRONMENTAL...
EFFECTS OF EXPLOITATION, ENVIRONMENTALCHANGES, AND NEW SPECIES ON THE FISHHABITATS AND RESOURCES OF LAKE ERIE
WILBUR L. HARTMAN
U.S. Bureau of Sport Fisheries and WildlifeBiological Station
Sandusky, Ohio 44870
TECHNICAL REPORT NO. 22
GREAT LAKES FISHERY COMMISSION1451 Green Road
P.O. Box 640Ann Arbor, Michigan 48 107
April 1973
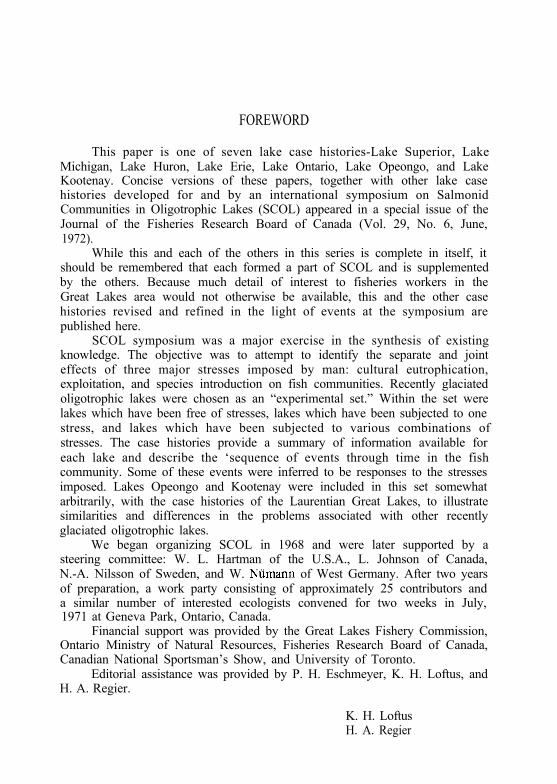
FOREWORD
This paper is one of seven lake case histories-Lake Superior, LakeMichigan, Lake Huron, Lake Erie, Lake Ontario, Lake Opeongo, and LakeKootenay. Concise versions of these papers, together with other lake casehistories developed for and by an international symposium on SalmonidCommunities in Oligotrophic Lakes (SCOL) appeared in a special issue of theJournal of the Fisheries Research Board of Canada (Vol. 29, No. 6, June,1972).
While this and each of the others in this series is complete in itself, itshould be remembered that each formed a part of SCOL and is supplementedby the others. Because much detail of interest to fisheries workers in theGreat Lakes area would not otherwise be available, this and the other casehistories revised and refined in the light of events at the symposium arepublished here.
SCOL symposium was a major exercise in the synthesis of existingknowledge. The objective was to attempt to identify the separate and jointeffects of three major stresses imposed by man: cultural eutrophication,exploitation, and species introduction on fish communities. Recently glaciatedoligotrophic lakes were chosen as an “experimental set.” Within the set werelakes which have been free of stresses, lakes which have been subjected to onestress, and lakes which have been subjected to various combinations ofstresses. The case histories provide a summary of information available foreach lake and describe the ‘sequence of events through time in the fishcommunity. Some of these events were inferred to be responses to the stressesimposed. Lakes Opeongo and Kootenay were included in this set somewhatarbitrarily, with the case histories of the Laurentian Great Lakes, to illustratesimilarities and differences in the problems associated with other recentlyglaciated oligotrophic lakes.
We began organizing SCOL in 1968 and were later supported by asteering committee: W. L. Hartman of the U.S.A., L. Johnson of Canada,N.-A. Nilsson of Sweden, and W. Nitmann of West Germany. After two yearsof preparation, a work party consisting of approximately 25 contributors anda similar number of interested ecologists convened for two weeks in July,1971 at Geneva Park, Ontario, Canada.
Financial support was provided by the Great Lakes Fishery Commission,Ontario Ministry of Natural Resources, Fisheries Research Board of Canada,Canadian National Sportsman’s Show, and University of Toronto.
Editorial assistance was provided by P. H. Eschmeyer, K. H. Loftus, andH. A. Regier.
K. H. LoftusH. A. Regier
CONTENTS
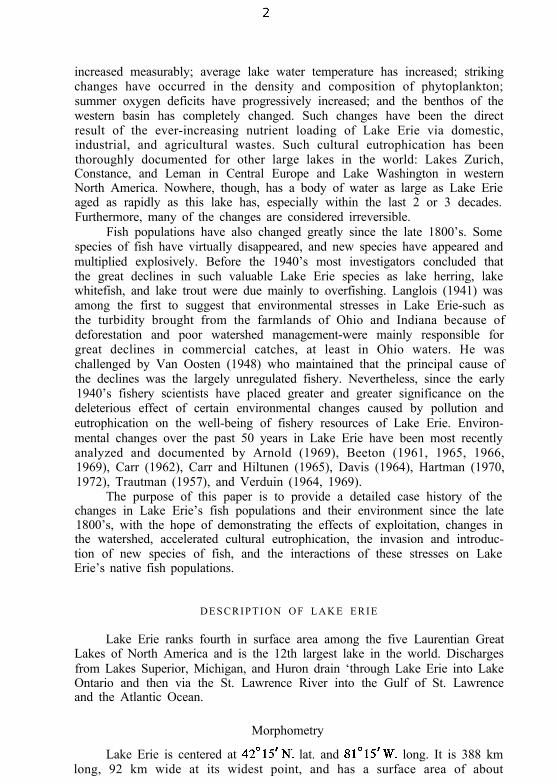
Abstract . . . . . . . . . . . . . . . . . . . . . . . . . . . . . . . . . . . . . . . . . . . . . . 1
Introduction. . . . . . . . . . . . . . . . . . . . . . . . . . . . . . . . . . . . . . . . . . . 1
Description of Lake Erie. . . . . . . . . . . . . . . . . . . . . . . . . . . . . . . . . . . 2Morphometry . . . . . . . . . . . . . . . . . . . . . . . . . . . . . . . . . . . . . . 2Climate . . . . . . . . . . . . . . . . . . . . . . . . . . . . . . . . . . . . . . . . . . 4Physical descriptions of basins . . . . . . . . . . . . . . . . . . . . . . . . . . . 4Thermal cycles . . . . . . . . . . . . . . . . . . . . . . . . . . . . . . . . . . . . . 4Ichthyofauna. . . . . . . . . . . . . . . . . . . . . . . . . . . . . . . . . . . . . . . 6Limnological classification. . . . . . . . . . . . . . . . . . . . . . . . . . . . . . 6
Environmental factors . . . . . . . . . . . . . . . . . . . . . . . . . . . . . . . . . . . . 7Drainage basin. . . . . . . . . . . . . . . . . . . . . . . . . . . . . . . . . . . . . . 8Temperature. . . . . . . . . . . . . . . . . . . . . . . . . . . . . . . . . . . . . . . 8Transparency. . . . . . . . . . . . . . . . . . . . . . . . . . . . . . . . . . . . . . . 8Nutrient loading . . . . . . . . . . . . . . . . . . . . . . . . . . . . . . . . . . . . 9Phytoplankton. . . . . . . . . . . . . . . . . . . . . . . . . . . . . . . . . . . . . . 10Zooplankton. . . . . . . . . . . . . . . . . . . . . . . . . . . . . . . . . . . . . . . 11Deterioration of dissolved oxygen . . . . . . . . . . . . . . . . . . . . . . . . 13Fish parasites . . . . . . . . . . . . . . . . . . . . . . . . . . . . . . . . . . . . . . 18
Changing fish populations . . . . . . . . . . . . . . . . . . . . . . . . . . . . . . . . . . 19Sturgeon. . . . . . . . . . . . . . . . . . . . . . . . . . . . . . . . . . . . . . . . . . 23Lake trout . . . . . . . . . . . . . . . . . . . . . . . . . . . . . . . . . . . . . . . . 23Longjaw cisco . . . . . . . . . . . . . . . . . . . . . . . . . . . . . . . . . . . . . . 24Lakeherring . . . . . . . . . . . . . . . . . . . . . . . . . . . . . . . . . . . . . . . 24Lake whitefish. . . . . . . . . . . . . . . . . . . . . . . . . . . . . . . . . . . . . . 26Sauger . . . . . . . . . . . . . . . . . . . . . . . . . . . . . . . . . . . . . . . . . . . 28Blue pike . . . . . . . . . . . . . . . . . . . . . . . . . . . . . . . . . . . . . . . . . 28Walleye . . . . . . . . . . . . . . . . . . . . . . . . . . . . . . . . . . . . . . . . . . 30Yellow perch . . . . . . . . . . . . . . . . . . . . . . . . . . . . . . . . . . . . . . 33Warm-water species . . . . . . . . . . . . . . . . . . . . . . . . . . . . . . . . . . 34Colonizing species . . . . . . . . . . . . . . . . . . . . . . . . . . . . . . . . . . . 35
Summary . . . . . . . . . . . . . . . . . . . . . . . . . . . . . . . . . . . . . . . . . . . . . 36
Acknowledgements . . . . . . . . . . . . . . . . . . . . . . . . . . . . . . . . . . . . . . 37
Literature cited. . . . . . . . . . . . . . . . . . . . . . . . . . . . . . . . . . . . . . . . . 37
Effects of Exploitation, Environmental Changes, andNew Species on the Fish Habitats and Resources of Lake Erie1
Wilbur L. Hartman
ABSTRACT
No other lake as large as Lake Erie (surface area, 25,690 km’) has been subjectedto such extensive changes in the drainage basin, the lake environment, and the fishpopulations over the last 150 years. Deforestation and prairie burning led to erosion ofthe watershed and siltation of valuable spawning grounds. Marsh spawning areas weredrained. Lake-to-river spawning migrations of sturgeon, walleye, and other fishes wereblocked by mill dams. Accelerated cultural nutrient loading increased total dissolvedsolids by nearly 50% (1920-70). Phosphate loading reached 469 metric tons per year bythe 1950’s and continued to increase. The biomass of phytoplankton increased 20-foldbetween 1919 and 1963. Oxygen demand for decomposition of these algae so degradedoxygen regimes in the western and central basins by the 1950’s that the once abundantmayfly nymphs were destroyed and the central basin hypolimnion became anoxic. Thesequence of disappearance or severe depletion of fish species was as follows: lake trout,sturgeon, lake herring, lake whitefish, sauger, blue pike, and walleye. Yellow perch arenow declining. All resources were intensively exploited at one time or another. Laketrout suffered only this stress, but changes in the watershed significantly stressed sturgeonand lake whitefish. Degradation of the lake spawning grounds, benthos, and oxygenregimes culminated in severe stress by the 1950’s on the remnants of the lake herring andlake whitefish, and on the sauger, blue pike, and walleye. Additional mortality may havebeen imposed on walleye and blue pike fry by predacious smelt that successfully colonizedLake Erie after fist appearing in 1932. The cultural stresses, in the probable order ofgreatest to least net effects on the fish community of Lake Erie, appear to have been:(1) an intense, opportunistic, ineffectively controlled commercial fishery; (2) changes inthe watershed, such as erosion and siltation of stream beds and inshore lake areas, andconstruction of dams in tributaries; (3) nutrient loading, destruction of biota, andreduction of dissolved oxygen; and (4) the competitive and predatory activities ofinvading species.
INTRODUCTION
Fish communities and their habitats in Lake Erie have been radicallychanged over the last 150 years by a series of cultural stresses imposed byman. These stresses have included intensive and selective commercial fishing,watershed and shore erosion, nutrient loading, invasion of new species viacanals, and stream destruction and marsh drainage.
Changes in the biological and chemical characteristics of Lake Erie havebeen particularly marked over the last 50 years: basic lake fertility has
1 Contribution 468, Great Lakes Fishery Laboratory, U.S. Bureau of SportFisheries and Wildlife, Ann Arbor, Michigan 48107.
increased measurably; average lake water temperature has increased; strikingchanges have occurred in the density and composition of phytoplankton;summer oxygen deficits have progressively increased; and the benthos of thewestern basin has completely changed. Such changes have been the directresult of the ever-increasing nutrient loading of Lake Erie via domestic,industrial, and agricultural wastes. Such cultural eutrophication has beenthoroughly documented for other large lakes in the world: Lakes Zurich,Constance, and Leman in Central Europe and Lake Washington in westernNorth America. Nowhere, though, has a body of water as large as Lake Erieaged as rapidly as this lake has, especially within the last 2 or 3 decades.Furthermore, many of the changes are considered irreversible.
Fish populations have also changed greatly since the late 1800’s. Somespecies of fish have virtually disappeared, and new species have appeared andmultiplied explosively. Before the 1940’s most investigators concluded thatthe great declines in such valuable Lake Erie species as lake herring, lakewhitefish, and lake trout were due mainly to overfishing. Langlois (1941) wasamong the first to suggest that environmental stresses in Lake Erie-such asthe turbidity brought from the farmlands of Ohio and Indiana because ofdeforestation and poor watershed management-were mainly responsible forgreat declines in commercial catches, at least in Ohio waters. He waschallenged by Van Oosten (1948) who maintained that the principal cause ofthe declines was the largely unregulated fishery. Nevertheless, since the early1940’s fishery scientists have placed greater and greater significance on thedeleterious effect of certain environmental changes caused by pollution andeutrophication on the well-being of fishery resources of Lake Erie. Environ-mental changes over the past 50 years in Lake Erie have been most recentlyanalyzed and documented by Arnold (1969), Beeton (1961, 1965, 1966,1969), Carr (1962), Carr and Hiltunen (1965), Davis (1964), Hartman (1970,1972), Trautman (1957), and Verduin (1964, 1969).
The purpose of this paper is to provide a detailed case history of thechanges in Lake Erie’s fish populations and their environment since the late1800’s, with the hope of demonstrating the effects of exploitation, changes inthe watershed, accelerated cultural eutrophication, the invasion and introduc-tion of new species of fish, and the interactions of these stresses on LakeErie’s native fish populations.
DESCRIPTION OF LAKE ERIE
Lake Erie ranks fourth in surface area among the five Laurentian GreatLakes of North America and is the 12th largest lake in the world. Dischargesfrom Lakes Superior, Michigan, and Huron drain ‘through Lake Erie into LakeOntario and then via the St. Lawrence River into the Gulf of St. Lawrenceand the Atlantic Ocean.
Morphometry
Lake Erie is centered at 42’15’N. lat. and 81’15’W. long. It is 388 kmlong, 92 km wide at its widest point, and has a surface area of about
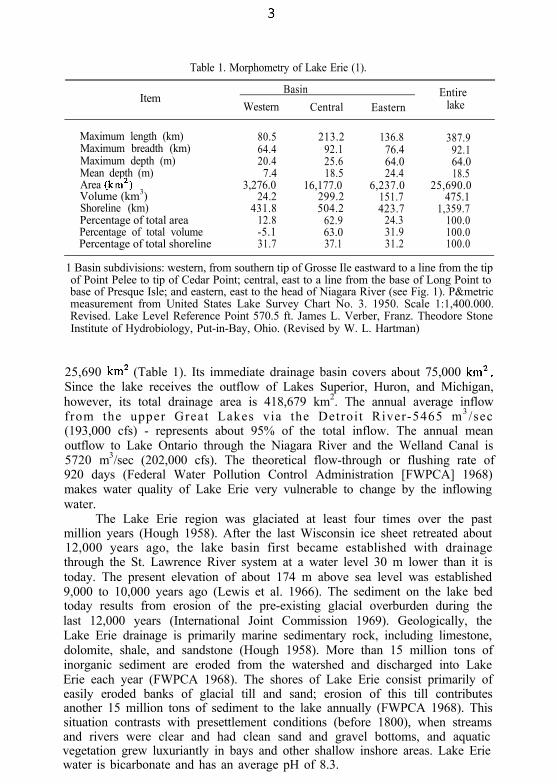
Table 1. Morphometry of Lake Erie (1).
ItemBasin Entire
Western Central Eastern lake
Maximum length (km) 80.5 213.2 136.8Maximum breadth (km) 64.4 92.1 76.4Maximum depth (m) 20.4 25.6 64.0Mean depth (m) 7.4 18.5 24.4Area (km’)Volume (km3)
3,276.0 16,177.0 6,237.024.2 299.2 151.7
Shoreline (km) 431.8Percentage of total area 12.8Percentage of total volume -5.1Percentage of total shoreline 31.7
504.262.963.037.1
423.724.331.931.2
387.992.164.018.5
25,690.0475.1
1,359.7100.0100.0100.0
1 Basin subdivisions: western, from southern tip of Grosse Ile eastward to a line from the tipof Point Pelee to tip of Cedar Point; central, east to a line from the base of Long Point tobase of Presque Isle; and eastern, east to the head of Niagara River (see Fig. 1). P&metricmeasurement from United States Lake Survey Chart No. 3. 1950. Scale 1:1,400.000.Revised. Lake Level Reference Point 570.5 ft. James L. Verber, Franz. Theodore StoneInstitute of Hydrobiology, Put-in-Bay, Ohio. (Revised by W. L. Hartman)
25,690 km* (Table 1). Its immediate drainage basin covers about 75,000 km*.Since the lake receives the outflow of Lakes Superior, Huron, and Michigan,however, its total drainage area is 418,679 km2. The annual average inflowfrom the upper Great Lakes via the Detroit River-5465 m3 /sec(193,000 cfs) - represents about 95% of the total inflow. The annual meanoutflow to Lake Ontario through the Niagara River and the Welland Canal is5720 m3/sec (202,000 cfs). The theoretical flow-through or flushing rate of920 days (Federal Water Pollution Control Administration [FWPCA] 1968)makes water quality of Lake Erie very vulnerable to change by the inflowingwater.
The Lake Erie region was glaciated at least four times over the pastmillion years (Hough 1958). After the last Wisconsin ice sheet retreated about12,000 years ago, the lake basin first became established with drainagethrough the St. Lawrence River system at a water level 30 m lower than it istoday. The present elevation of about 174 m above sea level was established9,000 to 10,000 years ago (Lewis et al. 1966). The sediment on the lake bedtoday results from erosion of the pre-existing glacial overburden during thelast 12,000 years (International Joint Commission 1969). Geologically, theLake Erie drainage is primarily marine sedimentary rock, including limestone,dolomite, shale, and sandstone (Hough 1958). More than 15 million tons ofinorganic sediment are eroded from the watershed and discharged into LakeErie each year (FWPCA 1968). The shores of Lake Erie consist primarily ofeasily eroded banks of glacial till and sand; erosion of this till contributesanother 15 million tons of sediment to the lake annually (FWPCA 1968). Thissituation contrasts with presettlement conditions (before 1800), when streamsand rivers were clear and had clean sand and gravel bottoms, and aquaticvegetation grew luxuriantly in bays and other shallow inshore areas. Lake Eriewater is bicarbonate and has an average pH of 8.3.
Climate
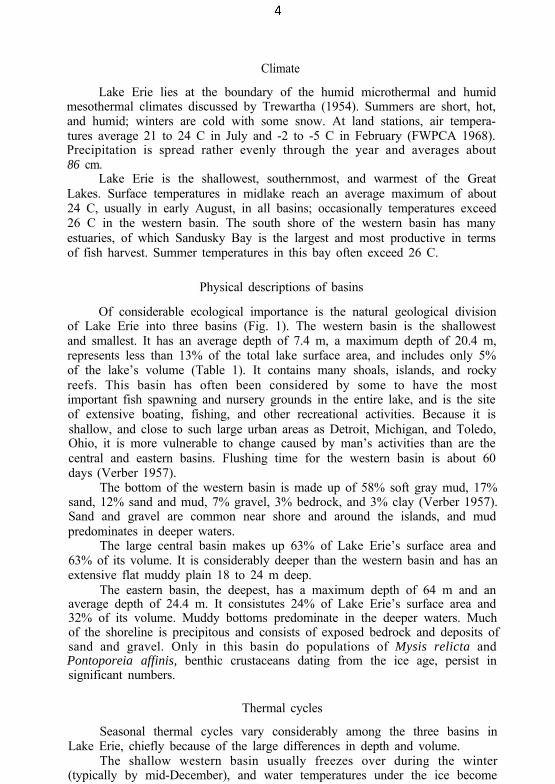
Lake Erie lies at the boundary of the humid microthermal and humidmesothermal climates discussed by Trewartha (1954). Summers are short, hot,and humid; winters are cold with some snow. At land stations, air tempera-tures average 21 to 24 C in July and -2 to -5 C in February (FWPCA 1968).Precipitation is spread rather evenly through the year and averages about86 cm.
Lake Erie is the shallowest, southernmost, and warmest of the GreatLakes. Surface temperatures in midlake reach an average maximum of about24 C, usually in early August, in all basins; occasionally temperatures exceed26 C in the western basin. The south shore of the western basin has manyestuaries, of which Sandusky Bay is the largest and most productive in termsof fish harvest. Summer temperatures in this bay often exceed 26 C.
Physical descriptions of basins
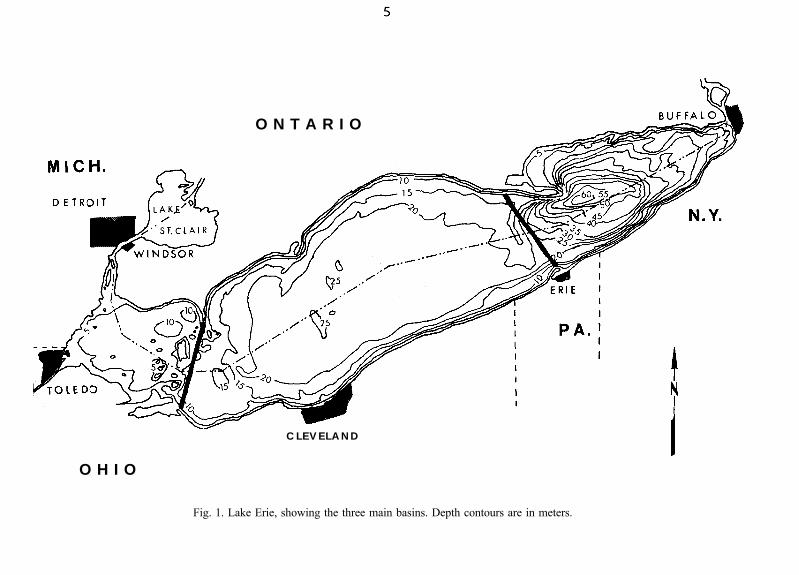
Of considerable ecological importance is the natural geological divisionof Lake Erie into three basins (Fig. 1). The western basin is the shallowestand smallest. It has an average depth of 7.4 m, a maximum depth of 20.4 m,represents less than 13% of the total lake surface area, and includes only 5%of the lake’s volume (Table 1). It contains many shoals, islands, and rockyreefs. This basin has often been considered by some to have the mostimportant fish spawning and nursery grounds in the entire lake, and is the siteof extensive boating, fishing, and other recreational activities. Because it isshallow, and close to such large urban areas as Detroit, Michigan, and Toledo,Ohio, it is more vulnerable to change caused by man’s activities than are thecentral and eastern basins. Flushing time for the western basin is about 60days (Verber 1957).
The bottom of the western basin is made up of 58% soft gray mud, 17%sand, 12% sand and mud, 7% gravel, 3% bedrock, and 3% clay (Verber 1957).Sand and gravel are common near shore and around the islands, and mudpredominates in deeper waters.
The large central basin makes up 63% of Lake Erie’s surface area and63% of its volume. It is considerably deeper than the western basin and has anextensive flat muddy plain 18 to 24 m deep.
The eastern basin, the deepest, has a maximum depth of 64 m and anaverage depth of 24.4 m. It consistutes 24% of Lake Erie’s surface area and32% of its volume. Muddy bottoms predominate in the deeper waters. Muchof the shoreline is precipitous and consists of exposed bedrock and deposits ofsand and gravel. Only in this basin do populations of Mysis relicta andPontoporeia affinis, benthic crustaceans dating from the ice age, persist insignificant numbers.
Thermal cycles
Seasonal thermal cycles vary considerably among the three basins inLake Erie, chiefly because of the large differences in depth and volume.
The shallow western basin usually freezes over during the winter(typically by mid-December), and water temperatures under the ice become
O N T A R I O
C L E V E L A N D
O H I O
Fig. 1. Lake Erie, showing the three main basins. Depth contours are in meters.
isothermal at about 1 C. The ice thaws near the end of March, and surfacewater temperatures gradually rise to almost 10 C by May 1, 15 C by June,and 24-26 C by early August. The water is usually kept nearly isothermal insummer by wind and currents, although intermittent metalimnions are formedin some years after extended periods of hot, calm weather. Fall cooling beginsin mid to late August.
The deeper central basin rarely freezes over completely. Spring warminglags behind that in the western basin by about 1 week; by late Maytemperatures reach about 13 C and the water column is isothermal. A sharpmetalimnion forms in June at about 12 m and gradually sinks as the seasonprogresses. Epilimnetic water warms to a maximum of 24-26 C by earlyAugust. The fall overturn usually occurs in late September and the watertemperature becomes isothermal at about 1 C in late December. Bottomwaters during the summer are much colder in the central basin (9 C) than inthe western basin (19 C).
The seasonal thermal cycle of the deep eastern basin closely resemblesthe cycles in the other Great Lakes. In winter the basin is nearly isothermal at1 C. When the ice breaks up in the spring in the western and central basins,ice floes usually move east and pack over the eastern basin. Consequently,April and May near-surface water temperatures there lag 18 days behind thoseof the western basin and 11 days behind those of the central basin. Slightwarming takes place during April and early May. The upper waters then warmrapidly, and a relatively stable and thick metalimnion is formed that narrowsand sinks as summer progresses. The temperature of the epilimnion reachesnearly 24 C by early August, then starts to drop. The hypolimnetic waterwarms slowly and reaches 7-9 C before the fall overturn, which usually occursin November. The water column becomes isothermal by late December.
Ichthyofauna
The fishes of Lake Erie are a mixture of cold- and warm-water forms(Table 2), as one might expect from the diversity of limnological conditionsand habitats. At least 138 species have been reported in the lake (Van Meterand Trautman 1970). The cold stenothermic coregonids are represented bylake herring, lake whitefish, and longjaw cisco. Native lake trout were onceabundant in the eastern basin (Goode 1884) but have been rare since 1940.Native brook trout propagate in a few cold tributaries and are occasionallyfound in the open lake. Other salmonids that have been stocked since 1870but have developed no truly viable populations are coho, chinook, andAtlantic salmon, and brown and rainbow trout.
Limnological classification
No single general limnological classification of Lake Erie is adequatebecause physical, chemical, and biological conditions vary between basins andin certain localities between inshore and offshore areas. The classification bythe International Joint Commission (1969) of the western basin as eutrophic,the central basin as mesotrophic-eutrophic, and the eastern basin asoligotrophic-mesotrophic appears to suitably identify the general lake types
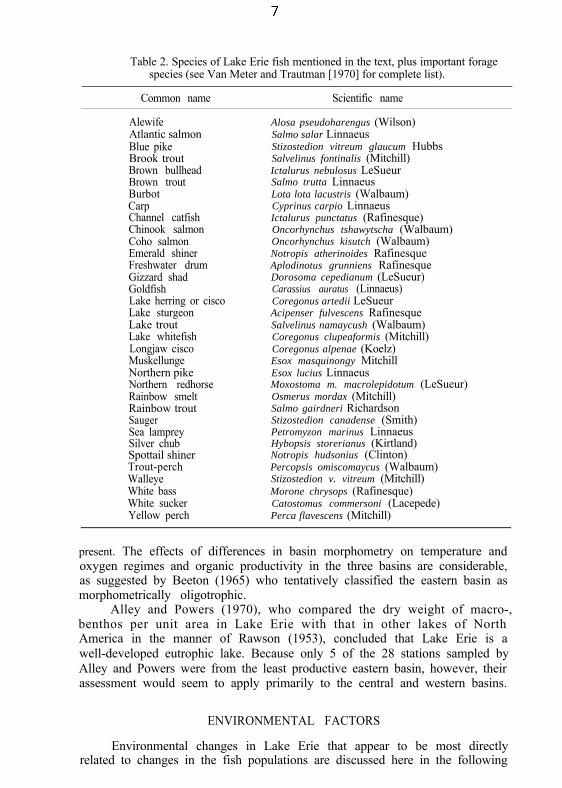
Table 2. Species of Lake Erie fish mentioned in the text, plus important foragespecies (see Van Meter and Trautman [1970] for complete list).
Common name Scientific name
AlewifeAtlantic salmonBlue pikeBrook troutBrown bullheadBrown troutBurbotCarpChannel catfishChinook salmonCoho salmonEmerald shinerFreshwater drumGizzard shadGoldfishLake herring or ciscoLake sturgeonLake troutLake whitefishLongjaw ciscoMuskellungeNorthern pikeNorthern redhorseRainbow smeltRainbow troutSaugerSea lampreySilver chubSpottail shinerTrout-perchWalleyeWhite bassWhite suckerYellow perch
Alosa pseudoharengus (Wilson)Salmo salar LinnaeusStizostedion vitreum glaucum HubbsSalvelinus fontinalis (Mitchill)Ictalurus nebulosus LeSueurSalmo trutta LinnaeusLota lota lacustris (Walbaum)Cyprinus carpio LinnaeusIctalurus punctatus (Rafinesque)Oncorhynchus tshawytscha (Walbaum)Oncorhynchus kisutch (Walbaum)Notropis atherinoides RafinesqueAplodinotus grunniens RafinesqueDorosoma cepedianum (LeSueur)Carassius auratus (Linnaeus)Coregonus artedii LeSueurAcipenser fulvescens RafinesqueSalvelinus namaycush (Walbaum)Coregonus clupeaformis (Mitchill)Coregonus alpenae (Koelz)Esox masquinongy MitchillEsox lucius LinnaeusMoxostoma m. macrolepidotum (LeSueur)Osmerus mordax (Mitchill)Salmo gairdneri RichardsonStizostedion canadense (Smith)Petromyzon marinus LinnaeusHybopsis storerianus (Kirtland)Notropis hudsonius (Clinton)Percopsis omiscomaycus (Walbaum)Stizostedion v. vitreum (Mitchill)Morone chrysops (Rafinesque)Catostomus commersoni (Lacepede)Perca flavescens (Mitchill)
present. The effects of differences in basin morphometry on temperature andoxygen regimes and organic productivity in the three basins are considerable,as suggested by Beeton (1965) who tentatively classified the eastern basin asmorphometrically oligotrophic.
Alley and Powers (1970), who compared the dry weight of macro-,benthos per unit area in Lake Erie with that in other lakes of NorthAmerica in the manner of Rawson (1953), concluded that Lake Erie is awell-developed eutrophic lake. Because only 5 of the 28 stations sampled byAlley and Powers were from the least productive eastern basin, however, theirassessment would seem to apply primarily to the central and western basins.
ENVIRONMENTAL FACTORS
Environmental changes in Lake Erie that appear to be most directlyrelated to changes in the fish populations are discussed here in the following
order: alterations in drainage basin, water temperature, nutrient loading,phytoplankton, zooplankton, oxygen regimes (particularly in relation to theireffects on benthic invertebrates), and fish parasites. Changes in the fishpopulations are discussed in a later section.
Drainage basin
Most of the comments in this subsection are based on the conclusions ofTrautman (1957) who reviewed the early literature.
As European man settled the Lake Erie drainage basin during the 1700’sand 1800’s, he drastically changed the vegetative cover and the dynamics ofthe drainage. Great woodlands were deforested and broad prairies burned over,and converted to rich farmlands. Land erosion markedly increased: Streamsand rivers became turbid; silt covered the once clean and important river andinshore spawning grounds of such fishes as sturgeon, muskellunge, and lakewhitefish; and silt eliminated beds of inshore rooted aquatic vegetation inshallow bays of western basin and thus sharply reduced the quality of thesenursery areas.. The draining and filling of extensive marshlands destroyed otherspawning grounds (e.g. for northern pike and sturgeon). Untreated wastes fromsawmills, gristmills, slaughterhouses, steel factories, breweries, and towns weredischarged directly into the lake or its tributary streams. Sawdust dischargedinto Ohio streams was frequently reported to asphyxiate fish when itcompacted in their gills. The decomposition in rivers of large quantities ofrefuse from breweries and slaughterhouses apparently resulted occasionally inlow oxygen levels and sizable fish kills. The hundreds of dams built during themid-1800’s for millsites also destroyed fish populations by making manyupstream spawning areas inaccessible to sturgeon, walleyes, and white bass.
Temperature
Beeton (1961) who analyzed water temperature records from the citywater filtration plant at Erie, Pennsylvania, for 1918-58, demonstrated thatthe moving means of the water temperatures were 0.8 to 1.1 C higher in the1950’s than during his baseline period of 1918-27. Most of this increaseoccurred between 1925 and 1930. After comparing his moving means of watertemperature with moving means of air temperature given for the same1918-27 period by Thomas (1954), Beeton concluded that the warming trendof the lake followed that of the climate. No significant change has taken placesince then. Though certainly not a cultural stress, this unique natural changeallegedly affected lake whitefish survival adversely (Lawler 1965).
Transparency
The transparency of Lake Erie water has apparently not changedsignificantly since the 1920’s (Beeton 1961). Characteristically, transparency
in the western basin is kept extremely low during the entire ice-free period bysilt brought in from farmlands in the Maumee River drainage and from thecontinual resuspension of sediments by strong winds. In the central andeastern basins, Pinsak (1967) detected a 50% increase in suspended material
from summer to early winter which he attributed to “movement of waterfrom the western part of the lake, seasonal increase in organic material,turbulent storm effect, and vertical circulation of the entire water column asthe thermocline lowers and disappears.”
Nutrient loading
Accelerated eutrophication or cultural enrichment of Lake Erie has beenresponsible for a lakewide decrease in dissolved oxygen, especially in thebottom waters during summer. Most of the lake’s nutrient load fromdomestic, industrial, and agricultural wastes is discharged into the western basinvia the Detroit, Raisin, and Maumee Rivers. The Detroit River, for example,receives 6.1 billion liters of industrial and domestic waste per day (Powers andRobertson 1966). Oxygen demands are increased directly, to some extent, bysedimentation onto the bottom muds of organic and inorganic materials fromindustrial and municipal waste discharges. Primarily, however, the demands areincreased by the decomposition of the large volumes of phytoplankton thatresult from the nutrient discharges.
Total concentrations of most major ions have markedly increased inLake Erie over the last 50 years (Beeton 1961, 1965). Total dissolved solidsincreased from 133 to 183 mg/l by 1960 (Beeton 1965) and to 198 mg/l by1968 (Chawla 1971). Concentrations of calcium, chloride, sodium-plus-potassium, and sulfate have increased by 6, 16, 5, and 13 mg/l respectively(Chawla 1971). The increases are from allochthonous sources. The DetroitRiver, for example, receives enough chlorides in industrial and municipalwastes to increase its chloride content 2 1/2 times (Ownbey and Kee 1967).Kramer (1961) showed that, within the lake, concentrations usually increasefrom west to east; he suggested the cause to be the loss of water throughevaporation as the water mass from the upper Great Lakes flows through LakeErie.
The major nutrient ions, nitrogen and phosphorus, have also markedlyincreased since 1930. On the basis of a review of the meager data available,Beeton (1969) concluded that open-lake ammonia-nitrogen increased fivefoldand total nitrogen threefold between 1930 and 1958. In the western basin theconcentration of ammonia-nitrogen increased about 13-fold, from 13 mg/l in1930 (Wright 1955) to 170 mg/l in 1967-68 (FWPCA 1968). In the openwaters of the central basin ammonia-nitrogen has doubled since 1901 (Lewis1906; International Joint Commission 1969) and total phosphorus appearedto double between 1942 and 1958. Verduin (1969) cited data from FWPCAshowing an average increase of 50% in soluble phosphorus in Lake Eriebetween 1962-64 and 1967-68; thus concentrations have continued toincrease. Within the lake, concentrations of nitrogen and phosphorus, as wellas silica, decreased from west to east (FWPCA 1968); for example, during1967-68 the concentration of soluble phosphate was 51-120 mg/l in thewestern basin, 15-60 mg/l in the central basin, and 930 mg/l in the easternbasin. This west to east reduction in nutrients reflects the high biologicaluptake during organic synthesis in the western basin (Beeton 1969).
Virtually all phosphorus in the western basin is allochthonous. Harlow(1966) determined in 1964 that the Detroit River contributed 107,500 tons
of total nitrogen and 47,000 tons of total phosphates per year. Nearly 75%comes from municipal waste discharges, and 66% of that comes fromdetergents (FWPCA 1968). Curl (1959) estimated that during the early 1950’sabout 469 metric tons per year were being discharged into western Lake Erie.He found the bottom sediments considerably enriched in phosphorus, andspeculated that this nutrient was lost from the western basin chiefly bysedimentation and not by outflow into the central basin. Verduin (1969)reported that the most striking change in western Lake Erie between 1948and 1962 was the fivefold increase in phosphates. Verduin and others (e.g.FWPCA 1968) argued that this increase in phosphorus has been mainlyresponsible for today’s large phytoplankton crops and the superabundance ofthe filamentous alga, Cladophora glomerata, which is now a major nuisancealong the shore in western Lake Erie. The ultimate consequences of suchincreased organic production has been destruction of summer oxygen regimes.
Phytoplankton
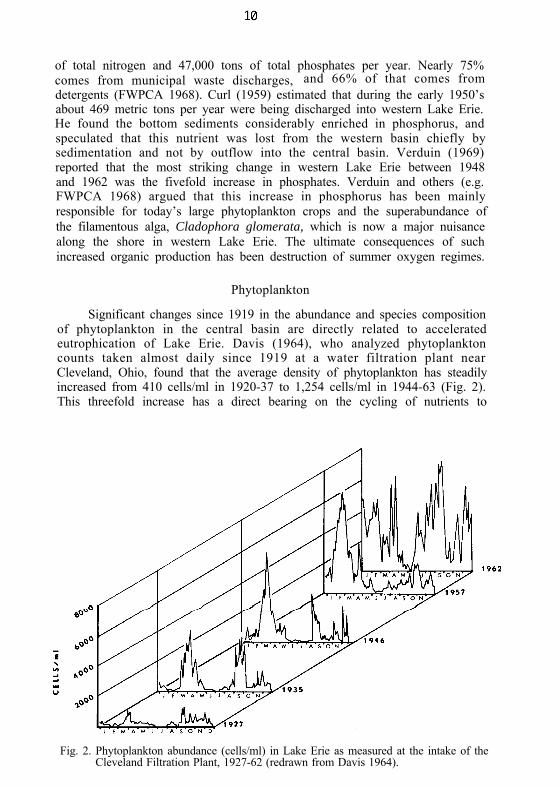
Significant changes since 1919 in the abundance and species compositionof phytoplankton in the central basin are directly related to acceleratedeutrophication of Lake Erie. Davis (1964), who analyzed phytoplanktoncounts taken almost daily since 1919 at a water filtration plant nearCleveland, Ohio, found that the average density of phytoplankton has steadilyincreased from 410 cells/ml in 1920-37 to 1,254 cells/ml in 1944-63 (Fig. 2).This threefold increase has a direct bearing on the cycling of nutrients to
Fig. 2. Phytoplankton abundance (cells/ml) in Lake Erie as measured at the intake of theCleveland Filtration Plant, 1927-62 (redrawn from Davis 1964).
higher trophic levels (e.g. to fish), and also increases the oxygen demands ofthe water or mud, or both, to the detriment of certain populations of fish andbenthic organisms (e.g. lake herring and the mayfly, Hexagenia).
Seasonal cycles of abundance have also changed. Not only are the springand fall maxima in the central basin now several times higher than in 1927(Fig. 2) but the pulses have become considerably longer in recent years (Davis1964). Summer and winter minima between pulses have concurrently becomeshorter. Not only do fish planktivores have a more concentrated food supply,but it is available at high densities for a longer and longer period during thegrowing season. In this sense, the biomass of phytoplankton available tohigher trophic levels is at least 20 times greater now than in the 1920’s.
Davis (1969) who determined the forms dominating spring and fallphytoplankton pulses in central Lake Erie, showed that the oligotrophicdiatom Asterionella usually dominated the spring pulse between 1920 and1949; since then the more eutrophic diatom Melosira has been dominant. Thefall phytoplankton pulses were dominated by Synedra and Melosira until1947. Then the mesotrophic diatom Fragilaria began to become important, aswell as the green alga Pediastrum and the eutrophic blue-green algae Anabaenaand Aphanizomenon. By 1970 the fall pulses were invariably dominated bythree eutrophic blue-green algae in succession - Anabaena, Microcystis, andAphanizomenon.
Studies by Chandler (1940) and Hahn (1969) showed that the planktondiatom flora around the islands in western Lake Erie changed markedlybetween 1939 and 1965. Some abundant species such as Cyclotella stelligerabecame rare, and other species such as Melosira binderana and Diatoma penuevar. elongatum became considerably more abundant. Quantitatively, the totaldiatom flora increased greatly. For example, the density (cells/ml) of diatomswas 974, 220, and 1,245 for March, April, and May in 1939, and 8,060,6,913, and 4,216 for the same months in 1965. These species and densitychanges show gradual eutrophication of the waters of western Lake Erie,according to Hahn (1969).
The filamentous alga Cladophora glomerata, which is attached to bottommaterials to depths as great as 5 m, has developed heavy growths along theshores and islands over the last 30 years (Langlois 1945; FWPCA 1968). Attimes dense growths of Cladophora develop on the reefs used during thespring by spawning walleyes. The growths usually develop before all walleyeeggs are hatched but the effect of this algal growth on hatching success isunknown. Great quantities of Cladophora are frequently broken loose by waveaction and currents. When these floating mats settle to the bottom, theirdecomposition adds significantly to the oxygen demands of the sediments.
Zooplankton
Long-term quantitative changes in zooplankton in Lake Erie as a wholeh a v e n o t b e e n a d e q u a t e l y d o c u m e n t e d , a l t h o u g h B r a d s h a w ( 1 9 6 4 ) d i dcompare data for the island region of the western basin that were collectedsuccessively by Chandler (1940, 1942) Hubschman (1960) and Bradshaw andJ. Verduin. He showed that zooplankton production in the island area in thewestern basin markedly increased between 1939 and 1959. Monthly average
standing crops of Cladocera were nearly three times higher in 1949 than in1939 (Bradshaw 1964). In July and August, for example, the number ofCladocera per cubic meter seldom exceeded 7,000 in 1939, usually wasbetween 10,000 and 22,000 in 1949, and usually exceeded 26,000 in 1959(peaks in 1959 were nearly 110,000 in early July and 85,000 in late August).Total Copepoda were more abundant throughout the 1949 season than during1939, and adult Copepoda were more abundant in July and August in 1959than in 1949. This analysis suggests that the quantity of zooplankton in 1959may have been double that in 1939 and 40% greater than that in 1949.
Differences in zooplankton between the three basins in Lake Erie havebeen synoptically examined only twice (Davis 1968, 1969). Collections weremade at midlake stations along an entire longitudinal transect in July andOctober 1967, and along part of the transect in January 1968. In Julyabundance was distinctly highest in the western basin and lowest in theeastern basin, confirming the usual concept that productivity is highest inwestern Lake Erie. In October, however, the western basin was relativelyimproverished and zooplankton biomass surprisingly increased from west toeast (Davis 1969). Nonetheless, Davis cited a personal communication fromKleveno who showed that quantities of seston, chlorophyll a, and phytoplank-ton were highest in the western basin and lowest in the eastern basin duringOctober 1967. Davis therefore concluded that the unexpected decrease inzooplankton abundance from west to east during October 1967 did notnecessarily contradict the accepted pattern of production rates in Lake Erie,but was more likely the temporary result of some “unrecorded environmentalchange over the period preceding sampling.”
Such increases in organic production in this trophic level over thedecades added to the accumulation of algae, and the resultant oxygendemands during decomposition adversely affected oxygen regimes. Certainnoticeable qualitative changes have occurred. Diaptomus siciloides, which isusually found in eutrophic waters, was rare in Lake Erie in 1929 and 1939,but has now become abundant in the western basin (Davis 1966). On theother hand, the large zooplankter, Limnocalanus macrurus, was abundant in1929 in the eastern and central basins, and even in the western basin duringwinter and spring, but few were taken during extensive sampling in 1967 and1968; Gannon and Beeton (1971) believed that depletion of hypolimneticdissolved oxygen and predation by planktivorous fish were the most probablecauses of the decline.
For Lake Erie as well as the other Great Lakes, Patalas (1972) examinedthe relation between the density of crustacean plankton, the concentration ofchlorophyll a in near-surface waters, and the heat content of a O-25 m watercolumn (1 cm2 in area; base 0 C). As expected, concentrations of chlorophylla and densities of crustacean plankton were very high in Lake Erie in Juneand July when lake heat content was moderate (Fig. 3). Plankton concentra-tions decreased slightly, however, as heat content rose in August (although thenumbers were still higher than in any other lake except Ontario). Patalas(1972) suggested that perhaps the optimal temperature range for maintainingthe type of crustacean community that exists in Lake Erie was surpassed inAugust. He found a general trend towards a decrease in the proportion of
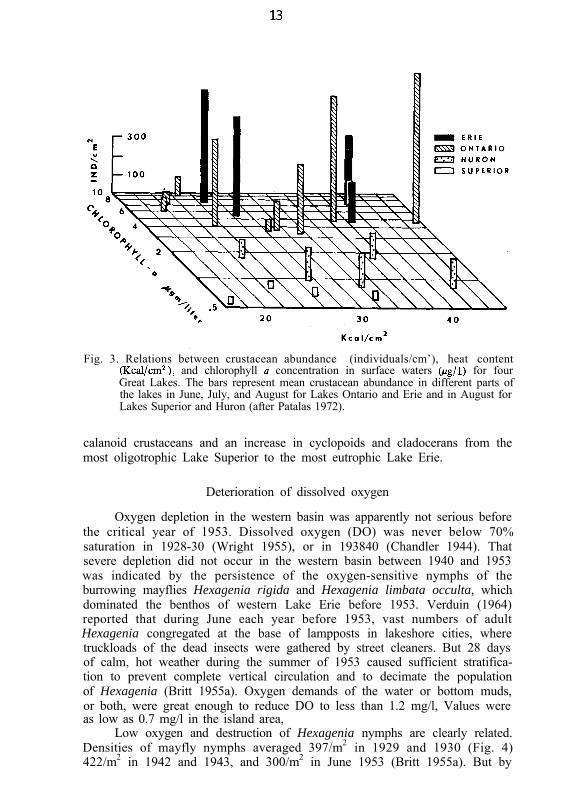
Fig. 3. Relations between crustacean abundance (individuals/cm’), heat content(Kcal/cm’), and chlorophyll II concentration in surface waters @g/l) for fourGreat Lakes. The bars represent mean crustacean abundance in different parts ofthe lakes in June, July, and August for Lakes Ontario and Erie and in August forLakes Superior and Huron (after Patalas 1972).
calanoid crustaceans and an increase in cyclopoids and cladocerans from themost oligotrophic Lake Superior to the most eutrophic Lake Erie.
Deterioration of dissolved oxygen
Oxygen depletion in the western basin was apparently not serious beforethe critical year of 1953. Dissolved oxygen (DO) was never below 70%saturation in 1928-30 (Wright 1955), or in 193840 (Chandler 1944). Thatsevere depletion did not occur in the western basin between 1940 and 1953was indicated by the persistence of the oxygen-sensitive nymphs of theburrowing mayflies Hexagenia rigida and Hexagenia limbata occulta, whichdominated the benthos of western Lake Erie before 1953. Verduin (1964)reported that during June each year before 1953, vast numbers of adultHexagenia congregated at the base of lampposts in lakeshore cities, wheretruckloads of the dead insects were gathered by street cleaners. But 28 daysof calm, hot weather during the summer of 1953 caused sufficient stratifica-tion to prevent complete vertical circulation and to decimate the populationof Hexagenia (Britt 1955a). Oxygen demands of the water or bottom muds,or both, were great enough to reduce DO to less than 1.2 mg/l, Values wereas low as 0.7 mg/l in the island area,
Low oxygen and destruction of Hexagenia nymphs are clearly related.Densities of mayfly nymphs averaged 397/m2 in 1929 and 1930 (Fig. 4)422/m2 in 1942 and 1943, and 300/m2 in June 1953 (Britt 1955a). But by
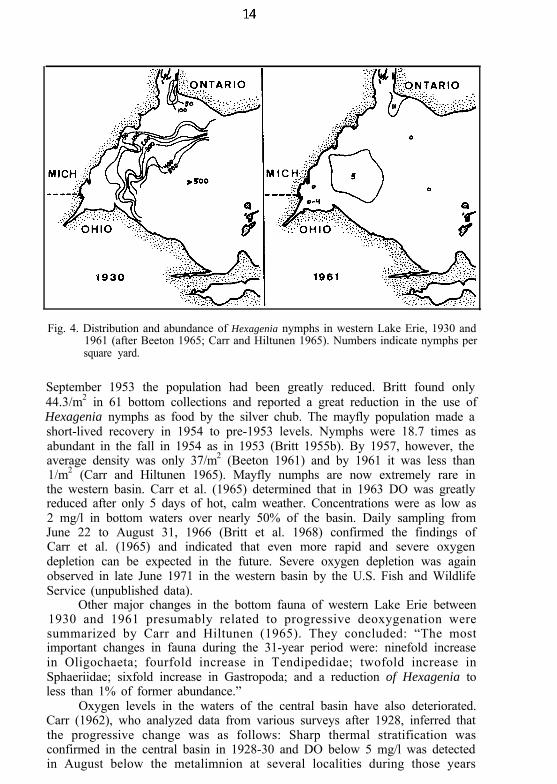
Fig. 4. Distribution and abundance of Hexagenia nymphs in western Lake Erie, 1930 and1961 (after Beeton 1965; Carr and Hiltunen 1965). Numbers indicate nymphs persquare yard.
September 1953 the population had been greatly reduced. Britt found only44.3/m2 in 61 bottom collections and reported a great reduction in the use ofHexagenia nymphs as food by the silver chub. The mayfly population made ashort-lived recovery in 1954 to pre-1953 levels. Nymphs were 18.7 times asabundant in the fall in 1954 as in 1953 (Britt 1955b). By 1957, however, theaverage density was only 37/m2 (Beeton 1961) and by 1961 it was less than1/m2 (Carr and Hiltunen 1965). Mayfly numphs are now extremely rare inthe western basin. Carr et al. (1965) determined that in 1963 DO was greatlyreduced after only 5 days of hot, calm weather. Concentrations were as low as2 mg/l in bottom waters over nearly 50% of the basin. Daily sampling fromJune 22 to August 31, 1966 (Britt et al. 1968) confirmed the findings ofCarr et al. (1965) and indicated that even more rapid and severe oxygendepletion can be expected in the future. Severe oxygen depletion was againobserved in late June 1971 in the western basin by the U.S. Fish and WildlifeService (unpublished data).
Other major changes in the bottom fauna of western Lake Erie between1930 and 1961 presumably related to progressive deoxygenation weresummarized by Carr and Hiltunen (1965). They concluded: “The mostimportant changes in fauna during the 31-year period were: ninefold increasein Oligochaeta; fourfold increase in Tendipedidae; twofold increase inSphaeriidae; sixfold increase in Gastropoda; and a reduction of Hexagenia toless than 1% of former abundance.”
Oxygen levels in the waters of the central basin have also deteriorated.Carr (1962), who analyzed data from various surveys after 1928, inferred thatthe progressive change was as follows: Sharp thermal stratification wasconfirmed in the central basin in 1928-30 and DO below 5 mg/l was detectedin August below the metalimnion at several localities during those years
(Wright 1955). Fish and associates (1960) also found low values during1928-29, even though they may not have effectively sampled the narrowhypolimnion, which is often restricted to a stratum within 2 m from thebottom. Lower DO, often below 40% saturation, was found in 1947-53(Powers et al. 1959). The first observation of an extensive zone of low DO(1-3 mg/l) in the southwestern part of the central basin was made in 1958(Carr 1962). Synoptic surveys in 1959 and 1960 (Beeton 1963) confirmedthat vast areas of the narrow hypolimnion below a sharp thermocline suddenlydeveloped severe DO depletion after thermal stratification became establishedin early summer. Indeed, in late August 1960 DO was below 2 mg/l in thebottom waters of the western two-thirds (16,777 km’) of the central basin(Fig. 5). In August 1964 the DO in more than three-fourths of the bottomwaters of the central basin was only O-2 mg/l (U.S. Public Health Service1965). Since 1964, mean depletion rates for dissolved oxygen during summerin the bottom waters of the central basin of Lake Erie have continued toincrease (Fig. 6). This increase has resulted, for example, in anoxic conditionsdeveloping by August 9 in 1970 and remaining for 2 months, until the loss ofstratification (Burns and Ross 1971).
The described changes in oxygen regimes in the central basin of LakeErie are especially important because this region is a key area for certain fishpopulations. Before anoxic conditions set in, the hypolimnion served as arequired oversummering sanctuary for such cold stenotherms as lake herring,lake whitefish, and some lake trout moving in from the deeper eastern basin;it may also have served as an optional intermittent summer sanctuary for bluepike and smelt (Trautman 1957).
Dobson and Gilbertson (1971) determined oxygen depletion rates(milligrams per liter per month) on the basis of data collected in summer inthe central basin since 1929. The long-term trend (Fig. 6) indicates that therate of deoxygenation of the bottom water has increased in the last 2 decadesat the approximate annual rate of 0.075 mg liter-1 month-1 year-1 (2.2 pmoles liter- ’ month- ’ year-’ ).
Using 110 days as the average duration of summer stratification in thecentral basin, Dobson and Gilbertson (1971) determined that a depletion rateof 3.0 mg liter-’ month-’ will cause virtual deoxygenation in the centralbasin before the fall overturn. They further determined that this critical valuefirst occurred about 1960.
Gilbertson et al. (1972), using 125 days to represent the longest periodof summer stratification, determined the critical depletion rate to be about2.7 mg liter-1 month-1. According to Dobson and Gilbertson (1971) thisrate was reached about 1956 (Fig. 6). Gilbertson et al. (1972) in anotheranalysis plotted oxygen depletion rates against estimates of phosphorusloading from municipal sewage and detergents for the entire Lake Erie basin,including drainage from the upper Great Lakes; they found that the criticalvalue of 2.7 mg/l per month was reached in 1955. About 12,000 short tonsof phosphorus were then being dumped into Lake Erie each year. By 1967the municipal phosphorus loading was up to 19,100 short tons per year.
The International Joint Commission has recently proposed water qualityobjectives that will reduce phosphorus loading of Lake Erie. The specificobjective of the “Agreement Between Canada and the United States of
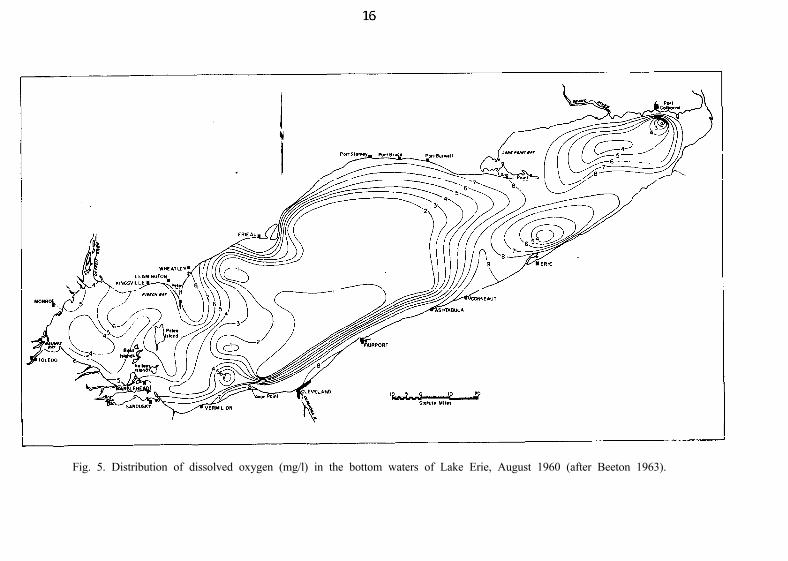
Fig. 5. Distribution of dissolved oxygen (mg/l) in the bottom waters of Lake Erie, August 1960 (after Beeton 1963).
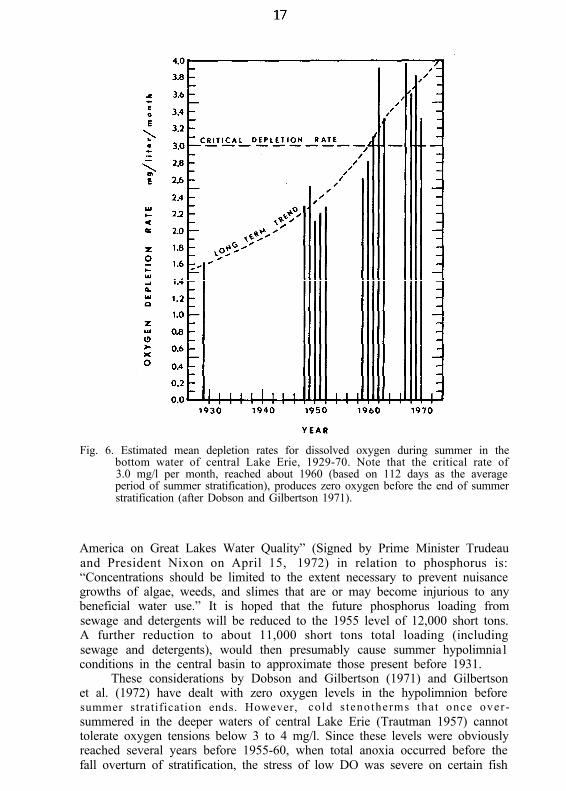
Fig. 6. Estimated mean depletion rates for dissolved oxygen during summer in thebottom water of central Lake Erie, 1929-70. Note that the critical rate of3.0 mg/l per month, reached about 1960 (based on 112 days as the averageperiod of summer stratification), produces zero oxygen before the end of summerstratification (after Dobson and Gilbertson 1971).
America on Great Lakes Water Quality” (Signed by Prime Minister Trudeauand President Nixon on April 15, 1972) in relation to phosphorus is:“Concentrations should be limited to the extent necessary to prevent nuisancegrowths of algae, weeds, and slimes that are or may become injurious to anybeneficial water use.” It is hoped that the future phosphorus loading fromsewage and detergents will be reduced to the 1955 level of 12,000 short tons.A further reduction to about 11,000 short tons total loading (includingsewage and detergents), would then presumably cause summer hypolimnia1conditions in the central basin to approximate those present before 1931.
These considerations by Dobson and Gilbertson (1971) and Gilbertsonet al. (1972) have dealt with zero oxygen levels in the hypolimnion beforesummer stratification ends. However, cold s tenotherms that once over-summered in the deeper waters of central Lake Erie (Trautman 1957) cannottolerate oxygen tensions below 3 to 4 mg/l. Since these levels were obviouslyreached several years before 1955-60, when total anoxia occurred before thefall overturn of stratification, the stress of low DO was severe on certain fish
populations at least by the early 1950’s. As I show later, certain fishpopulations became highly unstable in Lake Erie in the early 1950’s;
Critically low DO has not yet been reported from the deep easternbasin. On the basis of meager historical data, Carr (1962) suggested only thatthe oxygen demand in the bottom waters appeared to increase between 1930and 1962. In the summer of 1971, however, moderately low oxygen levels of2-5 mg/l were detected in some deep areas of the eastern basin (Great LakesFishery Laboratory, unpublished data). Thus, low-oxygen stress on thebenthos and fish communities is becoming significant in this basin.
Sediments of the three basins in Lake Erie differ considerably in theirdemands for oxygen, and the degree of demand correlates exactly with thechronology of deterioration of oxygen regimes; first in the western basin, thenin the central, finally in the eastern. J. F. Carr (personal communication)found that the 5-minute uptake of dissolved oxygen by sediments was400-600 mg/g of sediments in the western basin, 200-500 mg/g in the westernpart of the central basin, 25-400 mg/g in the eastern part of the central basin,and 50-400 mg/g in the eastern basin.
Other qualitative changes have recently occurred in the benthos of LakeErie. Veal and Osmond (1968) showed that by 1967 the abundance of thepollution-tolerant tubificids Limnodrilus hoffmeisteri and L. cervix hadincreased in the western end of Lake Erie, indicating a continuing advance inpollution. Their analysis of benthic macroinvertebrates throughout Lake Erieshowed that pollution-intolerant mayfly nymphs and caddisfly larvaepredominated in the oligotrophic eastern basin, pollution-tolerant tub&ids inthe eutrophic western basin, and intermediate forms in the mesotrophiccentral basin.
Brinkhurst et al. (1968), who analyzed collections of oligochaetes fromall basins in Lake Erie, found mostly pollution-tolerant forms in the westernbasin, oligotrophic forms (common in the upper Great Lakes) in the easternbasin, and a mixture of these forms in the central basin.
Fish parasites
Major and relatively rapid changes in the number and variety of parasitesof Lake Erie fishes have occurred since the study by Bangham and Hunter(1939). During 1961-69, Dechtiar (1972) found at least one species of parasitein 96% of the 46 species of fish from Lake Erie (1,112 fish examined). Theknown parasitic fauna of Lake Erie fish now totals 215 species. Ninety-six ofDechtiar’s records were new. He suggested that the changes in Lake Erie’senvironment and fish fauna related to cultural eutrophication and pollution,and the increased abundance in certain species of fish such as smelt andfreshwater drum, have directly influenced the changes in parasitic fauna since1939.
The parasite of greatest concern at the present time is the micro-sporidian, Glugea hertwigi. It was first recorded in 1960 in rainbow smelt(Dechtiar 1965). Since then it has increased in occurrence; nearly 88% of thesmelt population was infected in 1971 (Nepszy and Dechtiar 1972). Anunusually severe postspawning mortality during May 1971 may have beenpartly due to the parasite load.
CHANGING FISH POPULATIONS
Commercial fish production from Lake Erie has been high throughoutthe history of the fishery. The annual production from Lake Erie has oftenequaled or exceeded the combined production of the other four Great Lakes.The lake’s warm shallow water, its diversity of habitats, and its greater organicrichness are undoubtedly responsible for its greater productivity.
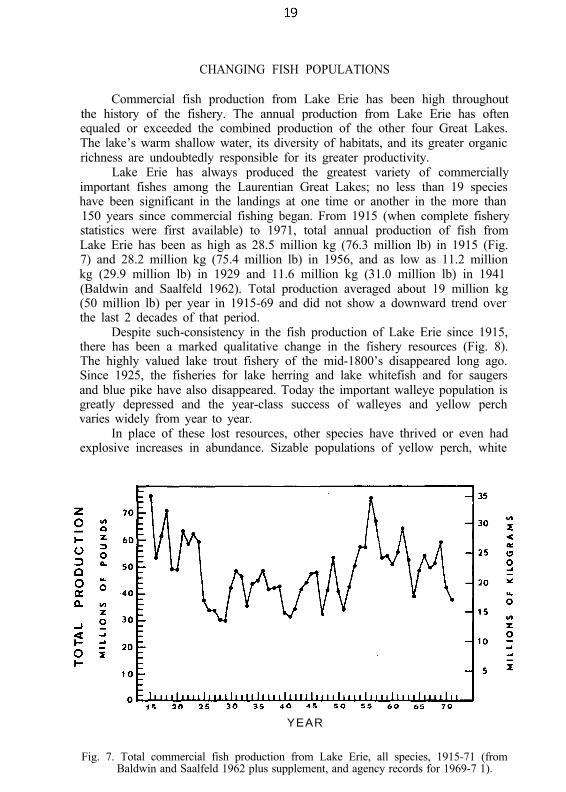
Lake Erie has always produced the greatest variety of commerciallyimportant fishes among the Laurentian Great Lakes; no less than 19 specieshave been significant in the landings at one time or another in the more than150 years since commercial fishing began. From 1915 (when complete fisherystatistics were first available) to 1971, total annual production of fish fromLake Erie has been as high as 28.5 million kg (76.3 million lb) in 1915 (Fig.7) and 28.2 million kg (75.4 million lb) in 1956, and as low as 11.2 millionkg (29.9 million lb) in 1929 and 11.6 million kg (31.0 million lb) in 1941(Baldwin and Saalfeld 1962). Total production averaged about 19 million kg(50 million lb) per year in 1915-69 and did not show a downward trend overthe last 2 decades of that period.
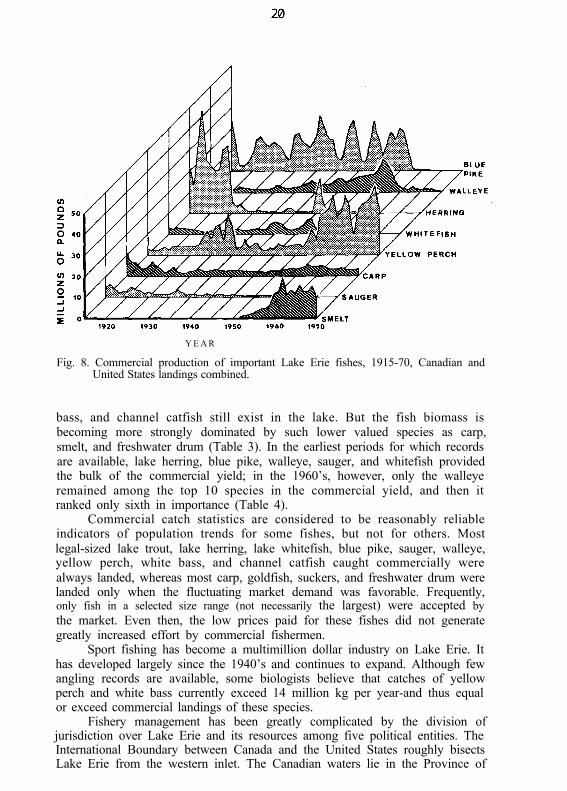
Despite such-consistency in the fish production of Lake Erie since 1915,there has been a marked qualitative change in the fishery resources (Fig. 8).The highly valued lake trout fishery of the mid-1800’s disappeared long ago.Since 1925, the fisheries for lake herring and lake whitefish and for saugersand blue pike have also disappeared. Today the important walleye population isgreatly depressed and the year-class success of walleyes and yellow perchvaries widely from year to year.
In place of these lost resources, other species have thrived or even hadexplosive increases in abundance. Sizable populations of yellow perch, white
YEAR
Fig. 7. Total commercial fish production from Lake Erie, all species, 1915-71 (fromBaldwin and Saalfeld 1962 plus supplement, and agency records for 1969-7 1).
Y E A R
Fig. 8. Commercial production of important Lake Erie fishes, 1915-70, Canadian andUnited States landings combined.
bass, and channel catfish still exist in the lake. But the fish biomass isbecoming more strongly dominated by such lower valued species as carp,smelt, and freshwater drum (Table 3). In the earliest periods for which recordsare available, lake herring, blue pike, walleye, sauger, and whitefish providedthe bulk of the commercial yield; in the 1960’s, however, only the walleyeremained among the top 10 species in the commercial yield, and then itranked only sixth in importance (Table 4).
Commercial catch statistics are considered to be reasonably reliableindicators of population trends for some fishes, but not for others. Mostlegal-sized lake trout, lake herring, lake whitefish, blue pike, sauger, walleye,yellow perch, white bass, and channel catfish caught commercially werealways landed, whereas most carp, goldfish, suckers, and freshwater drum werelanded only when the fluctuating market demand was favorable. Frequently,only fish in a selected size range (not necessarily the largest) were accepted bythe market. Even then, the low prices paid for these fishes did not generategreatly increased effort by commercial fishermen.
Sport fishing has become a multimillion dollar industry on Lake Erie. Ithas developed largely since the 1940’s and continues to expand. Although fewangling records are available, some biologists believe that catches of yellowperch and white bass currently exceed 14 million kg per year-and thus equalor exceed commercial landings of these species.
Fishery management has been greatly complicated by the division ofjurisdiction over Lake Erie and its resources among five political entities. TheInternational Boundary between Canada and the United States roughly bisectsLake Erie from the western inlet. The Canadian waters lie in the Province of
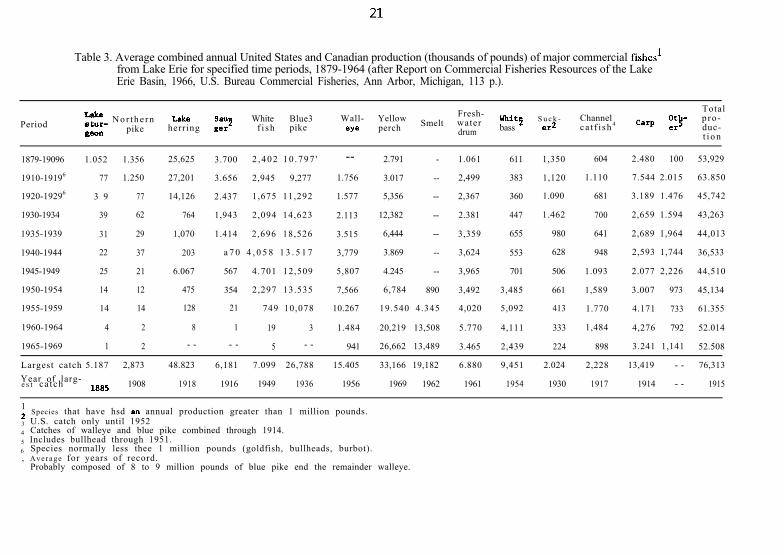
Table 3. Average combined annual United States and Canadian production (thousands of pounds) of major commercial fishes’from Lake Erie for specified time periods, 1879-1964 (after Report on Commercial Fisheries Resources of the LakeErie Basin, 1966, U.S. Bureau Commercial Fisheries, Ann Arbor, Michigan, 113 p.).
Period zrs N o r t h e r n L&e SalI? White Blue3 Wall- Yellow Fresh-Smelt water whit2 S u c k - Channel
gem pike herring g=r f i sh pike eY= perch bass er2 ca t f i sh 4
drum
Totalp ro -duc-t i o n
1879-19096 1.052 1.356
1910-19196 77 1.250
1920-19296 3 9 77
1930-1934 39 62
1935-1939 31 29
1940-1944 22 37
1945-1949 25 21
1950-1954 14 12
1955-1959 14 14
1960-1964 4 2
1965-1969 1 2
25,625
27,201
14,126
764
1,070
203
6.067
475
128
8
- -
3.700 2 ,402 10 .797 '
3.656 2,945 9,277
2.437 1,675 11,292
1,943 2,094 14,623
1.414 2,696 18,526
a 7 0 4 , 0 5 8 1 3 . 5 1 7
567 4.701 12,509
354 2,297 13.535
21 749 10,078
1 19 3
- - 5 - -
--
1.756
1.577
2.113
3.515
3,779
5,807
7,566
10.267
1.484
941
2.791 - 1.061 611 1,350 604 2.480 100 53,929
3.017 -- 2,499 383 1,120 1.110 7.544 2.015 63.850
5,356 -- 2,367 360 1.090 681 3.189 1.476 45,742
12,382 -- 2.381 447 1.462 700 2,659 1.594 43,263
6,444 -- 3,359 655 980 641 2,689 1,964 44,013
3.869 -- 3,624 553 628 948 2,593 1,744 36,533
4.245 -- 3,965 701 506 1.093 2.077 2,226 44,510
6,784 890 3,492 3,485 661 1,589 3.007 973 45,134
19.540 4.345 4,020 5,092 413 1.770 4.171 733 61.355
20,219 13,508 5.770 4,111 333 1,484 4,276 792 52.014
26,662 13,489 3.465 2,439 224 898 3.241 1,141 52.508
Largest catch 5.187 2,873 48.823 6,181 7.099 26,788 15.405 33,166 19,182 6.880 9,451 2.024 2,228 13,419 - - 76,313
Year of larg-e s t ca tch 18*5 1908 1918 1916 1949 1936 1956 1969 1962 1961 1954 1930 1917 1914 - - 1915
12 Species that have hsd M annual production greater than 1 million pounds.3 U.S. catch only until 19524 Catches of walleye and blue pike combined through 1914.5 Includes bullhead through 1951.6 Species normally less thee 1 million pounds (goldfish, bullheads, burbot)., Average for years of record.
Probably composed of 8 to 9 million pounds of blue pike end the remainder walleye.
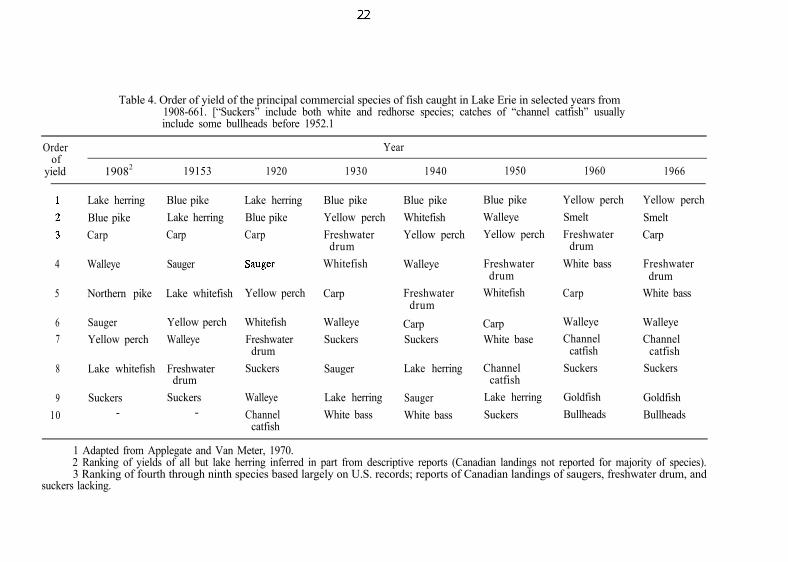
Table 4. Order of yield of the principal commercial species of fish caught in Lake Erie in selected years from1908-661. [“Suckers” include both white and redhorse species; catches of “channel catfish” usuallyinclude some bullheads before 1952.1
Orderof
yield 19082 19153 1920
Year
1930 1940 1950 1960 1966
Lake herring Blue pike Lake herring
Blue pike Lake herring Blue pike
Carp Carp Carp
Blue pike
Yellow perch
Freshwaterdrum
Whitefish
Blue pike Blue pike
Whitefish Walleye
Yellow perch Yellow perch
Yellow perch
Smelt
Freshwaterdrum
White bass
Yellow perch
Smelt
Carp
Walleye Sauger Walleye Freshwaterdrum
Whitefish
Freshwaterdrum
White bass
4
5 Northern pike Lake whitefish Yellow perch Carp Freshwaterdrum
CarpSuckers
Carp
6 Sauger Yellow perch
7 Yellow perch Walleye
Whitefish
Freshwaterdrum
Suckers
Walleye
SuckersCarpWhite base
Walleye WalleyeChannel Channel
catfish catfish
Suckers Suckers8 Lake whitefish Freshwaterdrum
Suckers-
Sauger Lake herring Channelcatfish
Lake herring
Suckers
Suckers-
9
10
Walleye
Channelcatfish
Lake herring Sauger
White bass White bass
Goldfish Goldfish
Bullheads Bullheads
1 Adapted from Applegate and Van Meter, 1970.2 Ranking of yields of all but lake herring inferred in part from descriptive reports (Canadian landings not reported for majority of species).3 Ranking of fourth through ninth species based largely on U.S. records; reports of Canadian landings of saugers, freshwater drum, and
suckers lacking.
Ontario and the United States waters are divided among four states: Ohio69%, Pennsylvania 15%, New York 12%, and Michigan 4%. Management ofLake Erie’s fishery resources is controlled by each agency within its respectivepolitical subdivision.
Presented below in synoptic form are the case histories of selectedspecies of fish in Lake Erie that have fluctuated substantially in abundance orare now unstable.
Sturgeon
Some observers (e.g. Harkness and Dymond 1961) have claimed thatoverexploitation was the only significant stress on the lake sturgeon popula-tion. Because sturgeon frequently caused heavy damage to fishing gear innearshore waters, they were customarily killed upon capture in the 1800’s toeradicate them. Since sturgeon mature very slowly-few spawn before reaching20 years of age-extensive removal could quickly destroy the resource. Thedestruction of river and marsh spawning areas during the 19th century by dam
construction and land drainage, however, must have also been important inprogressively reducing the numbers of sturgeon (Trautman 1957). Incidentalcatches, low since the early 1900’s, have declined even further since themid-1950’s.
Lake trout
In their review of records of fishery resources in Lake Erie before 1900,Applegate and Van Meter (1970) concluded that a moderately large popula-tion of lake trout once existed in Lake Erie. In a recent review of the laketrout of Lake Erie, Moenig (1971 MS) noted that Samuel De Champlain wrotein 1615-18 about the Huron Indians making gillnets to capture these trout.The nets were made of small thongs cut from deer skins as described bySamuel Hearne, 1769-72 (Rau 1884). Stones were used for weights andwooden strips for floats (Van Oosten 1936). During the 1700’s Europeansettlers around Lake Erie took lake trout with spears, simple seines, and hookand line (Moenig 1971 MS). By the mid-1800’s a substantial commercialfishery had developed, but it was generally restricted to the deeper waters inthe eastern half of the lake (Davies 1960). Certain records indicated that laketrout were rare in the western basin, uncommon in the western-central basinoff Cleveland, Ohio, and common in the eastern basin-although chieflyconfined to the deepest waters (Goode 1884). The earliest production datawere recorded in 1873, when 77,566 kg (171,000 lb) of lake trout werelanded in Ontario. New York, Pennsylvania, and Ontario reported a combinedcatch of 48,853 kg (107,700 lb) in 1885 and 55,756 kg (122,920 lb) in 1890.The steady decline in total production of lake trout continued in 1899, andfew lake trout were taken after the mid-1930’s. Native lake trout are extinctin Lake Erie today.
The reasons for such a rapid and virtually total demise of the lake trouthave been a matter of speculation, but Applegate and Van Meter (1970)concluded that the logical explanation is overexploitation. They noted that,despite the relatively light fishing pressure, this slow growing, late maturing,
long lived fish was highly vulnerable to exploitation, even though fishing waslargely restricted to the deeper waters of the eastern basin. Fishing strategychanged over the many decades of fruitful exploitation of the lake trout,starting in the mid-1800’s (Moenig 1971 MS). Gill nets were changed fromcotton to linen. Gill-net lifters were introduced, greatly increasing fishingefficiency. Boat engines were converted from steam to gasoline and diesel oil,and hulls from wood to steel. Moenig also indicted permissive fisherymanagement, which allowed overfishing for lake trout to continueunhampered for many years after the first signs of decline were seen in thelate 1800’s.
Although overfishing was the primary cause of the great decline of thelake trout, the ultimate biological extinction of the lake trout population inLake Erie since the heyday of the fishery was probably due to environmentalstresses placed on the species since the early 1900’s (e.g. siltation of spawninggrounds and destruction of summer oxygen regimes). Lake trout wereprobably more vulnerable than many other species to such stresses becauseLake Erie is at the southernmost extremity of their zoogeographical range(Trautman 1957).
Longjaw cisco
The longjaw cisco is a deep-water form inhabiting the cold waters of theeastern basin of Lake Erie. First reported by Scott and Smith (1962), it hasbeen rarely encountered in commercial landings. Only six longjaw ciscoes werefound among hundreds of lake herring in the commercial catch examined atPort Dover, Ontario, in 1946. A few additional specimens were caught inexperimental nets by the Great Lakes Fishery Laboratory in 1957. None havebeen reported since then. The few longjaw ciscoes present were probablyremoved by the fishery, with the remnants of lake herring and lake whitefish.
Lake herring
The lake herring was an extremely important commercial fish in LakeErie for many years, beginning in the 1880’s. Through the decades of thisfishery hundreds of millions of pounds have been landed. It has suffered asevere and progressive decline over the past 25 years, however, and is now ofno commercial importance.
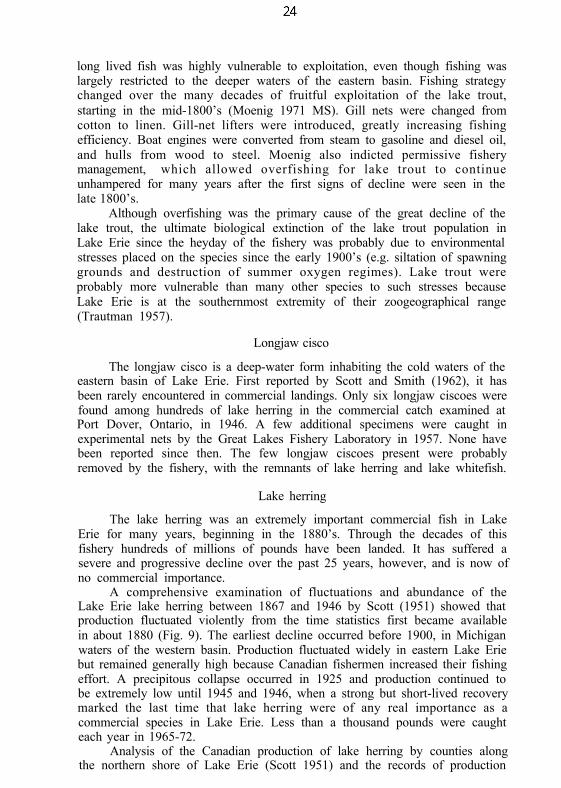
A comprehensive examination of fluctuations and abundance of theLake Erie lake herring between 1867 and 1946 by Scott (1951) showed thatproduction fluctuated violently from the time statistics first became availablein about 1880 (Fig. 9). The earliest decline occurred before 1900, in Michiganwaters of the western basin. Production fluctuated widely in eastern Lake Eriebut remained generally high because Canadian fishermen increased their fishingeffort. A precipitous collapse occurred in 1925 and production continued tobe extremely low until 1945 and 1946, when a strong but short-lived recoverymarked the last time that lake herring were of any real importance as acommercial species in Lake Erie. Less than a thousand pounds were caughteach year in 1965-72.
Analysis of the Canadian production of lake herring by counties alongthe northern shore of Lake Erie (Scott 1951) and the records of production
Y E A R
Fig. 9. Total commercial production of lake whitefish and lake herring from Lake Erie,1915-65. Average annual catch of each species in 1965-72 was less than 1,000 lb.
from the several states along the south side of the lake (Baldwin and Saalfeld1962) show that the largest commercial catches were made in the easternbasin and adjacent waters of the central basin. Lake herring were somewhatmore widely distributed in the 1880’s and 1890’s, when Michigan fishermenwere landing moderate quantities in the extreme western end of the westernbasin. By the early 1900’s, however, the catches in Michigan waters haddwindled to almost nil, despite continuing increases in production in theeastern half of the lake. Landings in Ohio (primarily from the central basin)and in Pennsylvania and New York (from the central and eastern basins)continued at good levels until the sudden drop in production in 1925.
Beeton and Edmondson (1972) related this progressive west to eastincrease in lake herring catches in Lake Erie to the levels of pollution oreutrophication, which are greatest in the western end and decrease progres-sively eastward. They further suggested that, as degradation of the habitatprogressed from west to east, lake herring were increasingly restricted to theeastern end of the lake, where they became more vulnerable to commercialfishing. Van Oosten (1930) presented data indicating that lake herring wereheavily concentrated in the deep water off Long Point in the eastern basin inthe crucial years of 1923 and 1924. He suggested that unusual storms duringthe spring of 1923 were responsible for developing this unusual concentration.During these 2 years commercial operators fished the population heavily; VanOosten (1930) stated, “the gill net fishermen followed and in the firm beliefthat the supply was extremely abundant they fished excessively for theciscoes, in many cases slaughtering them indiscriminately by the tons.” He
finished his analysis with the conclusion that the cisco was “commerciallyexterminated by overfishing.”
Scott (1951) who analyzed commercial catch statistics for lake herringin Lake Erie through 1945, concluded that periods of abundance were mainlydue to the presence of exceptionally strong year classes, like that of 1944. Hesuggested that the size of the spawning stock in the fall of 1943 must havebeen unusually small, since the 1943 commercial catch was only 55,000pounds, and that factors other than the size of spawning stock were thereforeclearly of major importance in determining the ultimate success of a year classof lake herring in Lake Erie. By “other factors” Scott meant food, predation,disease, excessive silting, mechanical damage due to storm-generated waveaction, and unfavorable temperatures that might influence year-class strengthduring incubation and the early post-hatching periods. He was, however,unable to prove that any one of these factors was strongly related toyear-class success.
Another argument (Powers et al. 1959) dealt with air temperatures inMarch 1921, which were the highest on record for this month up to thattime; they were equally high in March 1946 and 1947. Since an increase ofonly 1 C in water temperature during the last month of incubation advanceshatching by 7 days, and lake herring hatched at temperatures of 4 to 11 Cstarve within 18 days if they do not obtain proper food (John and Hasler1956) the high temperatures in 1921 may have been very significant. Perhaps,as Powers et al. (1959) suggested, the extremely warm spring in 1921 resultedin an unusually early hatch of lake herring before the normal spring pulse ofzooplankton had developed; the starvation of a large part of that year classmay have caused or contributed to the drastic decline in production in 1925.Perhaps the same process operated in 1946 and 1947, when no significantyear classes were produced despite the presence of a large spawning popula-tion from the strong 1944 year class.
Regier et al. (1969) observed that environmental conditions in thewestern and central basins, primarily those related to low oxygen tensions,have become unsuitable over the last 15 to 20 years for maintenance of thelake herring populations and that no viable recovery of this resource in LakeErie could have been expected.
Lake whitefish
The comprehensive examination by Lawler (1965) of fluctuations in thesuccess of year classes of Lake Erie whitefish and the probable causesprovided most of the material for the case history on this species.
Lake whitefish successfully spawned in the Detroit River and MaumeeBay of the western basin until about 1890 (Trautman 1957) but by 1900 theruns into the Detroit River had apparently been stopped by pollution. Theever-increasing silt load in the Maumee River began smothering whitefishspawning areas in Maumee Bay by 1900, and those populations wereessentially destroyed by 1918 (Trautman 1957), leaving only lake-spawningpopulations to support the expanding fishery.
For many years after 19 15, when complete catch records were firstavailable, whitefish landings from the open waters of Lake Erie were
characterized by alternating periods of high and low production (Fig. 9).Distinctive peaks were similar in form: The catch rose sharply from relativelylow levels, was high for 1 or 2 years, and then declined sharply. Analyses ofthe catches indicated that these peaks in production were produced by thepresence of unusually strong, isolated year classes in the fishery. Lawleridentified the three strongest year classes after 1923 as those of 1926, 1936,and (especially) 1944.
Intensive exploitation imposed considerable stress on lake whitefish, butonly one environmental factor-water temperature-seems to have beenimportant at that time. Lawler (1965) found no correlation between thesuccess of individual year classes and wind, precipitation, turbidity, or waterlevels. Neither could unusually successful year classes be attributed to the sizeof the spawning populations or to the planting of hatchery-raised fry.Year-class strength did, however, appear to be directly related to fall andspring water temperatures.
Since Lake Erie is at the southern limit of the distribution of lakewhitefish in North America, thermal conditions might be expected to besomewhat marginal for them. Watt (1962) stated that for species in generalthat live near the geographical boundaries of their range, climate may almostcompletely regulate numbers in the populations. Price (1940), reporting onthe embryonic development of whitefish to hatching at various constanttemperatures, stated that the optimum temperature range for incubation israther narrow, extending from 0.5 to 6.0 C. Higher incubation temperaturesreduced the length of fry at hatching, increased the percentage of abnormalembryos that hatched alive, and increased total mortality to hatching. Forexample, at 8 C only 19% of the eggs hatched, and 25% of these wereabnormal; at 10 C only 1% of the eggs hatched and half of these wereabnormal. Lawler (1965) pointed out that the narrow incubation temperaturerange of 0.5 to 6.0 C must limit successful populations of whitefish to waterswhere fall spawning temperatures and winter incubation temperatures are close.to the freezing point. When he analyzed the success of year classes ofwhitefish in relation to water temperatures during spawning, incubation, andhatching periods, he found that strong year classes were produced only whencertain favorable temperature conditions prevailed: “(1) Fall temperaturesshould drop early to 43 F (6.1 C), the temperature below which mostsuccessful spawning occurs; (2) the temperature decrease to the optimum fordevelopment should be steady and not fluctuating; (3) the spring temperatureshould increase slowly and late, thus providing a prolonged incubation periodat near optimum developmental temperatures.” The strong year classes of1926, 1936, and 1944 all developed under these favorable circumstances.
General climatic warming in the Great Lakes region has resulted in anincrease of 0.8 to 1.1 C in the mean annual temperatures of Lake Erie since1918 (Beeton 1961). Lawler (1965) concluded that if Lake Erie continued towarm, whitefish would be even more severely restricted to the deep, coldwater of the eastern basin and might become extinct.
Lake whitefish have certain important ecological characteristics incommon with the three other Lake Erie species discussed immediately above.They, like lake trout, longjaw cisco, and lake herring, are cold stenotherms atthe southern edge of their zoogeographical ranges. They require cold,
adequately oxygenated bottom waters for a summer habitat, and relativelysilt-free river or lake spawning areas for successful reproduction. And year-class success is typically more the result of favorable environmental conditionsthan of spawning stock size.
No one can deny that the populations of whitefish, as well as those ofthe other species, were heavily fished in Lake Erie. But the progressivesedimentation of river, bay, and open lake spawning areas may have imposedan even greater-perhaps ultimately critical stress-on many of these popula-tions, especially in the western basin. Obviously, many environmental changesadverse to the well-being of these species occurred during the 1800’s and early1900’s, especially in the drainage and lake shore areas. Consequently, exploita-tion should have been reduced by fishery managers to compensate forenvironmental stresses (Regier and Loftus 1972). Furthermore, progressivedecrease in DO in summer in the bottom waters of the western and centralbasins continually reduced oversummering habitat for these cold stenothermsand by 1955 or earlier the hypolimnion in the central basin became anoxic bythe end of summer stratification. It is not surprising that the last majorremnants of these populations were confined to the deep eastern basin (Regieret al. 1969) - the basin last affected by sedimentation, degradation of theoxygen regime, and intensive fishing.
Sauger
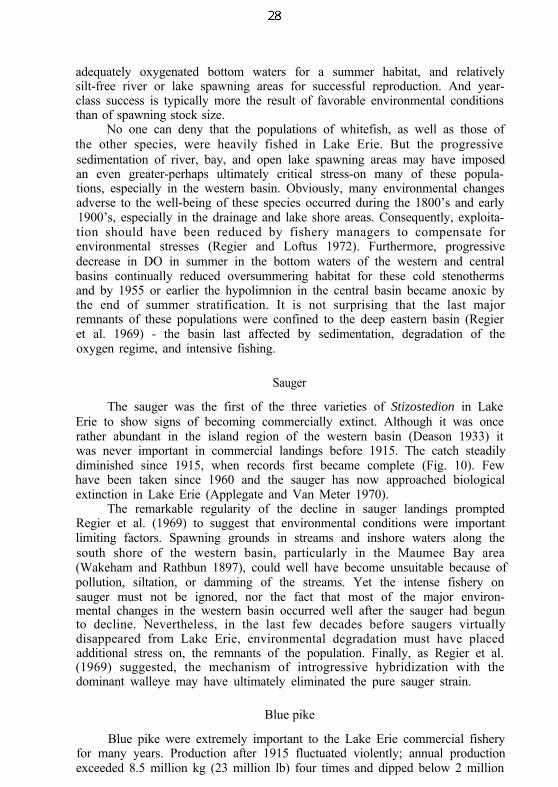
The sauger was the first of the three varieties of Stizostedion in LakeErie to show signs of becoming commercially extinct. Although it was oncerather abundant in the island region of the western basin (Deason 1933) itwas never important in commercial landings before 1915. The catch steadilydiminished since 1915, when records first became complete (Fig. 10). Fewhave been taken since 1960 and the sauger has now approached biologicalextinction in Lake Erie (Applegate and Van Meter 1970).
The remarkable regularity of the decline in sauger landings promptedRegier et al. (1969) to suggest that environmental conditions were importantlimiting factors. Spawning grounds in streams and inshore waters along thesouth shore of the western basin, particularly in the Maumee Bay area(Wakeham and Rathbun 1897), could well have become unsuitable because ofpollution, siltation, or damming of the streams. Yet the intense fishery onsauger must not be ignored, nor the fact that most of the major environ-mental changes in the western basin occurred well after the sauger had begunto decline. Nevertheless, in the last few decades before saugers virtuallydisappeared from Lake Erie, environmental degradation must have placedadditional stress on, the remnants of the population. Finally, as Regier et al.(1969) suggested, the mechanism of introgressive hybridization with thedominant walleye may have ultimately eliminated the pure sauger strain.
Blue pike
Blue pike were extremely important to the Lake Erie commercial fisheryfor many years. Production after 1915 fluctuated violently; annual productionexceeded 8.5 million kg (23 million lb) four times and dipped below 2 million
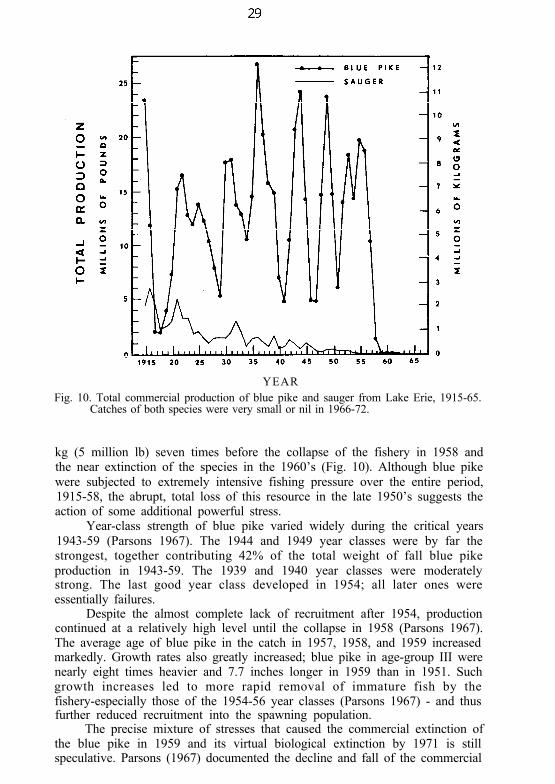
YEARFig. 10. Total commercial production of blue pike and sauger from Lake Erie, 1915-65.
Catches of both species were very small or nil in 1966-72.
kg (5 million lb) seven times before the collapse of the fishery in 1958 andthe near extinction of the species in the 1960’s (Fig. 10). Although blue pikewere subjected to extremely intensive fishing pressure over the entire period,1915-58, the abrupt, total loss of this resource in the late 1950’s suggests theaction of some additional powerful stress.
Year-class strength of blue pike varied widely during the critical years1943-59 (Parsons 1967). The 1944 and 1949 year classes were by far thestrongest, together contributing 42% of the total weight of fall blue pikeproduction in 1943-59. The 1939 and 1940 year classes were moderatelystrong. The last good year class developed in 1954; all later ones wereessentially failures.
Despite the almost complete lack of recruitment after 1954, productioncontinued at a relatively high level until the collapse in 1958 (Parsons 1967).The average age of blue pike in the catch in 1957, 1958, and 1959 increasedmarkedly. Growth rates also greatly increased; blue pike in age-group III werenearly eight times heavier and 7.7 inches longer in 1959 than in 1951. Suchgrowth increases led to more rapid removal of immature fish by thefishery-especially those of the 1954-56 year classes (Parsons 1967) - and thusfurther reduced recruitment into the spawning population.
The precise mixture of stresses that caused the commercial extinction ofthe blue pike in 1959 and its virtual biological extinction by 1971 is stillspeculative. Parsons (1967) documented the decline and fall of the commercial
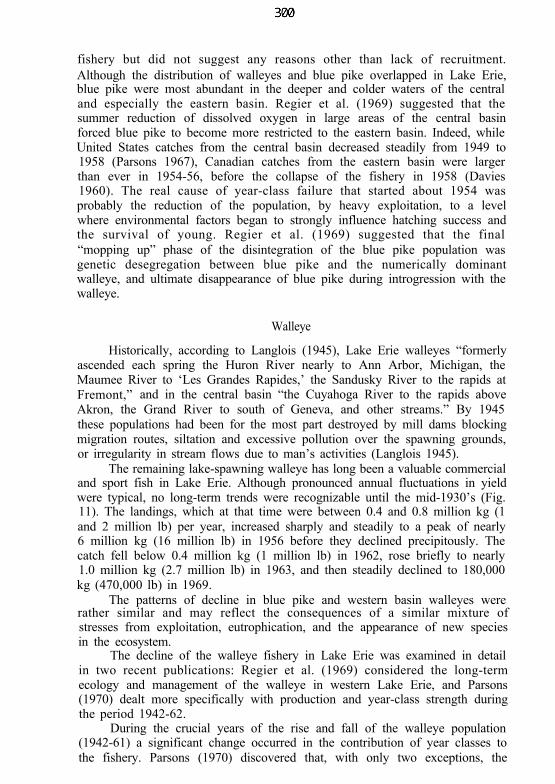
fishery but did not suggest any reasons other than lack of recruitment.Although the distribution of walleyes and blue pike overlapped in Lake Erie,blue pike were most abundant in the deeper and colder waters of the centraland especially the eastern basin. Regier et al. (1969) suggested that thesummer reduction of dissolved oxygen in large areas of the central basinforced blue pike to become more restricted to the eastern basin. Indeed, whileUnited States catches from the central basin decreased steadily from 1949 to1958 (Parsons 1967), Canadian catches from the eastern basin were largerthan ever in 1954-56, before the collapse of the fishery in 1958 (Davies1960). The real cause of year-class failure that started about 1954 wasprobably the reduction of the population, by heavy exploitation, to a levelwhere environmental factors began to strongly influence hatching success andthe survival of young. Regier et al. (1969) suggested that the final“mopping up” phase of the disintegration of the blue pike population wasgenetic desegregation between blue pike and the numerically dominantwalleye, and ultimate disappearance of blue pike during introgression with thewalleye.
Walleye
Historically, according to Langlois (1945), Lake Erie walleyes “formerlyascended each spring the Huron River nearly to Ann Arbor, Michigan, theMaumee River to ‘Les Grandes Rapides,’ the Sandusky River to the rapids atFremont,” and in the central basin “the Cuyahoga River to the rapids aboveAkron, the Grand River to south of Geneva, and other streams.” By 1945these populations had been for the most part destroyed by mill dams blockingmigration routes, siltation and excessive pollution over the spawning grounds,or irregularity in stream flows due to man’s activities (Langlois 1945).
The remaining lake-spawning walleye has long been a valuable commercialand sport fish in Lake Erie. Although pronounced annual fluctuations in yieldwere typical, no long-term trends were recognizable until the mid-1930’s (Fig.11). The landings, which at that time were between 0.4 and 0.8 million kg (1and 2 million lb) per year, increased sharply and steadily to a peak of nearly6 million kg (16 million lb) in 1956 before they declined precipitously. Thecatch fell below 0.4 million kg (1 million lb) in 1962, rose briefly to nearly1.0 million kg (2.7 million lb) in 1963, and then steadily declined to 180,000kg (470,000 lb) in 1969.
The patterns of decline in blue pike and western basin walleyes wererather similar and may reflect the consequences of a similar mixture ofstresses from exploitation, eutrophication, and the appearance of new speciesin the ecosystem.
The decline of the walleye fishery in Lake Erie was examined in detailin two recent publications: Regier et al. (1969) considered the long-termecology and management of the walleye in western Lake Erie, and Parsons(1970) dealt more specifically with production and year-class strength duringthe period 1942-62.
During the crucial years of the rise and fall of the walleye population(1942-61) a significant change occurred in the contribution of year classes tothe fishery. Parsons (1970) discovered that, with only two exceptions, the
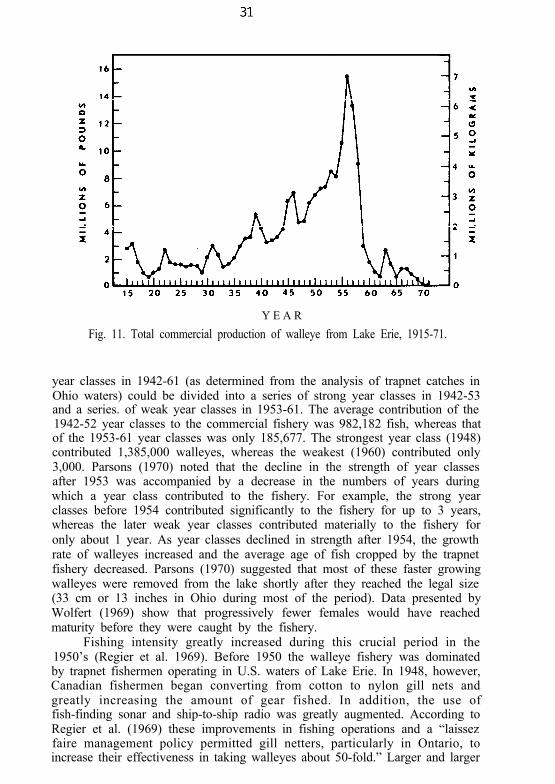
Y E A R
Fig. 11. Total commercial production of walleye from Lake Erie, 1915-71.
year classes in 1942-61 (as determined from the analysis of trapnet catches inOhio waters) could be divided into a series of strong year classes in 1942-53and a series. of weak year classes in 1953-61. The average contribution of the1942-52 year classes to the commercial fishery was 982,182 fish, whereas thatof the 1953-61 year classes was only 185,677. The strongest year class (1948)contributed 1,385,000 walleyes, whereas the weakest (1960) contributed only3,000. Parsons (1970) noted that the decline in the strength of year classesafter 1953 was accompanied by a decrease in the numbers of years duringwhich a year class contributed to the fishery. For example, the strong yearclasses before 1954 contributed significantly to the fishery for up to 3 years,whereas the later weak year classes contributed materially to the fishery foronly about 1 year. As year classes declined in strength after 1954, the growthrate of walleyes increased and the average age of fish cropped by the trapnetfishery decreased. Parsons (1970) suggested that most of these faster growingwalleyes were removed from the lake shortly after they reached the legal size(33 cm or 13 inches in Ohio during most of the period). Data presented byWolfert (1969) show that progressively fewer females would have reachedmaturity before they were caught by the fishery.
Fishing intensity greatly increased during this crucial period in the1950’s (Regier et al. 1969). Before 1950 the walleye fishery was dominatedby trapnet fishermen operating in U.S. waters of Lake Erie. In 1948, however,Canadian fishermen began converting from cotton to nylon gill nets andgreatly increasing the amount of gear fished. In addition, the use offish-finding sonar and ship-to-ship radio was greatly augmented. According toRegier et al. (1969) these improvements in fishing operations and a “laissezfaire management policy permitted gill netters, particularly in Ontario, toincrease their effectiveness in taking walleyes about 50-fold.” Larger and larger
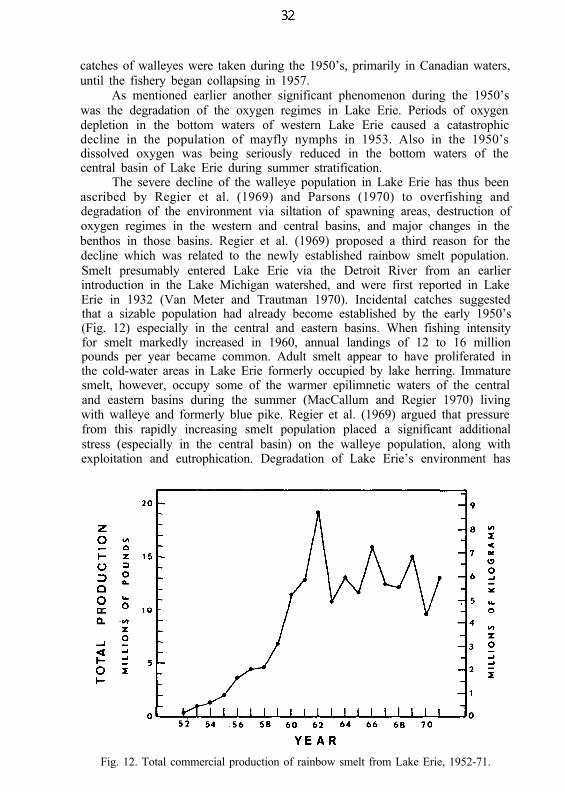
catches of walleyes were taken during the 1950’s, primarily in Canadian waters,until the fishery began collapsing in 1957.
As mentioned earlier another significant phenomenon during the 1950’swas the degradation of the oxygen regimes in Lake Erie. Periods of oxygendepletion in the bottom waters of western Lake Erie caused a catastrophicdecline in the population of mayfly nymphs in 1953. Also in the 1950’sdissolved oxygen was being seriously reduced in the bottom waters of thecentral basin of Lake Erie during summer stratification.
The severe decline of the walleye population in Lake Erie has thus beenascribed by Regier et al. (1969) and Parsons (1970) to overfishing anddegradation of the environment via siltation of spawning areas, destruction ofoxygen regimes in the western and central basins, and major changes in thebenthos in those basins. Regier et al. (1969) proposed a third reason for thedecline which was related to the newly established rainbow smelt population.Smelt presumably entered Lake Erie via the Detroit River from an earlierintroduction in the Lake Michigan watershed, and were first reported in LakeErie in 1932 (Van Meter and Trautman 1970). Incidental catches suggestedthat a sizable population had already become established by the early 1950’s(Fig. 12) especially in the central and eastern basins. When fishing intensityfor smelt markedly increased in 1960, annual landings of 12 to 16 millionpounds per year became common. Adult smelt appear to have proliferated inthe cold-water areas in Lake Erie formerly occupied by lake herring. Immaturesmelt, however, occupy some of the warmer epilimnetic waters of the centraland eastern basins during the summer (MacCallum and Regier 1970) livingwith walleye and formerly blue pike. Regier et al. (1969) argued that pressurefrom this rapidly increasing smelt population placed a significant additionalstress (especially in the central basin) on the walleye population, along withexploitation and eutrophication. Degradation of Lake Erie’s environment has
Fig. 12. Total commercial production of rainbow smelt from Lake Erie, 1952-71.
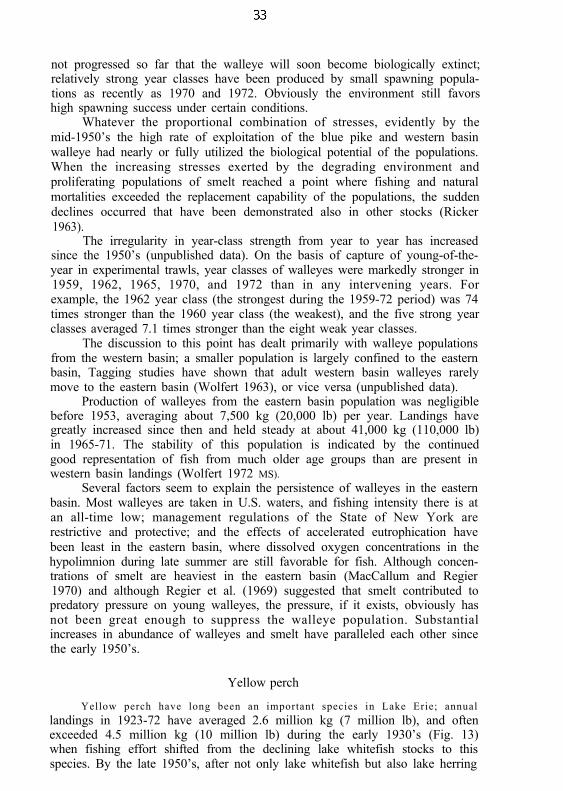
not progressed so far that the walleye will soon become biologically extinct;relatively strong year classes have been produced by small spawning popula-tions as recently as 1970 and 1972. Obviously the environment still favorshigh spawning success under certain conditions.
Whatever the proportional combination of stresses, evidently by themid-1950’s the high rate of exploitation of the blue pike and western basinwalleye had nearly or fully utilized the biological potential of the populations.When the increasing stresses exerted by the degrading environment andproliferating populations of smelt reached a point where fishing and naturalmortalities exceeded the replacement capability of the populations, the suddendeclines occurred that have been demonstrated also in other stocks (Ricker1963).
The irregularity in year-class strength from year to year has increasedsince the 1950’s (unpublished data). On the basis of capture of young-of-the-year in experimental trawls, year classes of walleyes were markedly stronger in1959, 1962, 1965, 1970, and 1972 than in any intervening years. Forexample, the 1962 year class (the strongest during the 1959-72 period) was 74times stronger than the 1960 year class (the weakest), and the five strong yearclasses averaged 7.1 times stronger than the eight weak year classes.
The discussion to this point has dealt primarily with walleye populationsfrom the western basin; a smaller population is largely confined to the easternbasin, Tagging studies have shown that adult western basin walleyes rarelymove to the eastern basin (Wolfert 1963), or vice versa (unpublished data).
Production of walleyes from the eastern basin population was negligiblebefore 1953, averaging about 7,500 kg (20,000 lb) per year. Landings havegreatly increased since then and held steady at about 41,000 kg (110,000 lb)in 1965-71. The stability of this population is indicated by the continuedgood representation of fish from much older age groups than are present inwestern basin landings (Wolfert 1972 MS).
Several factors seem to explain the persistence of walleyes in the easternbasin. Most walleyes are taken in U.S. waters, and fishing intensity there is atan all-time low; management regulations of the State of New York arerestrictive and protective; and the effects of accelerated eutrophication havebeen least in the eastern basin, where dissolved oxygen concentrations in thehypolimnion during late summer are still favorable for fish. Although concen-trations of smelt are heaviest in the eastern basin (MacCallum and Regier1970) and although Regier et al. (1969) suggested that smelt contributed topredatory pressure on young walleyes, the pressure, if it exists, obviously hasnot been great enough to suppress the walleye population. Substantialincreases in abundance of walleyes and smelt have paralleled each other sincethe early 1950’s.
Yellow perch
Yellow perch have long been an important species in Lake Erie; annuallandings in 1923-72 have averaged 2.6 million kg (7 million lb), and oftenexceeded 4.5 million kg (10 million lb) during the early 1930’s (Fig. 13)when fishing effort shifted from the declining lake whitefish stocks to thisspecies. By the late 1950’s, after not only lake whitefish but also lake herring
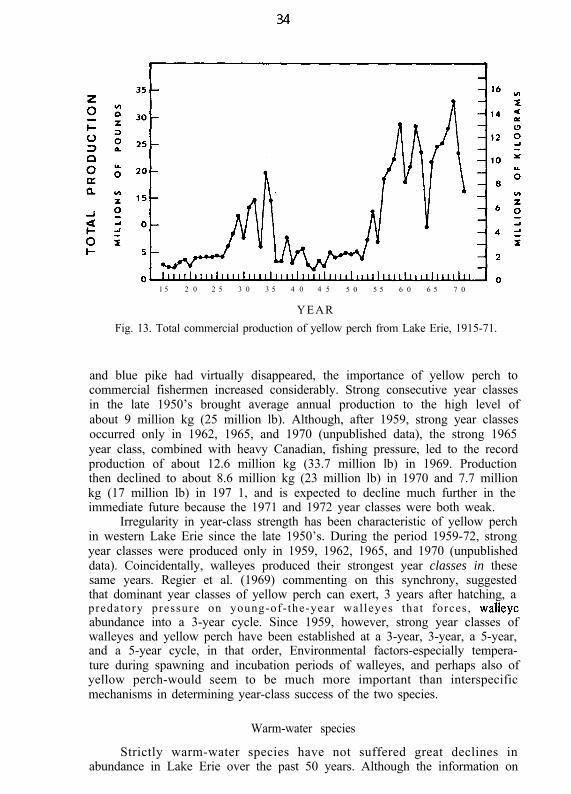
1 5 2 0 2 5 3 0 3 5 4 0 4 5 5 0 5 5 6 0 6 5 7 0
YEAR
Fig. 13. Total commercial production of yellow perch from Lake Erie, 1915-71.
and blue pike had virtually disappeared, the importance of yellow perch tocommercial fishermen increased considerably. Strong consecutive year classesin the late 1950’s brought average annual production to the high level ofabout 9 million kg (25 million lb). Although, after 1959, strong year classesoccurred only in 1962, 1965, and 1970 (unpublished data), the strong 1965year class, combined with heavy Canadian, fishing pressure, led to the recordproduction of about 12.6 million kg (33.7 million lb) in 1969. Productionthen declined to about 8.6 million kg (23 million lb) in 1970 and 7.7 millionkg (17 million lb) in 197 1, and is expected to decline much further in theimmediate future because the 1971 and 1972 year classes were both weak.
Irregularity in year-class strength has been characteristic of yellow perchin western Lake Erie since the late 1950’s. During the period 1959-72, strongyear classes were produced only in 1959, 1962, 1965, and 1970 (unpublisheddata). Coincidentally, walleyes produced their strongest year classes in thesesame years. Regier et al. (1969) commenting on this synchrony, suggestedthat dominant year classes of yellow perch can exert, 3 years after hatching, apredatory pressure on young-of-the-year walleyes that forces, w&yeabundance into a 3-year cycle. Since 1959, however, strong year classes ofwalleyes and yellow perch have been established at a 3-year, 3-year, a 5-year,and a 5-year cycle, in that order, Environmental factors-especially tempera-ture during spawning and incubation periods of walleyes, and perhaps also ofyellow perch-would seem to be much more important than interspecificmechanisms in determining year-class success of the two species.
Warm-water species
Strictly warm-water species have not suffered great declines inabundance in Lake Erie over the past 50 years. Although the information on
these species is scanty, it appears that the populations of white bass, channelcatfish, brown bullheads, gizzard shad, alewives, spottail shiners, emeraldshiners, carp, and goldfish have remained fairly stable during at least the lastfew decades.
The spawning habits of these species allow them to avoid or at leastlargely minimize the stresses of sedimentation and low oxygen that affectcold-water bottom spawners. These fish usually spawn in water shallower than3 m. Some species construct nests, and fan and guard the eggs duringincubation; others lay their eggs on vegetation off the mud bottom; and stillothers lay semibuoyant eggs that incubate off bottom, in the water column(general references are Breder and Rosen 1966; Carlander 1969; Scott 1967).The short incubation period of the eggs of most of these species-often lessthan 5 days-also minimizes exposure to sedimentation, low oxygen, disease,and predation.
The freshwater drum appears to be significantly favored by the changingenvironmental conditions or the declines in populations of predators andcompetitors. Its numbers have steadily increased in western Lake Erie sincethe late 1950’s. The eggs are semibuoyant and float at or near the watersurface, and thus avoid potentially deleterious conditions on the lake bottom.Newly hatched larvae also tend to remain near the surface. Fishing pressure isalmost nil because freshwater drum have little or no commercial value atpresent, and scant appeal to sports fishermen.
Colonizing species
The sea lamprey was first reported in Lake Erie in 1921 (Van Meter andTrautman 1970), evidently having invaded the lake via the Welland Canal.Although selective predation by the sea lamprey has decimated the popula-tions of certain valuable commercial fishes in Lakes Superior, Michigan, andHuron (Smith 1968), the sea lamprey has never become abundant nor aserious mortality factor in Lake Erie; evidently the dearth of suitablespawning tributaries has restricted its numbers.
The alewife was first reported in Lake Erie in 1931 (Dymond 1932) andapparently came from Lake Ontario via the Welland Canal (Smith 1970). Ithas never become numerous in Lake Erie, presumably because of theabundance of predators or the low temperature of the water in the winter andspring. Although certain predators have greatly declined (e.g. walleye and bluepike), the freshwater drum preys on alewives (Price 1963). Smith (1968)noted that deep-water regions where alewives could concentrate in the winterto avoid unfavorably cold water are limited in Lake Erie, and P. J. Colby(personal communication) suggested that alewives very likely suffer cold-waterstress in many areas of Lake Erie during the spring thaw and turnover.
Although various salmonids have been introduced, mostly as fry, intoLake Erie since 1870, no important naturally reproducing populations havedeveloped, Apparently one or more of the following factors were responsible:too few fish, or fish of poor quality, of the wrong size, or lackinghome-stream imprinting, planted at the wrong site or depth or in the wrongseason. Small numbers of lake-run rainbow trout reproduce in several NewYork streams. After a 30-year interruption in salmon introductions in Lake
Erie, about 115,000 fingerling coho salmon, 5-7 inches long, were released intributary streams along the south shore in spring 1968, 227,000 in 1969, and526,000 in 1970. The justification for these introductions of high-value fishescentered on the need for a terminal predator in Lake Erie to augment the lostor diminished populations of blue pike and walleye, and to improve sportfishing.
The results of this introduction of coho salmon are not yet clear. Asmany as 25% of the fish in small individual plantings have survived to becaught by anglers or to return to streams to spawn. Growth has beenrelatively good; spawning adults averaged nearly 6 pounds after 2 years in thelake. A summer sport fishery has not developed in United States waters,however, because the salmon migrate to the deep cold waters along theCanadian shore during the summer (Russell Scholl, personal communication).Another factor of possible consequence is the relatively higher turbidity inLake Erie than in Lake Michigan, and the resulting lower visibility of baits orlures. Little information exists on the effects of coho salmon on resident fishpopulations, although it is known that they feed extensively on emeraldshiners and smelt.
SUMMARY
The fish community of Lake Erie has changed dramatically over the pastcentury. The valuable lake trout, lake sturgeon, lake herring, lake whitefish,blue pike, and sauger have virtually disappeared. The walleye population inthe western basin has collapsed, the yellow perch are in decline. Thus thesalmonids were the first to be overstressed, then the coregonids, and nowfinally some of the percids. The nearshore waters remain favorable forcentrarchids (smallmouth bass) and serranids (white bass) and are becomingmore favorable for sciaenids (freshwater drum) and cyprinids (spottail shiners).Other species, such as carp, and the colonizing alewives and (especially) smelt,have shown recent increases.
The extensive changes in fish populations have resulted from four typesof stress: exploitation, changes in the watershed, nutrient loading, and theintroduction of new species.
All of the disappearing resources have been subjected to intensiveexploitation, and this must be considered the primary long-term stress. Itseffects have been direct and visible. It was probably the only stress thatcaused the initial and primary decline of the sturgeon and lake trout.
Changes in the watershed were especially drastic during the 1800’s.Removal of the forest and grassland cover for the development of farmlandpermitted widespread erosion. Stream and bay spawning grounds of sturgeon,walleye, lake whitefish, northern pike, muskellunge, and other species weresilted, and luxuriant vegetation in the bays was eliminated by the turbidwater. Dozens of mill dams built during the 1800’s blocked lake stocks ofsturgeon, walleye, and white bass from some of their historical spawning areas.These changes in the watershed destroyed some populations and severelystressed others.
Nutrient loading was a consequence of cultural eutrophication. Duringthe 1900’s it resulted in greatly increased production of algae and then to thedepletion of dissolved oxygen. This depletion was accompanied by thedestruction of dense populations of Hexagenia in the western and centralbasins and the loss of oversummering sanctuaries in the hypolimnion for suchcold stenotherms as lake herring, lake whitefish, lake trout, and blue pike.Although this stress developed slowly and subtly, its damage to the fishcommunity may have been as great as, or greater than, intensive exploitation.Only marked reductions in nutrient loading of Lake Erie will restore dissolvedoxygen in the hypolimnion to levels high enough to support fish life.
The fourth stress on the indigenous fishery resources-the introductionor invasion of new species-has not been particularly damaging in Lake Erie.The alewife and sea lamprey have never become abundant. Carp and goldfishhave thrived only in the western basin. Recently introduced coho salmon haveshown fair growth and survival; at current stocking rates, however, their effecton resident fish populations is essentially unknown but probably small.Among the new species, smelt may have had the greatest impact, but whethertheir total long-term effect will be positive or negative is still open toquestion.
ACKNOWLEDGEMENTS
I thank the following colleagues for reviewing the manuscript andoffering constructive comments: J. F. Carr, P. H. Eschmeyer, J. L. Forney, J.H. Kutkuhn, K. H. Loftus, P. C. Neth, J. W. Parsons, H. A. Regier, S. H.Smith, H. D. Van Meter, and D. R. Wolfert.
LITERATURE CITED
ALLEY, W. P., and C. F. POWERS.
1970. Dry weight of the macrobenthos as an indicator of eutrophication of theGreat Lakes. Proc. Conf. Great Lakes Res. (Int. Ass. Great Lakes Res.) 13:595-600.
APPLEGATE, V. C., and H. D. VAN METER.
1970. A brief history of commercial fishing in Lake Erie. U.S. Fish Wildl. Serv. Fish.Leafl. 630. 28 p.
ARNOLD, D. E.
1969. The ecological decline of Lake Erie. N.Y. Fish Game J. 16: 27-45.
BALDWIN, N. S., and R. W. SAALFELD.
1962. Commercial fish production in the Great Lakes, 1867-1960. (plus mimeo-graphed supplement 1961.68). Great Lakes Fish. Comm. Tech. Rep. 3: 166 p.
BANGHAM, R. V., and G. W. HUNTER.
1939. Studies on fish parasites of Lake Erie: distribution studies. Zoologica 24:385-448.
BEETON, A. M.
1961. Environmental changes in Lake Erie. Trans. Amer. Fish. Soc. 90: 153-159.
1963. Limnological survey of Lake Erie 1959 and 1960. Great Lakes Fish. Comm.Tech. Rep. 6: l-32.
1965. Eutrophication of the St. Lawrence Great Lakes. Limnol. Oceanogr. 10:240-254.
1966. Indices of Great Lakes eutrophication. Univ. of Mich. Great Lakes Res. Div.Publ. 15: l-8.
1969. Changes in the environment and biota of the Great Lakes, p. 150-187. InEutrophication: causes, consequences, correctives. National Academy ofSciences, Washington, D.C.
BEETON, A. M., and W. T. EDMONDSON.
1972. The eutrophication problems. J. Fish. Res. Bd. Canada 29: 673-682.
BRADSHAW, A. S.
1964. The crustacean zooplankton picture: Lake Erie 1939-49-59; Cayuga1910-51-61. Verh. Int. Verein. Limnol. 15: 700-708.
BREDER, C. M., JR., and D. E. ROSEN.
1966. Modes of reproduction in fishes. Natural History Press, New York. 941 p.
BRINKHURST, R. O., A. L. HAMILTON, and H. B. HERRINGTON.
1968. Components of the bottom fauna of the St. Lawrence Great Lakes. Univ. ofToronto, Great Lakes Inst. PR33. 50 p.
BRITT, N. W.
1955a. Stratification in western Lake Erie in summer of 1953; effects on theHexagenia (Ephemeroptera) population. Ecology 36: 239-244.
1955b. Hexagenia (Ephemeroptera) population recovery in western Lake Eriefollowing the 1953 catastrophe. Ecology 36: 520-522.
BRITT, N. W., E. J. SHOCK, and K. R. SMITH.
1968. Record low dissolved oxygen in the island area of Lake Erie. Ohio .I. Sci.68(3): 175-179.
BURNS, N. M., and C. ROSS.
1971. “Project Hypo”: Discussion of findings. Proc. Conf. Great Lakes Res. (Int.Ass. Great Lakes Res.) 14: 761-767.
CARLANDER, K. D.
1969. Handbook of freshwater fishery biology. 3rd ed. The Iowa State Univ. Press.Ames, Iowa. 752 p.
CARR, J. F.
1962. Dissolved oxygen in Lake Erie, past and present. Univ. of Mich. Great LakesRes. Div. Publ. 9: l-14.
CARR, J. F., V. C. APPLEGATE, and M. KELLER.
1965. A recent occurrence of thermal stratification and low dissolved oxygen inwestern Lake Erie. Ohio J. Sci. 65: 319-327.
CARR, J. F., and J. K. HILTUNEN.
1965. Changes in the bottom fauna of western Lake Erie from 1930 to 1961.Limnol. Oceanogr. 10: 551-569.
CHANDLER, D. C.
1940. Limnological studies of western Lake Erie. I. Plankton and certain physical-chemical data of the Bass Islands Region, from September, 1938, toNovember, 1939. Ohio J. Sci. 40: 291-336.
1942. Limnological studies of western Lake Erie. III. Phytoplankton and physical-chemical data from November, 1939, to November, 1940. Ohio J. Sci. 42:24-44.
1944. Limnological studies of western Lake Erie. IV. Relationship of limnologicaland climatic factors to the phytoplankton of 1941. Trans. Amer. Microsc.Soc. 43: 203.236.
CHAWLA, V. K.
1971. Changes in the water chemistry of Lakes Erie and Ontario. Bull. Buffalo Soc.Nat. Sci. 25: 31-64.
CURL, H., JR.
1959. The origin and distribution of phosphorus in western Lake Erie. Limnol.Oceanogr. 4: 66-76.
DAVIES, J. W.
1960. Canadian commercial fish landings of Eastern, Central and Western Lake Erie,1870.1958. Ontario Dep. Lands Forests Rep. 83 p. (Mimeo.)
DAVIS, C. C.
1964. Evidence for the eutrophication of Lake Erie from Phytoplankton records.Limnol. Oceanogr. 9: 275-283.
1966. Biological research in the central basin of Lake Erie. Univ. Mich. Great LakesRes. Div., Publ. 15: 18-26.
1968. The July 1967 zooplankton of Lake Erie. Proc. Conf. Great Lakes Res. (Int.Ass. Great Lakes Res.) 11: 61-75.
1969. Seasonal distribution, constitution, and abundance of zooplankton in LakeErie. J. Fish. Res. Bd. Canada 26: 2459-2476.
DEASON, H. J.
1933. Preliminary report on the growth rate, dominance and maturity of thepike-perches (Stizostedion) of Lake Erie. Trans. Amer. Fish. Soc. 63: 348-360.
DECHTIAR, A. 0.
1965. Preliminary observations on Clugea hertwigi Weissenberg, 1911 (Microsporidia;Glugeidas) in American Smelt, Osmerus mordax (Mitchill) from Lake Erie.Can. Fish Cult. 34: 35-38.
1972. New parasite records for Lake Erie fish. Great Lakes Fish. Comm.,Tech. Rep.17: 20 p.
DOBSON, H. H., and M. GILBERTSON.1971. Oxygen depletion in the hypolimnion of the central basin of Lake Erie, 1929
to 1970. Proc. Conf. Great Lakes Res. (Int. Ass. Great Lakes Res.) 14:743-748.
DYMOND, J. R.1932. Records of the alewife and steelhead (rainbow trout) from Lake Erie. Copeia
1932: 32-33.
FEDERAL WATER POLLUTION CONTROL ADMINISTRATION.
1968. Lake Erie environmental summary, 1963-64. U.S. Dep. Interior, Great LakesRegion, Cleveland Program Office. 170 p.
FISH, C. J., and ASSOCIATES.
1960. Limnological survey of eastern and central Lake Erie, 1928-29. U.S. FishWildl. Serv., Spec. Sci. Rep. Fish. 334. 198 p.
GANNON, .I. E., and A. M. BEETON.
1971. The decline of the large zooplankter, Limnocalanus macrurus Sars (Copepoda:Calanoida), in Lake Erie. Proc. Conf. Great Lakes Res. (Int. Ass. Great LakesRes.) 14: 27-38.
GILBERTSON, J., H. H. DOBSON, and T. R. LEE.
1972. Phosphorus and hypolimnial dissolved oxygen in Lake Erie, p. 141-145. In N.M. Burns and C. Rose [ed.] Project Hypo: an intensive study of the Lake Eriecentral basin hypolimnion and related surface water phenomena. CanadaCentre for Inland Waters, Paper No. 6. U.S. Environmental Protection AgencyTech. Rep. TS-05-7 l-208-24.
GOODE, G. B.
1884. Natural history of useful aquatic animals. Part III. The food fishes of theUnited States, p. 163-682 In G. B. Goode [ed.] The fisheries and fisheryindustries of the United States, Section I-Text. U.S. Comm. Fish and Fish.(U.S. Gov. Print. Off.), Washington, D.C. xxxiv + 895 p.
HAHN, M. H.
1969. Qualitative and quantitative analyses of plankton diatoms: Bass Island area,Lake Erie, 1938-1965, including synoptic surveys of 1960-1963. Bull. OhioBiol. Surv. 3(1): 1-208.
HARKNESS, W. J. K., and J. R. DYMOND.
1961. The lake sturgeon: the history of its fishery and problems and conservation.Ontario Dep. Lands and Forests. 121 p.
HARLOW, G. L.
1966. Major sources of nutrients for algal growth in western Lake Erie. Proc. Conf.Great Lakes Res. (Int. Ass. Great Lakes Res.) 9: 389-394.
HARTMAN, W. L.
1970. Resource crises in Lake Erie. The Explorer (Natural Science Museum, Cleve-land, Ohio) 12: 6-11.
1972. Lake Erie: effects of exploitation, environmental changes, and new species onthe fishery resources. J. Fish. Res. Bd. Canada 29: 899-912.
HOUGH, J. L.
1958. Geology of the Great Lakes. Univ. of Illinois Press, Urbana. 313 p.
HUBSCHMAN, J. H.
1960. Relative daily abundance of planktonic Crustacea in the Island Region ofwestern Lake Erie. Ohio J. Sci. 60: 335-340.
INTERNATIONAL JOINT COMMISSION.
1969. Report of the International Joint Commission, United States and Canada onthe pollution of Lake Erie, Lake Ontario and the international section of theSt. Lawrence River. Vol. 2 Lake Erie. 316 p.
JOHN, K. R., and A. D. HASLER.1956. Observations on some factors affecting the hatching of eggs and the survival of
young shallow-water cisco, Leucichthys artedi Le Sueur, in Lake Mendota,Wisconsin. Limnol. Oceanogr. 1: 176-194.
KRAMER, .I. R.
1961. ‘Chemistry of Lake Erie. Great Lakes Res. Div., Inst. Sci. and Tech., Univ. ofMich., Publ. 7: 27-56.
LANGLOIS, T. H.
1941. Two processes operating for the reduction in abundance or elimination of fishspecies from certain types of water areas. Trans. North Amer. Wildl. Conf. 6:189-201.
1945. Water, fishes, and cropland management. Trans. North Amer. Wildl. Conf. 10:190-196.
LAWLER, G. H.
1965. Fluctuations in the success of year-classes of whitefish populations withspecial reference to Lake Erie. .I. Fish. Res. Bd. Canada 22: 1197-1227.
LEWIS, C. F. M., T. W. ANDERSON, and A. A. BERTI.
1966. Geological and palynological studies of early Lake Erie deposits. Great LakesRes. Div. Univ. of Mich. Publ. 15: 176-191.
LEWIS, S. J.
1906. Quality of water in the upper Ohio River basin and at Erie, Pa. U.S. Geol.Surv., Water-supply Irrigation Pap. 161. 114 p.
MacCALLUM, W. R., and H. A. REGIER.
1970. Distribution of smelt, Osmerus mordax, and the smelt fishery in Lake Erie inthe early 1960’s. J. Fish. Res. Bd. Canada 27: 1823-1846.
MOENIG, J.
1971. The lake trout of Lake Erie: a historical review. Univ. of Toronto, Ont. (MS)
NEPSZY, S. J., and A. 0. DECHTIAR.
1972. Occurrence of Glugea hertwigi in Lake Erie rainbow smelt (Osmerus mordax)and associated mortality of adult smelt. J. Fish. Res. Bd. Canada 29:1639-1641.
OWNBEY, C. R., and D. A. KEE.
1967. Chlorides in Lake Erie. Proc. Conf. Great Lakes Res. (Int. Ass. Great LakesRes.) 10: 382-389.
PARSONS, J. W.
1967. Contributions of year-classes of blue pike to the commercial fishery of LakeErie, 1943-59. J. Fish. Res. Bd. Canada 24: 1035-1066.
1970. Walleye fishery of Lake Erie in 1943-62 with emphasis on contributions ofthe 1942-61 year-classes. J. Fish. Res. Bd. Canada 27: 1475-1489.
PATALAS, K.
1972. Crustacean plankton and the eutrophication of St. Lawrence Great Lakes. J.Fish. Res. Bd. Canada 29: 1451-1462.
PINSAK, A. P.
1967. Water transparency in Lake Erie. Proc. Conf. Great Lakes Res. (Int. Ass. GreatLakes Res.) 10: 309-321.
PRICE, J. W.
1940. Time-temperature relations in the incubation of the whitefish, Coregonusclupeaformis (Mitchill). J. Gen. Physiology 23: 449468.
1963. A study of the food habits of some Lake Erie fishes. Bull. Ohio State Geol.Surv. 11(1):89 p.
POWERS, C. F., D. L. JONES, P. C. MUNDINGER, and J. C. AYERS.
1959. Exploration of collateral data potentially applicable to Great Lakes hydro-graphy and fisheries. Final Rep., Phase II. U.S. Fish Wildl. Serv. Contract No.14-19-008-9381. Great Lakes Res. Inst., Univ. of Mich. 164 p.
POWERS, C. F., and A. ROBERTSON.
1966. The aging Great Lakes. Sci. Amer. 215: 95-100, 102, 104.
RAU, C.1884. Prehistoric fishing in Europe and North America. Smithsonian Contrib. to
Knowl. 25: 342 p.
RAWSON, D. S.
1953. The bottom fauna of Great Slave Lake. J. Fish. Res. Bd. Canada 25: 254-283.
REGIER, H. A., V. C. APPLEGATE, and R. A. RYDER.
1969. The ecology and management of the walleye in western Lake Erie. GreatLakes Fish. Comm. Tech. Rep. 15. 101 p.
REGIER, H. A., and K. H. LOFTUS.
1972. Effects of fisheries exploitation on salmonid communities in oligotrophiclakes. J. Fish. Res. Bd. Canada 29: 959-968.
RICKER, W. E.
1963. Big effects from small causes: two examples from fish populations dynamics.J. Fish. Res. Bd. Canada 20: 257-284.
SCOTT, W. B.
1951. Fluctuations in abundance of the Lake Erie cisco (Leucichthys artedy)population. Contrib. Roy. Ont. Mus. Zool. 32. 41 p.
1967. Freshwater fishes of eastern Canada. 2nd ed. Univ. of Toronto Press, Toronto,Ont. 137 p.
SCOTT, W. B., and S. H. SMITH.
1962. The occurrence. of the longjaw cisco, Leucichthys alpenae, in Lake Erie. J.Fish. Res. Bd. Canada 19: 1013-1023.
SMITH, S. H.1968. Species succession and fishery exploitation in the Great Lakes. J. Fish. Res.
Bd. Canada 25: 667-693.1970. Species interactions of the alewife in the Great Lakes. Trans. Amer. Fish. Soc.
99: 754-765.
THOMAS, F. .I. F.
1954. Industrial water resources of Canada. Upper St. Lawrence River-central GreatLakes drainage basin in Canada. Can. Dep. Mines Tech. Surv., Water Surv.Rep. No. 3, Mines Branch Rep. 837. 212 p.
TRAUTMAN, M. B.
1957. The fishes of Ohio. Ohio State Univ. Press, Columbus, Ohio. xviii + 683 p.
TREWARTHA, G. T.
1954. An introduction to climate. McGraw-Hill Book Co., New York. 402 p.
U.S. PUBLIC HEALTH SERVICE.
1965. Report on pollution of Lake Erie and its tributaries. I. Lake Erie. U.S. PublicHealth Serv., Div. Water Supply and Pollut. Control. 50 p.
VAN METER, H. D., and M. B. TRAUTMAN.
1970. An annotated list of the fishes of Lake Erie and its tributary waters exclusiveof the Detroit River. Ohio J. Sci. 70: 65-78.
VAN OOSTEN, J.
1930. The disappearance of the Lake Erie cisco-a preliminary report. Trans. Amer.Fish. Soc. 60: 204-214.
1936. Fishing industry of the Great Lakes. Memo I-63, U.S. Bur. Fish. 13 p. (revised1940).
1948. Turbidity as a factor in the decline of Great Lakes fishes with specialreference to Lake Erie. Trans. Amer. Fish. Soc. 75: 281-322.
VEAL, D. M., and D. S. OSMOND.
1968. Bottom fauna of the western basin and near-shore Canadian waters of LakeErie. Proc. Conf. Great Lakes Res. (Int. Ass. Great Lakes Res.) 11: 151-160.
VERBER, J. L.
1957. Bottom deposits of western Lake Erie. Ohio Div. Shore Erosion, Tech. Publ.No. 4. 4 pp.
VERDUIN, J.
1964. Changes in western Lake Erie during the period 194862. Verb. Int. Verein.Limnol. 15: 639-644.
1969. Man’s Influence on Lake Erie. Ohio J. Sci. 69: 65-70.
WAKEHAM, W., and R. RATHBUN.
1897. Report of the Joint Commission relative to the preservation of fisheries inwaters contiguous to Canada and the United States. S. E. Dawson, Ottawa,xvi. 146 p.
WATT, K. E. F.
1962. The conceptual formulation and mathematical solution of practical problemsin population input-output dynamics, p. 191-203. In E. D. LeCren and M. W.Holdgate [ed.] The exploitation of natural animal populations. Wiley andSons, Inc., New York.
WOLFERT, D. R.
1963. The movements of walleyes tagged as yearlings in Lake Erie. Trans. Amer.Fish. Soc. 92: 414-420.
1969. Maturity and fecundity of walleyes from the eastern and western basins ofLake Erie. J. Fish. Res. Bd. Canada 26: 1877-1888.
1972. Age and growth of Lake Erie walleye. On file, U.S. Bur. Sport Fish. andWildl., Sandusky, Ohio. 34 p. (MS)
WRIGHT, S.
1955. Limnological survey of western Lake Erie. U.S. Fish Wildl. Serv., Spec. Sci.Rep. Fish. 139: 341. p.