Effects of a bank consolidation promotion policy ... · Showa Financial Crisis. This was the...
37
CIRJE Discussion Papers can be downloaded without charge from: http://www.e.u-tokyo.ac.jp/cirje/research/03research02dp.html Discussion Papers are a series of manuscripts in their draft form. They are not intended for circulation or distribution except as indicated by the author. For that reason Discussion Papers may not be reproduced or distributed without the written consent of the author. CIRJE-F-400 Effects of a bank consolidation promotion policy: Evaluating Bank Law in 1927 Japan Tetsuji Okazaki University of Tokyo Michiru Sawada Nagoyagakuin University February 2006
Transcript of Effects of a bank consolidation promotion policy ... · Showa Financial Crisis. This was the...

CIRJE Discussion Papers can be downloaded without charge from:
http://www.e.u-tokyo.ac.jp/cirje/research/03research02dp.html
Discussion Papers are a series of manuscripts in their draft form. They are not intended for
circulation or distribution except as indicated by the author. For that reason Discussion Papers may
not be reproduced or distributed without the written consent of the author.
CIRJE-F-400
Effects of a bank consolidation promotion policy:Evaluating Bank Law in 1927 Japan
Tetsuji OkazakiUniversity of Tokyo
Michiru SawadaNagoyagakuin University
February 2006

1
Effects of a bank consolidation promotion policy: Evaluating Bank Law in 1927 Japan1
Tetsuji Okazaki
Faculty of Economics, The University of Tokyo, 7-3-1, Hongo, Bunkyo-ku, Tokyo, 113-0033, Japan (E-mail address: [email protected] )
Michiru Sawada
Faculty of Economics, Nagoyagakuin University, 1350 Kamishinano-cho, Seto-shi, Aichi, 480-1298, Japan (E-mail address: [email protected])
Abstract
This paper investigates the impact of bank consolidations promoted by government policy, using
data from pre-war Japan when the Ministry of Finance promoted bank consolidations by dint of the
Bank Law of 1927. It is found that policy-promoted consolidation had a positive effect on deposit
growth, especially in the period when the financial system was unstable. On the other hand, it had a
negative effect on profitability, particularly when there was no dominant bank among the
participants or when more than two banks participated in the consolidation. Policy-promoted
consolidation in such cases was likely to be accompanied by large organizational cost.

2
1.Introduction
In recent years, a wave of bank consolidations has spread across the world. According to Amel
(2002), more than 8000 bank consolidations occurred globally between 1990 and 2001 and the total
value of the deals reached about $1,800 billion. The number and amount of deals increased sharply
towards the end of the period. In Japan, the reorganization of city banks through consolidations has
progressed since the end of the 1990s, and has resulted in the formation of three major financial
groups At the same time, consolidations between regional financial institutions have progressed
rapidly. Actually, the number of Shinkin banks, small regional financial institutions, decreased by
almost 30 % from 1991 to 2004, mainly due to consolidations.
It is notable that one of the major driving forces of the recent wave of bank consolidations has
been government policy. For example, since the Asian Financial Crisis in 1997, the financial
authorities of Asian countries have been promoting bank consolidations and the Japanese
government initiated a policy of promoting consolidations among regional financial institutions on
the grounds that this policy would contribute to the stabilization of the banking system (Berger et al.
1999; Financial Service Agency, Japan 2002, Shin, 2003).
Promotion of bank consolidations by the government is not a recent phenomenon.
Kurgan-van (2001) shows that many of the governments of European countries, including Austria,
Belgium and Germany, promoted bank consolidations when the financial system was exposed to
banking crises in the 1920s and 1930s. Also, in 1920s and 1930s Japan, the government actively
promoted bank consolidations in order to stabilize the financial system when the banking sector
experienced repeated financial crises. Due to this policy, a number of bank consolidations occurred
(Goto 1991; Shiratori 2001; Okazaki and Sawada 2003). The central measure used for the
consolidation promotion policy was the Bank Law of 1927. In this paper, we explore the
implications of bank consolidations promoted by government policy based on the Bank Law.
We have rich literature related to this topic. Actually, the recent wave of bank consolidations
has attracted the interest of researchers and people in the financial authorities and banking industry.
Bank consolidation has been one of the major topics of research in banking and finance. The main
3
research foci are the effect of consolidation on efficiency, the market power of the banks involved,
small business lending, and the systemic risk of the financial system. With respect to the effects of
bank consolidations on efficiency, there are a number of empirical studies that confirm the risk
diversifying effect of bank consolidation, based on static and dynamic analyses (Benston et al. 1995;
Hughes et al. 1996, 1999; Craig and Santos 1997; Demsetzs and Strahan 1997; Saunders and Wilson,
1999). In this strand of the literature, it has been suggested that the government could play a role in
promoting bank consolidations, especially when the banking system is destabilized. For example,
Berger et al. (1999) argued that the government could promote the consolidation of banks that are
faced with difficulties or a financial crisis, based on the case of the US Federal Deposit Insurance
Corporation. The idea underlying the use of a consolidation promotion policy during a financial
crisis is that bank consolidations would reduce the insolvency risk through asset diversification (Shih
2003).
Related to this, the literature on the U.S. banking system in the 1920s and 1930s shows that
the branch banking system benefited from diversifying credit risk (White, 1983, 1984; Calomiris,
1992, 1993; Wheelcok, 1992,1993; Mitchener, 2005a). These results are considered to indicate the
potential benefit of bank consolidation. Meanwhile, White (1985) pointed out the possibility that the
wave of U.S. bank mergers in 1919-1930 strengthened the banking industry through preventing
failures of small rural banks as well as through achieving economies of scale.
Recent research stresses another channel through which bank consolidation and branch
banking could contribute to stabilization of the financial system. Carlson and Michener (2005b)
confirmed that the expansion of statewide branch banking induced competition among banks and
thereby removed weak and inefficient banks through failures, liquidations and consolidations in the
U.S. in the 1920s, which consequently improved the stability of the banking system. In addition,
Carlson and Michener (2005c) show an external effect of branch banking, using the data on
California in the 1920s and 1930s. That is, many small unit banks were exposed to competition
induced by the emergence of large branch banking institutions, in particular, the Bank of America,
and those small unit banks were forced to make efforts to improve efficiency. Consequently, the

4
banks competing with the Bank of America were better able to survive the shock of the Great
Depression.
On the other hand, most of the empirical literature suggests that bank consolidations do not
significantly improve the performance or efficiency of the participating banks (Berger et al. 1999;
Amel et al. 2002). If a voluntary consolidation does not enhance the performance of the participating
banks, a performance enhancing effect of consolidation promoted by government policy is even
more questionable, but to our knowledge there has been no empirical study that directly examines
the issue. Hence, in this paper we intend to investigate the effects of policy-promoted consolidation
on the stability of the financial system. A basic reason why research on the effects of
policy-promoted consolidations has not progressed lies in data constraints. Not only are sufficient
observations of bank consolidations lacking, but it is also difficult to identify consolidations
promoted by government policy. In order to resolve this problem, we use data from pre-war Japan.
As stated above, in the 1920s and 1930s, the Japanese government promoted bank
consolidations using a minimum capital regulation stipulated by the Bank Law. This case provides us
with a valuable opportunity to evaluate the effects of the policy. The Bank Law set a minimum
capital requirement for banks, which many banks did not meet. At the same time, the government
did not allow any of these small banks to increase capital by itself. Consequently, many small banks
were obliged to choose one of two alternatives, merge with another bank, or undergo liquidation.
Hence, we identify bank consolidations promoted by government policy as those in which the capital
of one of the participating banks was smaller than the minimum capital required by the Bank Law2.
There is another advantage to using data from pre-war Japan. Not only did many bank
consolidations occur, whether promoted by the policy or not, but these consolidations also took
various patterns and comprehensive information on these patterns of consolidation is available. As
the patterns of consolidation in general affect the cost of organizational adjustment, it is necessary to
control for them in order to identify the effects of the consolidation promotion policy. Also, any
difference in organizational adjustment costs between the various patterns of consolidation is
interesting in itself.

5
The paper is organized as follows. Section 2 provides an overview of bank consolidations in
pre-war Japan. Section 3 explains the data and methodology used in the analysis. In section 4, we
analyze the effects of policy-promoted consolidation. Section 5 explores the effects of
policy-promoted consolidation in more detail, combining these effects with information on
consolidation patterns. Section 6 concludes the paper.
2. Financial crises, the Bank Law and bank consolidations
The structure of the banking industry in pre-war Japan was substantially different from what it
has been in the post-war period. One of the major differences is that there were numerous banks in
the pre-war period. This was basically because entry regulations were comparatively lax until the
early twentieth century. The number of banks was as large as 2334 (1890 ordinary banks and 444
saving banks) in 1901, the peak year, and after that it started to decline due to market selection and
the change in government policy. The turning point of the market structure of the banking industry
was the financial crisis in 1901. Under the crisis, 50 banks were closed, faced with runs, more than
80 % of which were small banks with capital of less than two hundred thousand yen (Goto, 1968).
Afterwards, the Ministry of Finance (MOF) adopted a policy whereby the scale of banking was
enlarged. At first, the model for the MOF to aim for was the branch banking system of the U.K. In
1901, the MOF set a minimum paid-in capital amount (five hundred thousand yen) a new bank was
required to have to enter the industry. While gradually raising the minimum capital amounts required
by newcomers, the MOF requested that local governments promote bank consolidations in the
1910s.
In the 1920s, instability of the financial system became serious with many bank runs and
failures. In 1920, one of the major banks in Yokohama, Nanaju-yon Bank, failed due to the collapse
of a speculative bubble, which led to a nation-wide wave of bank runs. Consequently, 169 banks
were faced with runs, out of which 21 banks were closed (Goto,1968). In 1922, Kochi-shogyo Bank
was closed due to the failure of its connected borrower, Sadashichi Ishii, an influential speculator.
The failure of Kochi-shogyo Bank caused a series of bank runs in the Tokyo, Kansai and Kyushu
6
areas. Furthermore, in 1923, a great earthquake hit the Tokyo and Yokohama areas, which brought
the financial system to a standstill. The estimated property loss amounted to approximately 30% of
GNP in 1922, according to the Bank of Japan (1933). Afterwards, many banks in the Tokyo and
Yokohama areas suffered from bad loan problems. Finally, in 1927, the Finance Minster, Naoharu
Kataoka, inadvertently mentioned the closure of the Tokyo Watanabe Bank, which precipitated the
Showa Financial Crisis. This was the largest financial crisis in Japanese financial history. Major
stock and commodity exchanges were shut down for three weeks. According to a report from the
Ministry of Finance, the number of closed, nearly closed, and officially suspended banks reached
126 (Hoshi and Kashyap, 2001). A large shift of deposits from banks to the Postal Bureau occurred
after the crisis.
The financial crises spurred the MOF to make drastic policy changes to reform the financial
system. In September 1926, the MOF established the Financial System Research Council (Kin’yu
Seido Chosakai) to examine measures for reforming the financial system (Bank of Japan 1983,
pp.264-270). As the base of discussion there, the MOF proposed a draft to the Council, which aimed
at i) increasing capital, ii) promoting prudential management, iii) protecting depositors, iv)
improving supervision, v) preventing excess competition, and vi) promoting liquidation of
non-performing banks. This draft summarizes the recognition shared by the financial authorities and
the private financial circle of the problems in the financial system. That is, it was widely recognized
that the market structure with numerous small banks, harsh competition among them, and unsound
management were the basic reasons for the financial instability3. Unsound bank management was in
reference to too small profit reserves, excess reliance on real estate for collaterals, and the unsound
relationship between banks and non-banking companies, which was called an “organ bank”
relationship. Many banks were connected with non-banking companies through personnel and
capital ties and concentrated loans on those related companies (Kato 1957; Okazaki Sawada and
Yokoyama 2005).
The Council examined the draft to prepare a report on the reform of ordinary banks. This
report recommended that eighteen measures be taken and that the Bank Law be legislated to

7
implement them (Ogawa 1930 p.34, pp.70-78). Based on the report, the MOF proposed the Draft of
the Bank Law to the Diet in 1927 to replace the Bank Act of 1890. The main points that were newly
prescribed by the Bank Law were as follows. First, a bank should be a joint-stock company. Second,
it should have capital of not less than one million yen in principal. If the headquarters of a bank was
located in Tokyo or Osaka, the minimum capital requirement was two million yen, while it was five
hundred thousand yen if the headquarters was located in a town or village with a population not
larger than ten thousand. Third, a bank should not conduct any other business except closely related
business, such as setting up and maintaining corporate bond trusts If a bank did not meet these
criteria at the time of enactment, it should meet them within five years. And fourth, an executive
director or a manager of a bank should not be an executive director or a manager of another
company without the approval of the Minister of Finance (Bank of Japan 1983, pp.273-276).
It is notable that the first point, regulation of bank capital, gave the MOF a powerful measure
for promoting bank consolidations. The MOF had made efforts to promote bank consolidations since
the 1900s, especially since the early 1920s. When the Law was enacted in 1928, there were 1407
ordinary banks and 807 of these did not meet the minimum capital criterion. On the other hand, the
MOF held the authority to approve any changes in bank capital required by the Bank Law,4 and
basically it did not allow a small bank to increase its capital by itself. Hence, small banks that did not
meet the minimum capital criterion were obliged to choose from one of two alternatives,
consolidation with other banks or liquidation.
The MOF expected bank consolidations to be an effective measure to resolve the problems of
the Japanese financial system, not to mention the fact that bank consolidations would be effective in
reforming the market structure, which consisted of numerous small banks. However, the MOF
expected more. The MOF considered that bank consolidations would resolve the problems of bank
management. First, the upscaling of banks through consolidations was supposed to increase the need
for full-time managers, who were often lacking in small banks because there were scales of economy
in employing full-time managers. Second, it was expected that consolidations would resolve the
problem of the “organ bank” relationship (Shiratori 2001)5. Third, bank consolidations were

8
supposed to have the effect of diversifying bank assets (Ito 1995).
In promoting bank consolidations, the MOF gave priority to those between banks in the same
regions, which implies that the MOF changed the policy from that of aiming at the British branch
banking system. This was because local business circles and the Diet members representing them
complained that consolidations between large urban banks and regional banks would cause transfers
of funds from rural areas to urban areas (Shiratori 2000; Ogawa 1930, part 2, pp.259-268). The
effect of the consolidation promotion policy, in particular the policy backed by the Bank Law, is
reflected in Figure 16. This shows the number of bank exits, classifying them into exits via
consolidation and exits for other reasons, including failure. We can confirm that consolidations came
to be the principal reason for bank exits from the late 1910s onwards. The number of bank exits due
to consolidations reached a peak of 222 in 1928. Around 90% of the consolidations that occurred in
the late 1920s and in the early 1930s were those whose participants were in the same regions,
reflecting the above mentioned policy of the MOF.
3 Empirical Methodology
3.1 Data and samples
The basic samples used in the following analyses consist of all the consolidations of ordinary
banks that occurred in the period from Jan. 1927 to Dec. 1932, when bank consolidations increased
sharply due to the enactment of the Bank Law. The data source for the bank consolidations is Ginko
Jiko Geppo (Monthly Bank Affairs), prepared by the Bank of Japan. From this source, we can obtain
basic information on each bank consolidation, including the event date, the names of the
participating banks, the prefectures where their head offices were located, the capital of the
pre-consolidation and post-consolidation banks, and the form of consolidation. In this source, bank
consolidations are classified into three forms, namely absorption, acquisition and combination into a
new bank. Here, combination into a new bank refers to the form of consolidation where a new bank
is established after all of the participants are dissolved.
The information on consolidation forms is useful because it allows us to infer the power
9
balance among the participants. According to Kin’yu Kenkyukai (1934), in a case where the power
of the participant banks was nearly equal, they tended to combine into a new bank. On the other
hand, when one bank dominated the other participants, absorption or acquisition tended to be the
chosen path7. As Ginko Jiko Geppo distinguishes between the surviving banks and the exiting banks
after the consolidation, we can easily identify the acquirer bank and the target bank in the absorption
and acquisition consolidations.
The financial data for each bank was obtained from various issues of Ginkokyoku Nenpo (Year
Book of the Bank Bureau of the Ministry of Finance), which covers all the ordinary banks in Japan.
However, the information from this source is basically limited to balance sheet data and information
on profit is censored at zero. That is, if the profit of a bank was negative, the negative value is not
reported in this source. Hence, we supplemented information on profit, using the financial reports for
each bank and Ginko Tsushinroku (Bank Report)8. Meanwhile, since the minimum capital set by the
Bank Law depended on the location of the headquarters of a bank, as mentioned above, we compiled
the addresses of the headquarters from Ginko Soran (Handbook of Banks). Also, this source provides
us with the addresses of the branches of each bank, which we used to classify out-of-market and
in-market consolidations. The information on the population of the city, town or village where the
headquarters of each bank was located was obtained from Nippon Teikoku Tokei Nenkan (Statistical
Year Book of the Japanese Empire). Combining this information with the minimum capital set by the
Bank Law, we can determine whether each bank met the minimum capital criterion or not. We regard
consolidation in which at least one participating bank did not meet the minimum capital criterion as
a policy-promoted consolidation, while we regard consolidation where all the participants met the
criterion as a strategic consolidation.
In the rest of the paper, we examine the effects of consolidation on bank performance by
comparing the changes in performance from year T-1 to year T+2 and T+3, between the consolidated
banks and the non-consolidated banks, where T refers to the event year when the consolidation
occurred. In order to identify the consolidation effects clearly, we exclude banks that participated
in multiple consolidations in the period from year T-2 to year T+3. After filtering out those samples

10
from all the consolidations in 1927-1932, 164 consolidation samples remain, in which 393 banks
were involved 9 . Also, we chose control samples for each event year. The control samples
corresponding to the consolidated banks in year T refer to those banks that did not participate in any
consolidation in the period from year T-2 to year T+3. For example, the control samples of the event
year 1927 are the banks that did not participate in any consolidation from 1925 to 1930. We compare
these with the banks that were consolidated in 1927. Then, we construct (unbalanced) panel data,
which consists of 2186 bank-event year observations.
Panel A of Table 1 shows the number of consolidations and control samples by event year.
The consolidations are classified as policy-promoted consolidations and strategic consolidations,
according to the definition stated above. Around 80% of the consolidations are classified as
policy-promoted consolidations. In Panels B to E of Table 1, we further classify policy-promoted
consolidations and strategic consolidations into subcategories according to a separate set of criteria.
In Panel B we add the criterion of consolidation forms mentioned above, namely absorption,
acquisition and combination into a new bank. The additional criterion in Panel C is the number of
participating banks. It is notable that the ratio of one-to-one consolidation was substantially higher in
strategic consolidations than in policy-promoted consolidations.
In Panel D, we add the criteria of in-market and out-of-market consolidation. Out-of-market
consolidation refers to consolidation where there were no branch offices overlapping in the same
market among the participating banks 10 . Over 75% of the total samples were in-market
consolidations. It should be noted that the ratio of in-market consolidations was substantially higher
in policy-promoted consolidations than in strategic consolidations, which is consistent with the fact
that the government placed priority on regional consolidations. Finally, we add the criterion of the
area where the headquarters was located after the consolidation. We distinguish between urban and
rural areas. Urban areas refer to the prefectures of Tokyo, Kanagawa, Aichi, Kyoto, Osaka and
Hyogo. The proportion of consolidations in rural areas was 75% of total samples.
3.2 Methodology
11
In measuring bank performance, we focus on the deposit growth rate and the return on total
assets (ROA)11. The deposit growth rate is a performance measure closely related to the stability of
the financial system. In pre-war Japan, depositors were wary of the risks associated with banks
because there was no deposit insurance system. In fact, bank runs frequently occurred in the 1920s,
including the Showa Financial Crisis in 192712. Arguably, the benefits of consolidation were
potentially greater in this situation because the consolidation not only increased the scale of the bank
but also enabled the bank to diversify its assets more extensively, which in turn decreased the risk for
the depositors (Benston et al. 1995; Hughes et al. 1996,1999; Craig and Santos 1997; Demsetzs and
Strahan 1997; Saunders and Wilson 1999, etc.). On the other hand, Shih (2003) points out the
possibility that when a relatively healthy bank merges with a weak one, the post-merger bank can be
a proposition that is still more risky than the weak one. However, his argument is based on the
assumption that the average credit risk of the two merging banks is extremely high, and this
assumption cannot be applied to the situation of the banking industry in pre-war Japan, even in the
1920s and 1930s13.
A number of researchers have used ROA to ascertain the effect of consolidation, but the results
are mixed (Berger and Humphrey 1992; Cornett and Tehranian 1992; Linder and Crane 1992; Piloff
1996; Rodes 1998). In addition, many of our consolidation samples are policy-promoted ones, which
were not always carried out as a result of strategic incentives. Hence, it is unlikely that
consolidations in our samples would have a positive effect on ROA. One problem with ROA is that
it reflects both market power and efficiency (Akhavein et al. 1997; Berger et al. 1999). Although
ideally both the change in the profitability ratio and profit efficiency should be analyzed, we focus
on the former due to data constraints. However, as stated below, we found that consolidations had a
negative effect on ROA, which indicates that consolidations led to inefficiencies, and that this
dominated the effect of increased market power, if any such increase occurred. In this sense, the
problem of market power was not particularly serious.
In order to measure the effect of consolidation, we estimate equation (1) by pooled OLS
with samples from all event years, using event year dummies to control for the shocks common to

12
the samples of the same event year group. Also, in calculating standard error, the
heteroskedasticity-robust standard error by White (1980) is used.
⊿ itititititit URBANBRANCHASSETLNCONSX εβββββ ++Δ+++= 43210 )( (1)
where i refers to the bank, and t refers to the event year group. The dependent variable⊿ itX is the
difference in ROA or the deposit growth rate in the period from year T-1 to year T+2 orT+314. For
the value of a consolidated bank in year T-1, that of a pro-forma bank is used15. CONS is a dummy
variable that equals 1 if the bank was a merged one, and 0, otherwise. We are especially interested in
the coefficient of this variable. If the consolidation had a positive effect on bank performance, the
coefficient is expected to be positive with respect to both dependent variables. LN(ASSET) is the
natural log of the total assets in year T-1, and is expected to capture the economies of scale. ⊿
BRANCH denotes the change in the number of branches. In the case where the dependent variable is
ROA, we expect this variable to capture the effect of restructuring inefficient branches since the
government in principle prohibited the opening of new branches from the early 1920s. If effective
restructuring was accomplished, the sign of this coefficient will be negative. With respect to the
deposit growth rate, the coefficient of ⊿BRANCH is expected to be positive because, in general,
the correlation between ability to collect deposits and the number of branches is positive. URBAN is
a dummy variable that equals 1 where the headquarters of the bank was located in an urban area, in
the sense defined above, and 0, otherwise. In an equation where the deposit growth rate is the
dependent variable, the coefficient of URBAN is expected to be positive, since it is known that there
was a tendency for funds to flow from rural areas to urban areas after the 1900s (Okazaki 1993;
Shiratori 2000).
Table 2 shows the basic statistics on the pre-consolidation banks. With respect to absorption
and acquisition, we split samples into acquirer banks and target banks. According to the table, the
acquirer banks were larger in terms of assets than the other banks. Also, the loan-deposit ratio
(Loan/Deposits) of the acquirer banks was lower. On the other hand, the target banks and
participants combined into new banks had relatively high ROA, which arguably reflects that those
banks were more or less monopolistic in the segmented local markets.16

13
4 The effects of policy-promoted consolidation
In this section, we examine the effects of policy-promoted consolidation on bank performance
as a way of revealing the effect of the Bank Law of 1927. Table 3 shows the result of panel
regressions of equation (1) with the deposit growth rate from one year before the consolidation (T-1)
to two or three years after the consolidation (T-2 or T-3) as the dependent variable. Columns 1 and 3
show the results of the performance change from T-1 to T+2, and Columns 2 and 4 show those from
T-1 to T+3. According to Column 1, the coefficient of the consolidation dummy is positive and
statistically significant at the 1% level. This implies that the deposit growth rate of the consolidated
banks was 6.388% points higher that that of the non-consolidated banks in the period from T-1 to
T+2. Since the sample period includes the Showa Financial Crisis in 1927 and the financial system
did not have a deposit insurance system, the depositors were expected to be aware of any risks
associated with the bank. The positive coefficient of the consolidation dummy is supposed to reflect
the fact that the consolidation was seen by depositors as reducing credit risk. The coefficient of
LN(ASSET) is also positive and statistically significant, which is consistent with our interpretation
based on the risk-averse behavior of the depositors. URBAN has no significant impact on the deposit
growth rate. Hence, there is no evidence of fund flight from rural to urban areas, as was pointed out
by former studies. The coefficient of ⊿BRANCH is, as expected, positive and statistically
significant at the 1% level, indicating that branches played a significant role in collecting deposits17.
Column 2 shows the same result qualitatively as that in Column 1, whereas the magnitude and
statistical significance of the coefficient of the consolidation dummy is slightly smaller, and the
coefficient of LN(ASSET) is larger.
In Columns 3 and 4, we split the consolidation samples into policy-promoted consolidations
and strategic ones in order to identify the effect of the consolidation promotion policy. These results
show that while the coefficient of the policy-promoted consolidation dummy is positive and
statistically significant, that of strategic consolidation is positive but not significant. Moreover, the
magnitudes of these coefficients are larger in the former than in the latter. Hence, we can say that the

14
deposit growth rate went up, particularly in cases where consolidation was promoted by government
policy.
In order to explore the reasons for the positive effect of consolidation on deposit growth in
more detail, we conducted a cross sectional analysis. That is, we estimated equation (1) by event
year. The result where the performance change was measured from one year before the consolidation
to one year after the consolidation is shown in Panel A. Panels B and C show the results where the
performance change was measured from one year before the consolidation to two and three years
after the consolidation, respectively. According to these panels, the consolidations in 1927, when the
Showa Financial Crisis occurred, had a strong positive effect on the deposit growth rate. Those
banks that consolidated in 1927 collected over 20% more deposits than the non-consolidated banks.
Also, the consolidations in 1928 had a positive effect on deposit growth, although it was relatively
small. On the other hand, the consolidations that occurred in the period from 1929 to 1932 had no
statistically significant effect. In other words, the positive effect of consolidation on deposit growth
was observed only in the period when the financial system was especially unstable. This can be
interpreted as being the risk-averse behavior of depositors that was spurred by the financial crisis
and thus gave a premium to the consolidation. While not reported, we estimated equation (1) using a
policy promotion consolidation dummy and strategic consolidation dummy with respect to the years
1927 and 1928 to confirm that the positive effect was especially large for policy-promoted
consolidation.
One interpretation of the larger effect of policy-promoted consolidation is that
policy-promoted consolidation aimed at rescuing financially distressed banks. Actually, comparing
the average loan-deposit ratio between acquiring banks and acquired banks with respect to whether
they were participants in policy-promoted consolidations, we find that the ratio of the former was
1.19, while that of the latter was 1.51. In other words, the liquidity position of the acquired banks
was extremely bad. On the other hand, with respect to strategic consolidations, the average
loan-deposit ratio of the acquiring banks was 1.00, while that of the acquired banks was 1.18,
indicating that the liquidity position of the acquired banks was not so bad. Hence, we can infer that

15
strategic consolidations rarely contributed to the rescue of financially distressed banks. In addition,
according to Goto (1991), in order to rescue small and weak banks, the Ministry of Finance actively
coordinated consolidations collaborating with bank managers and leading figures of local business
circles. In summary, it is likely that the consolidations promoted by the Bank Law mitigated the
financial crisis.
Next, we examine the effect of consolidation on bank profitability. Panel A of Table 5 shows the
results of panel regressions of Equation (1) with change in ROA from one year before the
consolidation (T-1) to two or three years after the consolidation (T-2 or T-3) as the dependent
variable. As shown in Columns 1 and 2, the consolidation dummy is negative and statistically
significant, which means that consolidation had a negative effect on bank profitability. Since, as
stated above, consolidation would more or less increase market power, the negative effect suggests
that consolidation was accompanied by inefficiencies. This is not surprising, because most of the
literature on bank consolidations in the 1980s and 1990s rejects any significantly positive effect of
consolidations on profitability and efficiency (Berger et al. 1999; Amel et al. 2002).
Meanwhile, LN(ASSET) and URBAN had a positive effect on ROA18. On the other hand, the
coefficient of ⊿BRANCH is, contrary to our expectation, positive. It is possible that those banks
whose profitability declined were obliged to decrease their number of branches, however, the
positive effect of restructuring branch networks was not large enough to offset that correlation.
In the same way as for the analysis of deposit growth rate (Table3), we focus on the effect of
policy-promoted consolidation on ROA. As shown in Columns 3 and 4, the coefficient of the
policy-promoted consolidation dummy is negative and statistically significant. On the other hand,
that of the strategic consolidation dummy is positive, although it is not significant. These results
imply that we can attribute the negative effect of the consolidation on ROA to policy-promoted
consolidation.
Finally, we have to mention that the number of observations is smaller by 212 (9.7%),
compared to the analysis of the deposit growth rate, because we eliminated banks whose information
on negative profit was not available from our samples19. Hence, it is possible that the estimation
16
results in Table 5 are affected by sample selection bias. Therefore, we re-estimated equation (2) with
the sample selection model by using the maximum likelihood (ML) method, where the selection
equation consists of variables explaining the cross sectional differences in bank profits20. The
estimated results are shown in Panel B of Table 5. We can confirm that the results are not
substantially different when compared to those of Panel A2122.
5 Consolidation patterns and bank performance
In the previous section, we confirmed that policy-promoted consolidation had a positive
effect on deposit growth rate and that it had a negative effect on ROA, which suggests that some
inefficiencies occurred. In this section, we investigate the causes of these results in more detail. For
this purpose, we focus on three patterns of consolidation that are relevant to bank performance. That
is, (1) the form of consolidation absorbing consolidations vs. mergers of equals, (2) the number of
participating banks, and (3) in-market consolidations vs. out-of-market consolidations. Then, we
split policy-promoted and strategic consolidation into sub-categories based on these patterns.
(1) The form of consolidation. Integration of different organizations is generally
accompanied by coordination costs. The magnitude of the cost is likely to depend on the form of the
consolidation. Berger et al. (1999) point out that the reason why cost efficiency was not improved by
the consolidations in the 1980s was that the gains from the consolidation were offset by such
coordination costs as difficulties in managing large organizations, conflicts between different
corporate cultures, and problems in integrating systems. Compared with an absorbing consolidation,
coordination costs are expected to be higher in the case of mergers of equals, because in the latter
situation a dominant participant and leadership is lacking2324. Here, we regard absorptions and
acquisitions as described in Ginko Jiko Geppo as absorbing consolidations, and regard combination
into a new bank as a merger of equals.
(2) The number of participants (one-to-one consolidation versus consolidation with more
than two participants). In general, the more participants there are, the more difficult it is to integrate
organizations25. (3) In-market consolidation versus out-of-market consolidation. It has been pointed

17
out that geographic expansion of the business area and branch network reduces the risk of bank
insolvency (Hughes et al., 1999). On the other hand, it is likely that in-market consolidation may
enhance profitability through restructuring inefficient branches and increasing market power (Berger
and Humphrey, 1992 etc.).
Combining the criteria (1)-(3) with the classification distinguishing between policy-promoted
consolidations and strategic consolidations, we arrive at twelve subcategories of consolidation
patterns. We estimated equation (1), using a dummy variable that denotes each consolidation pattern
subcategory. Table 6 shows the estimated results. In Panel A, the dependent variable is the change in
ROA26. In Columns 1 and 2, we classify each of the policy-promoted consolidations and strategic
consolidations as either absorbing consolidations or mergers of equals. With respect to
policy-promoted consolidations, while both coefficients of absorbing consolidations and mergers of
equals are negative, the latter is larger in absolute value and the statistical significance is relatively
high. With respect to strategic consolidations, both coefficients of absorbing consolidations and
mergers of equals are different from zero, although the coefficient is positive in the case of absorbing
consolidations. These results indicate that it was policy-promoted consolidations and mergers of
equals that suffered from a deterioration in profitability.
In Columns 3 and 4, we focus on criterion (2) as well as on the criterion for
policy-promoted/strategic consolidations. With respect to policy-promoted consolidations, both
coefficients of one-to-one consolidations and consolidations with more than two participants are
negative and statistically significant. But, the absolute value of the latter case is approximately twice
as large as that of the former case. On the other hand, with respect to strategic consolidations, neither
of the coefficients is statistically significant.
It should be noted that policy-promoted consolidations did not always hurt profitability.
Policy-promoted consolidations damaged profitability especially in cases where there was no
dominant participant, or where more than two banks participated in the consolidation. On the other
hand, with respect to strategic consolidations, there is no evidence that profitability declined for this
form of consolidation. One possible interpretation of these results is as follows. Some of the
18
policy-promoted consolidations were carried out with the aim of getting over the immediate crisis
but lacked a strategic vision for the new organization. Hence, after the consolidation, the merged
banks suffered from the various organizational problems mentioned above. Also, these problems
were especially serious where there was no dominant participant, or where more than two banks
participated in the consolidation.
In Columns 5 and 6, we focus on criterion (3) as well as on the criterion for
policy-promoted/strategic consolidations. With respect to policy-promoted consolidations, in-market
consolidations had an especially large negative effect on profitability. On the other hand, strategic
and in-market consolidations did not have a significant negative effect on profitability. One possible
interpretation of these results is that in-market consolidations, by definition, had many overlapping
braches, which made bank profitability worse because effective restructuring of these branches failed
to occur. In particular, policy-promoted consolidations were unlikely to have detailed plans to
restructure the branch network in advance27. Furthermore, it is interesting that the coefficient of
strategic and out-of-market consolidation is positive and statistically significant. This result indicates
that bank consolidation could also play an important role as a measure of entry into a new market,
considering the government principally prohibited new branches from being opened.
The same analyses can be performed regarding the deposit growth rate in panel B of Table 6.
Here, we are especially interested in the criterion for in-market and out-of-market consolidations
because this criterion is expected to be directly related to the risk for depositors, as explained above.
Columns 5 and 6 show the estimated results. All of the consolidation dummies have positive
coefficients, but the magnitude and statistical significance differ markedly among the four patterns.
In particular, in the case of policy-promoted and out-of-market consolidations, the magnitude of the
coefficient is large. Thus, the banks that underwent this form of consolidation gathered over 10%
more deposits than the non-merged banks. This result, namely that out-of-market consolidation had
an especially large positive effect on deposit growth, is consistent with the risk averse behavior of
depositors.
Although the form of consolidation and the number of participants is not considered to be

19
directly related to depositor risk, we also checked these effects and indicate the estimated results in
Columns 1 through 4. It is confirmed that the policy-promoted and merger of equals and
policy-promoted and one-to-one consolidation subcategories have a strong positive effect on deposit
growth rate, indicating that not all policy-promoted consolidation has a strongly positive effect on
the deposit growth rate.
6 Concluding Remarks
In pre-war Japan, the banking industry was composed of numerous small banks, which led to
instability of the financial system. In this situation, the Ministry of Finance promoted bank
consolidations based on a minimum capital criterion for banks set by the Bank Law of 1927. After
the Law was enacted in 1928, bank consolidations surged. This event provides us with a valuable
opportunity to explore the effects of the consolidation promotion policy.
In this paper, we identified bank consolidations that occurred as a result of government
policy by referring to the minimum capital of the bank and examined the effects of policy-promoted
consolidations in comparison with other consolidations. It is confirmed that policy-promoted
consolidations had a substantial positive effect on deposit growth. In addition, the positive effect was
especially large in 1927 and 1928, when the financial system was faced with a major crisis. On the
other hand, with respect to profitability, policy-promoted consolidations had a negative effect,
especially in cases where many banks were involved in the consolidation, where there was no
dominant participant, or where the participating banks had operated in the same market. From these
results, we can infer the possibility that policy-promoted consolidations mitigated the financial crisis
by enhancing the ability of the bank to collect deposits, under the condition that the financial system
was exposed to serious negative shocks. However, we should also acknowledge the negative aspects
of policy-promoted consolidations. They were likely to be accompanied by large organizational costs
and lowered bank profitability. Finally, it should be noted that our research only focused on short-
term effects, namely those that emerged three years after the consolidation. At the moment, it is
difficult to capture long-term effect due to data restriction. Exploring long-term effects remains an

20
aim of future research.
References Akhavein, Jalal D., Berger, Allen N., Humphrey, David B. (1997). “ The effect of megamergers on
efficiency and prices: Evidence from a bank profit function. Review of Industrial Organization 12, 95-139.
Amel, D., Barnes C., Panetta, Fabio and Salleo, Carmello. (2002). “ Consolidation and Efficiency
in the Financial Sector; A review of international evidence” Journal of Banking and Finance forthcoming.
Benston, George J., William C. Hunter and Larry D. Wall. (1995). “Motivation for Bank Mergers
and Acquisitions; Enhancing the Deposit Insurance Put Option versus Earnings Diversification” Journal of Money, Credit and Banking Vol. 27-3 777-788.
Berger, Allen N. and Humphrey, David B. (1992). “Megamergers in banking and the use of cost
efficiency as an antitrust defense” Antitrust Bulletin 37 541-600. Berger, Allen N., Demsetz, Rebecca S. and Strahan, Philip E. (1999). “The Consolidation of the
financial services industry; Causes, consequences, and implications for the future” Journal of Banking and Finance 23, 135-194.
Calomiris, C.W. (1993) “Regulation, industrial structure and instability in U.S. banking: A historical
perspective” in M. Klausner and L.J. White (eds.) Structural change in banking. Homewood, IL: One Irwin.
Cornett, Marci Million and Tehranian, Hassan. (1992). “Changes in corporate performance
associated with bank acquisitions” Journal of Financial Economics 31 211-234. Craig, Ben and Santos, Joao Cabral. (1997). “The risk effect of bank acquisitions” Economic Review
– Federal Reserve Bank of Cleveland, 33 25-35. Demsetz, Rebecca S. and Strahan, Philip E. (1997). “Diversification, size and risk at bank holding
companies” Journal of Money, Credit and banking 29, 300-313. Financial Service Agency, Japan. (2002). Koho Kona (The Public-Relation Press) Vol.23
Financial Service Agency. Goto, Shinichi. (1968). Honpou Ginko Goudou-Shi (The History of Bank Consolidation in Japan).
Kin’yu Zaisei Jijyo Kenkyuukai.

21
Goto, Shinichi. (1991). Ginko Godo no Jisshoteki Kenkyu (Empirical Studies on Bank Mergers), Tokyo: Nihon Keizai Hyoronsha. Heckman, J. (1979) “Sample selection bias as a specification error” Econometrica 47,
153-161. Hughes, Joseph P., Lang, W. William, Mester, Loretta J. and Moon, Choon-Geol. (1996). “Efficient
banking under interstate branching”. Journal of Money, Credit and Banking 28, 1043-1071. Hughes, Joseph P., Lang, W. William, Mester, Loretta J. and Moon, Choon-Geol. (1999) “The dollar
and sense of bank consolidation” Journal of banking and finance 23 291-324 Hoshi, T. and A. Kashyap. (2001), Corporate Financing and Governance in Japan, Cambridge,
MA:MIT Press. Imuta,T. 1976, Taishoki ni okeru Kin’yu Kozo (Introduction of the Analysis of the Financial Crisis in
1927). The University of Tokyo Press. Ito, Masanao (2002). Showa Shonen no Kin’yu Kiki (The financial system crisis in the first year of
the Showa period). IMES Discussion Paper Series 2001-J-24 Institute for monetary and economics studies, Bank of Japan.
Ito, Osamu. (1995), Nihongata Kin’yu no Rekisiteki Kozo (Historical Structure of Japanese
Financial Systems). Tokyo; The University of Tokyo Press. Kato, T. (1957). Honpo Ginkoshi Ron (History of Banks in Japan), Tokyo: The University of
Tokyo Press. Kin’yu Kenkyukai. (1934). Waga Kuni ni okeru Giko Godo no Taisei (The trend of bank mergers in
Japan). Kin’yu Kenkyukai. Korenage, Takafumi., Nagase, Takashi and Teranishi, Juro (2001). “1927 nen Kin’yu Kyoko kano
Yokin Toritsuke Ginko Kyugyo nikansuru Suryo Bunseki, (Quantitative analysis of bank closures and runs during the Showa Financial Crisis)” Keizai Kenkyu Vol.52, 315-332.
Kurgan-van, Hentenryk,G. (2001) “Supervision and Regulation of Bank Merger: A Historical
Survey” in Pohn,M., Tortella,T. and Van der Wee, H. (eds.) A century of banking consolidation in Europe: The history and archives of mergers and acquisitions. Aldershot: Ashgate
Linder, Jane C. and Crane, Dwight B. (1992). “Bank Mergers; Integration and Profitability” Journal of Financial Services Research 7, 35-55. Mitchener Kris J. (2005a) “Bank Supervision, Regulation and Instability during the Great
depression” Journal of Economic History Vol.65, 152-185.

22
Mitchener Kris J. (2005b) “Branch Banking, Bank Competition and Financial Stability” forthcoming
in Journal of Money, Credit and Banking. Mitchener Kris J. (2005c) “Branch Banking and the Transformation of Banking in California”
Working Paper, Santa Clara University. Ogawa, Gotaro (1930) Shin Ginko-Hou Jiyu (The reason for the New Bank Law), Tokyo: Nihon
Hyoron sha. Okazaki, Tetsuji. (1993). Senkanki no Kin’yu Kozo Henka to Kin’yu Kiki (Change of financial structure and financial crisis during wartime). Keiza Kenkyu Vol.44, No.4, 300-310. Okazaki, Tetsuji (2002). Mitsubishi Ginko no Siten Tenkai to Sikin Jyunkan – 1928 ~1942 (The
Extension of Branch Banking and Money Circulation in the Mitsubishi bank from 1928 to 1942). Mitsubishi-Shiryoukan-Ronsyu No.3, 1-29.
Okazaki, Tetsuji and Sawada, Michiru (2003). “ Ginko Togo to Kin’yu Shisutemu no Anteisei (Bank
consolidation and the stability of the financial system)” Shakai Keizai Shigaku Vol. 69 No.3, 25-46. Okazaki, Tetsuji, Sawada, Michiru and Yokoyama, Kazuki (2005) “Measuring the Extent and
Implications of Director Interlocking in the Pre-war Japanese Banking Industry” CIRJE Discussion
Paper Series F-241, forthcoming Journal of Economic History.
Okazaki, Tetsuji, Sawada, Michiru and Ke, Wang,(2005) “The Fall of “Organ Bank” Relationships
During the Wave of Bank Failures and Consolidations: Experience in Pre-war Japan” CIRJE
Discussion Paper Series F-379
Pilloff, Steven J.(1996). “Performance changes and shareholder wealth creation associated with
mergers of publicly traded banking institutions” Journal of Money, Credit and Banking 28 294-310. Rhoades, Stephen A.(1998). “The Efficiency effects of bank mergers: An overview of case studies of
nine mergers ” Journal of Banking and Finance 22, 273-291. Saunders, Anthony and Wilson, Berry (1999). “The impact of consolidation and safety-net support
on Canadian, US and UK banks:1893~1992” Journal of Banking and Finance 23, 537-571. Shih S.H. Michael. (2003). “An investigation into the use of mergers as a solution for the Asian
banking sector crisis” The quarterly review of economics and finance 43 31-49. Sanwa Bank (1933). Sanwa Ginko no Rekishi (The History of Sanwa Bank). Sanwa Bank.

23
Shiratori, Keishi (2000). Ryoutaisennki ni okeru Ginko Godo Sesisaku no keisei to Henyou (The
formation and change of bank merger policy during wartime). Shakai Keizai Shigaku Vol.66 No.3, 63-84.
Shiratori, Keishi (2001). 1920 Nendai niokeru Ginko Kisei no Keisei (The formation of regulations
of bank management in the 1920s). Keiei Shigaku 36-3, 25-50. Sugiyama, Kazuo. (1982). “Chihou Ginko no Jinteki Sokumen (Personnel Affairs in local bank
mergers)” edited by Itsumi, K. Keizai Hatten to Kin’yu ( Economic Development and Finance) Sobunsha.
Teranishi, Juro (1982). Nihon no Keizai Hatten to Kin’yu (Japanese Economic Development and
Finance ). Iwanami Shoten. Teranishi, Juro (2004). “1927 nen Ginko Hou no motodeno Ginko Shuchu to Kashidshi (Bank
lending under the Bank Law in 1927. )” Keizai Kenkyu Vol.55, 155-170. Wang, K.(2004) “Bank under government pressure: A duration analysis of bank exits in
pre-war Japan” Chapter2 in Ph.D. dissertation, Stanford University. Wheelock, D.C.(1992) “Regulation and bank failure: New evidence from the agricultural collapse of
the 1920s.” Journal of Economic history 52 806-825 Wheelock, D.C.(1993) “Government Policy and Banking market structure in the 1920s.” Journal of
Economic history 53 857-879 White E.N.(1982) “The political economy of banking regulation, 1864-1933” Journal of Economic
history 42 33-40 White E.N.(1984) “A reinterpretation of the banking crisis of 1930” Journal of Economic history
44 119-138 White E.N.(1985) “The merger movement in banking 1919-1933” Journal of Economic history 45 285-291 White, Halbert. (1980) “A heteroscedasticity-consistent covariance matrix and direct test for
heteroscedasticity” Econometrica,48 817-838. Yabushita, Shiro and Inoue, Atsushi (1993). “The Stability of the Japanese Financial system: A
historical perspective.” Journal of the Japanese and International Economics 7 387-407.
Official Publications
Bank of Japan. (1933)“Kantou Shinsai yori Showa 2-nen Kyoko ni itaru Waga Zaikai (Our
24
Financial World from Kanto Earthquake to Showa Great Depression)” in Bank of Japan ed. Nihon Kin’yushi Shiryo (Materials on Japanese Financial History) Meiji-Taisho edition, vol. 22, Printing Bureau of the Ministry of Finance (Tokyo).
Bank of Japan, (1958) “Sekai Senso Shurogo niokeru Honpo Zaikai Doyo Shi,” (History of the
Disturbances Affecting the Japanese Economy after the First World War) in Bank of Japan ed. Nihon
Kin’yushi Shiryo (Materials on Japanese Financial History) Meiji-Taisho edition, vol. 22, Printing Bureau of the Ministry of Finance (Tokyo).
Bank of Japan, (1964), “Ginko Jiko Geppo (Monthly Report Bank Issue)” in Bank of Japan eds., Nihon Kin’ yu shi Shiryo (Material on Japanese Financial History) Showa edition, Vol. 9, Printing Bureau of the Ministry of Finance (Tokyo).
Bank of Japan. (1983). Nihon Ginko Hyakunen Shi (100 Years History of the Bank of Japan), Vol.3, Bank of Japan (Tokyo).
Financial Service Agency, Japan, Koho Kona (The Public-Relation Press) Vol.23 Financial Service
Agency (Tokyo,2002).
Ministry of Finance. Ginkokyoku Nenpo (Year Book of the Bank Bureau of the Ministry of Finance)
1925-35 issue (Tokyo).
Ministry of Finance. Ginko Soran (The comprehensive list of Banks) 1927-32 issue (Tokyo).
Statistic Bureau of the Japanese Cabinet, Nippon Teikoku Tokei Nenkan (Statistical Year Book of the
Japanese Empire) 1925 issue (Tokyo)
Tokyo Bank Assembly, Ginko Tsushiroku (Bank Records) 1925-35 issue (Tokyo).
1This paper is a product of a research project undertaken by the authors at the Research Institute of
Economy, Trade and Industry (RIETI). We would like to thank Professor Yasushi Hamao, Takeo
Hoshi, Anil Kashyap and other participants at the NBER Japan Project Meeting (September 2003,
Tokyo) for their helpful comments and suggestions. All errors are the authors’ responsibility. 2 Teranishi (2004) investigates the relationship between bank lending and bank consolidation after
the Bank Law of 1927. However, his study does not capture the policy effect directly for the
following reasons. First, it does not identify whether each consolidation was promoted by the Bank
Law or not. Second, it does not use the appropriate method to capture the consolidation effect, since
his analysis is based on pooled prefecture-level data. Therefore, he cannot make a comparison
between a consolidated bank and a control sample, nor can he capture the dynamic effects in the

25
period ranging from the pre-consolidation year to the post-consolidation year. 3 “Waga Kuni Futsu Ginko Seido no Kaizen ni kansuru Gutaiteki Hosaku” “Concrete measures for
Improving the Ordinary Bank System in Japan” by the members of the Preparing Committee for the
Financial System Research Council (Ogawa 1930, part1, pp.11-13); The Research Bureau of the
Bank of Japan, “Sekai Senso Shurogo niokeru Honpo Zaikai Doyo Shi,” (History of the
Disturbances of the Japanese Economy after the First World War) (Bank of Japan 1958). 4 This authority was inherited from the Bank Act of 1890. 5 See footnote 24 for details. 6 In 1923, the MOF announced “The Policy on Bank Regulation,” which stated that the
establishment of a new bank or a new bank branch would not be approved in principle, and that bank
consolidations would be promoted. Also, in 1924, the MOF requested regional governments to
promote bank consolidations in the same region. When the Bank Law was enacted, the MOF
increased the number of bank inspectors from six to eighteen and instructed them to promote bank
consolidations in collaboration with regional business circles (Goto 1968; Ito 2002). 7 The government promoted combination into a new bank if there was no sound and leading bank
among the banks undergoing consolidation (Sugiyama 1982). 8 Not all of the data censored at zero can be covered by those additive sources. Hence, in the
analysis of profitability (Tables 5, 6), we eliminate those banks whose information on negative profit
is not available from our samples. We discuss the selection bias from this sample selection in the
next section. 9 If we take a longer interval, we lose many consolidation samples. 10 The unit of a market here is a city or a county. 11 We cannot get an accurate value of total assets because the account of net borrowings from the
BOJ and other banks was unrecorded in Ginkokyoku Nenpo. However, it is expected that this will
not matter because it is pointed out by Wang (2004) that this account was relatively small. 12 Yabushita and Inoue (1993) established that if a bank was in poor financial condition, this
increased the probability of closure during the Showa Financial Crisis in 1927, and argued that
selection through the market mechanism worked efficiently and that there was no self-fulfilling run
on the banks. On the other hand, Korenaga et al. (2001) split the period of the Showa Financial
Crisis into two sub-periods, and confirmed that while in the first sub-period there were no
self-fulfilling runs, the bank runs in the second sub-period were self-fulfilling. 13 He supported the assumption upon which his model was based, pointing out that even in late 1998
the non-performing loan ratio at Indonesian banks was still 50-100%. 14 Since consolidations were often accompanied by asset reevaluation, we adjust the assets of the
post-consolidation bank in the following way. 321 ,),iASSET(ASSETASSETASSET TiTT*
iT =−+= +−+
26
15 The value of the pro-forma bank indicates the sum of the balance sheets of participating banks. 16 Imuta (1976) and Teranish (1982) pointed out that while small-sized banks had market power in
segmented country areas to some extent, medium-sized banks were frequently exposed to
competition with large banks in urban areas. 17 Based on the deposit and loan data of Mitsubishi Bank by branch, Okazaki (2002) shows that the
increase in the number of branches in the 1920s and 1930s contributed to the increase of deposits. 18 The fact that bank scale had a positive effect on ROA indicates the potential benefit of
consolidations. Since, in our estimation, the value of a pro-forma bank is used with respect to the
merged banks, the scale effect of the consolidation is controlled for. We also estimated equation (1)
using the average value of assets of participant banks instead of a pro-forma value. In this case, as
expected, the consolidation had a greater positive effect on the deposit growth rate and a smaller
negative effect on ROA. 19 See footnote 8. The excluded observations include 12 consolidation samples (8 policy-promoted
consolidations and 4 strategic ones). 20 The number of branches may explain cross sectional differences in bank profits. However, we
exclude this variable from the selection equation because it is highly correlated with LN(ASSET).
But, the estimated results were not changed greatly, even if we included the number of branches in
the selection equation. 21 We also estimated the sample selection model using the two-step method by Heckman (1979).
However, the estimated results are the same as those found using the maximum likelihood (ML)
method (Panel B of Table5). 22 Our estimation results may also be exposed to another selection bias since we did not include
banks that exited through failures and dissolutions in estimating Equation (1). Thus, we estimated
the same sample selection models as above, supplementing the data for the end of year T-2 for banks
exiting from the market from T-1 to T+3. The estimated impact of consolidation remains statistically
significant with respect to both dependent variables (deposit growth rate and change in ROA). 23 According to Sugiyama (1982), since the banks established through combination into a new bank
were faced with difficulties in determining new directors, they frequently invited outsiders to take up
the position. 24 Moreover, as was expected by the government, if a small bank became one of the branches of a
large bank as a result of an absorbing consolidation, it is supposed that any unsound loans from the
acquired bank to its related firm would be reduced due to the discipline of the large bank. Actually,
Okazaki, Sawada and Wang (2005) confirmed that the absorbing consolidation had an effect of
excluding unsound relationships of acquired banks with non-banking companies, based on data on
director interlocking in pre-war Japan.

27
25Sanwa Bank (1974) describes the internal conflicts that Sanwa Bank suffered immediately
following the consolidation in 1933. Sanwa Bank, the predecessor to UFJ Bank, was established
through a consolidation of three large banks. 26 We also estimated these models with the sample selection model shown in the previous section. It
was confirmed that the results were not greatly changed by sample selection bias. 27 The number of branches for policy-promoted consolidations decreased by 0.86 (1.16) on average
two (three) years after the consolidation, it decreased by 3.27 (3.41) for strategic consolidations.
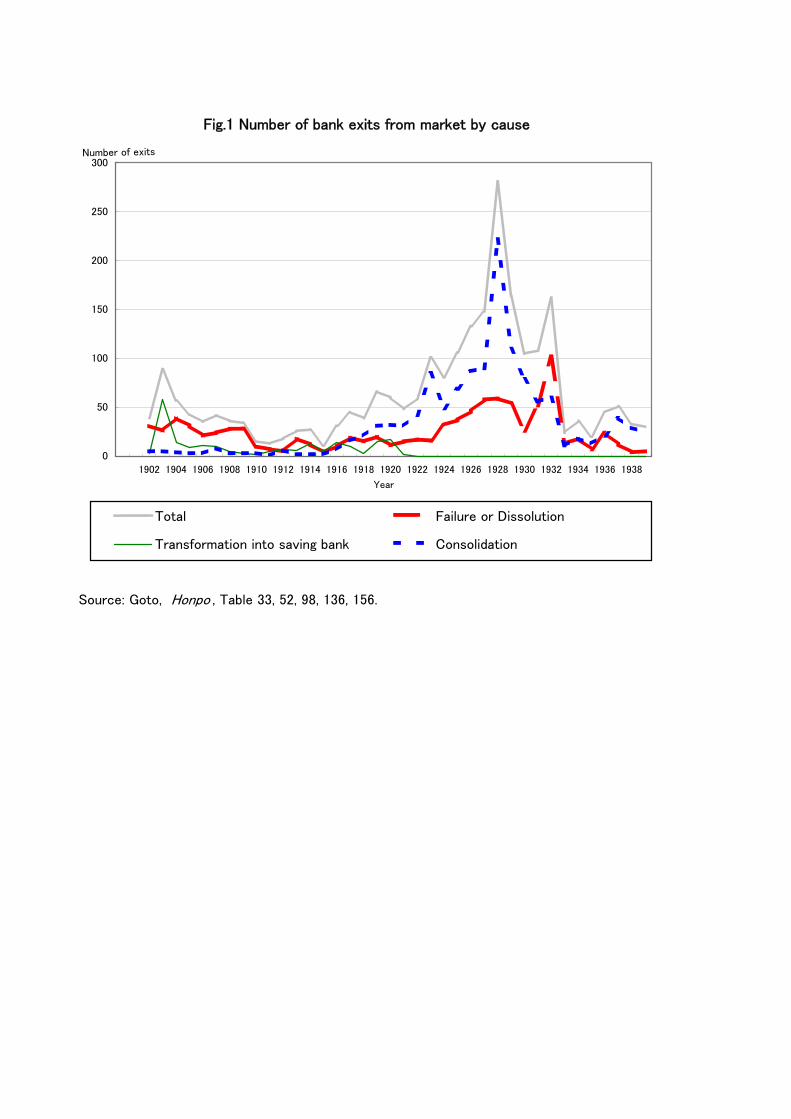
Source: Goto, Honpo , Table 33, 52, 98, 136, 156.
Fig.1 Number of bank exits from market by cause
0
50
100
150
200
250
300
1902 1904 1906 1908 1910 1912 1914 1916 1918 1920 1922 1924 1926 1928 1930 1932 1934 1936 1938
Year
Number of exits
Total Failure or Dissolution
Transformation into saving bank Consolidation

Table1 Sample description
Panel A: Number of samples by event year
Number of consolidations
All Strategic Control samplesEvent Year (Non-consolidated)
1927 26 21 5 4741928 41 30 11 3891929 31 25 6 2601930 18 11 7 2751931 22 20 2 2961932 26 21 5 328Total 164 128 36 2022
Panel B: Form of consolidationForm Absorption Acquisition
Policy-promoted 35 50 43Strategic 13 14 9Total 48 64 52
Panel C: Number of participants Number of participants 2 3 4 5 More than 5Policy-promoted 96 19 3 6 4Strategic 33 2 1 0 0Total 129 21 4 6 4
Panel D: In-market versus Out-of-marketIn-market Out-of-market
Policy-promoted 102 26Strategic 22 14Total 124 40
Panel E: Urban area versus Rural area Location Urban RuralPolicy-promoted 32 96Strategic 8 28Total 40 124
Combinationinto a new bank
Policy-promoted

Table2 Basic Statistics on pre-consolidation banks
Acquirer banks Target banksParticipants incombination
into a new one
Control samples(Non-
consolidated)
Mean 42695.54 3912.19 2085.59 14122.24Median 4631.06 854.34 1523.47 2606.55Std.dv. 161416.70 13986.97 2154.03 84291.87Deposits (1000 yen)Mean 21347.77 1956.09 1042.79 7058.12Median 2315.53 427.17 761.74 1303.27Std.dv. 80708.35 6993.49 1077.02 42107.38Loans/DepositsMean 1.15 1.44 1.45 1.39Median 1.08 1.14 1.24 1.13Std.dv. 0.52 1.15 1.38 2.50
Mean 3.69 4.86 4.53 3.80Median 3.03 3.69 4.16 3.12Std.dv. 2.71 7.33 3.83 4.22Number of branchesMean 7.88 1.65 1.84 4.20Median 3.00 0.00 1.00 2.00Std.dv. 15.59 3.12 2.72 8.12Operating AreaUrban Area (%) 28.6 27.8 12.8 24.6Rural Area (%) 71.4 72.2 87.2 75.4Number of banks 112 133 148 2022
Total assets (1000yen)
Return on assets (%)

Table 3 Effect of consolidation on deposit growth
Dependent variable Deposit growth rate from T-1 to T+2 or T+3Window [T-1, T+2] [T-1, T+3] [T-1, T+2] [T-1, T+3]
[1] [2] [3] [4]CONS 6.3884 a 5.0485 c
(2.3446) (2.75)7.2883 a 5.3867 c
(2.6431) (3.17)Strategic consolidation 3.0331 3.7888
(4.4263) (4.6223)LN(ASSET) 1.7269 b 3.4457 a 1.7601 b 3.4586 a
(0.7014) (0.7468) (0.7024) (0.7482)URBAN -0.6769 -1.9882 -0.709 -2.0003
(2.5832) (2.7015) (2.5854) (2.7037)⊿BRANCH 2.9804 a 3.5025 a 2.9679 a 3.4991 a
(0.5046) (0.52) (0.5062) (0.5226)INTERCEPT -23.2484 b -57.304 a -23.719 b -57.4877 a
(10.1996) (10.9756) (10.2117) (10.9954)
Event Year Dummy Yes Yes Yes YesR2 0.063 0.057 0.063 0.057NOB (consolidated/other) 164/2022 164/2022 164/2022 164/2022Notes: Significance at 1%,5% and 10% level are denoted by "a" "b" and "c". The figures in parentheses are robust standard errors. Significance levels are reported for two-tail tests.Variables: See appendix
Policy-promotedconsolidation

Table4 Cross sectional analysis
Panel A: Performance change from T-1 to T+1Dependent variable: Deposit growth rateEvent year (T) 1927 1928 1929 1930 1931 1932CONS 20.2501 a 10.6177 b 1.678 1.8323 5.9071 -1.5532
(4.4009) (4.8975) (3.3161) (3.7497) (5.9379) (4.3401)LN(ASSET) -0.2703 -2.873 -0.401 0.558 1.0987 2.7285 c
(1.5624) (2.6361) (1.4724) (1.2998) (1.0527) (1.2834)URBAN 0.784 12.9143 -2.1243 2.3552 -2.1675 -2.1029
(4.2555) (12.8087) (3.3616) (2.965) (3.2172) (3.5142)⊿BRANCH 0.4943 3.1031 a 2.6027 a 3.3218 a 1.0727 2.8303
(1.1883) (0.7729) (0.5145) (0.4534) (0.7383) (1.7648)INTERCEPT 5.7985 42.4992 1.4481 -25.7888 -37.4093 b -50.8864 b
(22.1121) (38.1374) (22.1272) (19.7086) (15.8675) (19.1716)
R2 0.014 0.018 0.06 0.069 0.024 0.055NOB (consolidated/other) 26/474 41/389 31/260 18/275 22/296 26/328
Panel B: Performance change from T-1 to T+2Dependent variable: Deposit growth rateEvent year (T) 1927 1928 1929 1930 1931 1932CONS 25.3345 a 12.0555 b 1.5768 2.9697 5.8086 -3.2334
(5.8598) (5.1231) (4.3158) (4.9235) (6.5922) (4.6242)LN(ASSET) 0.1877 -1.2378 -0.5337 2.5944 c 2.8789 b 6.1098 a
(1.5867) (2.1424) (1.5388) (1.5171) (1.338) (1.5689)URBAN -3.6949 6.4451 0.9599 0.1511 -4.1259 -3.4349
(4.764) (10.1796) (3.772) (3.6248) (3.7899) (4.1279)⊿BRANCH 1.5476 3.1438 a 2.4576 a 3.5232 a 3.2848 b 4.0848 b
(1.0436) (0.8324) (0.5058) (0.4868) (1.3285) (1.69)INTERCEPT -1.9117 9.3925 -6.0031 -59.7214 b -57.1077 a -95.4181 a
(22.4874) (31.3836) (23.0249) (23.0983) (20.1615) (23.0336)
R2 0.022 0.018 0.045 0.079 0.084 0.122NOB (consolidated/other) 26/474 41/389 31/260 18/275 22/296 26/328
Panel C: Performance change from T-1 to T+3Dependent variable: Deposit growth rateEvent year (T) 1927 1928 1929 1930 1931 1932CONS 22.0166 a 9.5279 -0.4428 5.9659 5.168 -4.6843
(7.6152) (6.4004) (4.9593) (6.2549) (7.5685) (4.9778)LN(ASSET) 1.1722 0.7235 2.091 3.8512 b 5.7957 a 7.3843 a
(1.71) (2.0187) (1.7121) (1.8649) (1.5524) (1.9119)URBAN -5.3442 7.4951 -1.4835 -2.6494 -5.4994 -5.8325
(4.9892) (10.3075) (4.4597) (4.2317) (4.4987) (4.6038)⊿BRANCH 1.9347 b 2.7135 a 3.0682 a 4.6971 a 4.2788 a 4.859 b
(0.8868) (0.638) (0.836) (0.706) (1.3857) (1.9196)INTERCEPT -25.5295 -30.1874 -48.4047 c -73.0008 b -95.4664 a -107.885 a
(24.4846) (29.5389) (25.5697) (28.3436) (23.1868) (28.044)
R2 0.022 0.014 0.055 0.103 0.113 0.127NOB (consolidated/other) 26/474 41/389 31/260 18/275 22/296 26/328Notes: Significance at 1%,5% and 10% level are denoted by "a" "b" and "c". The figures in parentheses are robust standard errors. Significance levels are reported for two-tail tests.Variables: See appendix

Table 5 Effect of consolidation on ROA
Panel A Baseline estimationDependent variable Change of ROA from T-1 to T+2 or T+3Window [T-1, T+2] [T-1, T+3] [T-1, T+2] [T-1, T+3]
[1] [2] [3] [4]CONS -0.4144 b -0.4836 b
(0.1904) (0.2434)-0.5856 a -0.6524 b(0.204) (0.2697)
Strategic consolidation 0.2696 0.1885(0.3145) (0.3648)
LN(ASSET) 0.2403 a 0.248 a 0.2332 a 0.2407 a(0.0744) (0.0699) (0.0753) (0.0707)
URBAN 0.491 a 0.5567 a 0.4964 a 0.5622 a(0.1794) (0.1779) (0.1792) (0.1777)
⊿BRANCH 0.0625 b 0.0595 0.0663 b 0.0621(0.0308) (0.0466) (0.0311) (0.047)
INTERCEPT -5.0544 a -5.5628 a -4.9521 a -5.4582 a(1.1012) (1.0593) (1.1129) (1.0701)
Event Year Dummy Yes Yes Yes YesR2 0.05 0.08 0.051 0.081NOB (consolidated/other) 152/1822 152/1822 152/1822 152/1822
Panel B Adjusting sample selection biasDependent variable Change of ROA from T-1 to T+2 or T+3Window [T-1, T+2] [T-1, T+3] [T-1, T+2] [T-1, T+3]
[1] [2] [3] [4]CONS -0.4121 b -0.5109 b
(0.1894) (0.2349)-0.656 a -0.6509 b
(0.2063) (0.2686)Strategic consolidation 0.1973 0.1899
(0.3195) (0.3631)LN(ASSET) 0.2416 a 0.2325 a 0.1947 b 0.2415 a
(0.0748) (0.0809) (0.0844) (0.0709)URBAN 0.4912 a 0.5559 a 0.5021 a 0.5623 a
(0.179) (0.1779) (0.1827) (0.1773)⊿BRANCH 0.0625 b 0.0578 0.058 c 0.0621
(0.0307) (0.0437) (0.0305) (0.0468)INTERCEPT -5.0906 a -5.1521 a -3.9698 a -5.4807 a
(1.1121) (1.4027) (1.3089) (1.0779)(Selection model)CONS 0.1168 0.1071 0.0562 0.117
(0.1538) (0.1547) (0.1434) (0.1538)LN(ASSET) 0.0654 b 0.0613 c 0.0495 0.0654 b
(0.0321) (0.0363) (0.0418) (0.0321)URBAN 0.012 0.0221 0.0495 0.0119
(0.086) (0.095) (0.0873) (0.086)INTERCEPT 0.2414 0.3012 0.4242 0.2423
(0.4597) (0.513) (0.5742) (0.4596)
rho -0.2597 0.0229 -0.5600 0.0149(p-value) 0.2002 0.6396 0.0373 b 0.5015Event Year Dummy Yes Yes Yes Yeslikelihood -5856.74 -5770.75 -5845.09 -5770.12NOB 2186 2186 2186 2186Censored 212 212 212 212Notes:Significance at 1%,5% and 11% level are denoted by "a" "b" and "c".The figures in parentheses are robust standard errors. Significance levels are reported for two-tail tests.
Variables: See appendix
Policy-promotedconsolidation
Policy-promotedconsolidation
Event year dummies are included in both primary and selection equation as forsample selection model.

Table6 Consolidation pattern and bank performance
Panel A: Change of ROADependent variable Change of ROA from T-1 to T+2 or T+3Window [T-1, T+2] [T-1, T+3] [T-1, T+2] [T-1, T+3] [T-1, T+2] [T-1, T+3]
[1] [2] [3] [4] [5] [6](Consolidation pattern dummy)Policy-promoted & Absorbing -0.3545 -0.3058
(0.241) (0.3106)Policy-promoted & Merger of equals -1.0123 a -1.2947 a
(0.3142) (0.4482)Strategic & Absorbing 0.3521 0.4168
(0.3274) (0.3352)Strategic & Merger of equals -0.0876 -0.8016
(0.7035) (0.9961)Policy-promoted & One-to-one -0.4157 b -0.5276 c
(0.2021) (0.2786)Policy-promoted & More than two -1.0769 b -1.0137 c
(0.4644) (0.6052)Strategic & One-to-one 0.2979 0.2493
(0.3339) (0.386)Strategic & More than two -0.2613 -0.7863
(0.1846) (0.6936)Policy-promoted & In-market -0.677 a -0.7707 b
(0.2347) (0.3228)Policy-promoted & Out-of-market -0.2175 -0.1779
(0.2713) (0.2674)Strategic & In-market -0.2833 -0.4427
(0.308) (0.3883)Strategic & Out-of-market 0.982 b 1.0021 b
(0.4769) (0.5086)LN(ASSET) 0.2301 a 0.2351 a 0.2325 a 0.24 a 0.2301 a 0.2368 a
(0.0754) (0.0706) (0.0752) (0.0706) (0.0753) (0.0706)URBAN 0.4908 a 0.5521 a 0.4922 a 0.5584 a 0.4936 a 0.5588 a
(0.1792) (0.1773) (0.1795) (0.1782) (0.1793) (0.1779)⊿BRANCH 0.0644 b 0.0583 0.064 b 0.0606 0.0646 b 0.0599
(0.0315) (0.0474) (0.0319) (0.0479) (0.0311) (0.047)INTERCEPT -0.4654 b -0.4305 c -0.4558 b -0.4186 c -0.4729 b -0.4384 c
(0.2153) (0.2314) (0.2159) (0.2321) (0.2157) (0.2317)
Event Year Dummy Yes Yes Yes Yes Yes YesR2 0.052 0.082 0.052 0.081 0.052 0.082NOB (consolidated/other) 152/1822 152/1822 152/1822 152/1822 152/1822 152/1822
Notes: Significance at 1%,5% and 10% level are denoted by "a" "b" and "c".The figures in parentheses are robuststandard errors Significance levels are reported for two-tail tests. As for variables, see appendix.

Table6 Consolidation pattern and bank performance
Panel B: Deposit Growth RateDependent Variable Deposit Growth Rate
Window [T-1, T+2] [T-1, T+3] [T-1, T+2] [T-1, T+3] [T-1, T+2] [T-1, T+3][1] [2] [3] [4] [5] [6]
(Consolidation pattern dummy)Policy-promoted & Absorbing 6.5964 b 3.4242
(3.1262) (3.6891)Policy-promoted & Merger of equals 8.6484 b 9.2367 c
(4.3406) (5.4936)Strategic & Absorbing 6.1367 4.8949
(4.895) (5.1322)Strategic & Merger of equals -6.316 0.4293
(8.0399) (9.0183)Policy-promoted & One-to-one 8.1472 a 5.5468 c
(2.786) (3.3151)Policy-promoted & More than two 4.7074 4.9003
(5.7016) (7.2049)Strategic & One-to-one 2.6516 4.1971
(4.516) (4.7283)Strategic & More than two 6.8589 -0.7592
(17.7359) (17.3092)Policy-promoted & In-market 6.3 b 2.5138
(2.6765) (3.2515)Policy-promoted & Out-of-market 11.1973 16.7353 b
(6.8589) (7.8209)Strategic & In-market 3.1567 4.6471
(4.6701) (5.126)Strategic & Out-of-market 2.8501 2.4778
(8.1657) (8.0936)LN(ASSET) 1.7466 b 3.4722 a 1.7558 b 3.4594 a 1.7434 b 3.4101 a
(0.7036) (0.7502) (0.7029) (0.7486) (0.7053) (0.7514)URBAN -0.7506 -1.9893 -0.7182 -2.012 -0.7296 -2.0584
(2.5889) (2.7079) (2.5847) (2.703) (2.588) (2.7061)⊿BRANCH 2.9552 a 3.5022 a 2.9557 a 3.4994 a 2.9609 a 3.4792 a
(0.5023) (0.5196) (0.5047) (0.5192) (0.5067) (0.5233)INTERCEPT -23.5082 b -57.6983 a -23.656 b -57.5 a -23.456 b -56.726 a
(10.2302) (11.0269) (10.2186) (11) (10.2579) (11.0469)
Event Year Dummy Yes Yes Yes Yes Yes YesR2 0.063 0.057 0.063 0.057 0.063 0.058NOB (consolidated/other) 164/2022 164/2022 164/2022 164/2022 164/2022 164/2022
Notes: Significance at 1%,5% and 10% level are denoted by "a" "b" and "c".The figures in parentheses are robuststandard errors Significance levels are reported for two-tail tests. As for variables, see appendix.

Appendix Definition of variables
Panel A Basic VariablesVariable
Deposit growth rate Deposit growth rate from year T-1 to year T+2 or T+3.
Change of ROA
ASSET
⊿BRANCH
CONS
URBAN
Panel B Consolidation pattern dummy
Policy-promoted
Strategic
Absorbing The form of the consolidation was an absorption or an acquisition.
Merger of equals The form of the consolidation was a combination into a new one.
One-to-one The number of the participants was two.
More than two The number of the participants was more than two.
Out-of-market
In-market
All participants met the minimum capital criterion set by the Bank Law in1927.
Change of the ratio of profit to total assets from year T-1 to year T+2 orT+3, where the profit is the profit of the second half of the fiscal year,multiplied by two. The value of total assets in year T+2 or T+3 is modifiedaccording to footnote 26.
Explanation
At least one head office or branch office, overlapped in the same city orcountry.
Book value of capital plus total deposits. Capital equals to the sum ofpaid-in capital, reserved fund and the profit.
Change of the number of branches from year T-1 to year T+2 or yearT+3.
Dummy variable which equals 1, if the bank was consolidated one, and 0,otherwise.
Dummy variable which equals 1, if the bank’s head office was located inTokyo, Kanagawa, Aichi, Osaka, Kyoto, or Hyogo prefecture, and 0,otherwise.
Each consolidation pattern dummy is a variable which equals 1, if the consolidation satisfied eachof the following condition, and 0 otherwise.
At least one participant bank did not meet the minimum capital criterion setby the Bank Law in 1927.
None of head offices or branch offices of the participants overlapped inthe same city or country.