![SSECT [Supporting Successful Early Childhood Transitions] SSECT [Supporting Successful Early Childhood Transitions] POMS TA Consultant POMS TA Consultant.](https://static.fdocuments.us/doc/165x107/551c5145550346a5458b4d30/ssect-supporting-successful-early-childhood-transitions-ssect-supporting-successful-early-childhood-transitions-poms-ta-consultant-poms-ta-consultant.jpg)
Effective Practices Supporting Early Childhood Outcome Measurement
83
NC EARLY LEARNING NETWORK IS A JOINT PROJECT OF THE NC DEPARTMENT OF PUBLIC INSTRUCTION, OFFICE OF EARLY LEARNING AND UNC FRANK PORTER GRAHAM CHILD DEVELOPMENT INSTITUTE Effective Practices Supporting Early Childhood Outcome Measurement Overview of the Child Outcomes System
-
Upload
lael-walters -
Category
Documents
-
view
41 -
download
0
description
Effective Practices Supporting Early Childhood Outcome Measurement. Overview of the Child Outcomes System. What we will cover. Why are we doing this? What are the three child outcomes? What is functional performance and how do we measure it? What is the 7 point rating scale ? - PowerPoint PPT Presentation
Transcript of Effective Practices Supporting Early Childhood Outcome Measurement
NC EARLY LEARNING NETWORK IS A JOINT PROJECT OF THE NC DEPARTMENT OF PUBLIC INSTRUCTION, OFFICE OF EARLY LEARNING AND UNC FRANK PORTER GRAHAM CHILD DEVELOPMENT INSTITUTE
Effective Practices Supporting Early Childhood Outcome Measurement
Overview of the Child Outcomes System
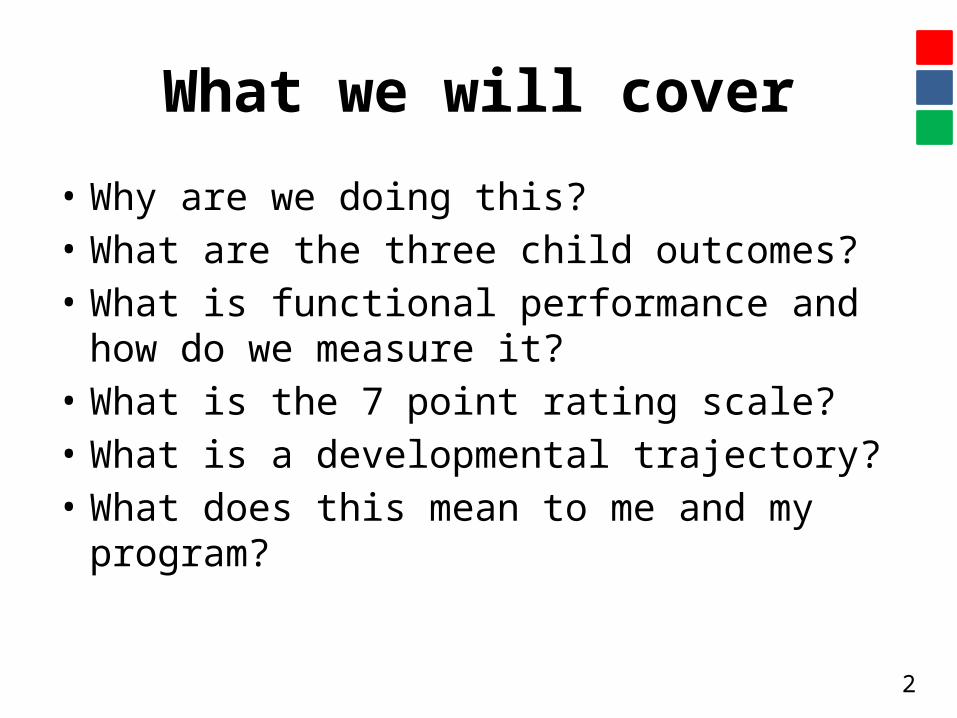
What we will cover
• Why are we doing this?• What are the three child outcomes?• What is functional performance and how do
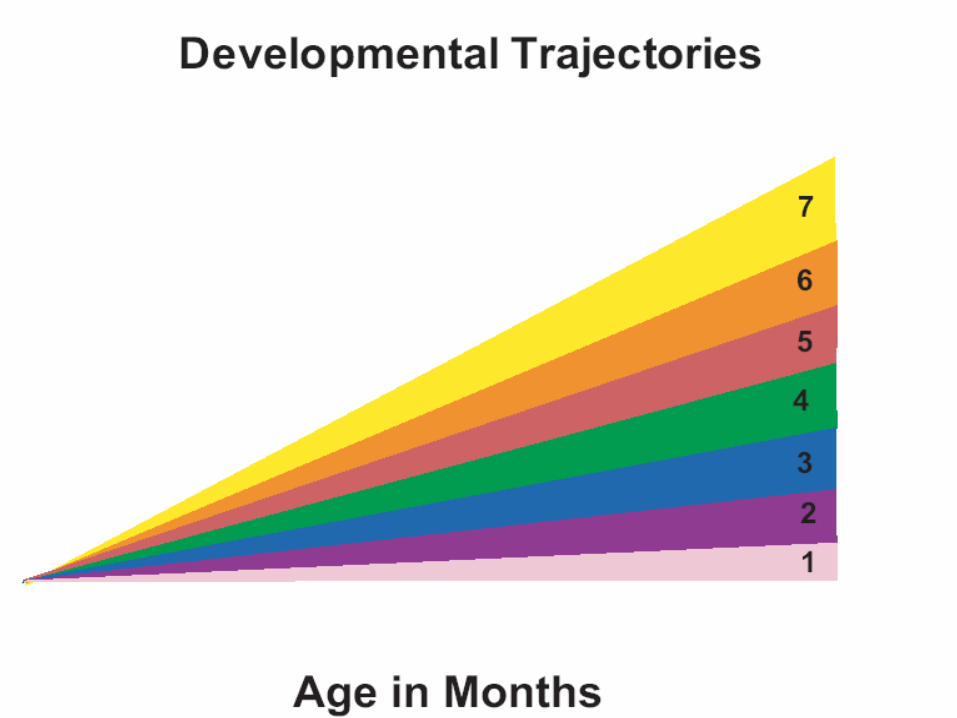
we measure it?• What is the 7 point rating scale?• What is a developmental trajectory?• What does this mean to me and my program?
2
WHAT ARE THE EXPECTATIONS OF PROFESSIONALS WHO DO THE COS RATINGS?
Reliable and Valid Child Outcome Summary (COS) Ratings
3
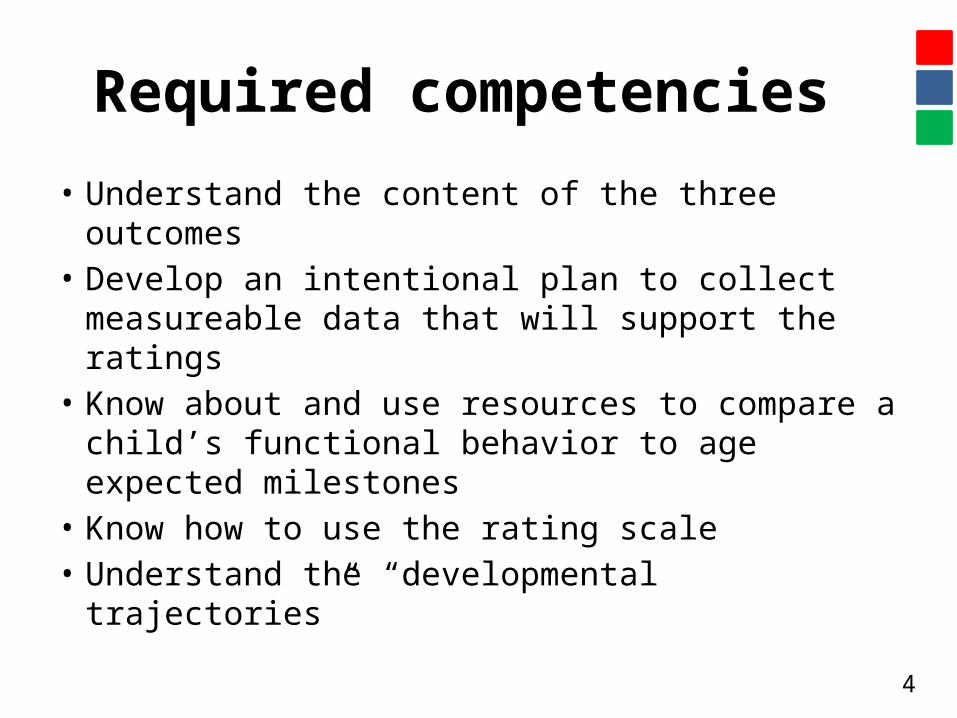
Required competencies
• Understand the content of the three outcomes• Develop an intentional plan to collect
measureable data that will support the ratings • Know about and use resources to compare a
child’s functional behavior to age expected milestones
• Know how to use the rating scale• Understand the “developmental trajectories”
4
WHY ARE WE DOING THIS?
Measuring and collecting child outcomes data
5
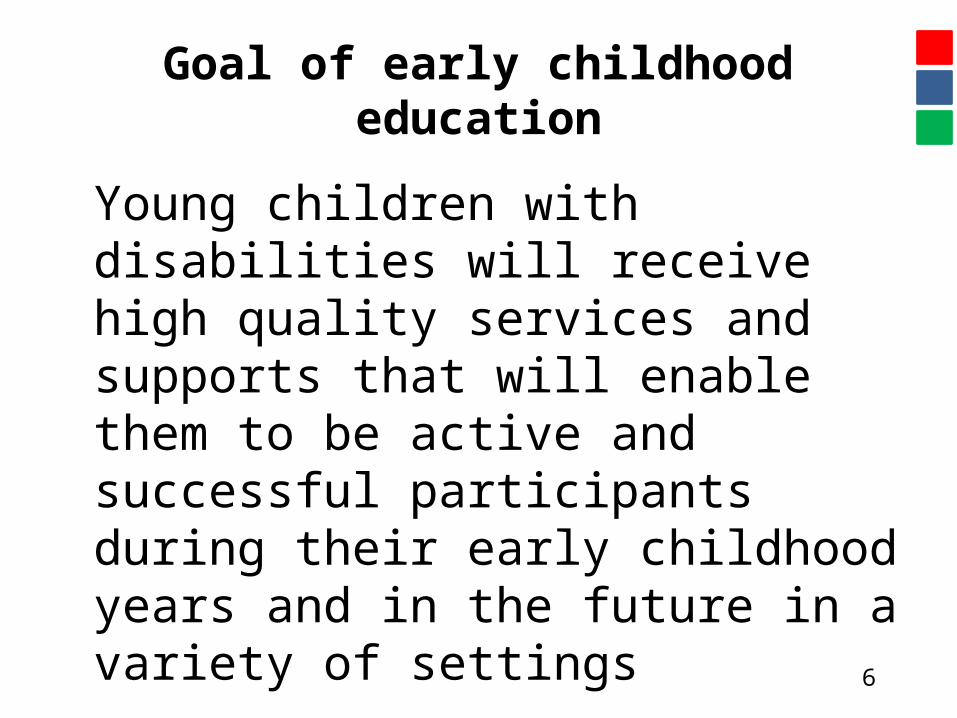
Goal of early childhood education
Young children with disabilities will receive high quality services and supports that will enable them to be active and successful participants during their early childhood years and in the future in a variety of settings
6
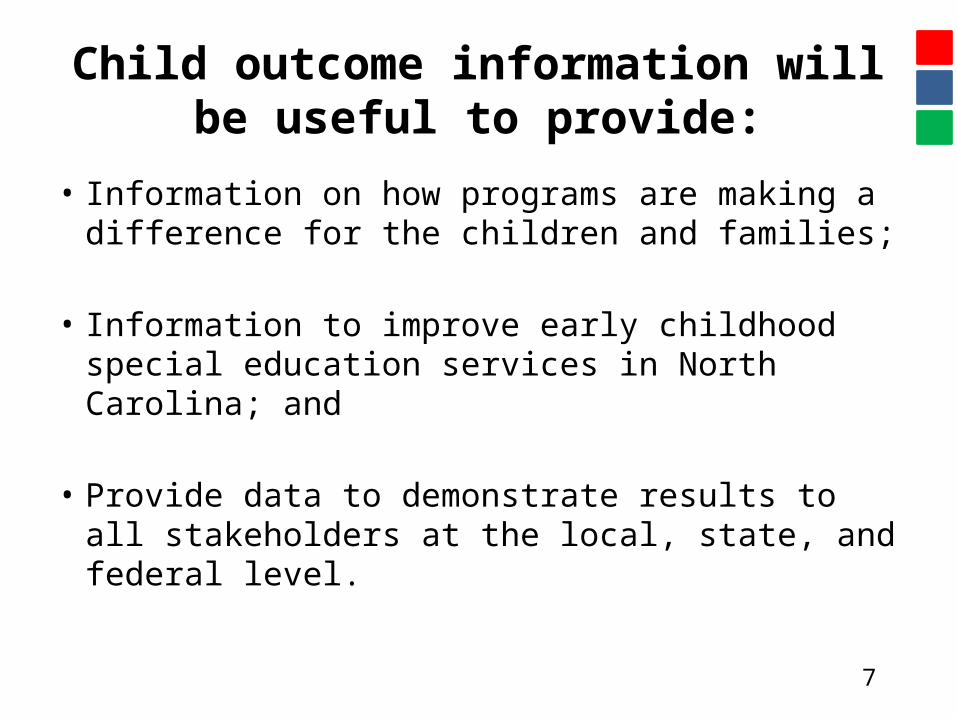
Child outcome information will be useful to provide:
• Information on how programs are making a difference for the children and families;
• Information to improve early childhood special education services in North Carolina; and
• Provide data to demonstrate results to all stakeholders at the local, state, and federal level.
7
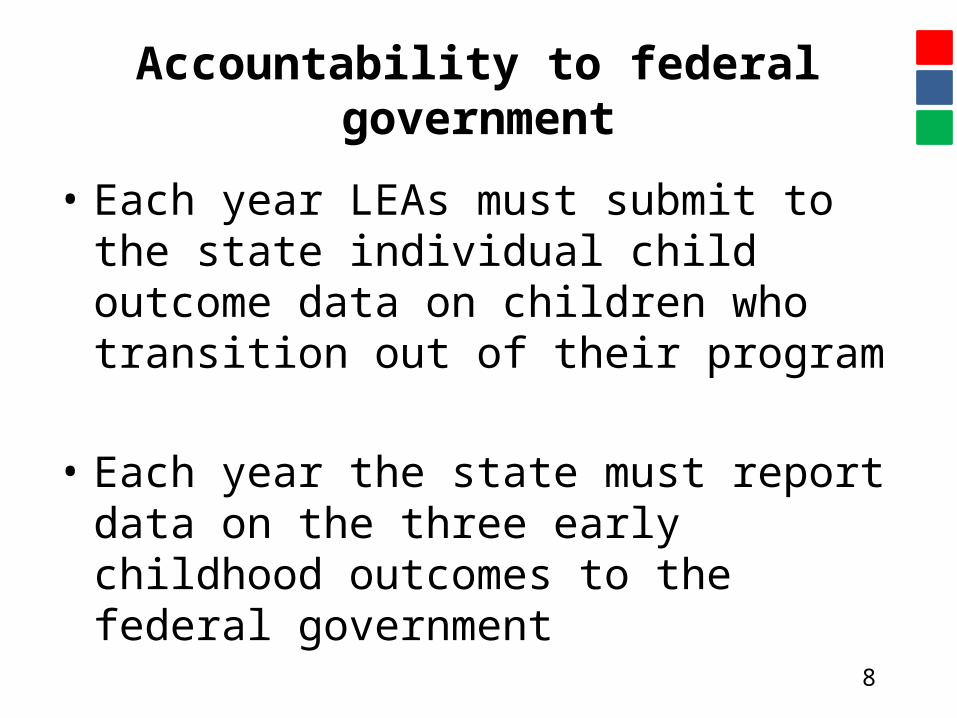
Accountability to federal government
• Each year LEAs must submit to the state individual child outcome data on children who transition out of their program
• Each year the state must report data on the three early childhood outcomes to the federal government
8
WHAT ARE THE THREE CHILD OUTCOMES?
9

“Child Outcomes Step by Step”
• Edelman, L. (Producer). (2011). Child Outcomes Step-by-Step (Video). Published collaboratively by Results Matter, Colorado Department of Education; Desired Results access Project, Napa County Office of Education; and Early Childhood Outcomes Center.
10
• Insert video here
11
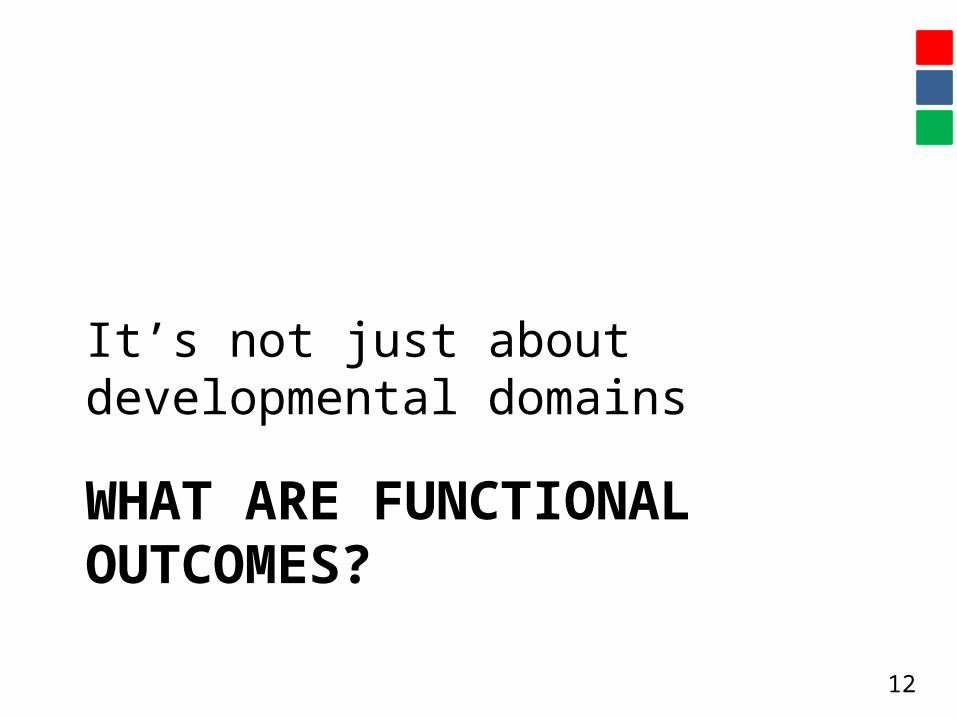
WHAT ARE FUNCTIONAL OUTCOMES?
It’s not just about developmental domains
12
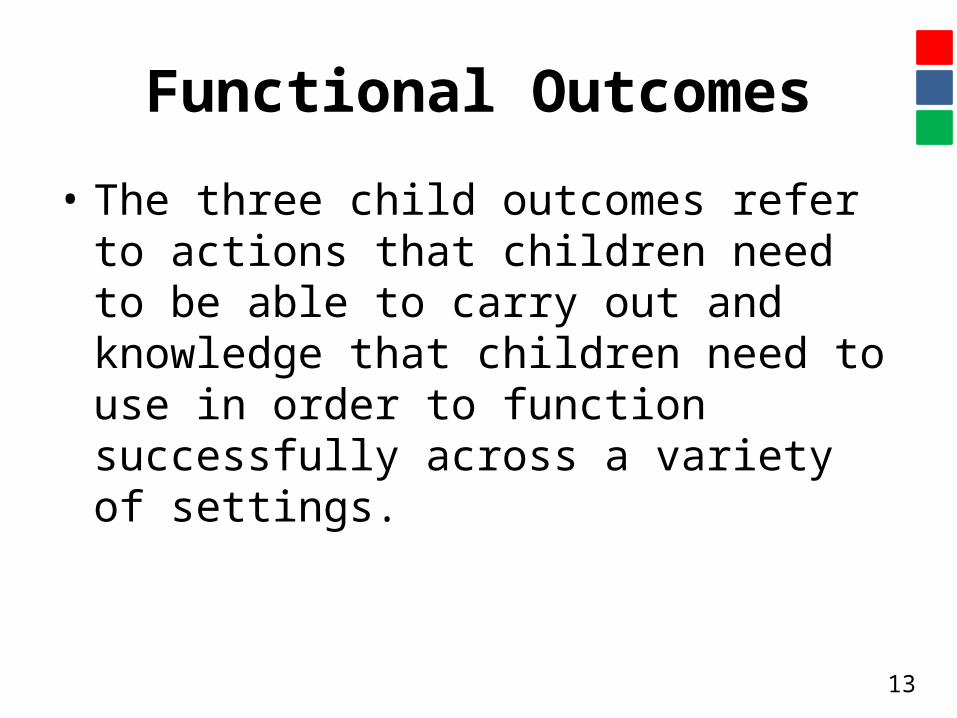
Functional Outcomes
• The three child outcomes refer to actions that children need to be able to carry out and knowledge that children need to use in order to function successfully across a variety of settings.
13
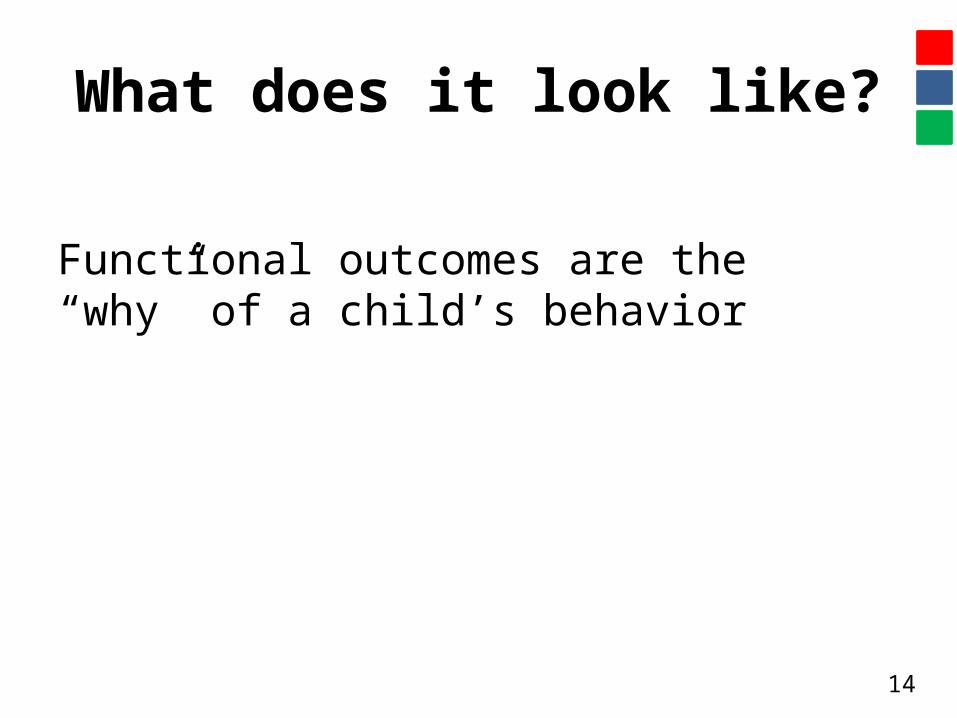
What does it look like?
Functional outcomes are the “why” of a child’s behavior
14
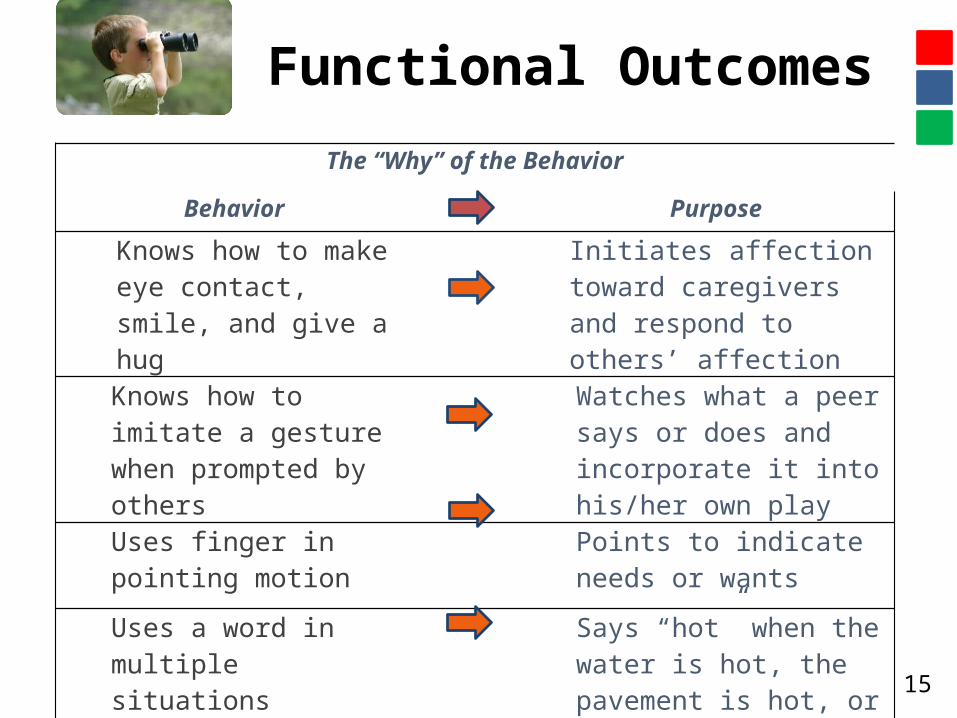
The “Why” of the Behavior
Behavior Purpose
Knows how to make eye contact, smile, and give a hug
Initiates affection toward caregivers and respond to others’ affection
Knows how to imitate a gesture when prompted by others
Watches what a peer says or does and incorporate it into his/her own play
Uses finger in pointing motion
Points to indicate needs or wants
Uses a word in multiplesituations
Says “hot” when the water is hot, the pavement is hot, or the food is hot to protest that he does not like it
15
Functional Outcomes
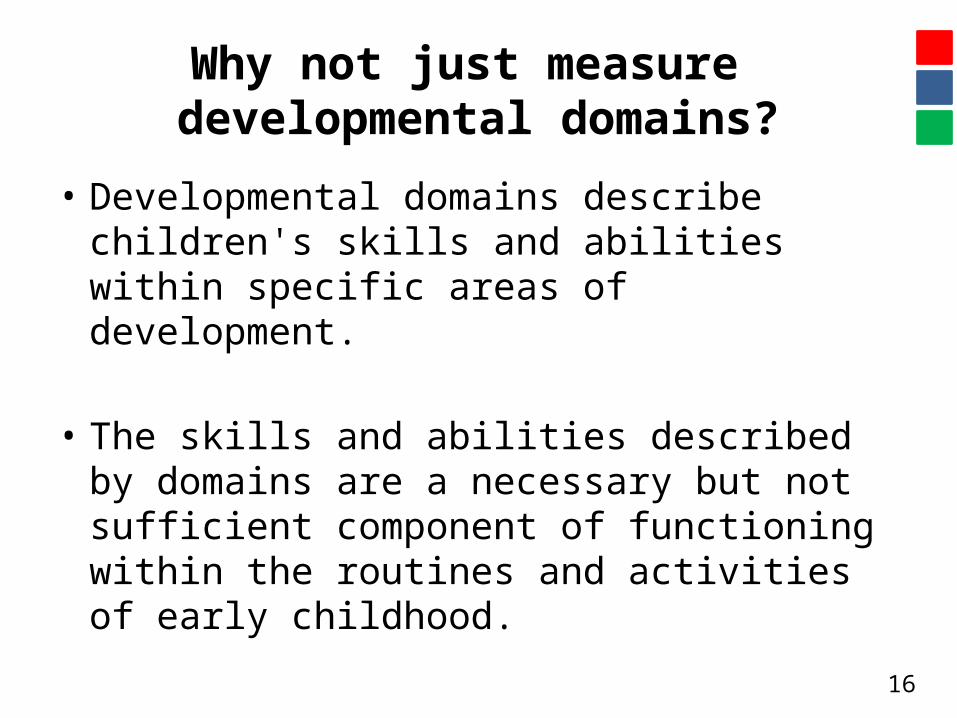
Why not just measure developmental domains?
• Developmental domains describe children's skills and abilities within specific areas of development.
• The skills and abilities described by domains are a necessary but not sufficient component of functioning within the routines and activities of early childhood.
16
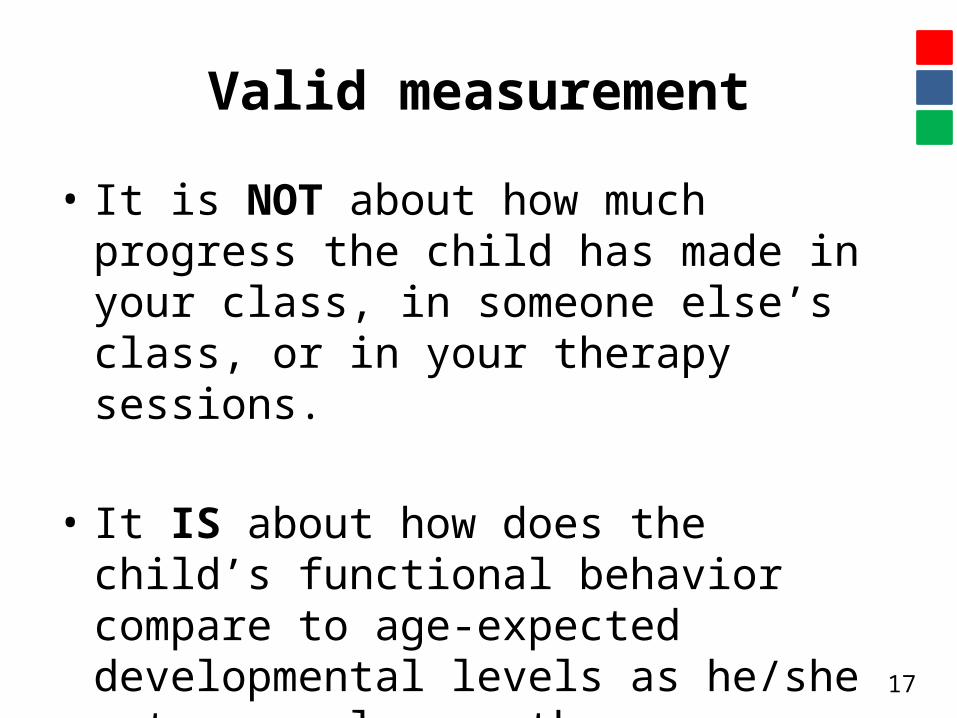
Valid measurement
• It is NOT about how much progress the child has made in your class, in someone else’s class, or in your therapy sessions.
• It IS about how does the child’s functional behavior compare to age-expected developmental levels as he/she enters or leaves the program.
17

Positive Social Relationships Involves:
–Relating with adults–Relating with other children– For older children, following rules related
to groups or interacting with others
18
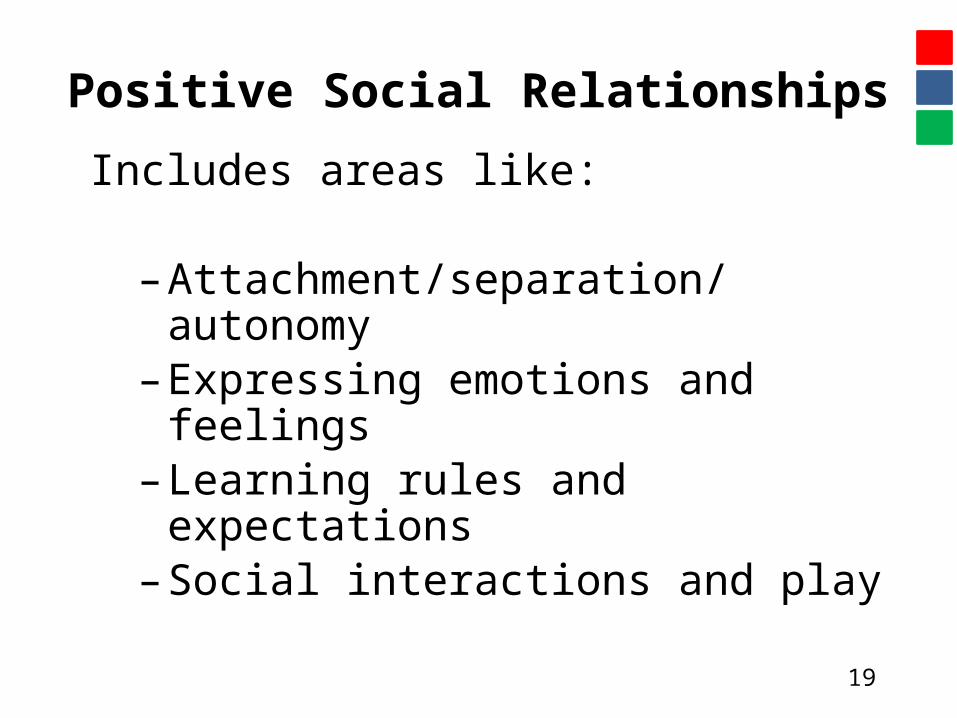
Positive Social Relationships Includes areas like:
–Attachment/separation/autonomy– Expressing emotions and feelings– Learning rules and expectations– Social interactions and play
19
Acquisition of Knowledge and Skills
Involves:
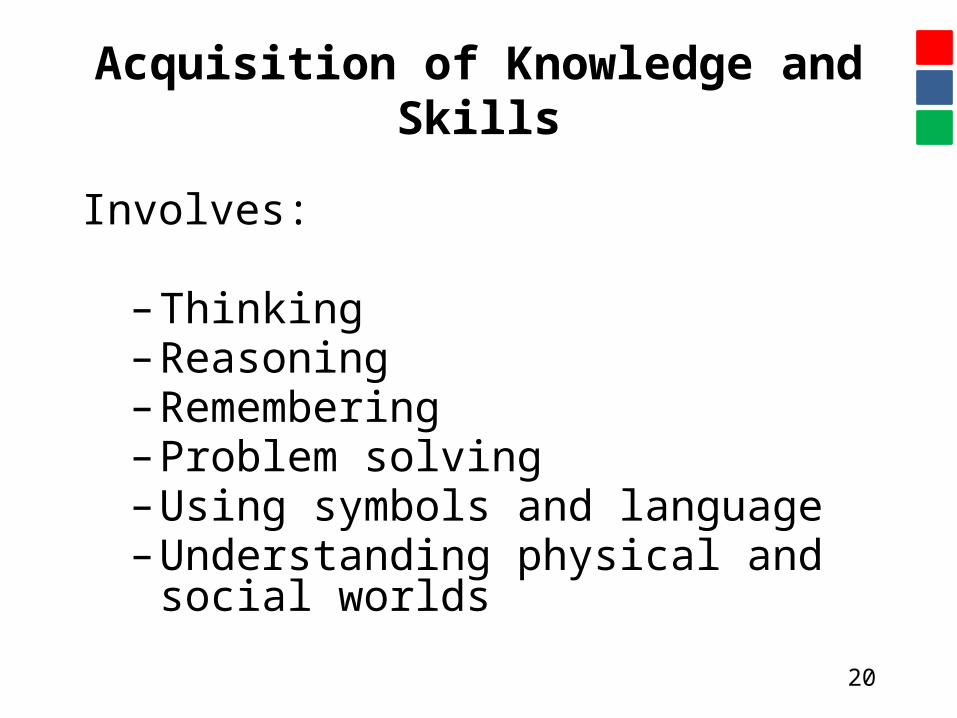
– Thinking–Reasoning–Remembering–Problem solving–Using symbols and language–Understanding physical and social worlds
20
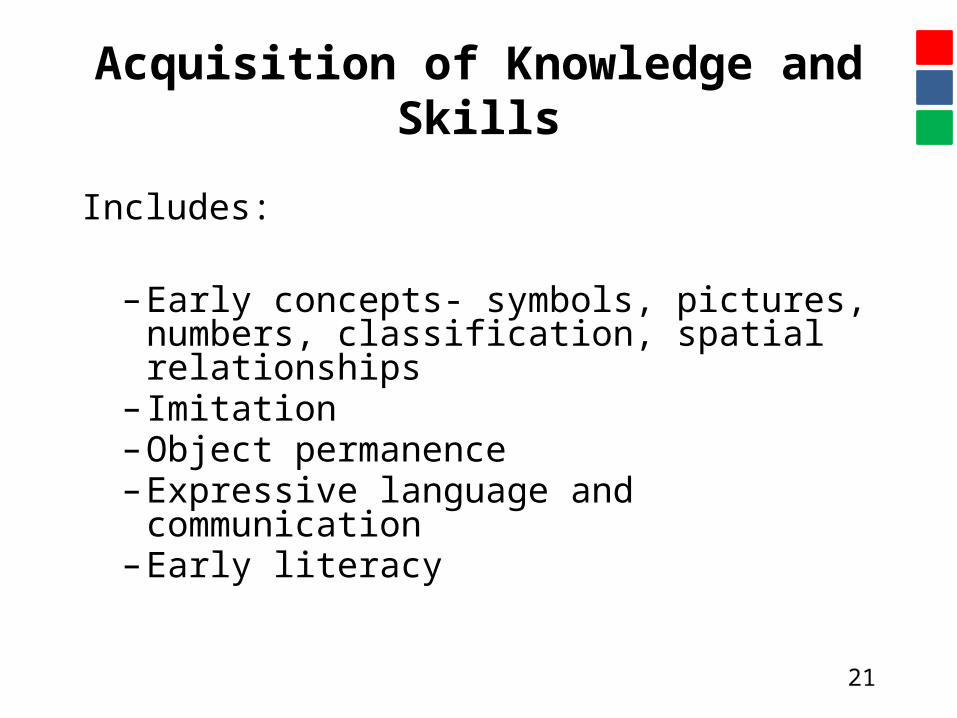
Acquisition of Knowledge and Skills
Includes:
– Early concepts- symbols, pictures, numbers, classification, spatial relationships– Imitation–Object permanence– Expressive language and communication– Early literacy
21
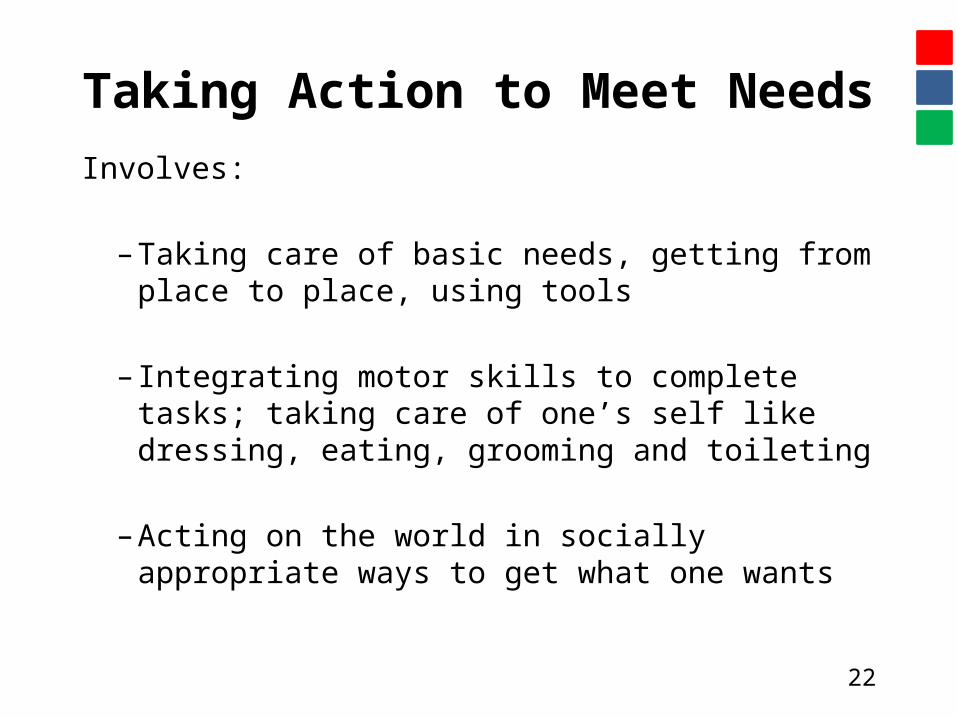
Taking Action to Meet NeedsInvolves:
– Taking care of basic needs, getting from place to place, using tools
– Integrating motor skills to complete tasks; taking care of one’s self like dressing, eating, grooming and toileting
– Acting on the world in socially appropriate ways to get what one wants
22
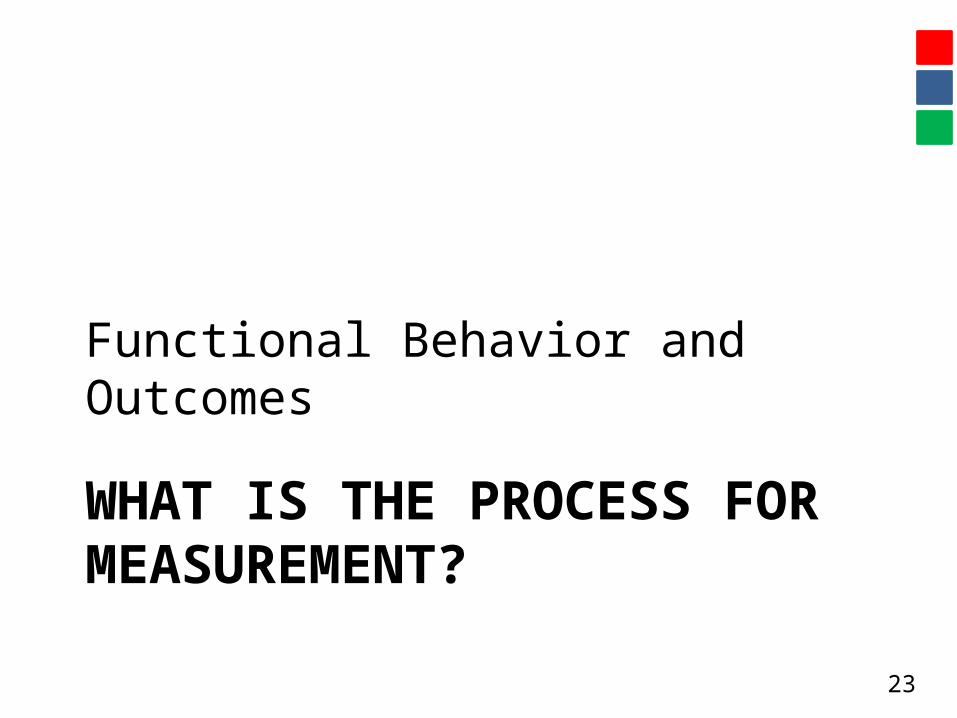
WHAT IS THE PROCESS FOR MEASUREMENT?
Functional Behavior and Outcomes
23
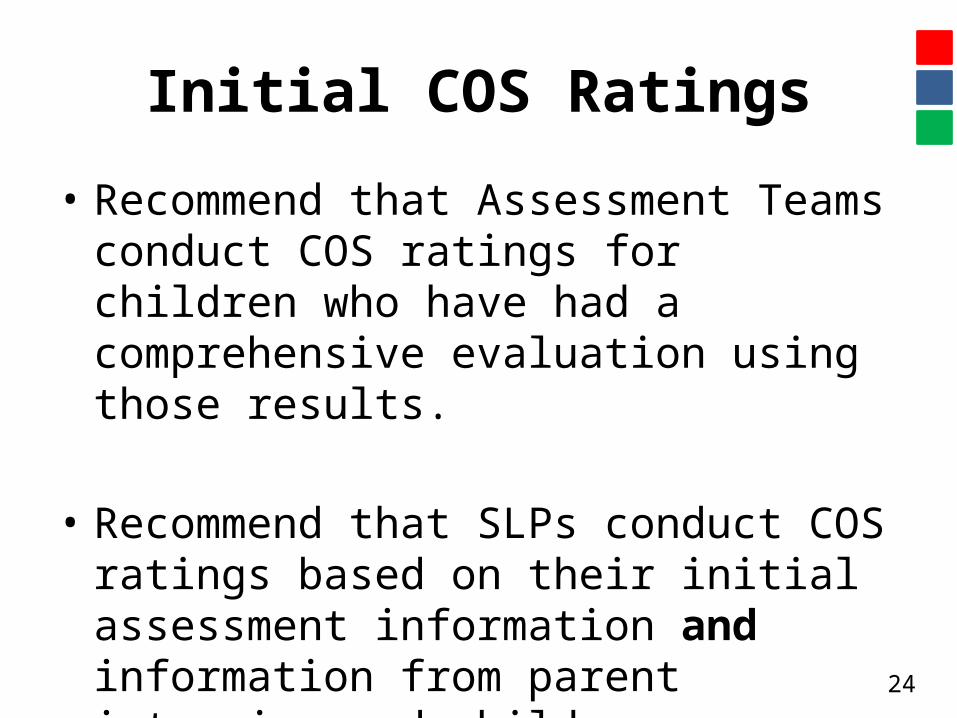
Initial COS Ratings
• Recommend that Assessment Teams conduct COS ratings for children who have had a comprehensive evaluation using those results.
• Recommend that SLPs conduct COS ratings based on their initial assessment information and information from parent interview and child observations.
24
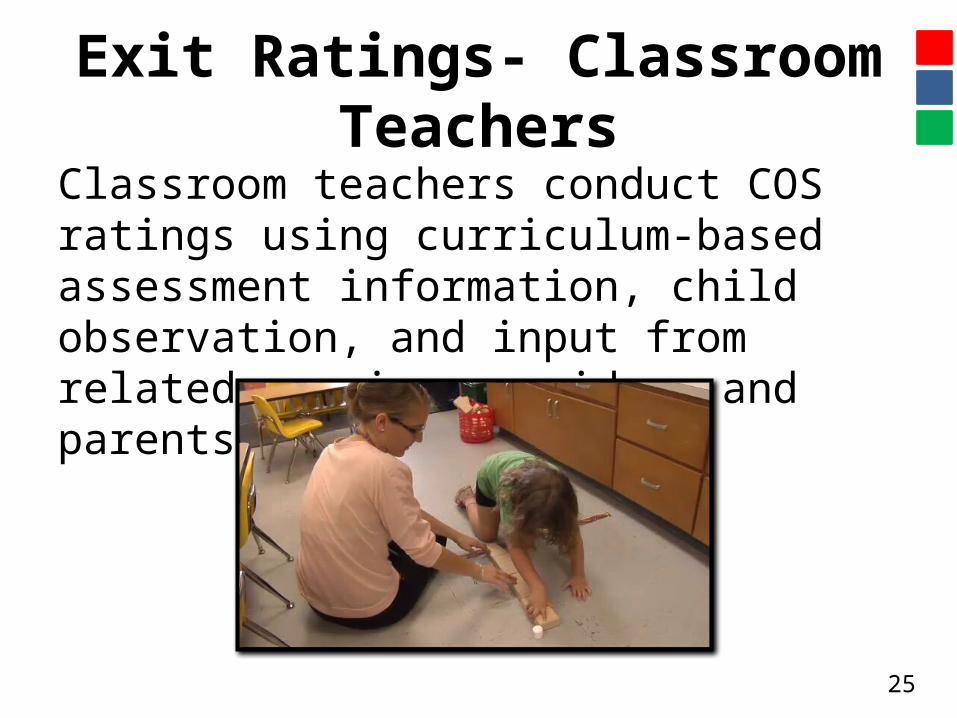
Exit Ratings- Classroom TeachersClassroom teachers conduct COS ratings using curriculum-based assessment information, child observation, and input from related service providers and parents.
25
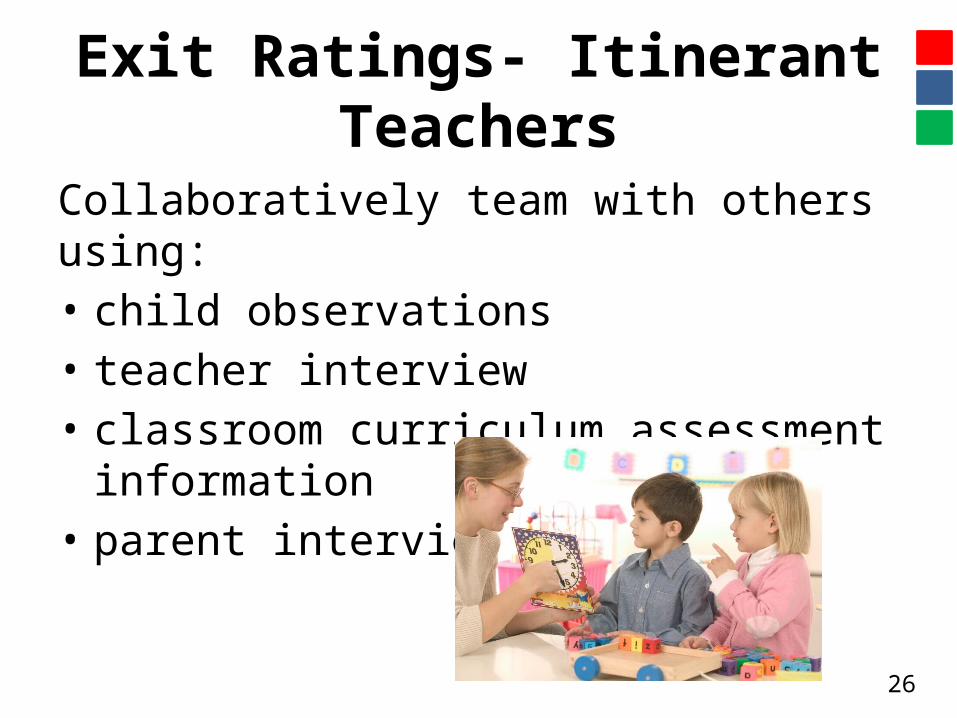
Exit Ratings- Itinerant Teachers
Collaboratively team with others using:• child observations• teacher interview • classroom curriculum assessment information• parent interview
26
27
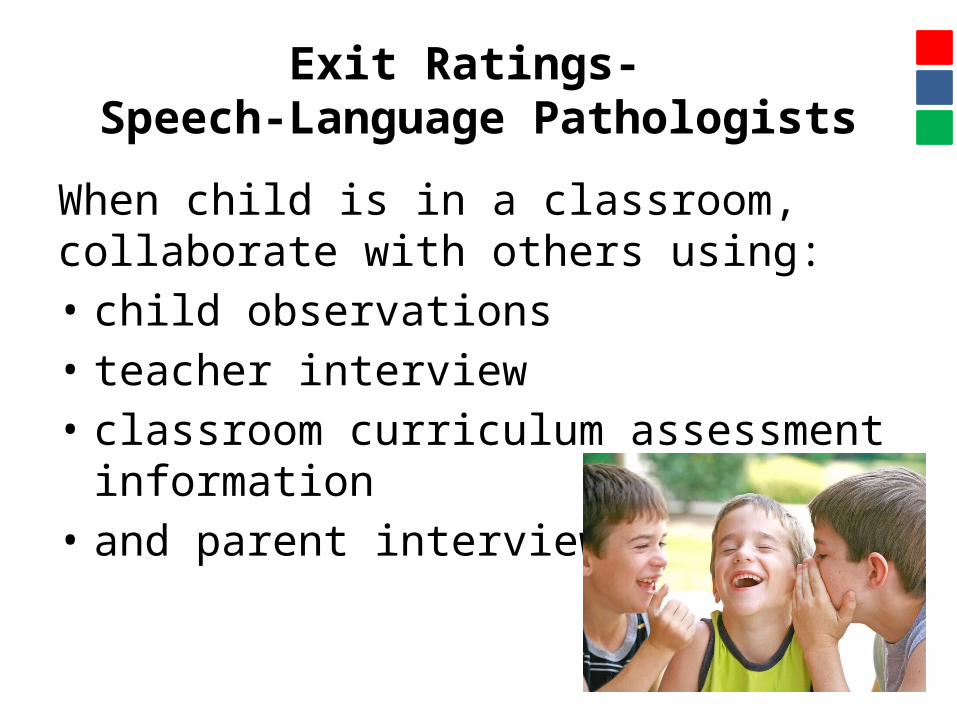
Exit Ratings- Speech-Language Pathologists
When child is in a classroom, collaborate with others using:• child observations• teacher interview • classroom curriculum assessment information • and parent interview
Service Provider Location
• When a child is driven into a specific location to receive services, the collection of valid and reliable outcomes data can be challenging.
• You must intentionally plan to collect data from outside the service location at critical times in the year.
28
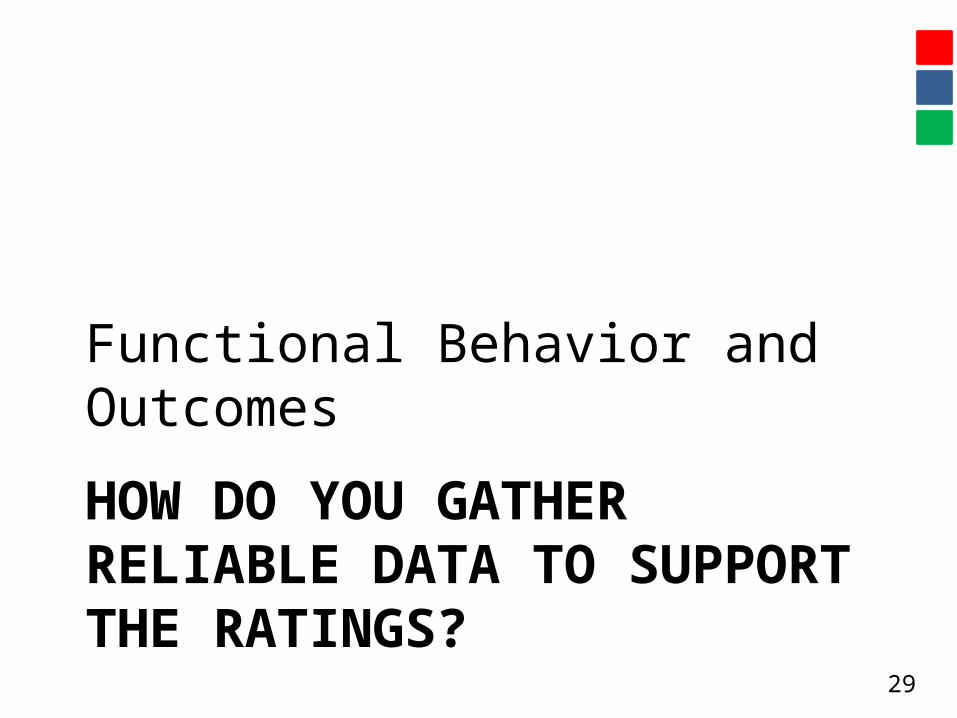
HOW DO YOU GATHER RELIABLE DATA TO SUPPORT THE RATINGS?
Functional Behavior and Outcomes
29
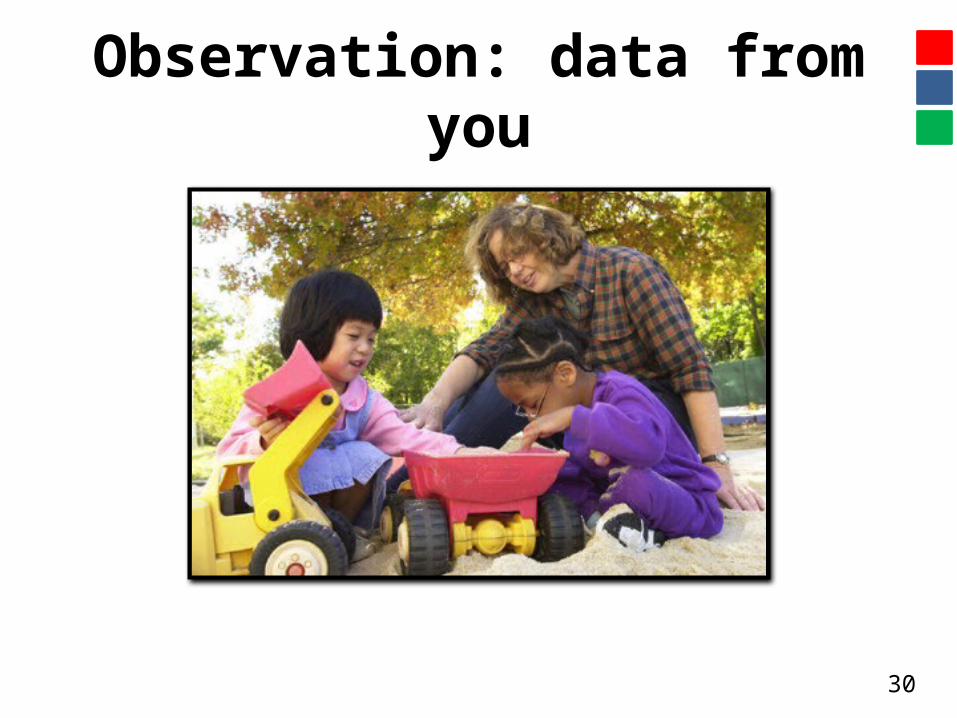
Observation: data from you
30
Scripted observations
31
Interpreting observations
32
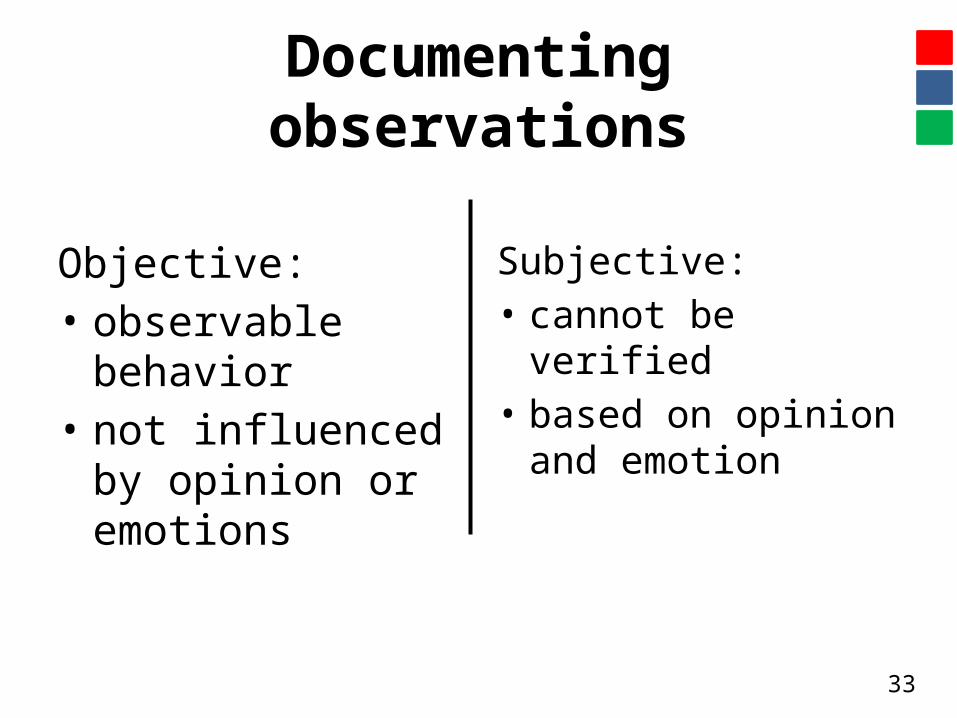
Documenting observations
Objective:• observable behavior• not influenced by
opinion or emotions
Subjective:• cannot be verified• based on opinion
and emotion
33
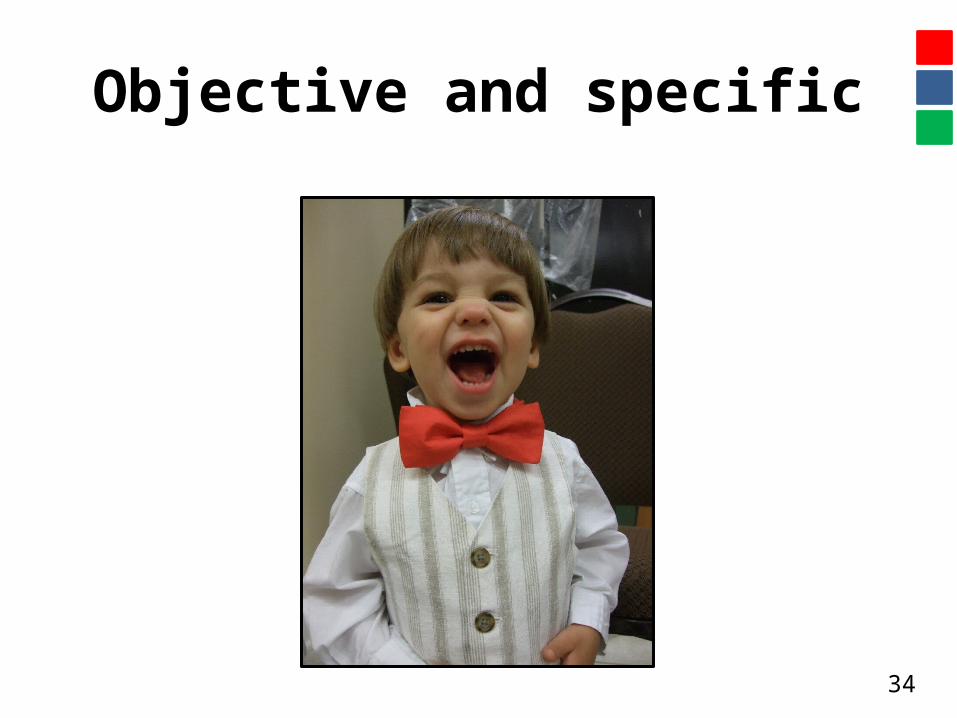
Objective and specific
34
Observing Nathan
35
Activity: Watch a video of a child in play
• Write down everything you see Nathan do in this video tape clip
• Note his exact actions and “script” them in objective language
• Insert Nathan Video here
36
Collecting data from other sources
• Classroom data from portfolio collection and curriculum assessment process
• Interviews that collect data about the child’s functioning in everyday routines
37
38
Activity
• Organizing the data
• HO: Teacher Completed Observational Notes for Nathan.
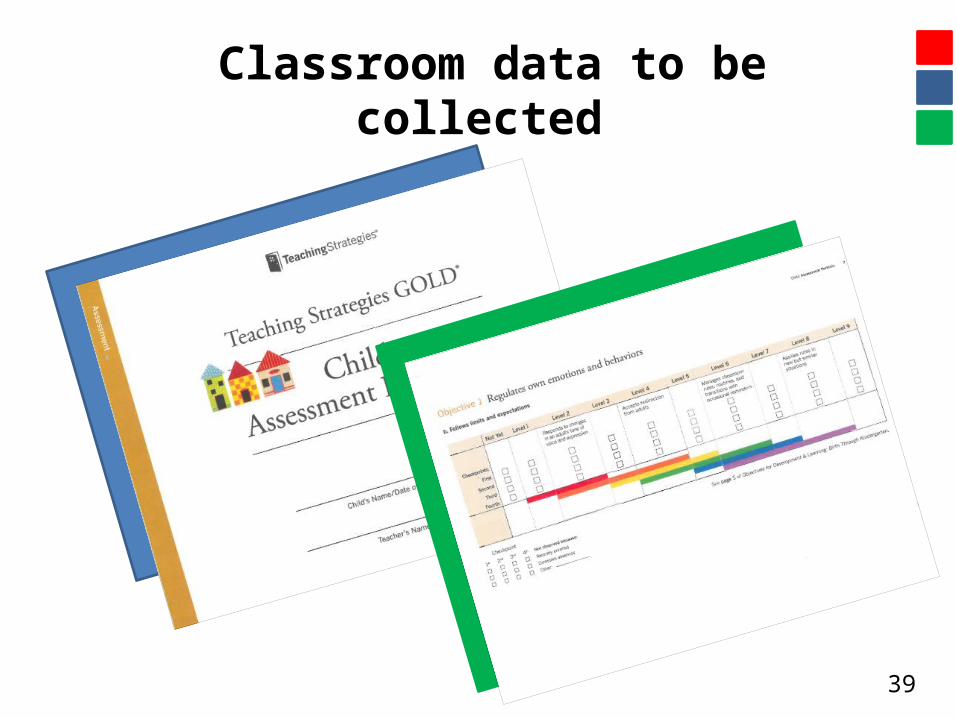
Classroom data to be collected
39
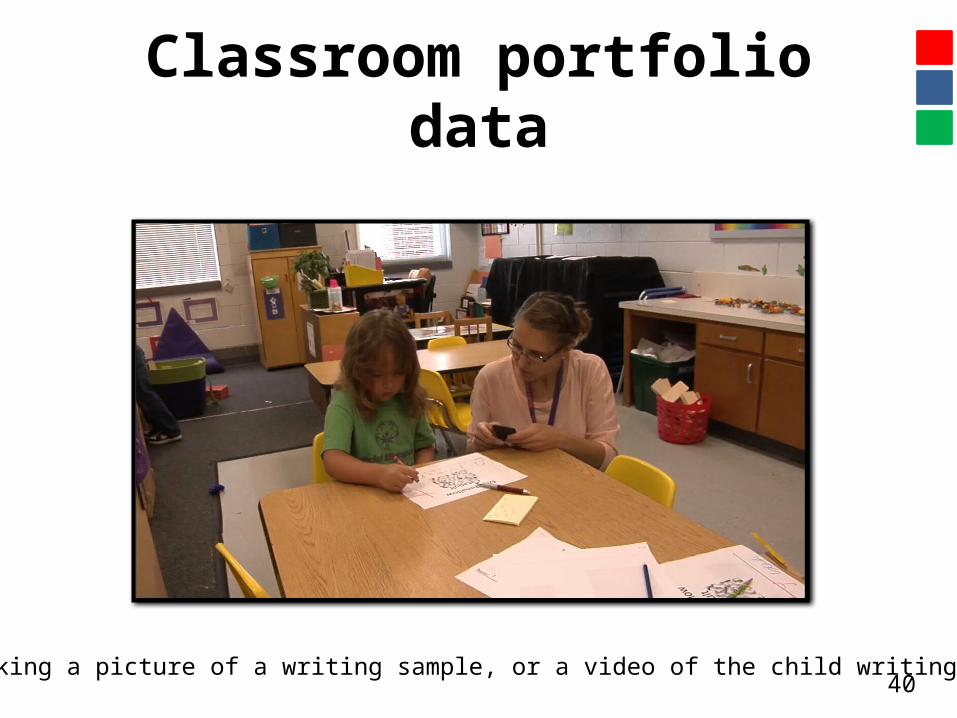
Classroom portfolio data
40Taking a picture of a writing sample, or a video of the child writing
Classroom portfolio data
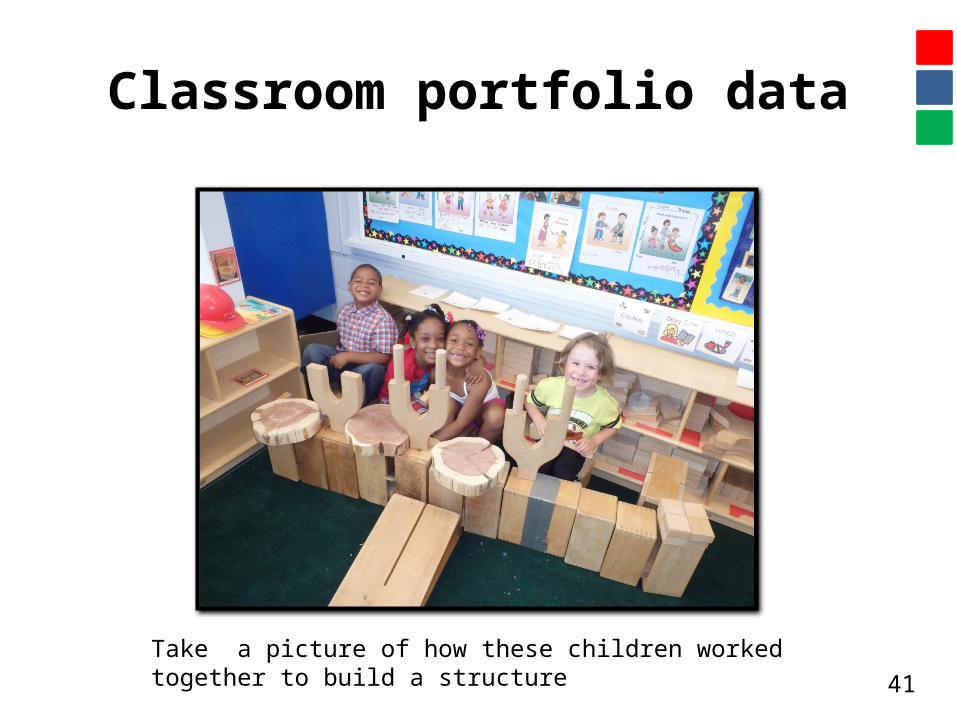
41
Take a picture of how these children worked together to build a structure

Classroom portfolio data
42Take a picture and write exactly what the child said to his friend when they were cooking together
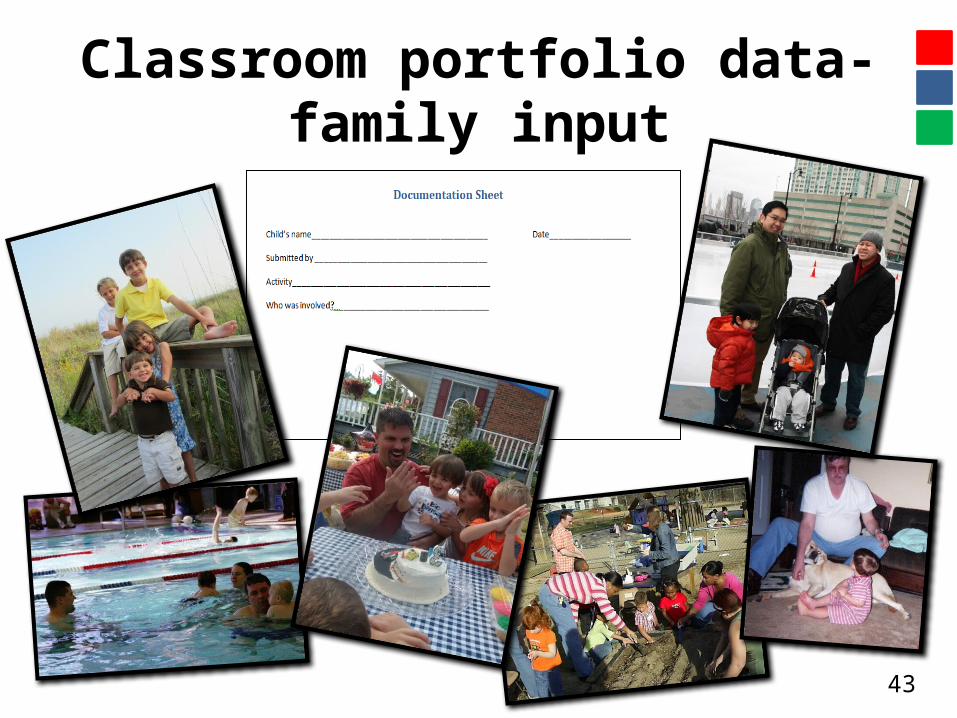
Classroom portfolio data- family input
43
How those classroom teachers do it!
Embed the video of Amy from Cabarrus
44
Use what they’ve already got!
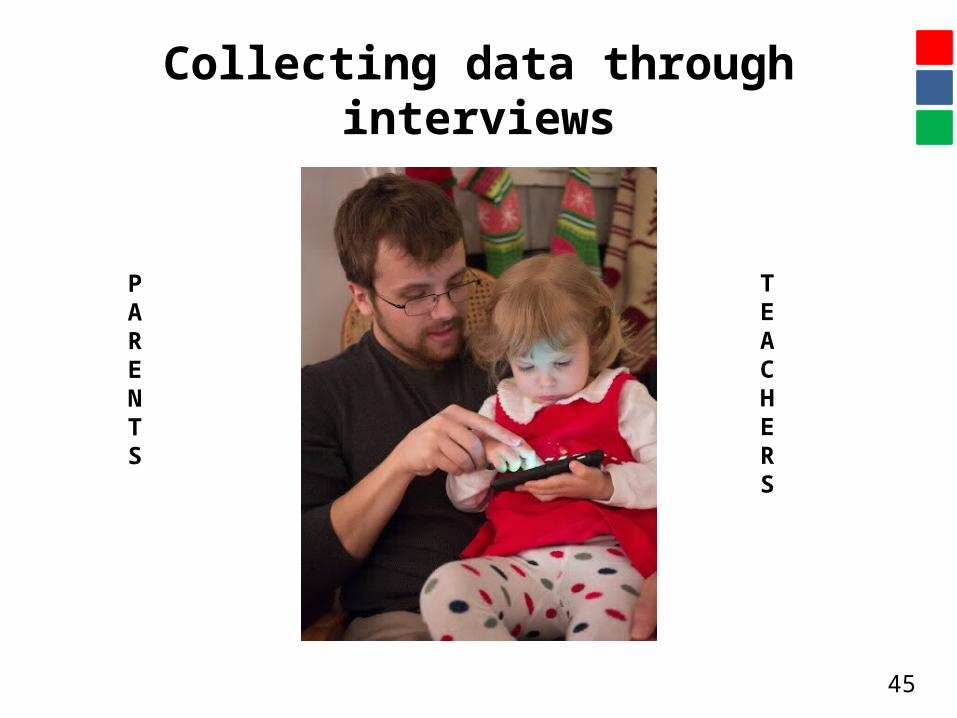
Collecting data through interviews
45
PARENTS
TEACHERS
46
HOW DO I MEASURE THIS DATA?
47
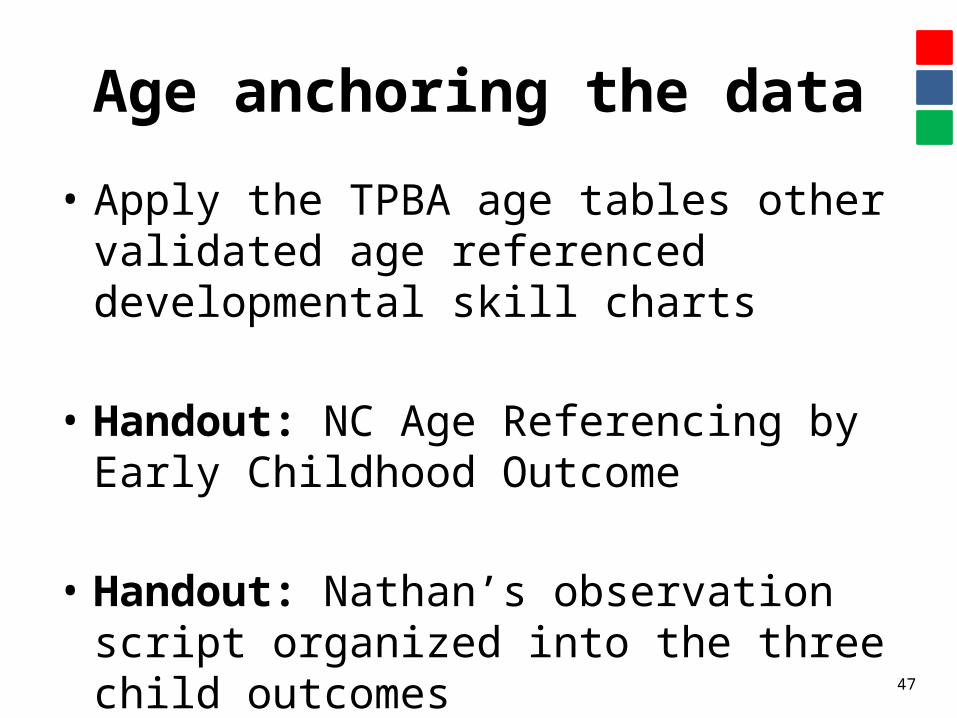
Age anchoring the data
• Apply the TPBA age tables other validated age referenced developmental skill charts
• Handout: NC Age Referencing by Early Childhood Outcome
• Handout: Nathan’s observation script organized into the three child outcomes
48
NOW, HOW DO I DO THE RATING?
49
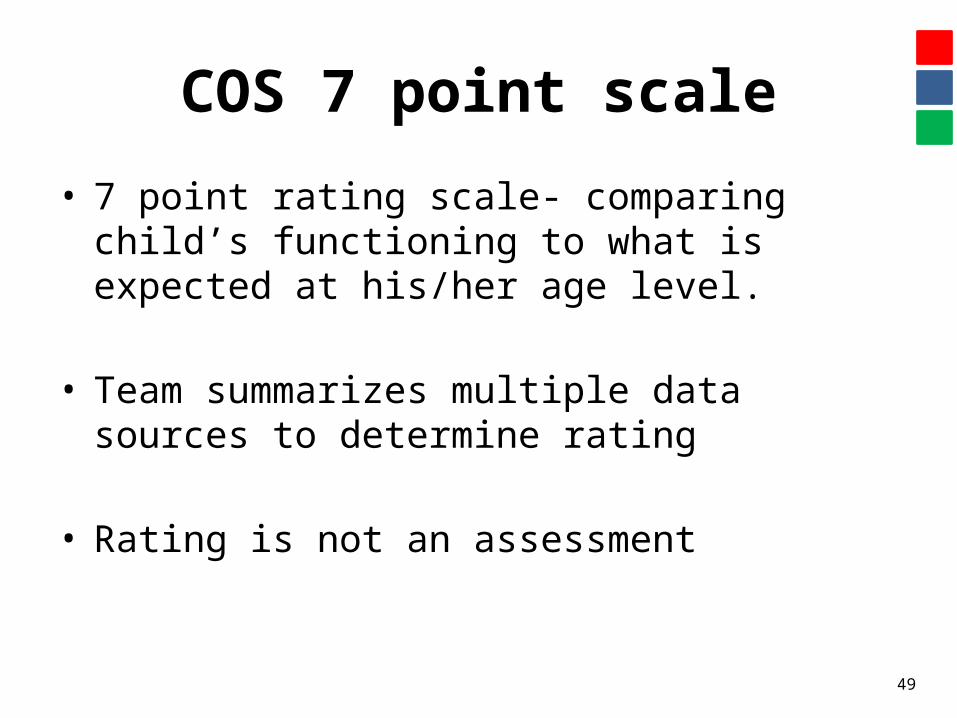
COS 7 point scale
• 7 point rating scale- comparing child’s functioning to what is expected at his/her age level.
• Team summarizes multiple data sources to determine rating
• Rating is not an assessment
50
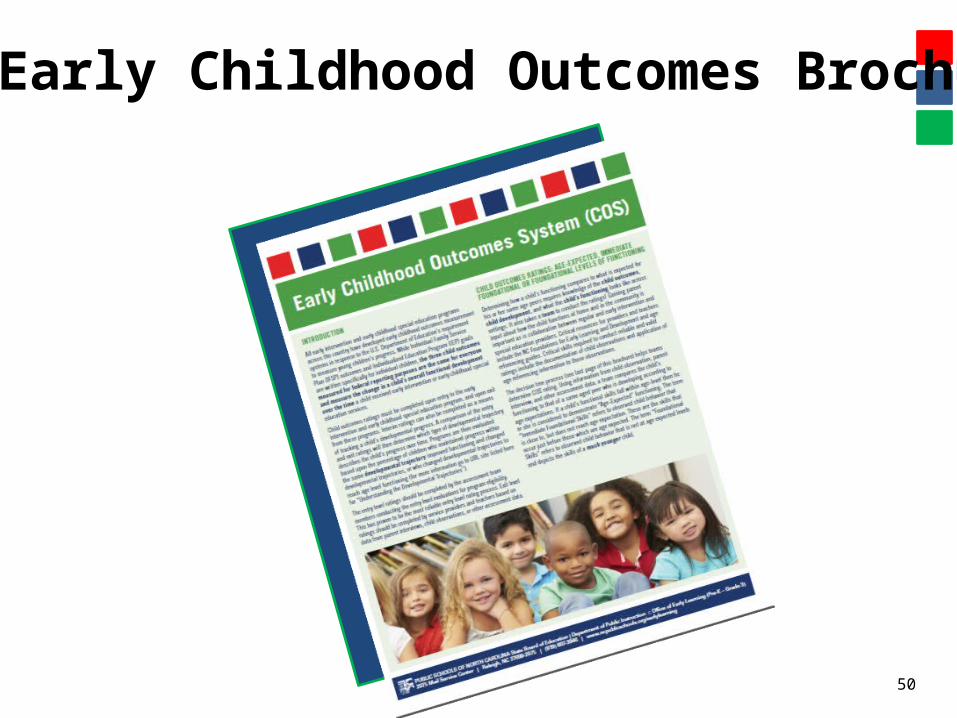
NC Early Childhood Outcomes Brochure
51
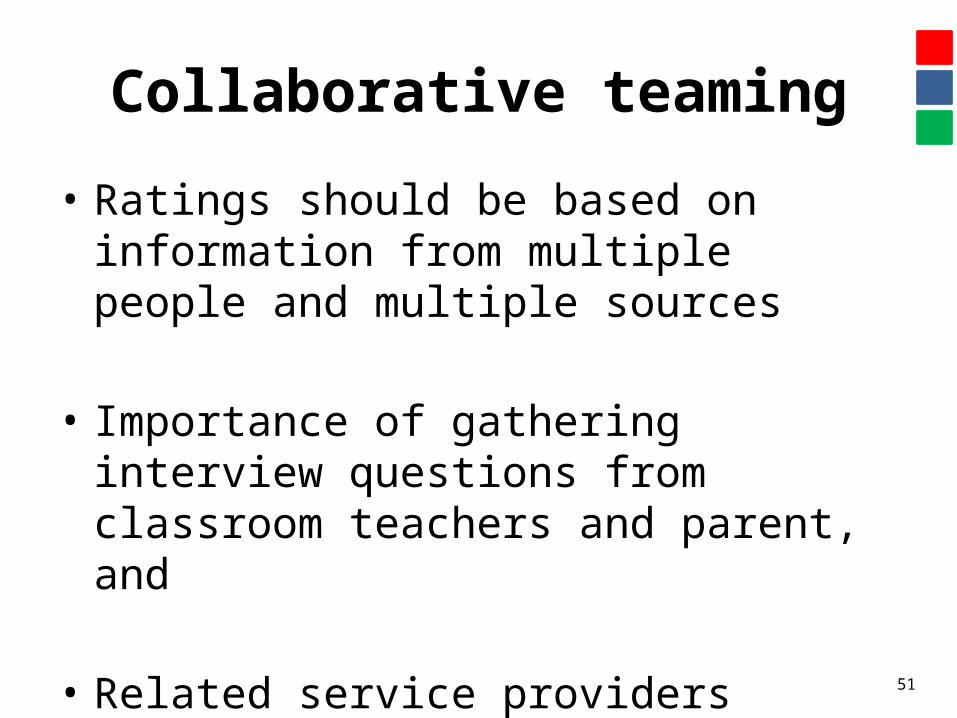
Collaborative teaming
• Ratings should be based on information from multiple people and multiple sources
• Importance of gathering interview questions from classroom teachers and parent, and
• Related service providers
52
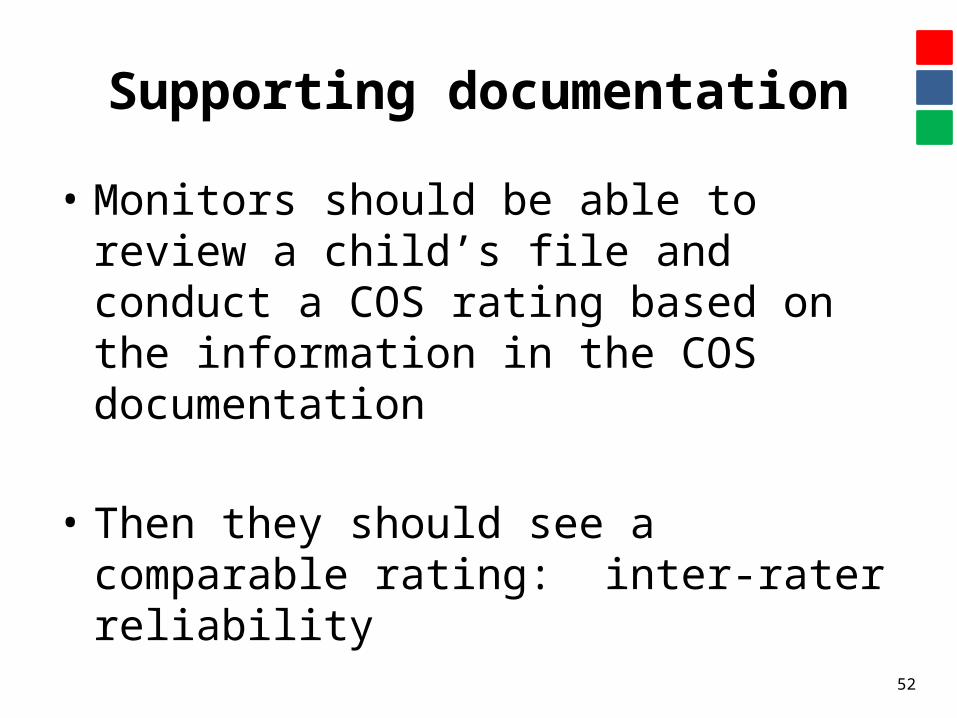
Supporting documentation
• Monitors should be able to review a child’s file and conduct a COS rating based on the information in the COS documentation
• Then they should see a comparable rating: inter-rater reliability
53
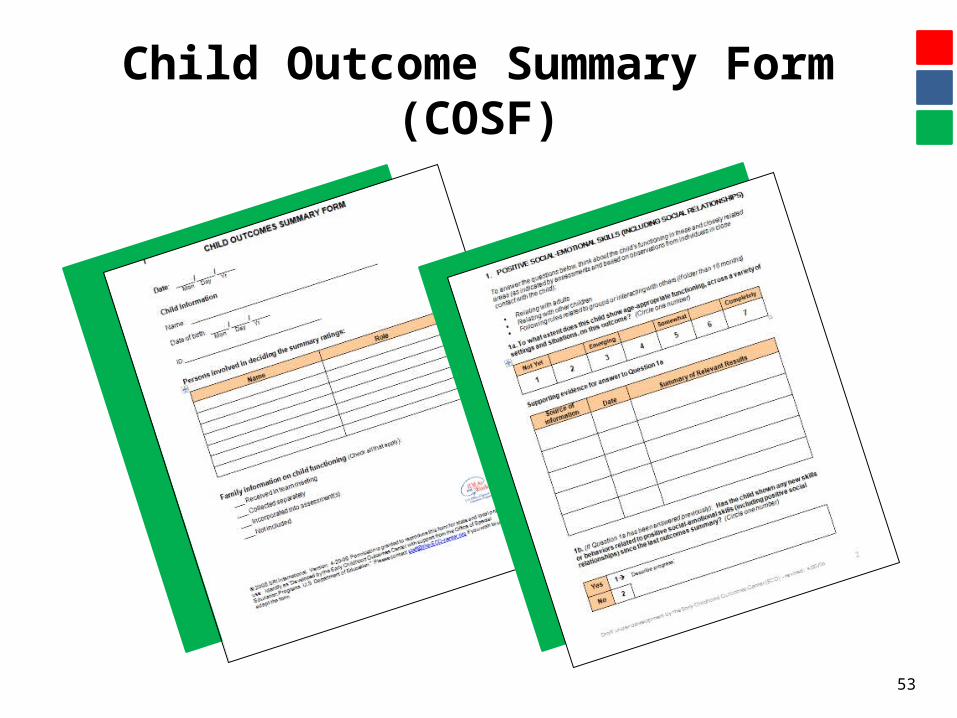
Child Outcome Summary Form (COSF)
SO WHAT DOES THIS MEAN?
54
55
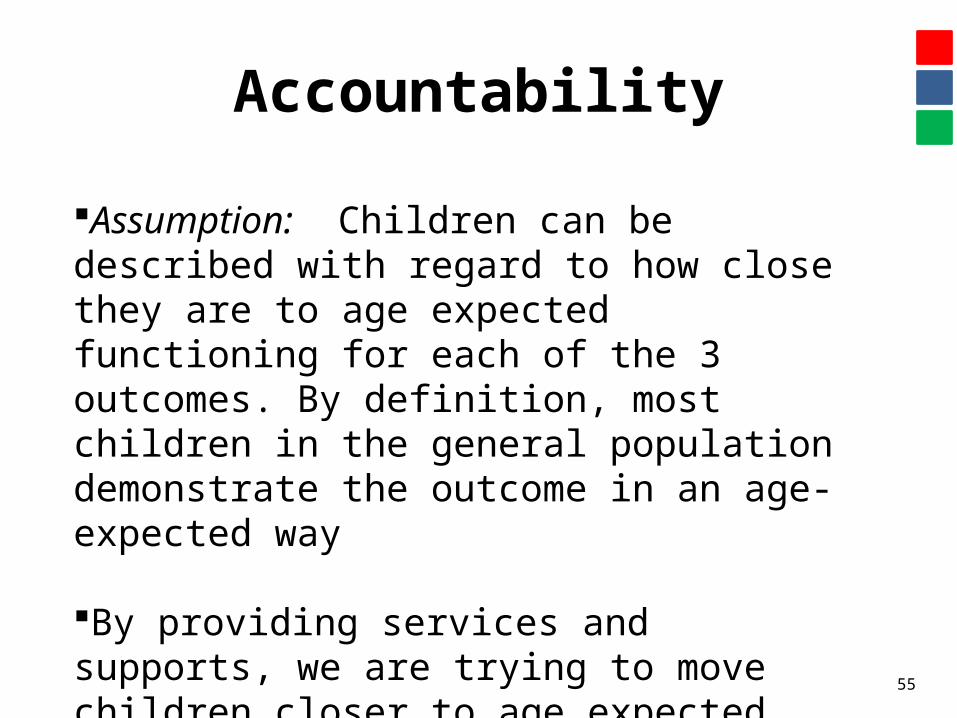
Accountability
Assumption: Children can be described with regard to how close they are to age expected functioning for each of the 3 outcomes. By definition, most children in the general population demonstrate the outcome in an age-expected way
By providing services and supports, we are trying to move children closer to age expected behavior
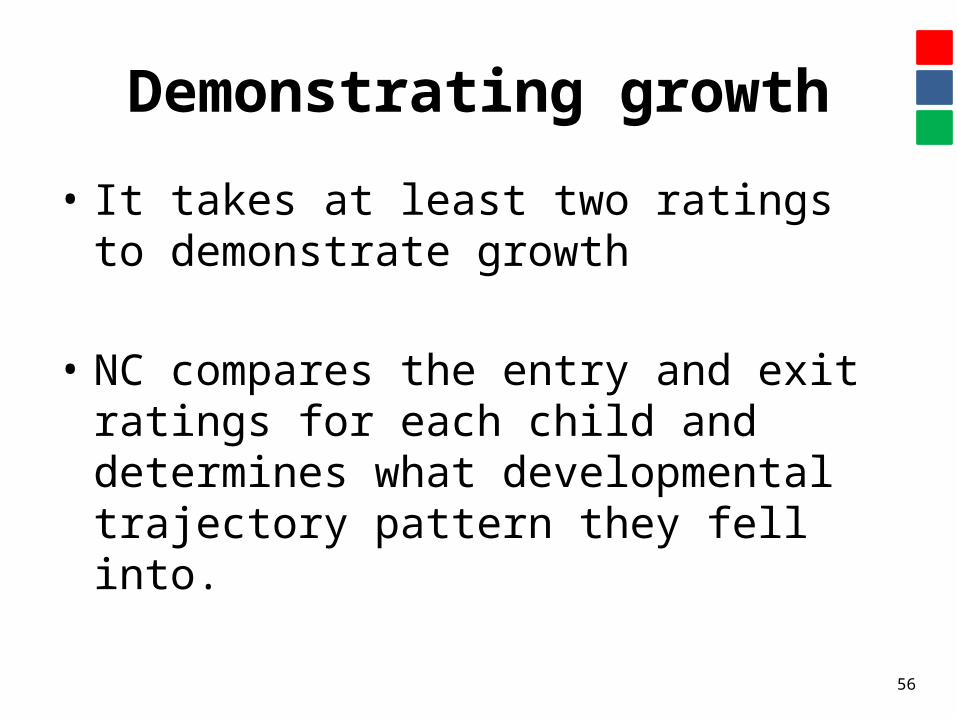
Demonstrating growth
• It takes at least two ratings to demonstrate growth
• NC compares the entry and exit ratings for each child and determines what developmental trajectory pattern they fell into.
56
57
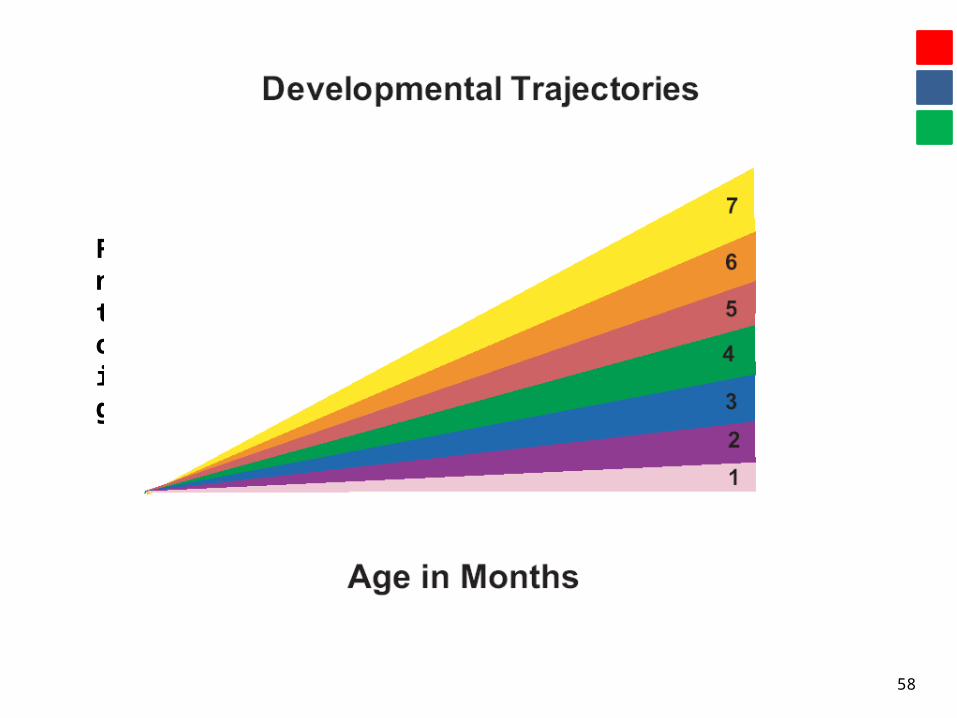
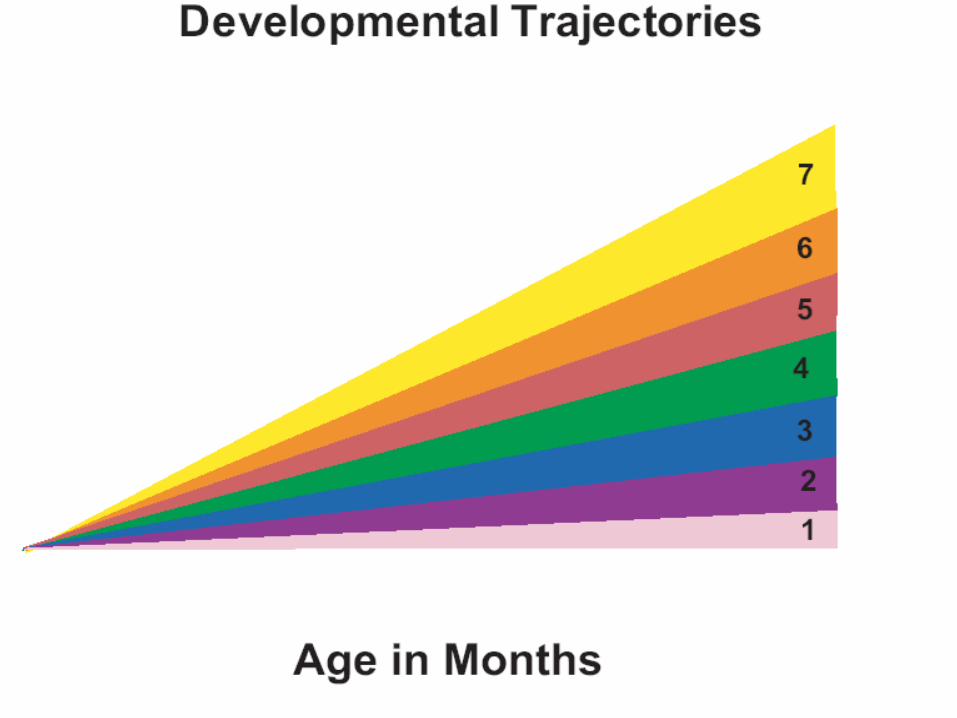
58
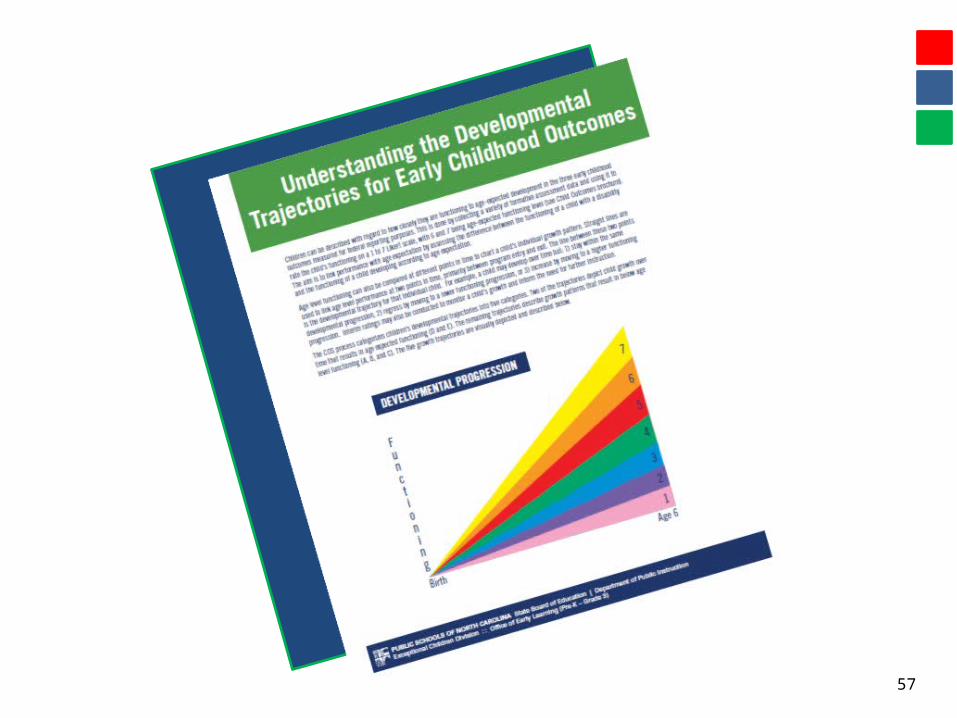
BirthAge 6
Functioning
Developmental Progressions

Entry ( e.g., age 3)
59Chronological Age
Functioning

Entry ( e.g., age 3) Exit ( e.g., age 5)
60Chronological Age
Functioning

Entry ( e.g., age 3) Exit ( e.g., age 5)
61Chronological Age
Functioning
62
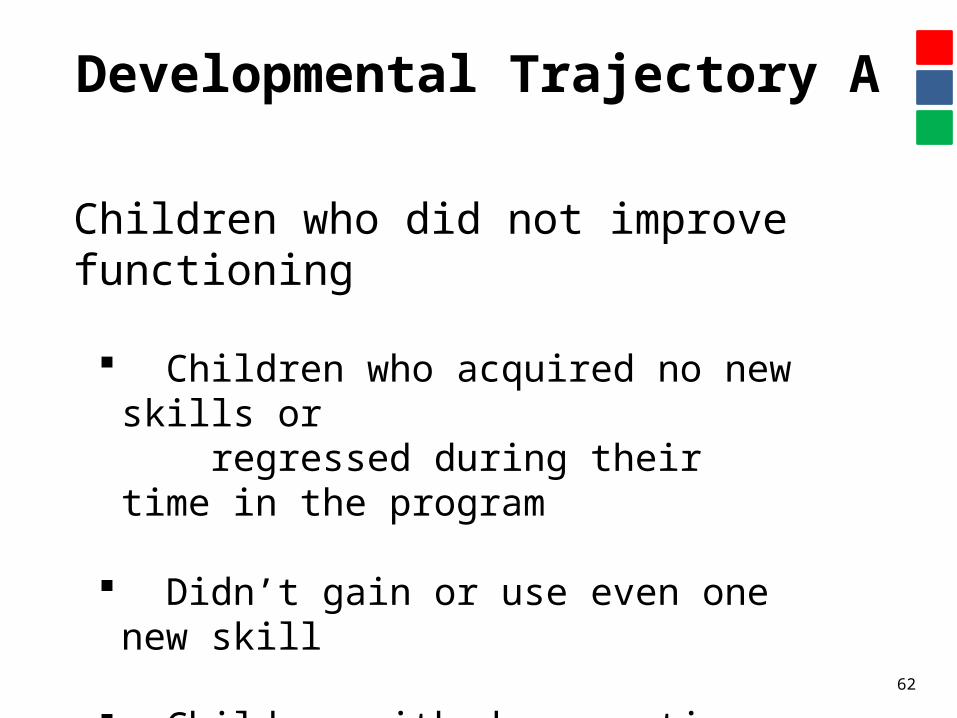
Developmental Trajectory A
Children who did not improve functioning
Children who acquired no new skills or regressed during their time in the program
Didn’t gain or use even one new skill
Children with degenerative conditions/ significant disabilities

Entry ( e.g., age 3) Exit ( e.g., age 5)
63
Category A
Chronological Age
Functioning

Entry ( e.g., age 3) Exit ( e.g., age 5)
64
Category A
Chronological Age
Functioning
65
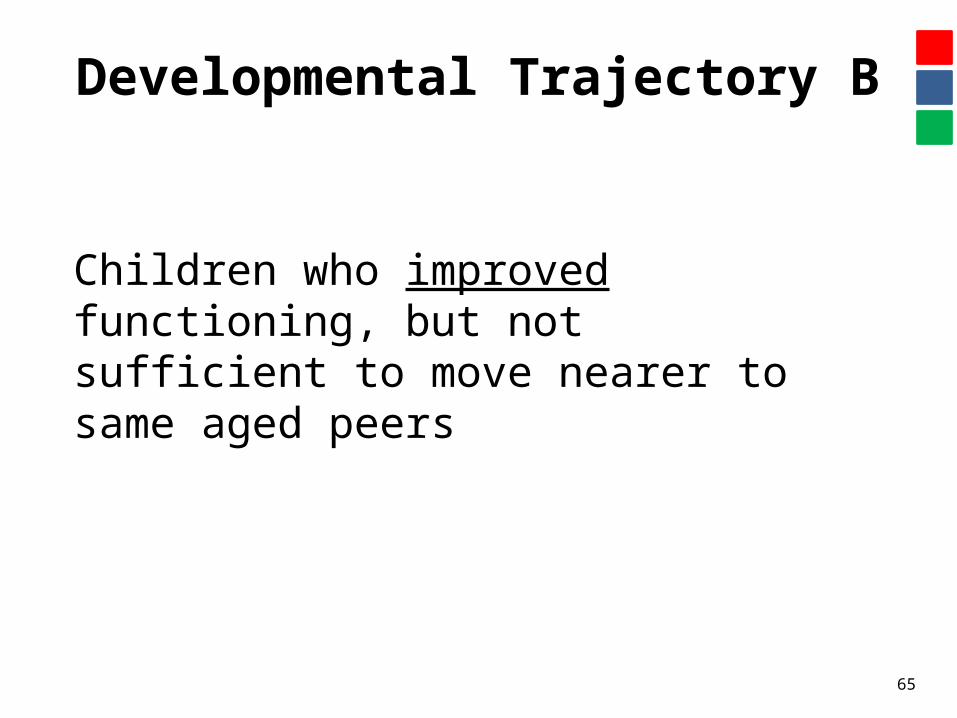
Developmental Trajectory B
Children who improved functioning, but not sufficient to move nearer to same aged peers

Entry ( e.g., age 3 Exit ( e.g., age 5)
66
Category B
Chronological Age
Functioning
Entry ( e.g., age 3 Exit ( e.g., age 5)
67
Category B
Chronological Age
Functioning

Entry ( e.g., age 3) Exit ( e.g., age 5)
68
Category B
Chronological Age
Functioning
69
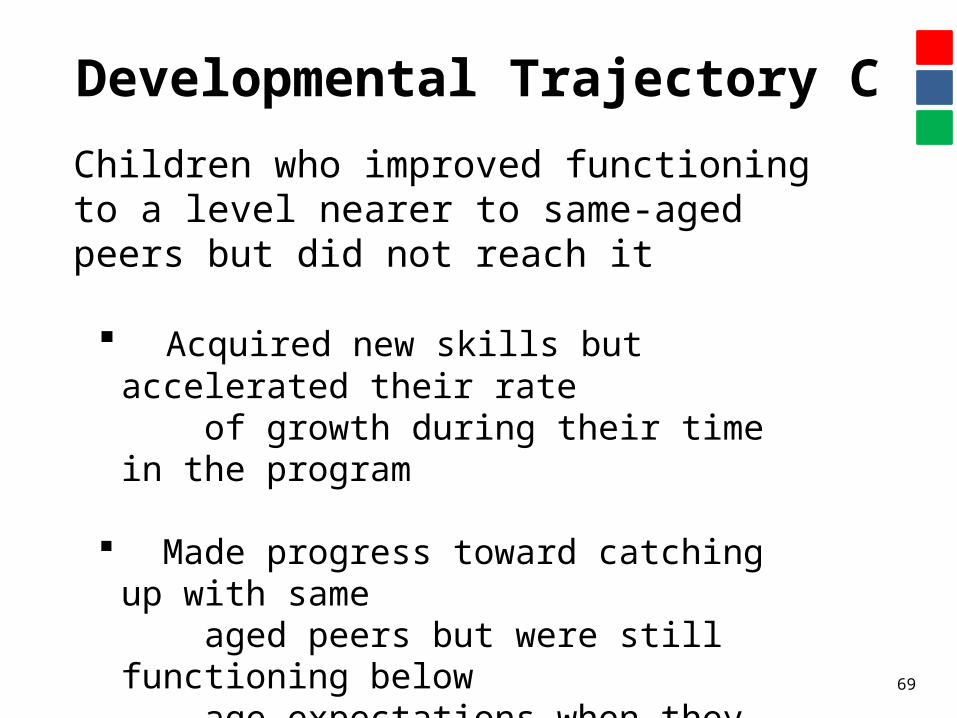
Developmental Trajectory CChildren who improved functioning to a level nearer to same-aged peers but did not reach it
Acquired new skills but accelerated their rate of growth during their time in the program
Made progress toward catching up with same aged peers but were still functioning below age expectations when they left the program
Changed their growth trajectories & “narrowed the gap”

Entry ( e.g., age 3) Exit ( e.g., age 5)
70
Category C
Chronological Age
Functioning
71
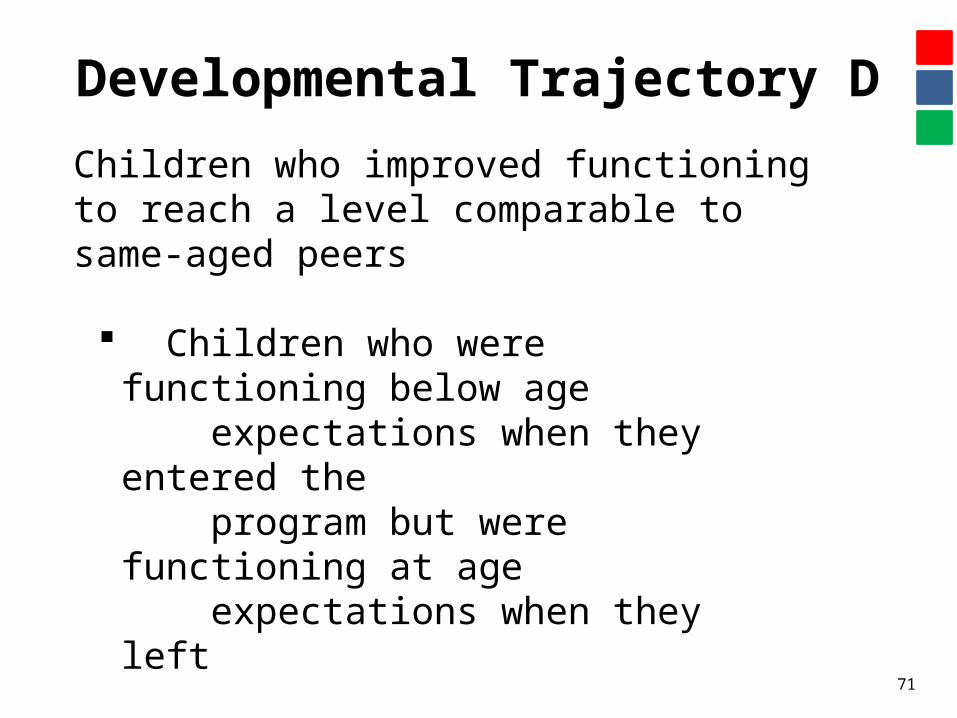
Developmental Trajectory DChildren who improved functioning to reach a level comparable to same-aged peers
Children who were functioning below age expectations when they entered the program but were functioning at age expectations when they left
Started out below age expectations, but caught up while in services
Entry ( e.g., age 3) Exit ( e.g., age 5)
72
Category D
Chronological Age
Functioning
73
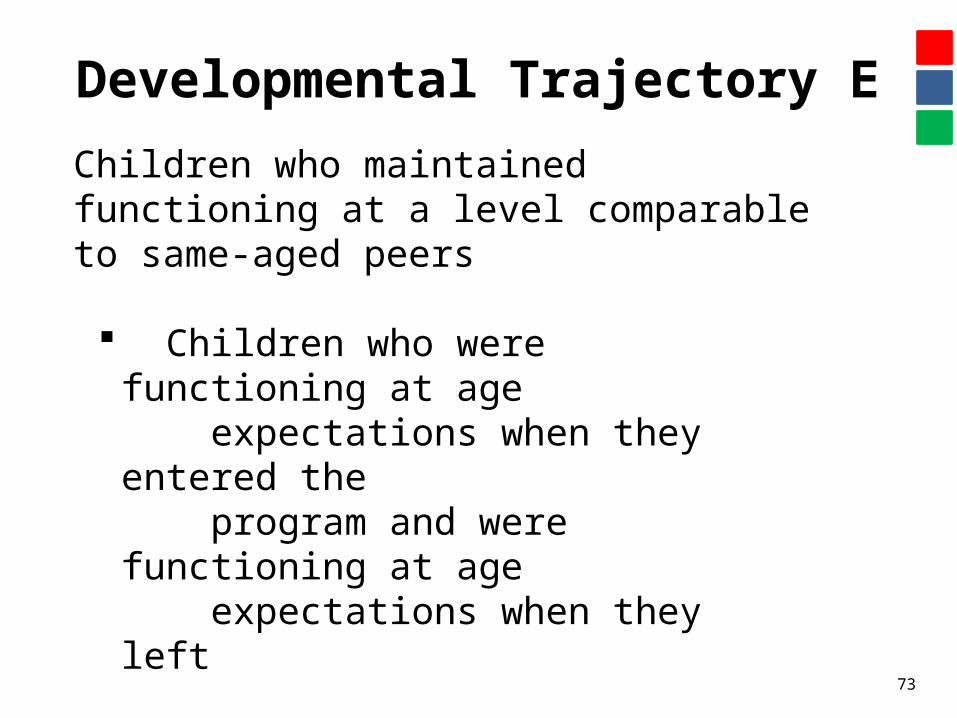
Developmental Trajectory EChildren who maintained functioning at a level comparable to same-aged peers
Children who were functioning at age expectations when they entered the program and were functioning at age expectations when they left
Entered the program at age expectations and were still up with age expectations at exit
Entry ( e.g., age 3) Exit ( e.g., age 5)
74
Category E
Chronological Age
Functioning

Entry ( e.g., age 3) Exit ( e.g., age 5)
75
Category E
Chronological Age
Functioning

Entry ( e.g., age 3) Exit ( e.g., age 5)
76
Category E
Chronological Age
Functioning
HAVE YOU CHARTED DEVELOPMENTAL TRAJECTORIES?
For children you are currently serving?
77

Discussion
• How could you use this information to inform what you are doing with your children?
• Do you do ratings at different points in time and chart their trajectories?
78
HOW IS THIS INFORMATION BEING USED?
For our own programs and the state?
79
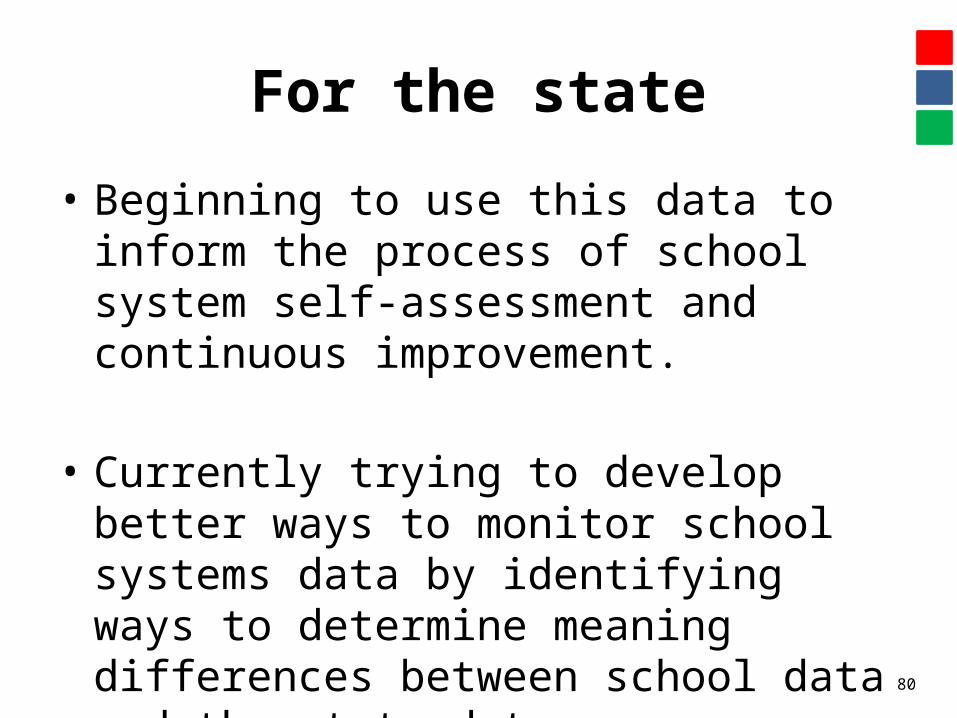
For the state
• Beginning to use this data to inform the process of school system self-assessment and continuous improvement.
• Currently trying to develop better ways to monitor school systems data by identifying ways to determine meaning differences between school data and the state data
80
For each school system
• Should begin to use this data to inform the process of school system self-assessment and continuous improvement
• Need to identify which practices, modes of service deliver, frequency of services, and other factors are tied to improved child outcomes
81
82
For each provider
• Need to begin to chart your children’s developmental trajectory growth to see if your practices are making a true difference in their overall outcomes!
• It’s not just about IEP goals anymore!

83
Questions?