Effect of Reynolds number on compressible convex-corner …
12
Advances in Aircraft and Spacecraft Science, Vol. 1, No. 4 (2014) 443-454 DOI: http://dx.doi.org/10.12989/aas.2014.1.4.443 443 Copyright © 2014 Techno-Press, Ltd. http://www.techno-press.org/?journal=aas&subpage=7 ISSN: 2287-528X (Print), 2287-5271 (Online) Effect of Reynolds number on compressible convex-corner flows Kung-Ming Chung 1 , Po-Hsiung Chang 2a and Keh-Chin Chang 2b 1 Aerospace Science and Technology Research Center, National Cheng Kung University, 2500 Section 1, Chung-Cheng South Road, Guiren district, Tainan, 711, Taiwan 2 Department of Aeronautics and Astronautics, National Cheng Kung University, 1 University Road, East district, Tainan, 701, Taiwan (Received March 7, 2014, Revised May 1, 2014, Accepted May 27, 2014) Abstract. An experimental study was conducted to investigate the effect of Reynolds number on compressible convex-corner flows, which correspond to an upper surface of a deflected flap of an aircraft wing. The flow is naturally developed along a flat plate with two different lengths, resulting in different incoming boundary layer thicknesses or Reynolds numbers. It is found that boundary layer Reynolds number, ranging from 8.04×10 4 to 1.63×10 5 , has a minor influence on flow expansion and compression near the corner apex in the transonic flow regime, but not for the subsonic expansion flow. For shock-induced separated flow, higher peak pressure fluctuations are observed at smaller Reynolds number, corresponding to the excursion phenomena and the shorter region of shock-induced boundary layer separation. An explicit correlation of separation length with deflection angle is also presented. Keywords: convex corner; Reynolds number; shock; pressure fluctuations; boundary layer separation 1. Introduction Aircraft designs have employed flaps for takeoff and landing and ailerons for routine turning maneuver. For a variable camber control wing (Bolonkin and Gilyard 1999), deflected flaps and ailerons can be employed in performance optimization for an aircraft during cruise flight. However, a typical feature on a transonic airfoil is associated with a quasi-normal shock on the upper surface. When the shock is strong enough, development of separation bubble changes the flow field significantly and increases the drag (Delery 1983). A study of Szodruch and Hilbig (1998) indicated that the critical Mach number, onset of boundary layer separation and drag are strongly related to the deflection of control surfaces. Thus there exists a great deal of uncertainty regarding the allowable deflection before separation near the hinge line. Mason (1993) indicated that there are two fundamental issues regarding the aerodynamic characteristics on upper deflected surfaces, including effect of Reynolds number and transition of Corresponding author, Research fellow and Director, E-mail: [email protected] a Ph.D. Student, E-mail: [email protected] b Professor, E-mail: [email protected]
Transcript of Effect of Reynolds number on compressible convex-corner …
Advances in Aircraft and Spacecraft Science, Vol. 1, No. 4 (2014) 443-454
DOI: http://dx.doi.org/10.12989/aas.2014.1.4.443 443
Copyright © 2014 Techno-Press, Ltd.
http://www.techno-press.org/?journal=aas&subpage=7 ISSN: 2287-528X (Print), 2287-5271 (Online)
Effect of Reynolds number on compressible convex-corner flows
Kung-Ming Chung1, Po-Hsiung Chang2a and Keh-Chin Chang2b
1Aerospace Science and Technology Research Center, National Cheng Kung University,
2500 Section 1, Chung-Cheng South Road, Guiren district, Tainan, 711, Taiwan 2Department of Aeronautics and Astronautics, National Cheng Kung University,
1 University Road, East district, Tainan, 701, Taiwan
(Received March 7, 2014, Revised May 1, 2014, Accepted May 27, 2014)
Abstract. An experimental study was conducted to investigate the effect of Reynolds number on compressible convex-corner flows, which correspond to an upper surface of a deflected flap of an aircraft wing. The flow is naturally developed along a flat plate with two different lengths, resulting in different incoming boundary layer thicknesses or Reynolds numbers. It is found that boundary layer Reynolds number, ranging from 8.04×10
4 to 1.63×10
5, has a minor influence on flow expansion and compression near
the corner apex in the transonic flow regime, but not for the subsonic expansion flow. For shock-induced separated flow, higher peak pressure fluctuations are observed at smaller Reynolds number, corresponding to the excursion phenomena and the shorter region of shock-induced boundary layer separation. An explicit correlation of separation length with deflection angle is also presented.
Keywords: convex corner; Reynolds number; shock; pressure fluctuations; boundary layer separation
1. Introduction
Aircraft designs have employed flaps for takeoff and landing and ailerons for routine turning
maneuver. For a variable camber control wing (Bolonkin and Gilyard 1999), deflected flaps and
ailerons can be employed in performance optimization for an aircraft during cruise flight.
However, a typical feature on a transonic airfoil is associated with a quasi-normal shock on the
upper surface. When the shock is strong enough, development of separation bubble changes the
flow field significantly and increases the drag (Delery 1983). A study of Szodruch and Hilbig
(1998) indicated that the critical Mach number, onset of boundary layer separation and drag are
strongly related to the deflection of control surfaces. Thus there exists a great deal of uncertainty
regarding the allowable deflection before separation near the hinge line.
Mason (1993) indicated that there are two fundamental issues regarding the aerodynamic
characteristics on upper deflected surfaces, including effect of Reynolds number and transition of
Corresponding author, Research fellow and Director, E-mail: [email protected] aPh.D. Student, E-mail: [email protected]
bProfessor, E-mail: [email protected]
Kung-Ming Chung, Po-Hsiung Chang and Keh-Chin Chang
expansion flows. For a simplified model of deflected upper control surfaces (convex corners) at
high subsonic Mach number M, a typical flow feature is upstream expansion and downstream
compression near the corner apex. At higher M and larger convex-corner angle , the flow
switched from subsonic expansion to transonic expansion (Chung 2000, 2002). The downstream
boundary layer was separated once the local peak Mach number exceeded 1.3 (Liu and Squire
1987). Unsteadiness of the interaction due to shock excursion phenomenon was characterized by a
local peak pressure fluctuation and deviation of higher order moments from effective Gaussian
(Chung 2004). The spectrum analysis demonstrated that the unsteady shock motion (or shock
excursion) resulted in substantially increased energy level at lower frequencies (Chung 2002). A
similarity parameter was also proposed by Chung (2012) to characterize compressible convex-
corner flows, including local peak Mach number Mpeak, peak pressure fluctuations (p/pw)max and
shock-induced boundary layer separation length Xi*.
It is known that blowing is qualitatively equivalent to a decrease in Reynolds number (Inger
and Zee 1978). Injection of a small quantity of high-pressure air can energize the incoming
boundary layer, thus inducing an increase in displacement thickness or less fuller boundary layer.
Chung (2007, 2010) investigated the effect of upstream blowing jet on compressible convex-
corner flows. It was found that a small amount of upstream blowing resulted in a delay in
transition from subsonic to transonic expansion flows. Lower level of downstream surface
pressure fluctuations was also observed in subsonic interactions. In transonic convex-corner flows,
larger blowing rates resulted in upstream movement of shock wave and enhanced the flow
unsteadiness (or shock-induced boundary layer separation, SIBLS) near the corner. Kim et al.
(1996) pointed out that SIBLS can be strongly dependent on the way how the variation in
Reynolds number was given. The pressure rise up to the separation point decreased as the
boundary layer thickness increased at a fixed unit Reynolds number. However, within range of the
boundary layer Reynolds number of 104 to 10
6, separation pressure rise is insensitive to variation
of Reynolds number as the Mach number is relatively small, and essentially independent of
Reynolds number for the minimum Mach number necessary to separate the boundary layer.
To investigate quantitatively the effect of Reynolds number on compressible convex-corner
flows, a turbulent boundary layer was naturally developed along a flat plate of two different
lengths (500 and 275 mm). The boundary layer thickness upstream of the corner apex was
employed as a characteristic length scale. Surface pressure measurements and surface oil flow
visualization were conducted. Before discussing results of the present study, brief details of the
experiment are outlined next.
2. Experimental setup
2.1 Transonic wind tunnel and test models
Experiments were conducted in the blowdown transonic wind tunnel at the Aerospace Science
and Technology Research Center, National Cheng Kung University (ASTRC/NCKU). This facility
includes compressors, a water cooling system, air dryers, storage tanks, and a tunnel. The dew
point of the high-pressure air through the dryers is maintained at −40C under normal operation
conditions and air storage volume for the three storage tanks is 180 m3
at 5.15 MPa. A rotary
perforated sleeve valve controls the setup of stagnation pressure po, and high-pressure air is
discharged into the stilling chamber through flow spreaders. Acoustic baffles, screens and a
444
Effect of Reynolds number on compressible convex-corner flows
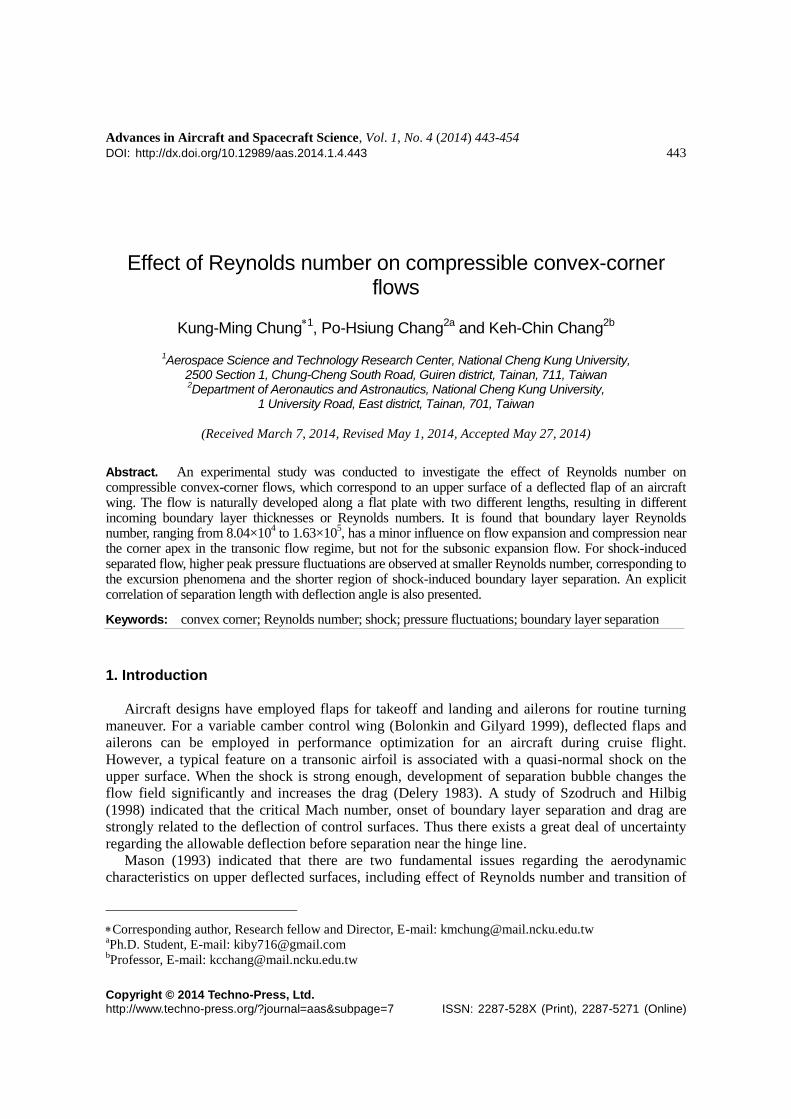
Fig. 1 Test configuration
honeycomb inside the stilling chamber are employed to absorb control-value noise and to reduce
flow turbulence intensity. The Mach numbers are varied from 0.2 to 1.4 by exchanging the top and
bottom walls of the nozzle. In subsonic test configuration, two choked flaps are employed to
control the testing Mach number. Further, the constant-area test section (600 mm×600 mm)
enclosed within a plenum chamber was assembled with solid sidewalls and perforated top/bottom
walls in this study. M were 0.64, 0.70 and 0.83±0.01, and the unit Reynolds numbers ranged from
20.1 to 23.3 million per meter. The stagnation pressure p0 and temperature T0 were 172±0.5 kPa
(25 psia) and ambient temperature, respectively.
The test model, which was supported by a single sting mounted on the bottom floor of the test
section, comprised a flat plate (150 wide×450 mm long) and an interchangeable instrumentation
plate (150 wide×170 mm long), as shown in Fig. 1. The convex corner was 500 mm (Case A) and
275 mm (Case B) from the leading edge of the flat plate. The incoming boundary layer thickness
at 25 mm ahead of the convex apex was estimated to be approximately 7 mm and 4 mm for Case A
and Case B, respectively (Bies 1966). The Reynolds number according to the incoming boundary
layer thickness Re ranged from 8.04×10⁴ to 1.63×10
5. Five instrumentation plates were fabricated
with the convex corner angle of 5-, 10-, 13-, 15- and 17-deg. One row of 19 pressure taps (6 mm
apart) along the centerline of each plate was drilled perpendicularly to the test surface. Further, to
prevent cross flow from sidewall interference, two side fences of 13.5 cm (length)×4.5 cm
(height)×0.5 cm (thickness) were installed at both sides of the instrumentation plate.
2.2 Instrumentation and data acquisition system Kulite pressure transducers (XCS-093-25A, B screen) were employed for surface pressure
measurements. The sensors had a nominal outer diameter of 2.36 mm and a pressure-sensitive
element of 0.97 mm in diameter. External amplifiers (Ecreon Model E713) with a roll-off
frequency of approximately 140 kHz were also employed. Test conditions were recorded by a
NEFF 620 System while the outputs of pressure transducers were stored by a National Instruments
(NI SCXI) system. All input channels were triggered simultaneously with a sampling rate of 200
kHz. Further, the flat-plate cases were employed to estimate experimental uncertainty, which
included 1.24% for the normalized surface pressure pw/po and 0.97% for the surface pressure
fluctuation coefficient σp/pw.
Surface oil-flow visualization was employed to visualize the surface flow pattern. A thin film of
a mixture (titanium dioxide, oil, oleic acid and kerosene) was applied onto the surface of the
445
Kung-Ming Chung, Po-Hsiung Chang and Keh-Chin Chang
x, mm
-40 -20 0 20 40 60
pw/p
o
0.5
0.6
0.7
0.8
0.9
5o
15o
M = 0.64Solid symbols: Case A
Hollow symbols: Case B
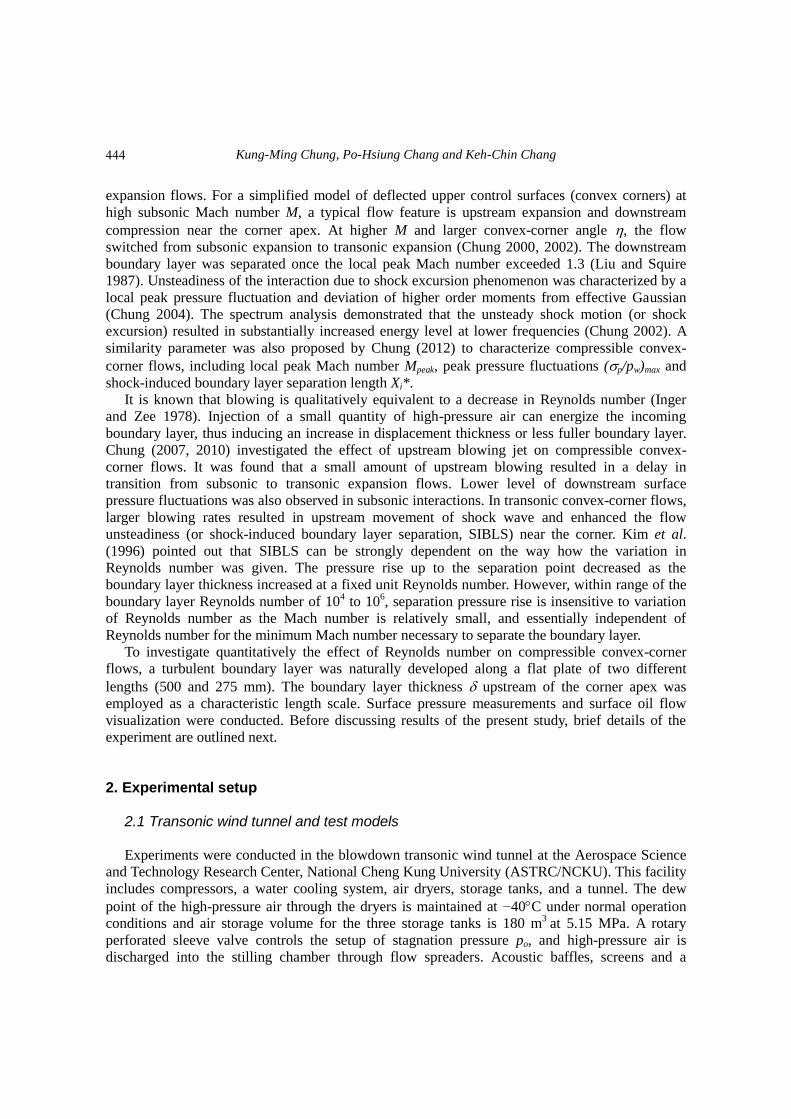
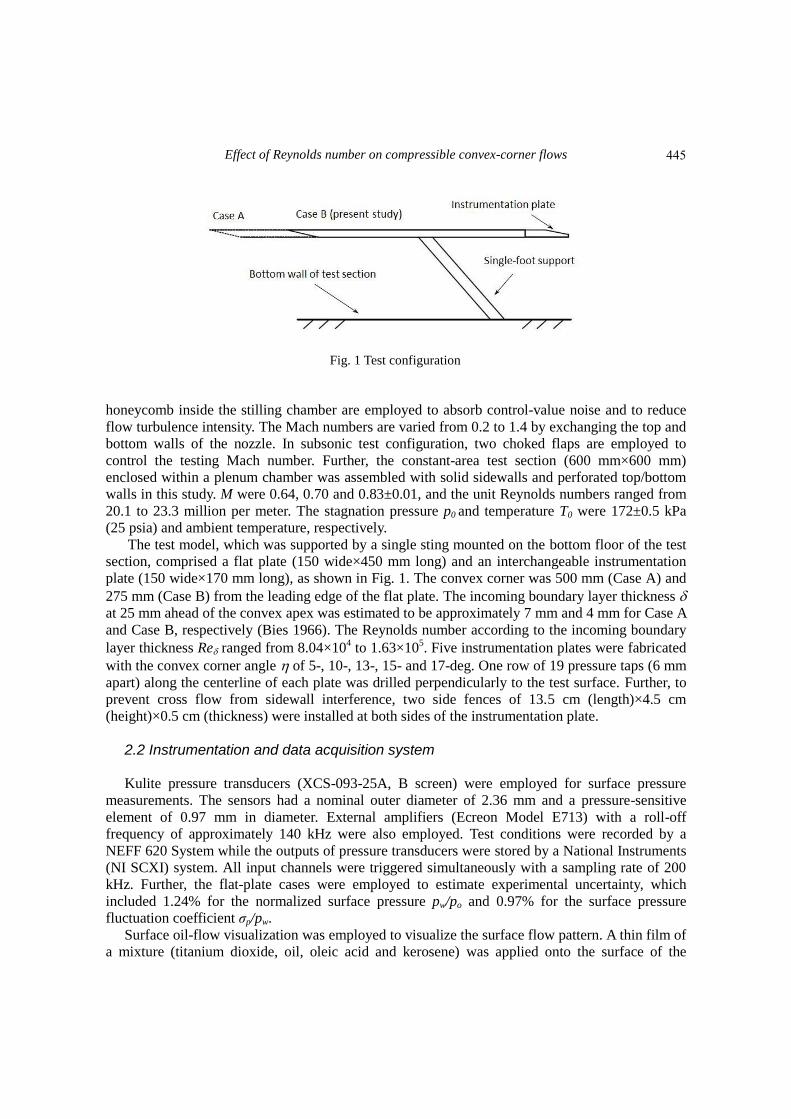
Fig. 2 Wall pressure distributions, subsonic expansion flows
instrumentation plate. For the attached flow, the surface streamlines over the whole span were
straight and parallel to the incoming flow direction. With shock-induced, boundary-layer
separation, the surface flowfield was not strictly two-dimensional. Accumulation of titanium
dioxide was evident followed by the deflection of streamlines. The beginning of accumulation is
taken as the separation position and the end of deflection is taken as the reattachment position. The
region of separation and reattachment was evaluated and compared with the surface pressure
measurements. It is also noted that a motion of the mixture itself on an inclined flat plate owing to
gravity effect might contaminate the final flow picture.
3. Results and discussion
3.1 Wall pressure distributions
For compressible convex-corner flows, Ruban et al. (2000) demonstrated that the displacement
thickness near the corner is affected by the overlapping region that lies between the viscous
sublayer and the main part of the boundary layer. For subsonic expansion flows (M=0.64, =5-
and 15-deg), the normalized mean pressure distributions pw/po are shown in Fig. 2, where x denotes
the streamwise distance measured along the body surface from the corner apex. It can be seen that
there are upstream expansion and downstream compression for both Case A and Case B. The
minimum pressure coefficient (pw/po)min is observed immediately downstream of the corner and
decreases with increasing . With decreasing Re (Case B), there is an increase in (pw/po)min (or
lower peak mach number) and downstream pw/po. This result agrees with the finding of Chung
(2007, 2010) on compressible convex-corner flows with upstream blowing jet. In transonic
interactions (M=0.70, =13-, 15- and 17-deg), the flow accelerates to supersonic and compresses
back to subsonic downstream, as shown in Fig. 3. The sonic condition (pw/po=0.5283) is also
shown as a dashed line for reference. The distributions of pw/po are almost identical for both test
cases and there are slightly lower levels of pw/po near the corner apex for Case B, indicating a
446
Effect of Reynolds number on compressible convex-corner flows
x, mm
-40 -20 0 20 40 60
pw/p
o
0.4
0.5
0.6
0.7
0.8
13o
15o
17o
Solid symbols: Case A
Hollow symbols: Case B
M = 0.70
Sonic condition
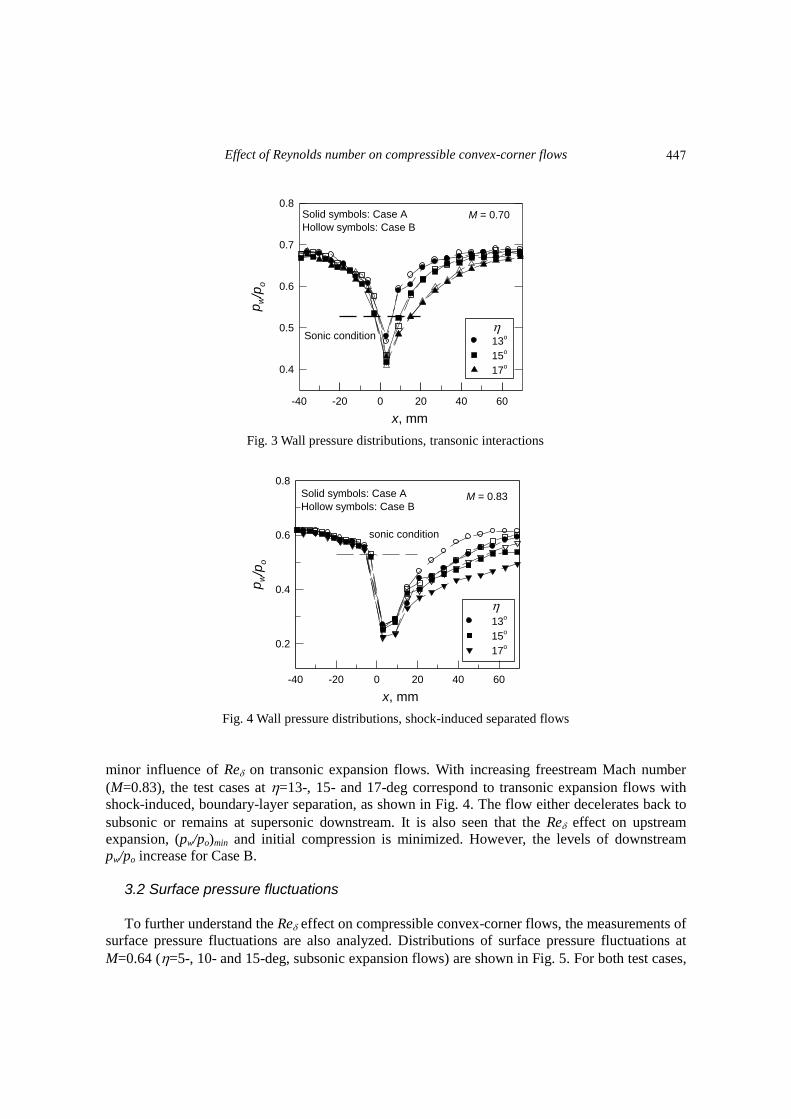
Fig. 3 Wall pressure distributions, transonic interactions
x, mm
-40 -20 0 20 40 60
pw/p
o
0.2
0.4
0.6
0.8
13
o
15o
17o
Solid symbols: Case A
Hollow symbols: Case B M = 0.83
sonic condition
Fig. 4 Wall pressure distributions, shock-induced separated flows
minor influence of Re on transonic expansion flows. With increasing freestream Mach number
(M=0.83), the test cases at =13-, 15- and 17-deg correspond to transonic expansion flows with
shock-induced, boundary-layer separation, as shown in Fig. 4. The flow either decelerates back to
subsonic or remains at supersonic downstream. It is also seen that the Re effect on upstream
expansion, (pw/po)min and initial compression is minimized. However, the levels of downstream
pw/po increase for Case B.
3.2 Surface pressure fluctuations
To further understand the Re effect on compressible convex-corner flows, the measurements of
surface pressure fluctuations are also analyzed. Distributions of surface pressure fluctuations at
M=0.64 (=5-, 10- and 15-deg, subsonic expansion flows) are shown in Fig. 5. For both test cases,
447
Kung-Ming Chung, Po-Hsiung Chang and Keh-Chin Chang
x, mm
-40 -20 0 20 40 60
pp
w,
%
0.0
0.5
1.0
1.5
2.0
2.5
5
o
10o
15o
M = 0.64
Solid symbols: Case A
Hollow symbols: Case B
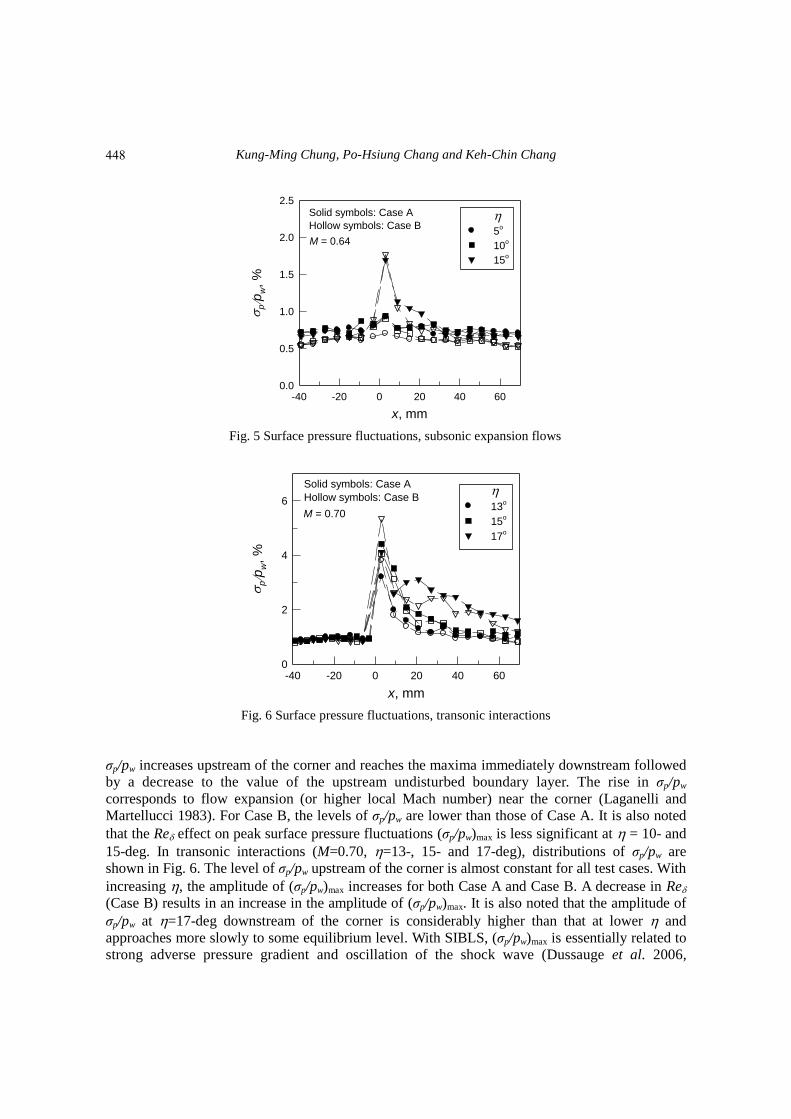
Fig. 5 Surface pressure fluctuations, subsonic expansion flows
x, mm
-40 -20 0 20 40 60
pp
w,
%
0
2
4
613
o
15o
17o
M = 0.70
Solid symbols: Case A
Hollow symbols: Case B
Fig. 6 Surface pressure fluctuations, transonic interactions
σp/pw increases upstream of the corner and reaches the maxima immediately downstream followed
by a decrease to the value of the upstream undisturbed boundary layer. The rise in σp/pw
corresponds to flow expansion (or higher local Mach number) near the corner (Laganelli and
Martellucci 1983). For Case B, the levels of σp/pw are lower than those of Case A. It is also noted
that the Re effect on peak surface pressure fluctuations (σp/pw)max is less significant at = 10- and
15-deg. In transonic interactions (M=0.70, =13-, 15- and 17-deg), distributions of σp/pw are
shown in Fig. 6. The level of σp/pw upstream of the corner is almost constant for all test cases. With
increasing , the amplitude of (σp/pw)max increases for both Case A and Case B. A decrease in Re
(Case B) results in an increase in the amplitude of (σp/pw)max. It is also noted that the amplitude of
σp/pw at =17-deg downstream of the corner is considerably higher than that at lower and
approaches more slowly to some equilibrium level. With SIBLS, (σp/pw)max is essentially related to
strong adverse pressure gradient and oscillation of the shock wave (Dussauge et al. 2006,
448
Effect of Reynolds number on compressible convex-corner flows
x, mm
-40 -20 0 20 40 60
pp
w,
%
0
5
10
15
20
13o
17oM = 0.83
Solid symbols: Case A
Hollow symbols: Case B
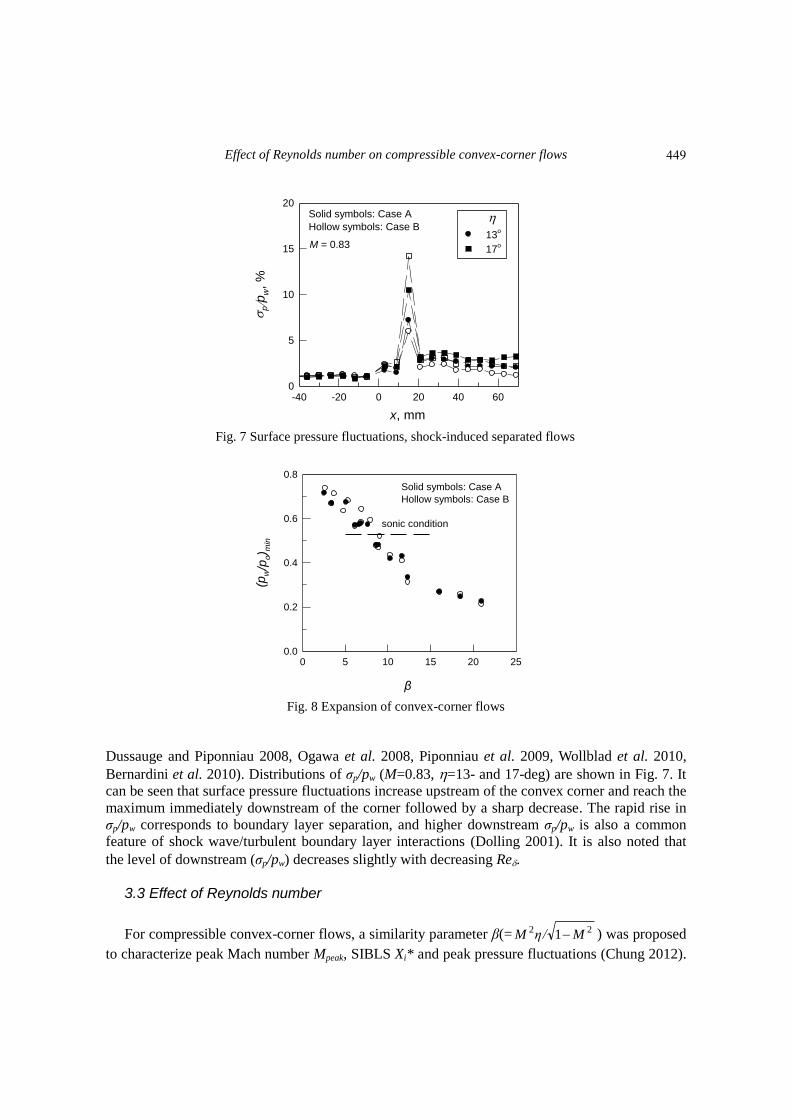
Fig. 7 Surface pressure fluctuations, shock-induced separated flows
β
0 5 10 15 20 25
(pw/p
o) m
in
0.0
0.2
0.4
0.6
0.8
sonic condition
Solid symbols: Case A
Hollow symbols: Case B
Fig. 8 Expansion of convex-corner flows
Dussauge and Piponniau 2008, Ogawa et al. 2008, Piponniau et al. 2009, Wollblad et al. 2010, Bernardini et al. 2010). Distributions of σp/pw (M=0.83, =13- and 17-deg) are shown in Fig. 7. It
can be seen that surface pressure fluctuations increase upstream of the convex corner and reach the
maximum immediately downstream of the corner followed by a sharp decrease. The rapid rise in
σp/pw corresponds to boundary layer separation, and higher downstream σp/pw is also a common
feature of shock wave/turbulent boundary layer interactions (Dolling 2001). It is also noted that
the level of downstream (σp/pw) decreases slightly with decreasing Re.
3.3 Effect of Reynolds number
For compressible convex-corner flows, a similarity parameter β(= 22 1 Mη/M ) was proposed
to characterize peak Mach number Mpeak, SIBLS Xi* and peak pressure fluctuations (Chung 2012).
449
Kung-Ming Chung, Po-Hsiung Chang and Keh-Chin Chang
In Fig. 8, the minimum surface pressure coefficient (pw/po)min is plotted versus β for both Case A
and Case B. The amplitude of (pw/po)min appears to be a quadratic function of . In subsonic
expansion flows, higher values of (pw/po)min are observed for Case B, but not for transonic
expansion flows with and without SIBLS. Further, the amplitude of Mpeak is critical on shock
structure and flow unsteadiness. A study of Liu and Squire (1987) indicated that flow separation on
a circular-arc model at transonic speeds can be classified as trailing-edge separation or shock-
induced separation. With a relatively small peak Mach number upstream of the shock wave,
boundary layer separation around the trailing edge is owing to adverse pressure gradient. Once
reaching the critical peak Mach number (1.3), the shock wave is strong enough to separate the
boundary layer just under the shock foot. Shock excursion results in highly intermittent nature of
pressure signals, jumping randomly back and forth. Therefore, for shock-induced separated flows,
the undisturbed pressure signals upstream of shock wave were employed to calculate the real
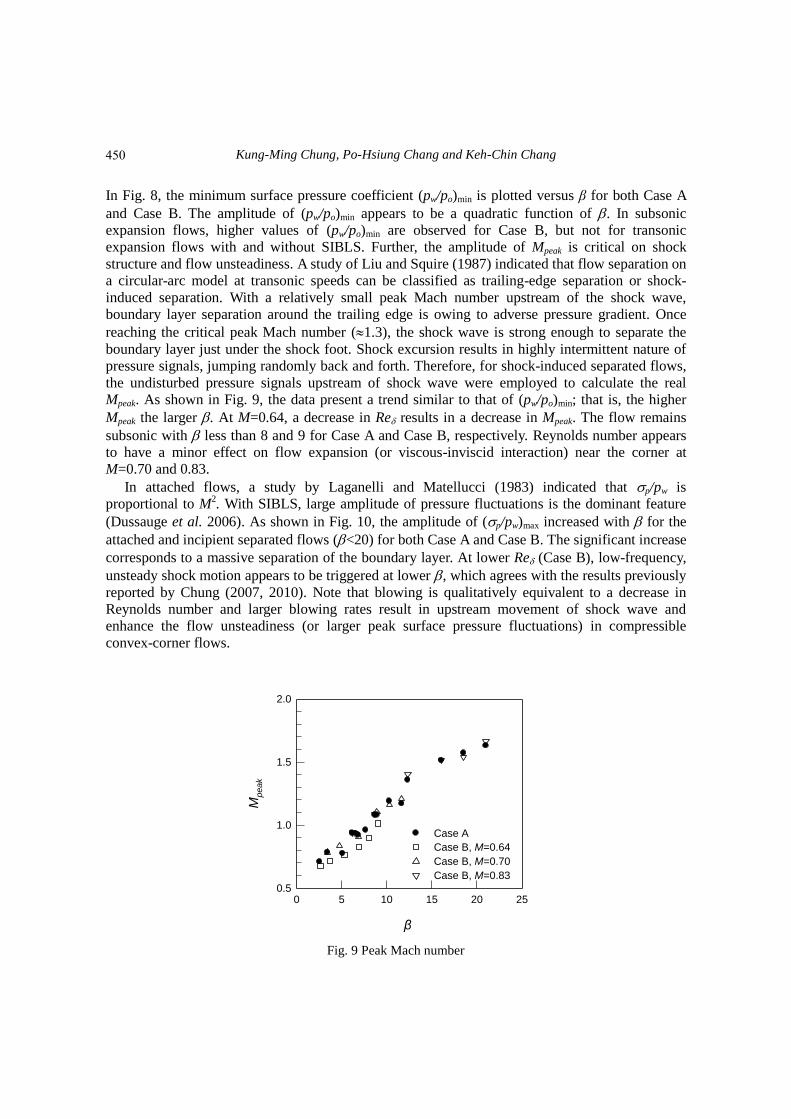
Mpeak. As shown in Fig. 9, the data present a trend similar to that of (pw/po)min; that is, the higher
Mpeak the larger . At M=0.64, a decrease in Re results in a decrease in Mpeak. The flow remains
subsonic with less than 8 and 9 for Case A and Case B, respectively. Reynolds number appears
to have a minor effect on flow expansion (or viscous-inviscid interaction) near the corner at
M=0.70 and 0.83.
In attached flows, a study by Laganelli and Matellucci (1983) indicated that p/pw is
proportional to M2. With SIBLS, large amplitude of pressure fluctuations is the dominant feature
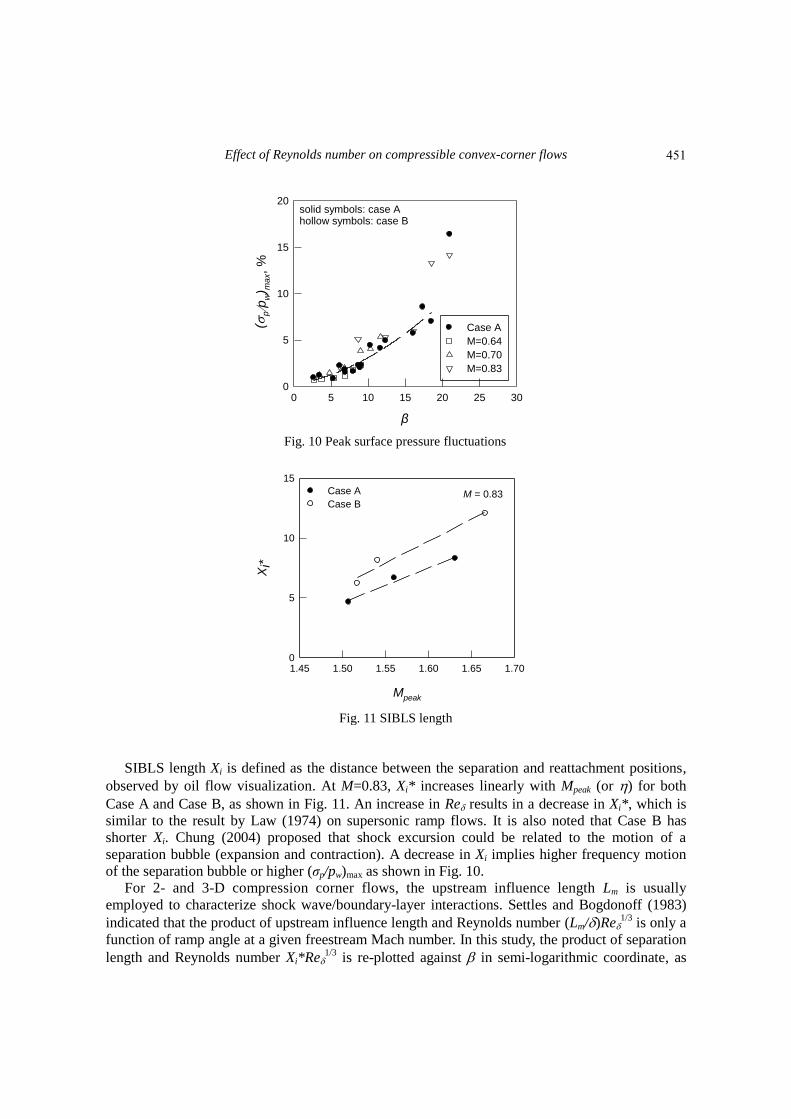
(Dussauge et al. 2006). As shown in Fig. 10, the amplitude of (p/pw)max increased with for the
attached and incipient separated flows (<20) for both Case A and Case B. The significant increase
corresponds to a massive separation of the boundary layer. At lower Re (Case B), low-frequency,
unsteady shock motion appears to be triggered at lower , which agrees with the results previously
reported by Chung (2007, 2010). Note that blowing is qualitatively equivalent to a decrease in
Reynolds number and larger blowing rates result in upstream movement of shock wave and
enhance the flow unsteadiness (or larger peak surface pressure fluctuations) in compressible
convex-corner flows.
β
0 5 10 15 20 25
Mpeak
0.5
1.0
1.5
2.0
Case A
Case B, M=0.64
Case B, M=0.70
Case B, M=0.83
Fig. 9 Peak Mach number
450
Effect of Reynolds number on compressible convex-corner flows
β
0 5 10 15 20 25 30
(pp
w) m
ax,
%
0
5
10
15
20
Case A
M=0.64
M=0.70
M=0.83
solid symbols: case Ahollow symbols: case B
Fig. 10 Peak surface pressure fluctuations
Mpeak
1.45 1.50 1.55 1.60 1.65 1.70
Xi*
0
5
10
15
Case A
Case BM = 0.83
Fig. 11 SIBLS length
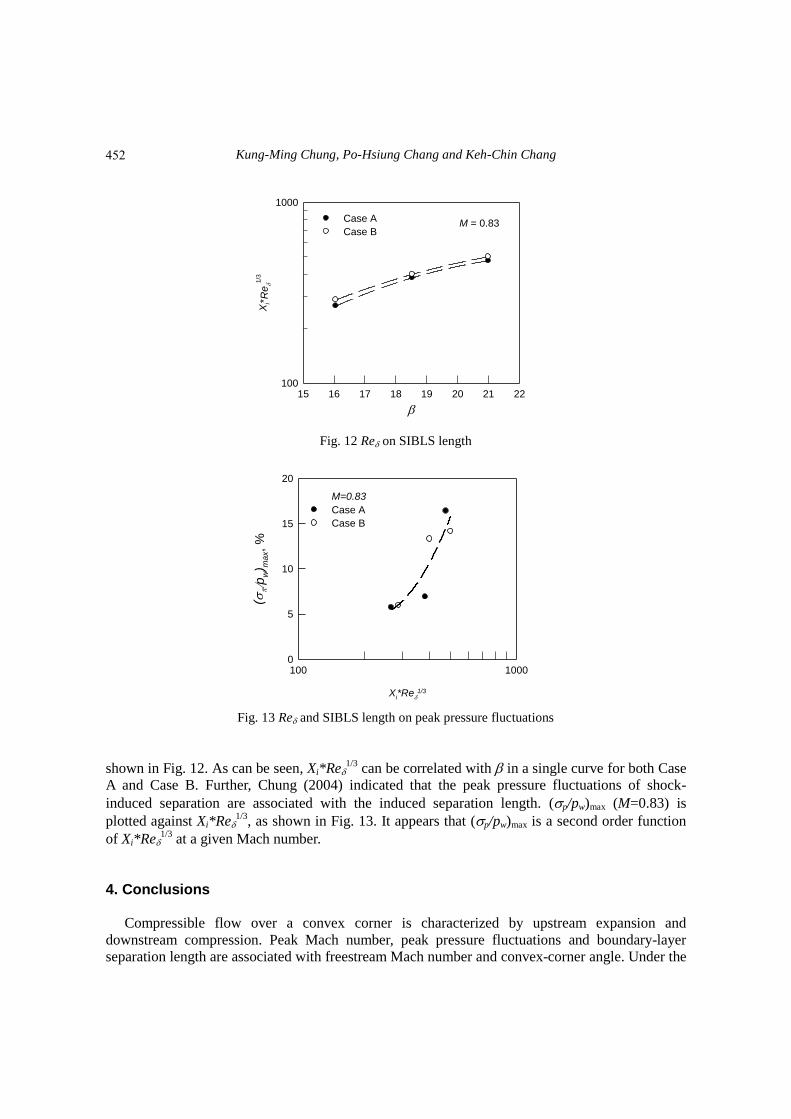
SIBLS length Xi is defined as the distance between the separation and reattachment positions,
observed by oil flow visualization. At M=0.83, Xi* increases linearly with Mpeak (or ) for both
Case A and Case B, as shown in Fig. 11. An increase in Re results in a decrease in Xi*, which is
similar to the result by Law (1974) on supersonic ramp flows. It is also noted that Case B has
shorter Xi. Chung (2004) proposed that shock excursion could be related to the motion of a
separation bubble (expansion and contraction). A decrease in Xi implies higher frequency motion
of the separation bubble or higher (σp/pw)max as shown in Fig. 10.
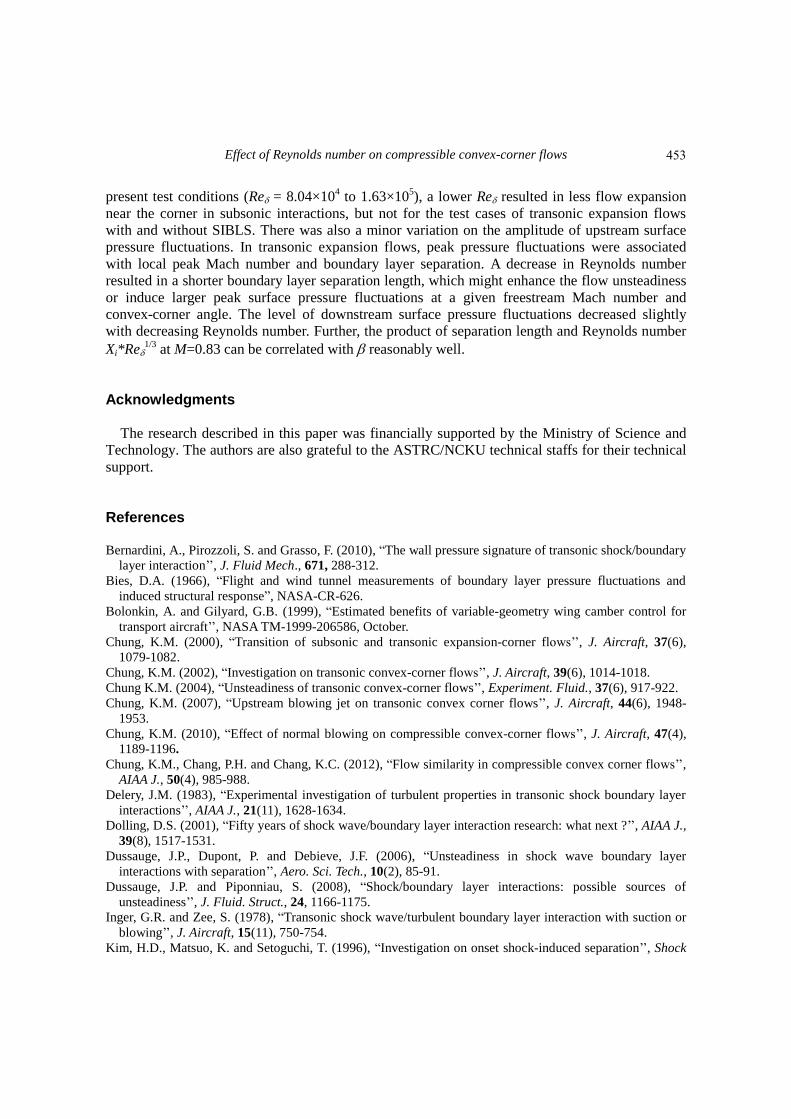
For 2- and 3-D compression corner flows, the upstream influence length Lm is usually
employed to characterize shock wave/boundary-layer interactions. Settles and Bogdonoff (1983)
indicated that the product of upstream influence length and Reynolds number (Lm/)Re1/3
is only a
function of ramp angle at a given freestream Mach number. In this study, the product of separation
length and Reynolds number Xi*Re1/3
is re-plotted against in semi-logarithmic coordinate, as
451
Kung-Ming Chung, Po-Hsiung Chang and Keh-Chin Chang
15 16 17 18 19 20 21 22
Xi*R
e1
/3
100
1000
Case A
Case BM = 0.83
Fig. 12 Re on SIBLS length
Xi*Re
1/3
100 1000
(p
w) m
ax,
%
0
5
10
15
20
M=0.83
Case A
Case B
Fig. 13 Re and SIBLS length on peak pressure fluctuations
shown in Fig. 12. As can be seen, Xi*Re1/3
can be correlated with in a single curve for both Case
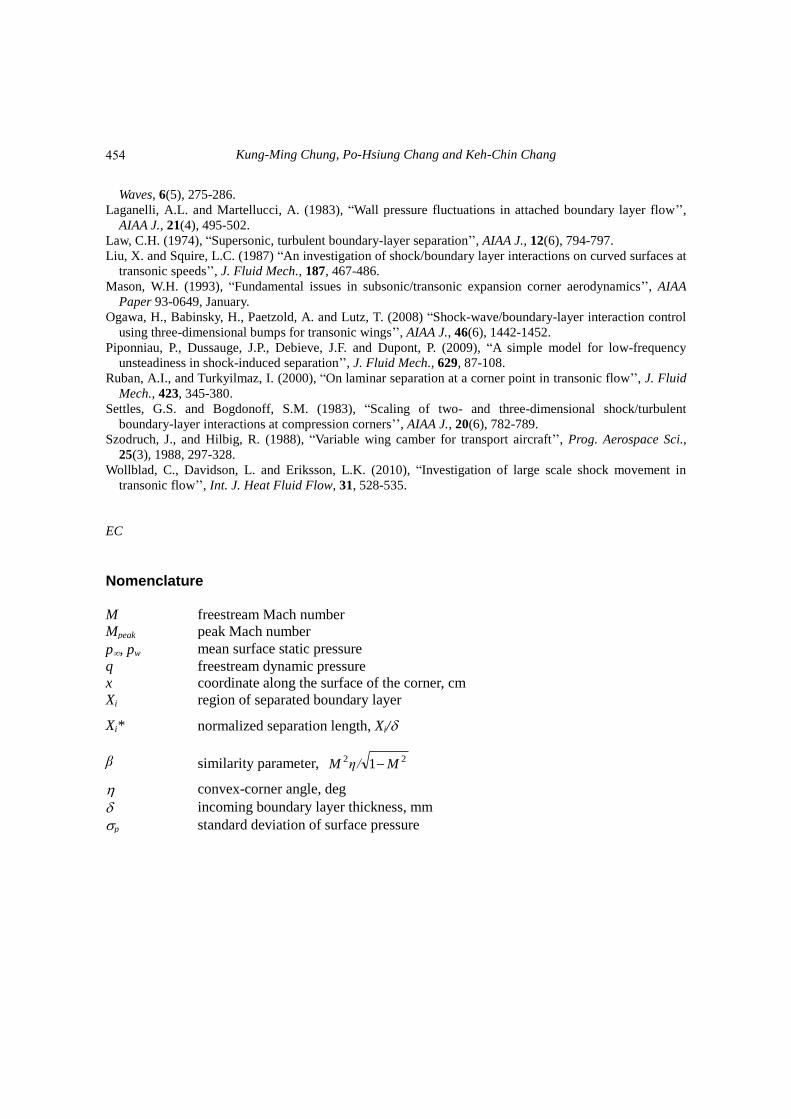
A and Case B. Further, Chung (2004) indicated that the peak pressure fluctuations of shock-
induced separation are associated with the induced separation length. (p/pw)max (M=0.83) is
plotted against Xi*Re1/3
, as shown in Fig. 13. It appears that (p/pw)max is a second order function
of Xi*Re1/3
at a given Mach number.
4. Conclusions
Compressible flow over a convex corner is characterized by upstream expansion and
downstream compression. Peak Mach number, peak pressure fluctuations and boundary-layer
separation length are associated with freestream Mach number and convex-corner angle. Under the
452
Effect of Reynolds number on compressible convex-corner flows
present test conditions (Re = 8.04×10⁴ to 1.63×10
5), a lower Re resulted in less flow expansion
near the corner in subsonic interactions, but not for the test cases of transonic expansion flows
with and without SIBLS. There was also a minor variation on the amplitude of upstream surface
pressure fluctuations. In transonic expansion flows, peak pressure fluctuations were associated
with local peak Mach number and boundary layer separation. A decrease in Reynolds number
resulted in a shorter boundary layer separation length, which might enhance the flow unsteadiness
or induce larger peak surface pressure fluctuations at a given freestream Mach number and
convex-corner angle. The level of downstream surface pressure fluctuations decreased slightly
with decreasing Reynolds number. Further, the product of separation length and Reynolds number
Xi*Re1/3
at M=0.83 can be correlated with reasonably well.
Acknowledgments
The research described in this paper was financially supported by the Ministry of Science and
Technology. The authors are also grateful to the ASTRC/NCKU technical staffs for their technical
support.
References Bernardini, A., Pirozzoli, S. and Grasso, F. (2010), “The wall pressure signature of transonic shock/boundary
layer interaction’’, J. Fluid Mech., 671, 288-312.
Bies, D.A. (1966), “Flight and wind tunnel measurements of boundary layer pressure fluctuations and
induced structural response”, NASA-CR-626.
Bolonkin, A. and Gilyard, G.B. (1999), “Estimated benefits of variable-geometry wing camber control for
transport aircraft’’, NASA TM-1999-206586, October.
Chung, K.M. (2000), “Transition of subsonic and transonic expansion-corner flows’’, J. Aircraft, 37(6),
1079-1082.
Chung, K.M. (2002), “Investigation on transonic convex-corner flows’’, J. Aircraft, 39(6), 1014-1018.
Chung K.M. (2004), “Unsteadiness of transonic convex-corner flows’’, Experiment. Fluid., 37(6), 917-922.
Chung, K.M. (2007), “Upstream blowing jet on transonic convex corner flows’’, J. Aircraft, 44(6), 1948-
1953.
Chung, K.M. (2010), “Effect of normal blowing on compressible convex-corner flows’’, J. Aircraft, 47(4),
1189-1196.
Chung, K.M., Chang, P.H. and Chang, K.C. (2012), “Flow similarity in compressible convex corner flows’’,
AIAA J., 50(4), 985-988.
Delery, J.M. (1983), “Experimental investigation of turbulent properties in transonic shock boundary layer
interactions’’, AIAA J., 21(11), 1628-1634.
Dolling, D.S. (2001), “Fifty years of shock wave/boundary layer interaction research: what next ?’’, AIAA J.,
39(8), 1517-1531.
Dussauge, J.P., Dupont, P. and Debieve, J.F. (2006), “Unsteadiness in shock wave boundary layer
interactions with separation’’, Aero. Sci. Tech., 10(2), 85-91.
Dussauge, J.P. and Piponniau, S. (2008), “Shock/boundary layer interactions: possible sources of
unsteadiness’’, J. Fluid. Struct., 24, 1166-1175.
Inger, G.R. and Zee, S. (1978), “Transonic shock wave/turbulent boundary layer interaction with suction or
blowing’’, J. Aircraft, 15(11), 750-754.
Kim, H.D., Matsuo, K. and Setoguchi, T. (1996), “Investigation on onset shock-induced separation’’, Shock
453
Kung-Ming Chung, Po-Hsiung Chang and Keh-Chin Chang
Waves, 6(5), 275-286.
Laganelli, A.L. and Martellucci, A. (1983), “Wall pressure fluctuations in attached boundary layer flow’’,
AIAA J., 21(4), 495-502.
Law, C.H. (1974), “Supersonic, turbulent boundary-layer separation’’, AIAA J., 12(6), 794-797.
Liu, X. and Squire, L.C. (1987) “An investigation of shock/boundary layer interactions on curved surfaces at
transonic speeds’’, J. Fluid Mech., 187, 467-486.
Mason, W.H. (1993), “Fundamental issues in subsonic/transonic expansion corner aerodynamics’’, AIAA
Paper 93-0649, January.
Ogawa, H., Babinsky, H., Paetzold, A. and Lutz, T. (2008) “Shock-wave/boundary-layer interaction control
using three-dimensional bumps for transonic wings’’, AIAA J., 46(6), 1442-1452.
Piponniau, P., Dussauge, J.P., Debieve, J.F. and Dupont, P. (2009), “A simple model for low-frequency
unsteadiness in shock-induced separation’’, J. Fluid Mech., 629, 87-108.
Ruban, A.I., and Turkyilmaz, I. (2000), “On laminar separation at a corner point in transonic flow’’, J. Fluid
Mech., 423, 345-380.
Settles, G.S. and Bogdonoff, S.M. (1983), “Scaling of two- and three-dimensional shock/turbulent
boundary-layer interactions at compression corners’’, AIAA J., 20(6), 782-789.
Szodruch, J., and Hilbig, R. (1988), “Variable wing camber for transport aircraft’’, Prog. Aerospace Sci.,
25(3), 1988, 297-328.
Wollblad, C., Davidson, L. and Eriksson, L.K. (2010), “Investigation of large scale shock movement in
transonic flow’’, Int. J. Heat Fluid Flow, 31, 528-535.
EC
Nomenclature M freestream Mach number
Mpeak peak Mach number
p, pw mean surface static pressure
q freestream dynamic pressure
x coordinate along the surface of the corner, cm
Xi region of separated boundary layer
Xi* normalized separation length, Xi/
β similarity parameter, 22 1 Mη/M
convex-corner angle, deg
incoming boundary layer thickness, mm
p standard deviation of surface pressure
454