Effect of polysaccharides on the hydration of cement ...
42
HAL Id: hal-00436162 https://hal.archives-ouvertes.fr/hal-00436162 Submitted on 4 May 2011 HAL is a multi-disciplinary open access archive for the deposit and dissemination of sci- entific research documents, whether they are pub- lished or not. The documents may come from teaching and research institutions in France or abroad, or from public or private research centers. L’archive ouverte pluridisciplinaire HAL, est destinée au dépôt et à la diffusion de documents scientifiques de niveau recherche, publiés ou non, émanant des établissements d’enseignement et de recherche français ou étrangers, des laboratoires publics ou privés. Effect of polysaccharides on the hydration of cement suspension A. Peschard, A. Govin, J. Pourchez, E. Fredon, Lionel Bertrand, Sandrine Maximilien, B. Guilhot To cite this version: A. Peschard, A. Govin, J. Pourchez, E. Fredon, Lionel Bertrand, et al.. Effect of polysaccharides on the hydration of cement suspension. Journal of the European Ceramic Society, Elsevier, 2006, pp.1439-1445. hal-00436162
Transcript of Effect of polysaccharides on the hydration of cement ...

HAL Id: hal-00436162https://hal.archives-ouvertes.fr/hal-00436162
Submitted on 4 May 2011
HAL is a multi-disciplinary open accessarchive for the deposit and dissemination of sci-entific research documents, whether they are pub-lished or not. The documents may come fromteaching and research institutions in France orabroad, or from public or private research centers.
L’archive ouverte pluridisciplinaire HAL, estdestinée au dépôt et à la diffusion de documentsscientifiques de niveau recherche, publiés ou non,émanant des établissements d’enseignement et derecherche français ou étrangers, des laboratoirespublics ou privés.
Effect of polysaccharides on the hydration of cementsuspension
A. Peschard, A. Govin, J. Pourchez, E. Fredon, Lionel Bertrand, SandrineMaximilien, B. Guilhot
To cite this version:A. Peschard, A. Govin, J. Pourchez, E. Fredon, Lionel Bertrand, et al.. Effect of polysaccharideson the hydration of cement suspension. Journal of the European Ceramic Society, Elsevier, 2006,pp.1439-1445. �hal-00436162�

Effect of polysaccharides on the hydration of cement suspension
A.Peschard1, A.Govin*
1, J.Pourchez
1, E.Fredon
2, L.Bertrand
3, S.Maximilien
3, B.Guilhot
1
1Ecole Nationale Supérieure des Mines de Saint Etienne, Centre SPIN, Department of
Materials Engineering (PC2M), LPMG: process in granular media laboratory CNRS UMR 5148, 158 cours Fauriel 42023 Saint Etienne cedex, France 2Laboratoire de Chimie des Substances Naturelles, Faculté des Sciences et Techniques,
123 Avenue Albert Thomas , 87060 Limoges 3INSA-Lyon, Group of Metallurgy and Materials Science (GEMPPM) UMR 5510, 20
Avenue Albert Einstein, 69621 Villeurbanne cedex
◊ A.Peschard and A.Govin have contributed equally to this work
* Corresponding author Tel: (33) 4 77 42 02 74; fax: (33) 4 77 49 96 94
E-mail address: [email protected]
Abstract
This work compares the effects induced by polysaccharides on the hydration of
cement. It also brings new insights into the interaction mechanisms between these two
components. Several parameters such as structure, concentration, average molecular
weight, and the soluble fraction value of the polysaccharides were examined. The
hydration of cement was monitored by conductivity measurement, and ionic
chromatography. The influence of polysaccharide structure on the kinetics of cement
hydration was revealed. The extent of retardation increases when polysaccharide
concentration rises. Dextrins with lower average molecular weights compared with
starches favor a higher soluble fraction value and further retard hydration. The growth of
hydrates seemed to be more affected by the presence of these admixtures than did the
dissolution of anhydrous particles or the nucleation of former hydrates.
1

Keywords : C Ionic conductivity, Cement, B Composites, C Chemical properties,
Polysaccharides , Hydration.
1.Introduction
Among the organic admixtures widely used in the formulation of mortars and
concrete, polysaccharides are polymers which can be equally classified in water-reducers,
set-retarders, and water retention agents.
Numerous authors have demonstrated that the properties of mortar and concrete can
be significantly modified at fresh state as well as at hardened state by the addition of
polysaccharides [1-8].
Several mechanisms were proposed to explain the interactions between cement and
set-retarders (i.e. sugars or carboxylic acids) [9-15]. Some authors focused their studies on
interaction with anhydrous surfaces. For Hansen [16], the adsorption onto anhydrous
particles could occur and protect surfaces from initial attack by water. Susuki [17]
proposed that the retarding action of admixtures could be linked to the precipitation of
insoluble calcium salts at the surface of anhydrous particles even though a clear correlation
between solubility and retarding ability of carboxylic acids was not established.
Other studies pointed out that interactions between admixtures and hydrates could
also exist. According to Thomas and Birchall [18], the retarding action of sugars is
explained in terms of adsorption onto and poisoning of hydrates surfaces. Young [19]
suggested that an incorporation of admixtures into crystal lattices could occur. For
example, in the case of C3A hydration, he proposed that organic compounds could enter
2

the interlayer region and stabilize hexagonal hydrates like C4AH13 at the expense of the
cubic form C3AH6. However, in the case of C3S hydration, Popova [20] showed that
polymer-CSH interaction was restricted to adsorption. Indeed no significant structural
modification of CSH were observed by 29
Si NMR characterization.
Hence a mechanism describing the influence of set retarding admixtures on cement
hydration is still not well elucidated. In order to bring new insights, the present study
focuses on the hydration of cement in presence of compounds widely used in mortars i.e.
polysaccharides. The few works on this topic were limited to physico-chemical
phenomenon occurring in a system that only contains cement and monosaccharides
[11,13,15,21]. Most previous studies were carried out in concentrated media (i.e. Water-to-
cement weight ratio W/C inferior to 1) [12,13,21]. The present work was performed on
cement suspensions (W/C=20), by means of conductivity measurement and ionic
chromatography, to identify parameters responsible for the set retarding ability of these
admixtures. The advantage to work on dilute media is to extend the x-axis corresponding
to time. The phenomena relevant to hydration i.e dissolution, nucleation, and growth of
hydrates are more easy to observe at W/C=20 than at ratio inferior to 1.
2.Experimental
2.1.Raw materials
Two Portland cements from Calcia company were studied : a white cement CPA
CEM I 52.5, and a grey cement PMES 42.5 according to the French standard NF P 15-301.
They were selected in order to determine the effect of cement composition on set retarding
3

ability of polysaccharides. Chemical composition and mineralogical phases calculated by
Bogue approximation [22] are respectively listed in Table 1.
The five polysaccharides studied were supplied by several admixtures producers
and were of different types i.e. a cellulose ether (CE), a starch ether (SE), a native starch
(NS), a white dextrin (WD) and a yellow dextrin (YD), the last 2 prepared from NS.
Properties of these polysaccharides are given in Table 2.
2.2. Methods of investigation
In each case, cement and polysaccharide powders were mixed together for 2
periods of 2 minutes using a shaker-mixer (Wab, Turbula, Germany). Unless otherwise
stated, polysaccharide-to-cement weight ratio (P/C) was equal to 0.5 % (w/w) and
experiments were carried out in triplicate.
The conductivity equipment consisted of a 25 °C thermostated reactor that contains
1 l of deionised water, a platinum electrode and a conductimeter (Tacussel CD 810,
France). Previous to each experiment a calibration was performed with a 0.1 M KCl
solution.
Additional data were obtained by the determination of specific ion concentrations
(calcium, sulfate and silicate) using ionic chromatography. This was performed on a
Dionex apparatus, composed of a GP50 pump, a CS12A column for cation analysis and a
AS11HC column for anions, a CD20 conductimetric detector and an AD25 UV-Vis
detector. From the reactor containing the cement suspension, samples of 10 ml were
4
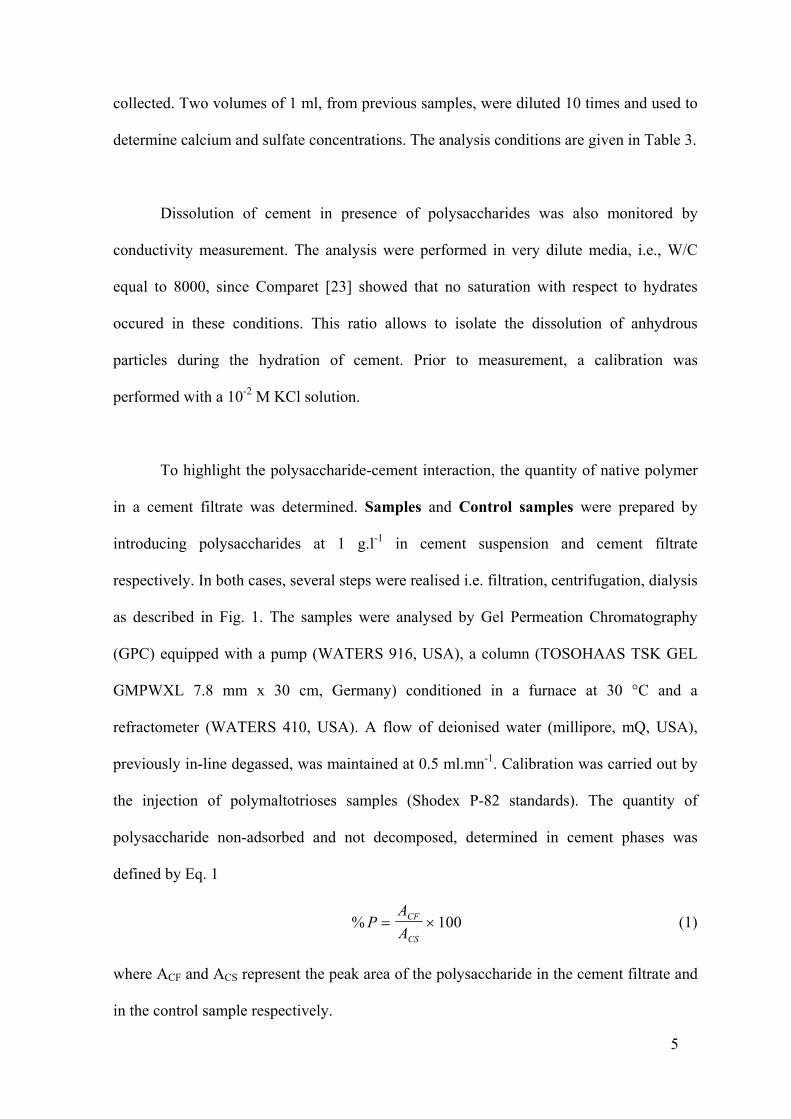
collected. Two volumes of 1 ml, from previous samples, were diluted 10 times and used to
determine calcium and sulfate concentrations. The analysis conditions are given in Table 3.
Dissolution of cement in presence of polysaccharides was also monitored by
conductivity measurement. The analysis were performed in very dilute media, i.e., W/C
equal to 8000, since Comparet [23] showed that no saturation with respect to hydrates
occured in these conditions. This ratio allows to isolate the dissolution of anhydrous
particles during the hydration of cement. Prior to measurement, a calibration was
performed with a 10-2
M KCl solution.
To highlight the polysaccharide-cement interaction, the quantity of native polymer
in a cement filtrate was determined. Samples and Control samples were prepared by
introducing polysaccharides at 1 g.l-1
in cement suspension and cement filtrate
respectively. In both cases, several steps were realised i.e. filtration, centrifugation, dialysis
as described in Fig. 1. The samples were analysed by Gel Permeation Chromatography
(GPC) equipped with a pump (WATERS 916, USA), a column (TOSOHAAS TSK GEL
GMPWXL 7.8 mm x 30 cm, Germany) conditioned in a furnace at 30 °C and a
refractometer (WATERS 410, USA). A flow of deionised water (millipore, mQ, USA),
previously in-line degassed, was maintained at 0.5 ml.mn-1
. Calibration was carried out by
the injection of polymaltotrioses samples (Shodex P-82 standards). The quantity of
polysaccharide non-adsorbed and not decomposed, determined in cement phases was
defined by Eq. 1
% PA
A
CF
CS
= ×100 (1)
where ACF and ACS represent the peak area of the polysaccharide in the cement filtrate and
in the control sample respectively.
5

3.Results
3.1.Hydration of C1
The conductimetric curve of a cement suspension presents different steps (Fig. 2) as
described by Comparet [23], and Maximilien [24].The retarding ability of polysaccharide
on the hydration of cement was correlated to the slope value before the maximum of the
conductimetric curve. A low slope value represents a high slowing down of the hydration
rate of cement. Fig. 3 shows that admixture CE has little effect on the conductimetric curve
contrary to SE which slows hydration significantly and to YD which blocks it for
approximately 10 hours.
The time at which portlandite precipitation occurred was defined by tλmax. The order
of portlandite precipitation is as follows :
C1 < C1+CE < C1+SE < C1+YD.
These results clearly showed that the polysaccharide chemical structure is a major
parameter and has governed the first hours of the hydration rate of cement. The Slope and
tλmax values of corresponding cement suspensions are given in Table 4.
3.2 Influence of polysaccharide SE and YD
3.21 Influence of concentration
The increase of P/C ratio and especially for SE, induces an extended reduction of
the hydration rate of cement since the slope decreases. It indicates that the balance between
6

dissolution of anhydrous particles and precipitation of hydrates is significantly modified by
the addition of SE. The minimum YD/C1 ratio where a blocking effect was observed was
equal to 0.4 %. In contrast the delay observed when YD/C1=0.5 % (10 hours) underwent a
large increase if YD/C1=1 % (delay 46h). Corresponding values of slope and blocking
effect duration are listed on Table 4.
3.22 Influence of polysaccharides addition timing
Polysaccharides were added to cement immediately or delayed from 5 minutes to
90 minutes. For 0.5 % YD addition, the duration of the blocking effect gradually decreased
and became negligible beyond 30 minutes (Fig. 4). An increase in YD concentration up to
1 % induced a plateau wich was still observed for a delayed addition of 30 minutes but not
for a delay of 90 minutes. Consequently an increase of the delay to add YD requires a
higher concentration to observe a plateau. Two explanations are possible, YD could adsorb
either on hydrated or on anhydrous particles. In the first case, the hydrated particles are
more numerous and have a larger specific surface area than anhydrous particles. Hence to
inhibit completely the hydration a higher amount of YD is necessary. In the second case,
the adsorption of YD could occur on anhydrous particles. However, they are less
accessible due to the formation of hydrates when the addition is delayed. In the case of the
delayed addition of SE, the slope increases but does not recover to the value for the neat
cement. This shows that YD and SE do not act in the same way on the hydration of
cement.
3.23 Effect of starch dextrinization on cement hydration
7

To explain the singular effect of YD, the hydration of cement in the presence of
Native starch (NS) and dextrins (WD, YD) was more specifically studied. Dextrins were
prepared by a thermal treatment (140 to 180 °C) in hydrochloric acid of NS (Evans [25],
Satterwaite [26]) by the Roquette Company (France). The admixture WD presents a weak
conversion from starch to dextrins in contrast to YD. A lower average molecular weight
favours a higher soluble fraction value which is, according to the supplier, greater than 90
%, between 5 and 35 %, and less than 5 % for YD, WD and NS respectively. Conductivity
measurement shows that NS has no effect, WD slows down and YD blocks for 10 hours,
the hydration of cement (Fig. 5). Interaction between WD and cement was limited since
more than 80 % of WD (determined by GPC Eq. 1) was still present in cement suspension.
Furthermore, the cement composition does not seem to have any effect on the set retarding
ability of dextrin YD. Similar to the case for cement C1, a blocking effect on C2 hydration
occurs for 10 hours when 0,5 % of YD was added.
The increase of WD/C ratio from 0.5 to 2.5 % leads to a blocking effect and
suggests that the difference in the set retarding ability of WD and YD is more attributed to
the gap in the soluble fraction value than to the difference in the average molecular
weights.
3.3 Hypothesis concerning interaction mechanisms
3.31 Highlight of cement polysaccharide interaction
In order to investigate the cement polysaccharide interaction, the proportion of
admixture in the filtrate was determined by GPC according to Eq. 1. This protocol is a way
to measure the quantity of polysaccharide adsorbed and/or decomposed by mineral phases.
8

Results reveal that more than 80 % of CE quantity was still present in the filtrate. In
contrast C1+SE and C1+YD exhibit residual concentrations of admixture in the filtrate of
less than 10 %. Consequently it indicates that CE was not “trapped” contrary to the most
efficient set retarding admixtures i.e. SE and YD which are probably adsorbed and/or
decomposed by cement.
3.32 Effect of polysaccharides on the dissolution of cement
The dissolution of cement was studied on very diluted suspensions (W/C=8000).
Even though these under-saturated conditions are very far from the hydration at W/C equal
to 20, they make it possible to isolate the dissolution phenomena. Any differences,
observable between the formula C1 and C1+200 % YD, is hidden by the repeatability
variation. Consequently the addition of polysaccharides at P/C ratio from 0.5 % to 200 %
does not affect significantly the dissolution rate (Fig. 6). Hence a mechanism which
postulates that the retardation is linked to an adsorption of organic molecules on anhydrous
particles as proposed by Seligmann [27] does not seem to be valid in the case of cement
admixed with polysaccharides.
3.33 Effect of polysaccharides on the interstitial phase
The studying phase supplies supplementary information compared with
conductivity measurement which only gives a global evolution. Fig.7 shows that calcium
concentration evolution is similar to conductimetric curves. The increase of calcium
concentration for suspensions that contain CE or SE respectively is equivalent to and much
lower than that for pure cement. The addition of YD creates a blocking effect in the rise of
9

calcium concentration equivalent to the plateau observed on the conductimetric curves.
Consequently it seems that calcium diffusion through the solution is inhibited.
The Sulfate concentration decreases since this species is consumed to react with
C3A to form ettringite (Fig. 8). For all formulae, in the first 30 minutes the sulfate
concentration decreases indicating that ettringite is forming. Beyond this period, the
concentration decrease is similar to that of neat cement for the suspensions C1+NS and
C1+CE but is lower for suspensions that contain SE and YD. These observations for the
latter formula could indicate either a decrease in the precipitation rate and an unchanged
dissolution rate or a reduction in the dissolution and the precipitation rates due to the self-
regulation process. From this results it could be assumed that the beginning of C3A
hydration, leading to ettringite formation, is not modified and that the ettringite amount is
then stabilized for C1+SE and C1+YD samples. This observation will induce a delay in the
conversion of ettringite to monosulfoaluminate phase. These results are in good accordance
with those obtained in concentrated media which revealed, a stabilisation of ettringite and a
lower gypsum consumption, for cements formulated with SE or YD [28].
The concentration of silicate ions rises rapidly as a consequence of C3S dissolution
and then subsequently decreases due to the nucleation of CSH. In all the tested formula
within the first hour of hydration, silicate concentration decreases. This suggests that
polysaccharides do not affect significantly CSH nucleation rate. Nevertheless for C1+YD, a
plateau of silicate concentration is observed (results not shown). This phenomena could be
linked to an adsorption of YD on CSH nuclei, forming protective barriers which inhibit
further hydration.
4.Conclusion
10

This study revealed that it was difficult to establish a global mechanism of
interaction between cement and polysaccharides since it seems to depend on the
mineralogical phase studied and the admixture chemical structure. Nevertheless interesting
results were obtained. First, this work reveals the importance of the chemical nature of the
polysaccharides. The set retarding ability decreases in the order YD>SE>WD>CE. Second,
a higher P/C ratio leads to an extended delay in hydration. Third, starch dextrinization
leads to a higher soluble fraction value and hence to a higher set retarding effect than
native starch.
Acknowledgement
The authors acknowledge the financial support of Weber & Broutin company
(Servas, France) and Rhône-Alpes Region.
11

References
[1] D.R. Dewacker, B. Mcad, Cement mortar systems using blends of polysaccharides and
cold-water-soluble unmodified starches, US Patent, 5, 575, 840, 1996.
[2] H. Yamamuro, Property of new polysaccharide derivative as a viscosity agent for self
compacting concrete, Proceeding of the First International Rilem symposium on self
compacting concrete, Stockholm, Sweden 1999, pp. 449-459
[3] V.A. Ghio, P.J.M. Monteiro, The effects of polysaccharide gum additives on the
shotcrete process, ACI Materials Journal 95, 1998, 2, 152-157.
[4] V.A.Ghio, P.J.M.Monteiro, L.A. Demsetz, The rheology of fresh cement paste
containing polysaccharide gums, Cem Concr Res, 1994, 24 2, 243-249.
[5] Y.Tanaka, T.Uryu, M.Yaguchi, Cement compositions containing a sulfated
polysaccharide and method, US Patent, 5, 573, 589, 1996.
[6] K.Hayakawa, T.Soshiroda, An experimental study on the concrete containing cellulose
ether, Transportation of Japan Concrete Institute, 1985, 7, 17-24.
[7] K.Hayakawa, T.Soshiroda, Effects of cellulose ether on bond between matrix and
aggregate in concrete, Adhesion between polymers and concrete proceedings 1986, pp. 22-
31.
12

[8] N.K.Singh, P.C.Mishra, V.K.Singh, K.K.Narang, Effects of hydroxyethyl cellulose and
oxalic acid on the properties of cement, Cem.Concr.Res 2003, 33, 1319-1329.
[9] G.M. Bruere, Importance of mixing sequence when using set retarding agents with
portland cement, Nature, 1963, 199, 32-33.
[10] G.M. Bruere, Set retarding effects of sugars in Portland cement pastes, Nature, 1966,
212, 502-503.
[11] N.Tenoutasse, N.B.Singh, Effect of glucose and calcium gluconate on the hydration of
Portland Cement, Ind. J. Tech, 1978, 16, 184-189.
[12] N.B.Singh, Effect of gluconates on the hydration of cement, Cem.Concr.Res, 1976, 6,
455-460.
[13] U.Ludwig, C.Urrutia, Influence of sucrose on the setting of Portland cement,
Proceedings of the 8th
International Congress on the chemistry of cement, Rio de Janeiro,
520-522.
[14] S.Diamond, Interactions between cement minerals and hydroxycarboxylic-acid
retarders : I, apparent adsorption of salicylic acid on cement and hydrated cement
compounds, J. Am. Ceram. Soc, 1971, 54 n°6, 273-276.
[15] K.Luke, G.Luke, Effect of sucrose on retardation of Portland cement, Adv. Cem. Res.
2000, 12 n°1, 9-18.
13

[16] W.C.Hansen, Actions of calcium sulfate and admixtures in portland cement paste,
Symposium on admixtures in concrete, ASTM Technical publication, 266, 1960, pp. 3-37.
[17] S.Suzuki, S.Nishi, Influence of saccharides and other organic additives on the
hydration of Portland cement, Rev 13th
General Meeting of the Japan Cement Engineering
Association, 1959, pp. 34-35.
[18] N.L.Thomas, J.D.Birchall, The retarding action of sugars on cement hydration,
Cem.Conc.Res, 1983, 13, 830-842.
[[19] J.F.Young, Effect of organic compounds on the interconversions of calcium
aluminate hydrates : Hydration of Tricalcium aluminate, J.Am.Ceram.Soc., 1970, 53 n°2,
65-69.
[20] A. Popova, G. Geoffroy, M-F. Renou-Gonnord, P. Faucon, E. Gartner, Interactions
between polymeric dispersants and calcium silicate hydrate, J.Am.Ceram.Soc., 2000, 83
(10), 2556-2560.
[21] M.C. Garci Juenger, H.M. Jennings, New insights into the effects of sugar on the
hydration and microstructure of cement pastes, Cem.Concr.Res., 2002, 32, 393-399.
[22] H.F.W Taylor, Cement Chemistry, Academic Press, New York, 1990, pp 62-63.
14

[23] C.Comparet, A.Nonat, S.Pourchet, J.P.Guicquéro, E.Gartner, M.Mosquet, Chemical
interaction of Di-Phosphonate terminated monofunctional polyoxyethylene superplasticizer
with hydrating tricalcium silicate, Proceedings of the 6th
CANMET/ACI International
Conference on superplasticizers and other chemical admixtures in concrete, Ed
V.M.Malhotra, SP195-5, 1997, pp. 61-74.
[24] S. Maximilien, J. Pera, M. Chabannet, Study of the reactivity of clinkers by means of
the conductometric test, Cem.Concr.Res., 1997, 27, 63-73.
[25] R.B. Evans, O.B. Wurzburg, Production and use of starch dextrins, in: Starch
Chemistry and Technology, Eds R.L.Whistler, E.F.Paschall, Academic Press, New-York
and London, 1967, Chap XI, pp 254-276.
[26] R.W. Satterthwaite, D.J. Iwinski, Starch Dextrins, in: Industrial gums :
Polysaccharides and their derivatives, Ed R.L.Whistler , Academic Press, New York and
London, 1973, Chap XXVI, pp 577-587.
[27] P.Seligmann, N.R.Grenning, Studies of early hydration reactions of portland cement
by X-ray diffraction, Highw.res.rec. 62 (1964) 80-105.
[28] A.Peschard, A.Govin, P.Grosseau, B.Guilhot, R.Guyonnet, Effect of polysaccharides
on the hydration of cement pastes at early ages, Cem.Conc.Res., 2004, 34, 2153-2158
15

Fig. 1. Sample preparation previous to proportioning polysaccharides in cement suspension
Polysaccharide 1g/l
Filtration filtrateCentrifugation 10 000 rpm
10mn
Dialysis
spectrapor 6
membrane
Cement suspension
(W/C=5)
Polysaccharide 1g/l
Dialysis
spectrapor 6
membrane
Control samples GPC analysis
Admixed suspensions GPC analysis
Cement suspension
(W/C=5)
Centrifugation 10 000 rpm
10mnfiltrateFiltration
16

A.Peschard1, A.Govin*
1, J.Pourchez
1, E.Fredon
2, L.Bertrand
3, S.Maximilien
3, B.Guilhot
1
17

Fig. 2. Different steps of a conductimetric curve
0
2
4
6
8
10
12
14
0 1 2 3 4 5 6 7
Time (h)
Co
nd
uct
ivit
y (
mS
.cm
-
8
1)
dissolution
nucleation
low conductivity increasing period
depending on the hydrate nuclei number
portlandite precipitation
Change of hydrate
growth limiting step
maximum free growth
Rate of the growth limited by the diffusion
free growth period hydrate growth limited by the diffusion period
18

A.Peschard1, A.Govin*
1, J.Pourchez
1, E.Fredon
2, L.Bertrand
3, S.Maximilien
3, B.Guilhot
1
19

Fig. 3. Effect of the chemical nature of polysaccharides on cement hydration
0
2
4
6
8
10
12
14
0 5 10 15Time (hours)
Co
nd
uctivity (
mS
.cm
-1)
C1
C1 + CE
C1 + SE
C1 + YD
20
A.Peschard1, A.Govin*
1, J.Pourchez
1, E.Fredon
2, L.Bertrand
3, S.Maximilien
3, B.Guilhot
1
21

Fig. 4. Effect of a delayed addition of 0.5% YD on cement C1 hydration
0
2
4
6
8
10
12
14
0 5 10 15Time (hours)
Conductivity (
mS
.cm
-1)
C1
C1+YD 90'
C1+YD 30'
C1+YD 10'
C1+YD 5'
C1+YD
22

A.Peschard1, A.Govin*
1, J.Pourchez
1, E.Fredon
2, L.Bertrand
3, S.Maximilien
3, B.Guilhot
1
23

Fig. 5. Effect of dextrinization on the conductimetric curves
0
2
4
6
8
10
12
14
0 2 4 6 8 10 12 14 16Time (hours)
Co
nd
uctivity (
mS
.cm
-1)
C1
C1+NS
C1+WD
C1+YD
24

A.Peschard1, A.Govin*
1, J.Pourchez
1, E.Fredon
2, L.Bertrand
3, S.Maximilien
3, B.Guilhot
1
25

Fig. 6. Effect of YD addition on cement dissolution
0
0.1
0.2
0.3
0.4
0.5
0.6
0 10 20 30 40 50 6Time (mn)
Conductivity (
mS
.cm
-1)
0
C1
C1+1% YD
C1+2% YD
C1+200% YD
26

A.Peschard1, A.Govin*
1, J.Pourchez
1, E.Fredon
2, L.Bertrand
3, S.Maximilien
3, B.Guilhot
1
27

Fig. 7. Evolution of Calcium concentration in admixed suspensions
0
200
400
600
800
1000
1200
1400
1600
1800
0 2 4 6 8 10 12 14Time (h)
[Ca
2+]
(mg
/l)
C1
C1+CE
C1+SE
C1+YD
C1+NS
28

A.Peschard1, A.Govin*
1, J.Pourchez
1, E.Fredon
2, L.Bertrand
3, S.Maximilien
3, B.Guilhot
1
29

Fig. 8. Evolution of sulfate concentration of admixed cement suspensions
0
200
400
600
800
1000
0 2 4 6 8Time (h)
[SO
42- ]
(mg/l)
10
C1C1+CEC1+SEC1+YDC1+NS
30

A.Peschard1, A.Govin*
1, J.Pourchez
1, E.Fredon
2, L.Bertrand
3, S.Maximilien
3, B.Guilhot
1
31

Figure captions
Fig. 1. Sample preparation previous to proportioning polysaccharides in cement suspension
Fig. 2. Different steps of a conductimetric curve
Fig. 3. Effect of the chemical nature of polysaccharides on cement hydration
Fig. 4. Effect of a delayed addition of 0.5% YD on cement C1 hydration
Fig. 5. Effect of dextrinization on the conductimetric curves
Fig. 6. Effect of YD addition on cement dissolution
Fig. 7. Evolution of Calcium concentration in admixed suspensions
Fig. 8. Evolution of sulfate concentration of admixed cement suspensions
32

Table 1 Chemical composition and potential phases determined by Bogue approximation
Chemical composition C1 C2
SiO2 22.2 21.9
TiO2 0.2 0.4
Al2O3 4.4 3.8
Fe2O3 0.3 4.3
CaO 67.2 62.8
MnO 0.01 0.04
MgO 0.5 2.2
Na2O 0.4 0.4
K2O 0.05 0.39
P2O5 0.11 0.26
SO3 3 2.6
Bogue approximation C1 C2
C3S 66 51
C2S 14 24
C3A 11 2.6
C4AF 1 13.2
33

A.Peschard1, A.Govin*
1, J.Pourchez
1, E.Fredon
2, L.Bertrand
3, S.Maximilien
3, B.Guilhot
1
34

Table 2 Properties of polysaccharides
Admixture Solubility at 25 °C Mw (Daltons) a
Substituent
CE Yes (11.6 ± 0.1)106
CH3, (CH2)2-OH and
(CH2)3-OH
SE Yes
(1.48 ± 0.05)106
(173 ± 5)103
(CH2)3-OH
NS No
25,2,106
(290 ± 6)103
-
WD 5<S<35 % (11 ± 1)103
-
YD S> 90 % (8,5 ± 0,5)103
-
a determined by Gel Permeation Chromatography
b determined by Pyrolysis-Gas Chromatography-Mass Spectrometry
S : soluble fraction value (producers data)
35

A.Peschard1, A.Govin*
1, J.Pourchez
1, E.Fredon
2, L.Bertrand
3, S.Maximilien
3, B.Guilhot
1
36
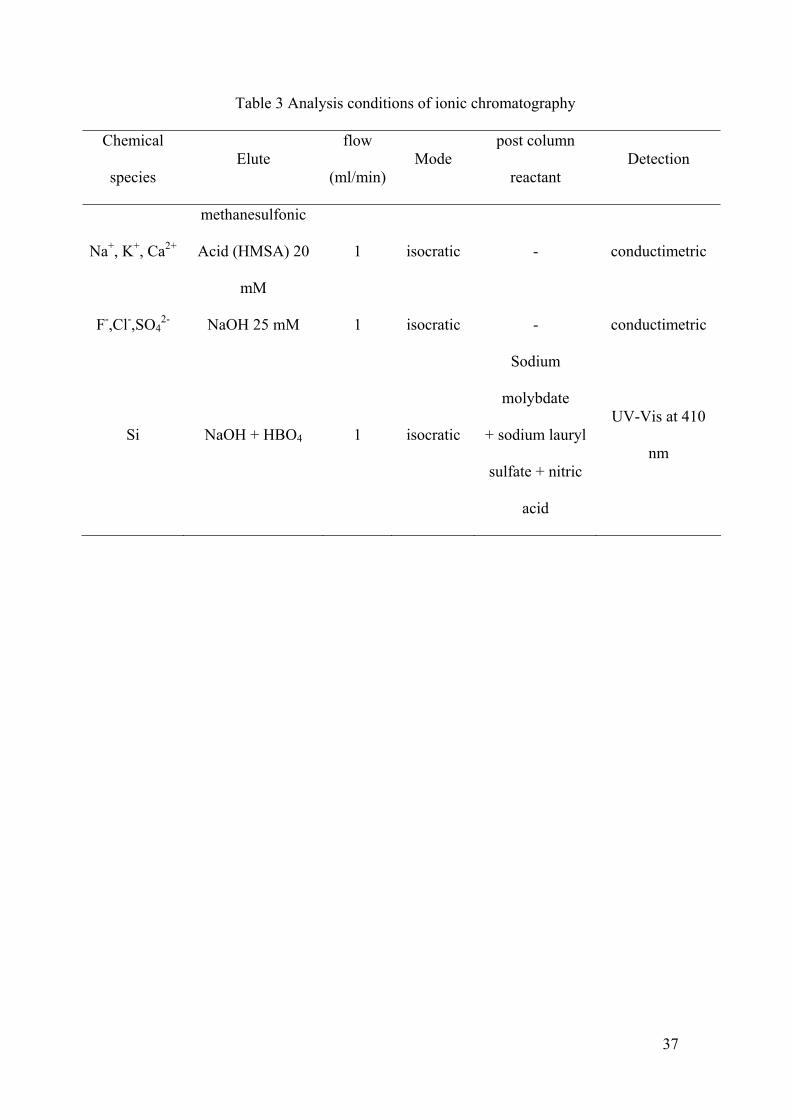
Table 3 Analysis conditions of ionic chromatography
Chemical
species
Elute
flow
(ml/min)
Mode
post column
reactant
Detection
Na+, K
+, Ca
2+
methanesulfonic
Acid (HMSA) 20
mM
1 isocratic - conductimetric
F-,Cl
-,SO4
2-NaOH 25 mM 1 isocratic - conductimetric
Si NaOH + HBO4 1 isocratic
Sodium
molybdate
+ sodium lauryl
sulfate + nitric
acid
UV-Vis at 410
nm
37

A.Peschard1, A.Govin*
1, J.Pourchez
1, E.Fredon
2, L.Bertrand
3, S.Maximilien
3, B.Guilhot
1
38

Table 4 Effect of polysaccharides and P/C ratio on the slope, tλmax and duration of the
blocking effect
Slope (mS.cm-1
.h-1
) tλmax (h)
Duration of the
blocking effect (h)
Quantity of native
polysaccharide in cement
filtrate from Eq. 1 (%)
C1 2.6 ± 0.2 3.5±0.1 - nd
C1+0.5% CE 2.23±0,01 4.2±0.2 - 80 ± 3
C1+0.5% NS 2.3±0,1 3.9±0.1 - nd
C1+0.5% WD 1.86±0,01 5.6±0.3 - 90 ± 6
C1+0.5% SE 1.1 ± 0.1 8.0±0.6 - 10 ± 3
C1+1% SE 0.8 ± 0.1 11.1±0.7 - nd
C1+1.2% SE 0.4 ± 0.1 >17 - nd
C1+1.5% SE 0.12 ± 0.06 >17 - nd
C1+2% SE 0.09 ± 0.05 >17 - nd
C1+0.1% YD 2.03±0.12 4.4±0.1 0 nd
C1+0.3% YD 1.79±0.08 6.1±0.2 0 nd
C1+0.4% YD 1.76±0.09 7.2±0.3 1.7±0.2 nd
C1+0.5% YD 2.07±0.13 14±1 10 ± 1 3 ± 1
C1+1% YD nd nd 46 ± 4 nd
39

A.Peschard1, A.Govin*
1, J.Pourchez
1, E.Fredon
2, L.Bertrand
3, S.Maximilien
3, B.Guilhot
1
40

Table captions
Table 1 Chemical composition and potential phases determined by Bogue approximation
Table 2 Properties of polysaccharides
Table 3 Analysis conditions of ionic chromatography
Table 4 Effect of polysaccharides and P/C ratio on the slope, tλmax and duration of the
blocking effect
41