Cement hydration from hours to centuries controlled by ...
14
Contents lists available at ScienceDirect Journal of the Mechanics and Physics of Solids journal homepage: www.elsevier.com/locate/jmps Cement hydration from hours to centuries controlled by diffusion through barrier shells of C-S-H Saeed Rahimi-Aghdam a , Zdeněk P. Bažant b, ⁎ , M.J. Abdolhosseini Qomi c a Civil and Environmental Engineering, Northwestern University, United States b Civil and Mechanical Engineering and Materials Science, Northwestern University, United States c Civil and Environmental Engineering, University of California, Irvine, United States ARTICLE INFO Keywords: Hydration modeling Aging of concrete Calcium silicate hydrate Diffusion barrier Relative humidity Effective diffusivity Cement particle size Temperature Water-to-cement ratio ABSTRACT Although a few good models for cement hydration exist, they have some limitations. Some do not take into account the complete range of variation of pore relative humidity and temperature, and apply over durations limited from up a few months to up to about a year. The ones that are applicable for long durations are either computationally too intensive for use in finite element programs or predict the hydration to terminate after few months. However, recent tests of autogenous shrinkage and swelling in water imply that the hydration may continue, at decaying rate, for decades, provided that a not too low relative pore humidity (above 0.7) persists for a long time, as expected for the cores of thick concrete structural members. Therefore, and because design lifetimes of over hundred years are required for large concrete structures, a new hydration model for a hundred year lifespan and beyond is developed. The new model considers that, after the first day of hydration, the remnants of anhydrous cement grains, gradually consumed by hydration, are enveloped by contiguous, gradually thickening, spherical barrier shells of calcium- silicate hydrate (C-S-H). The hydration progress is controlled by transport of water from capillary pores through the barrier shells toward the interface with anhydrous cement. The transport is driven by a difference of humidity, defined by equivalence with the difference in chemical potential of water. Although, during the period of 4–24 h, the C-S-H forms discontinuous nano-globules around the cement grain, an equivalent barrier shell control was formulated for this period, too, for ease and effectiveness of calculation. The entire model is calibrated and validated by published test data on the evolution of hydration degree for various cement types, particle size distributions, water-cement ratios and temperatures. Computationally, this model is sufficiently effective for calculating the evolution of hydration degree (or aging) at every integration point of every finite element in a large structure. 1. Introduction Bridges, super-tall buildings and other large concrete structures are supposed to be designed for lifetimes in excess of hundred years. However, much shorter lifetimes have often been experienced. This is documented by a Northwestern University database (Bažant and Li, 2008; Hubler et al., 2016) of 71 large-span prestressed bridges that developed seriously excessive deflections with concomitant damage. It was shown that the major cause was the design based on obsolete and inadequate prediction models for http://dx.doi.org/10.1016/j.jmps.2016.10.010 Received 24 August 2016; Received in revised form 21 October 2016; Accepted 26 October 2016 ⁎ Correspondence to: Civil and Mechanical Engineering and Materials Science, Northwestern University, 2145 Sheridan Road, CEE/A135, Evanston, IL 60208, United States. E-mail address: [email protected] (Z.P. Bažant). J. Mech. Phys. Solids 99 (2017) 211–224 0022-5096/ © 2016 Published by Elsevier Ltd. Available online 02 November 2016 cross
Transcript of Cement hydration from hours to centuries controlled by ...

Contents lists available at ScienceDirect
Journal of the Mechanics and Physics of Solids
journal homepage: www.elsevier.com/locate/jmps
Cement hydration from hours to centuries controlled by diffusionthrough barrier shells of C-S-H
Saeed Rahimi-Aghdama, Zdeněk P. Bažantb,⁎, M.J. Abdolhosseini Qomic
a Civil and Environmental Engineering, Northwestern University, United Statesb Civil and Mechanical Engineering and Materials Science, Northwestern University, United Statesc Civil and Environmental Engineering, University of California, Irvine, United States
A R T I C L E I N F O
Keywords:Hydration modelingAging of concreteCalcium silicate hydrateDiffusion barrierRelative humidityEffective diffusivityCement particle sizeTemperatureWater-to-cement ratio
A B S T R A C T
Although a few good models for cement hydration exist, they have some limitations. Some do nottake into account the complete range of variation of pore relative humidity and temperature, andapply over durations limited from up a few months to up to about a year. The ones that areapplicable for long durations are either computationally too intensive for use in finite elementprograms or predict the hydration to terminate after few months. However, recent tests ofautogenous shrinkage and swelling in water imply that the hydration may continue, at decayingrate, for decades, provided that a not too low relative pore humidity (above 0.7) persists for along time, as expected for the cores of thick concrete structural members. Therefore, and becausedesign lifetimes of over hundred years are required for large concrete structures, a new hydrationmodel for a hundred year lifespan and beyond is developed. The new model considers that, afterthe first day of hydration, the remnants of anhydrous cement grains, gradually consumed byhydration, are enveloped by contiguous, gradually thickening, spherical barrier shells of calcium-silicate hydrate (C-S-H). The hydration progress is controlled by transport of water fromcapillary pores through the barrier shells toward the interface with anhydrous cement. Thetransport is driven by a difference of humidity, defined by equivalence with the difference inchemical potential of water. Although, during the period of 4–24 h, the C-S-H formsdiscontinuous nano-globules around the cement grain, an equivalent barrier shell control wasformulated for this period, too, for ease and effectiveness of calculation. The entire model iscalibrated and validated by published test data on the evolution of hydration degree for variouscement types, particle size distributions, water-cement ratios and temperatures.Computationally, this model is sufficiently effective for calculating the evolution of hydrationdegree (or aging) at every integration point of every finite element in a large structure.
1. Introduction
Bridges, super-tall buildings and other large concrete structures are supposed to be designed for lifetimes in excess of hundredyears. However, much shorter lifetimes have often been experienced. This is documented by a Northwestern University database(Bažant and Li, 2008; Hubler et al., 2016) of 71 large-span prestressed bridges that developed seriously excessive deflections withconcomitant damage. It was shown that the major cause was the design based on obsolete and inadequate prediction models for
http://dx.doi.org/10.1016/j.jmps.2016.10.010Received 24 August 2016; Received in revised form 21 October 2016; Accepted 26 October 2016
⁎ Correspondence to: Civil and Mechanical Engineering and Materials Science, Northwestern University, 2145 Sheridan Road, CEE/A135, Evanston, IL 60208,United States.
E-mail address: [email protected] (Z.P. Bažant).
J. Mech. Phys. Solids 99 (2017) 211–224
0022-5096/ © 2016 Published by Elsevier Ltd.Available online 02 November 2016
cross

multi-decade creep (Bažant et al., 2011, 2012).Although a significant progress toward developing a more realistic model has been made (Bažant et al.; Wendner et al., 2015),
one aspect that needs a better mathematical model is the aging of concrete due to hydration. Since the creep is strongly affected byaging, and the aging is caused by solidification due to cement hydration, what is especially needed is a model that can predict theevolution of hydration for a hundred-year lifetime and beyond, and do so in a simple enough computationally effective way. To thisend, we refine and extend the model presented in 2015 at ConCreep-10; see (Bažant et al., 2015).
It is often thought that cement hydration is not a long-lived phenomenon. But that is true only if concrete dries up. In the cores ofmassive walls, high pore humidity may persist for decades and even centuries, even in structures exposed to dry environment. Whatmakes the hydration process long-lived and progressively slower is that, after the first day, the anhydrous cement grains becomeenveloped in contiguous shells of cement hydrate. The shells are highly impermeable and allow only a very slow transport of watertoward the anhydrous grain interface.
Therefore, the basic idea of the present model (whose outline was recently presented in ConCreep-10 proceedings (Bažant et al.,2015)) is that the evolution of hydration is controlled by water diffusion through barrier shells of hydrated cement surrounding theanhydrous remnants of cement grains. Although contiguous barrier shells exist only after the first day of hydration, it will beconvenient and computationally effective to introduce a hypothetical equivalent barrier shell model even for the first day.
The hydration of cement is an extremely complex reaction involving chemo-physical phenomena spanning from a nanometer tomicrometers in length and from seconds to decades in time. Aside from creep, the hydration is a crucial process for heat generation,strength development, self desiccation and autogenous shrinkage. Developing a realistic model is essential for understanding andcontrol of all these phenomena. The literature is large. The main works include, e.g., Jennings and Johnson (1986), Bentz andGarboczi, Van Breugel (1991) (whose model is known as HYMOSTRUC); Navi and Pignat (1996), Bentz (1997) (whose model isknown as CEMHYD3D); Maekawa et al., and Lin and Meyer (2009).
Although some of the existing models are able to predict short- and mid-term hydration with sufficient accuracy, but they usuallyhave problems in predicting long-term hydration (beyond a few years). In addition, the models that are able to predict reasonably thelong-term hydration either consider no physics (or only the physical processes during the first few hours after mixing) or arecomputationally too demanding for use in finite element programs for structural analysis for such a long time period. Also, theexisting hydration models usually do not calculate the decrease of pore relative humidity caused by hydration, i.e., the self-desiccation, although this phenomenon has a feedback on the hydration rate and is critical for understanding and modeling ofautogenous shrinkage and drying creep, especially long-term (Bažant et al., 2015, 1997; Bažant and Yunping, 1994; Persson, 1998).In older studies, the self-desiccation and autogenous shrinkage were generally ignored since they were negligible in old concreteswith high water-to-cement ratios or no admixtures, or both. Recently, though, the trend toward high performance concretes raisesthe importance of the evolution of hydration for predicting the creep, shrinkage and self-desiccation, especially long-term.
Therefore, the present study aims to develop a new and complete hydration model. The goal is not only to predict the evolution ofcement hydration with heat generation, but also to provide underpinning in the physics of hydration and achieve a model that wouldbe credible for predicting centuries-long hydration with its effect on the pore humidity evolution. To this end, the model is based onthe water transport through the aforementioned C-S-H barriers and conveniently considers the pore humidity (or relative vaporpressure) as the driving force controlling the hydration rate. Simplicity, computational efficacy and usability in finite elementprogram are also important goals.
Note that although in this study the water transport is considered to be the rate-controlling process, there are also some otherpossible rate-controlling processes including: 1- Ion diffusion, and 2- Slow down (even stop) of hydration reaction due to the effect ofnegative capillary pressure on cement dissolution rate (Flatt et al., 2011). Ion diffusion should be in balance with water transportsince both should occur simultaneously to hydration reaction continues. Therefore, either of these processes could be considered asthe main rate controlling process but, for simplicity, the water transport has been chosen in this study. In addition, in order toconsider the effect of capillary pressure on the rate of reaction, the hydration reaction was considered to stop at high negativecapillary tension (low relative humidity) as it was shown by (Flatt et al., 2011). In other words, hydration of cement in contact withwater proceeds rapidly, almost immediately, until the chemical potential of water cannot overcome the activation energy barrier as itdrops below a specific relative humidity. In this study, the critical relative humidity hc at room temperature was considered as 0.78.
The pore relative humidity (or just humidity) drives shrinkage, greatly influences creep and facilitates the alkali-silica reaction(ASR). As shown in Fig. 1, a humidity decrease results from both external drying and self-desiccation, the latter being caused byhydration. This figure illustrates how the two shrinkage driving forces interact. At drying exposure, the drying front spreads at arapidly decaying rate into a slab, as described by a nonlinear diffusion equation (Bažant and Najjar, 1972). For thick slabs, the corecan remain unaffected by external drying for a very long time. This makes it clear that the self-desiccation, driven by hydration, canbe the cause of a large pore humidity drop and play for a long time a significant role. These are situations where the evolution ofhydration degree over months, years, decades and centuries needs to be realistically modeled.
There are two recent observations that lead to the conclusion that the hydration and the consequent self-desiccation may be long-lived, proceeding at higher pore humidities (at decaying rate) for years, even decades (cf. Fig. 1 in (Bažant et al., 2015)): Both theterminal autogenous shrinkage and the swelling under water immersion proceed logarithmically up to at least ten years. From thisone may conclude that: 1) The hydration, too, proceeds, at not too low humidity, for years, probably even decades and centuries, and2) the hydration reaction on the micrometer level of cement paste may be expansive, even though on the nanolevel it is contractive,as known for more than a century (Bažant et al., 2015). The latter conclusion was explained by the crystal growth pressure ofgrowing and contacting barrier shells of C-S-H, which is more than offset by contraction caused by a decrease of chemical potentialof nanopore water related to increased capillary tension. This multi-year or multi-decade evolution cannot be described by the
S. Rahimi-Aghdam et al. J. Mech. Phys. Solids 99 (2017) 211–224
212

existing hydration models because either they do not consider the evolution and feedback of pore relative humidity, or they predictthe hydration to terminate within a few months and not more than a year, or they are computationally too expensive to use in finiteelement program for such a long duration.
2. Qualitative description of cement hydration
The ordinary portland cement (OPC) comprises various phases such as alite (C3S), belite (C2S), calcium aluminate (C3A),tetracalcium aluminoferrite (C4AF) and gypsum, as well as minor other phases (we use cement chemistry notation in which C, S, Aand F stand, respectively, for CaO, SiO2, Al2O3 and Fe2O3) (Taylor, 1997). C3S and C2S are two major components of OPC.
The hydration mechanisms of OPC systems are extremely complex and involve chemo-physical phenomena whose scales spanfrom nanometer to micrometers in length and from seconds to centuries in time.
The hardened cement paste, as formed during the hydration process, is highly porous, with pore size distribution ranging fromnanometers to millimeters. The cement paste's porosity, ϕp, may be divided into two components (excluding the interlayer porosity)(Ulm et al., 2004); ϕ ϕ ϕ= +p gel ip, where ϕip and ϕgel are, respectively, the inter-particle porosity, which is often referred to ascapillary porosity, and gel porosity. The inter-particle porosity represents the volume that originally exists between the anhydrouscement grains, parts of which are gradually filled with the hydration products, the C-S-H gel and the portlandite. The gel porosityrepresents the pores that exist inside the C-S-H gel. The gel porosity includes pores with various sizes and generally has thecharacteristic dimension of 5.6 nm (Ulm et al., 2004). The characteristic length scale in which Kelvin equation relates correctly theliquid meniscus curvature to pore vapor pressure is approximately slightly larger than 3 nm. Therefore, the gel porosity includessome pores for which Kelvin equation is valid, ϕKp, and others for which Kelvin equation fails, ϕnp.
Due to the porous nature of C-S-H gel and a variable degree of saturation, the cement hydration is commonly regarded as a non-stoichiometric reaction. Here, we will consider only the part of the reaction that produces the solid C-S-H at the nano-level. Thenano-level hydration reaction of C2S and C3S can be summarized as (Qomi et al., 2015),
C S + 2.1H → C SH + 0.3CH2 1.7 1.8 (1a)
C S + 3.1H → C SH + 1.3CH3 1.7 1.8 (1b)
where C SH1.7 1.8 and H are, respectively, the typical C-S-H type found in OPC pastes and water. The molecular water inside the nano-structure of C-S-H, usually referred to as inter-layer water or hindered adsorbed water layer, exhibits non-zero but very low mobilityand diffusivity (Qomi et al., 2014). Therefore, we assume that the inter-layer water is part of the structure and does not participate inthe hydration process. The stoichiometric relations in Eq. (1) provide a means to calculate incremental evolution of differentcompounds in the reaction,
V ld = [C S]c C S 2,32,3 (2a)
V ld = [CH]p CH (2b)
V ld = [CSH]gi
CSH (2c)
V l V ϕ V ϕ Sd = [H] + d + dw gi np
gi Kp Kp
H (2d)
where lM and [M] are, respectively, the stoichiometry coefficient and the molar volume of compound M in Eq. (1). Table 1 gives themolar volume and density of the calcium-silicate phases present in the cement paste. We assume the porosity of C-S-H gel (gelporosity) to be 32% out of which 33% follow the Kelvin equation. The gel pores for which Kelvin equation is valid, ϕKp, areconsidered not to be always saturated and SKp in Eq. (2d) is the average saturation degree of these pores. For simplicity, we considerthe saturation degree to be equal to the saturation degree in capillary pores.
Fig. 1. A schematic illustration of size effect in combined drying and self-desiccation causing autogenous shrinkage.
S. Rahimi-Aghdam et al. J. Mech. Phys. Solids 99 (2017) 211–224
213

It should be noted that, as it has been shown by some experiments (Ulm et al., 2004; Königsberger et al., 2016; Muller et al.,2012), the density of C-S-H and thus its porosity are not constant. Due to simplicity and a negligible effect on final results, theporosity of C-S-H is considered constant during the calculation of the evolution of different compounds in the hydration reaction, butthe C-S-H densification and its porosity change are taken into account for the calculation of water transport through C-S-H byconsidering the diffusivity of C-S-H as a function of its density.
To study the evolution of hydration over time, it is imperative to express the consumption and production of different compoundsin terms of water consumption,
ζ VV
ζVV
ζVV
= dd
, =dd
, =ddcw
c
wgw
g
wCHw
p
w (3)
These ratios represent the volumes of the consumed or produced compound m per unit volume of consumed water. The rates ofconsumption of reactants and formation of hydration products depend strongly on the temperature at which the hydration occurs.To this end, the transition state theory presents a time rescaling relation that relates the time increment at temperature T, td , to thetime increment at the reference temperature T0, td 0, as follows,
t ER T T
td = exp − 1 − 1 da
00
⎛⎝⎜
⎛⎝⎜
⎞⎠⎟
⎞⎠⎟ (4)
where T0, Ea and R are, respectively, the reference temperature (293 K), activation energy at the reference temperature, anduniversal gas constant.
3. Transport through a spherical C-S-H shell
Fig. 2 illustrates the hydration reaction stages from the setting time up to centuries.Because of complexity of the hydration reaction, simplifying assumptions are necessary. After an initial period tΔ 1 of about 4–
24 h, a complete spherical barrier shell of C-S-H surrounding the remnant of anhydrous cement grain can exist, and is considered inthe present analysis to persist for decades and centuries in duration. For simplicity, a fictitious ‘equivalent shell’ is here assumed toexist even during tΔ 1, beginning with the time of set (t=0). It should be noted that the idealization of bio-material interactions byconcentric spheres and surrounding shells has been used in many studies of composites. In Bary and Béjaoui (2006), it was used tomodel the macroscopic diffusion through concrete.
In reality, the initial hydration, which is very fast, creates separate growing nano-scale globules of C-S-H clustered around thecement grain, which fuse at the end of tΔ 1 into a continuous shell. Since the initial rate of hydration around the separate nano-globules is faster than predicted for the barrier shell, the inward transport of water through the shell toward the reaction interface ofC-S-H with the remnant of anhydrous cement grain may initially (during tΔ 1) be characterized by an increased effective diffusivity,Dh. The gradual decrease of effective Dh as a function of the hydration degree reaches the actual diffusivity at the end of tΔ 1 (see thenext Section 4).
If a continuous barrier shell exists (hydration stages (d) and (e) in Fig. 2), the hydration kinetics is controlled by radial inwardwater diffusion through the porous C-S-H barrier, which is here assumed to occur uniformly over the shell. Let the shell thickness bez a− , where a is the decreasing radius of anhydrous cement grain particle and z is the growing outer radius of the shell surface(Fig. 3). Assuming spherical symmetry, the velocity of the inward radial diffusion of water may be written as:
v r Dpr
( ) =ddw h
v(5)
where r=radial coordinate and Dh=diffusivity. It should be noted that this water transport is a combination of both water vapordiffusion that follows Fick's law and water flow that obeys Darcy's law. The diffusion equation governing this transport is of a formpresented in Bažant and Najjar (1972).
It is instructive to express the aforementioned transport formulation in terms of the pore relative humidity h (often called‘humidity’, for the sake of brevity);
hpp
= v
sat (6)
Table 1The molar volume and density of calcium-silicate phases present in the cement paste.
Phase Molar volume ( mc /mol3 ) Density (g/ mc 3)
C S3 72.9 3.15C S2 52.5 3.28H O2 18.0 1.0C−S−H 110.1 2.05CH 33.1 2.24
S. Rahimi-Aghdam et al. J. Mech. Phys. Solids 99 (2017) 211–224
214

where pv=partial pressure of water vapor and psat=saturation vapor pressure, which greatly increases with T. Although,fundamentally, the diffusion of water through the shell is driven by the gradient of chemical potential of pore water, μ, it will beconvenient to replace μ with the equivalent humidity h, even though water vapor exists neither in the C-S-H shell nor at the interfacewith the anhydrous cement. So we define:
h e= μ M RT( −μ / )0 (7)
where μ0=chemical potential of water at saturation, and M=molecular weight of water=18.02 g/mol. Inside the C-S-H shell, μ is thechemical potential of the adsorbed water (free or hindered) in the nanopores. Eq. (5) now takes the form:
v B dhdr
B D p= , =w h sat (8)
Fig. 2. The schematics of a five-stage idealized thought model of cement hydration that combines transport and boundary nucleation growth mechanisms. (a)formation of a semi-impermeable layer around cement particles during the dormant period, (b) a symmetric nucleation of a constant number of C-S-H particles onthe surface of cement particles, (c) an isotropic and self-similar growth of C-S-H nuclei with spatially constant but time varying growth rate, (d) overlapping ofgrowing C-S-H nuclei and the coverage of the entire surface with hydrates which terminates the nucleation-growth process, (e) the uniform growth of C-S-H particlesthat is controlled chiefly by the inward transport of water and the outward diffusion of ions to the solution.
Fig. 3. Transport through spherical shell.
S. Rahimi-Aghdam et al. J. Mech. Phys. Solids 99 (2017) 211–224
215

where B is the effective diffusivity (dimension m2/s). Based on assuming incompressibility of diffusing water, the radial discharge,Qw, or volume flow rate, is uniform for all radial directions and is
Q A r v r πr B h rr
= ( ) ( ) = 4 d ( )dw w
2(9)
which is a first-order ordinary differential equation. Its solution reads,
h r QπrB
C( ) = −4
+w(10)
where C is the integration constant, which can be determined from the boundary conditions.The first boundary condition at the interface r=a of C-S-H with the remnant of anhydrous cement grain is,
h a h( ) = c (11)
where hc is the equivalent humidity at the interface of C-S-H shell with the anhydrous cement. As an approximation, probably a goodone, we may consider that hc=0.78 for T C= 20° , which is believed to be the humidity below which the hydration reaction does notproceed. Note that this value of hc might be different for concretes with some special admixtures, such as the silica fume (SF); seeBaroghel-Bouny et al. (1999) who showed in 1999 that, for SF, hc can be as low as 0.60.
The second boundary condition, at r=z, is h z h( ) = p=pore relative humidity. Substituting both boundary conditions into Eq. (10),we get:
Q πaBh h
az
Ch h a
zaz
= 4⟨ − ⟩
1 −, =
−
1 −w
p cp c
(12)
where x x⟨ ⟩ = max( , 0) serves to give Qw=0 when h h<p c. Then, inserting this into Eq. (10), we obtain the relative humidity profile interms of dimensionless quantities:
h r
ra
h rz
h h h
ra
rz
( ) =− − (⟨ − ⟩)
−
p c p c⎛⎝⎜
⎞⎠⎟
⎛⎝⎜
⎞⎠⎟ (13)
4. Effective diffusivity model
In the initial hydration period of one day or less, two stages of different kinetics can be distinguished (for a comprehensivediscussion, see, e.g., Bullard et al. (2011)). The first stage is a short ‘dormant’ period right after the time of set, having the duration ofa few hours. Second comes the stage of nucleation and growth of nano-globules of C-S-H. They are necessarily disconnected. Thereason: since the C-S-H molecules have an effective diameter of 5–50 nm, a continuous shell, obviously, cannot form until thevolume of all the C-S-H globules becomes sufficient to fill a continuous shell of that same thickness (Fig. 4). The hydration degree αat which this occurs is called the critical hydration degree, αc. It is typically attained within the first day (in Section 5, an empiricalequation for αc will be proposed). For α α> c, a continuous barrier shell of C-S-H exists and grows.
The initial behavior just described obviously cannot be predicted with the radial spherical transport of water. Nevertheless, thediffusivity in this model can be adjusted and calibrated as a function of the hydration degree αc, so as to match the volume growth ofthe nano-globules. In other words, instead of modeling the two initial hydration stages in detail, we consider an equivalent fictitiousbarrier giving the same radial water flux and the same growth of α as the nano-globule growth.
Fig. 4. A schematic representation of spherical (homogeneous) hydration.
S. Rahimi-Aghdam et al. J. Mech. Phys. Solids 99 (2017) 211–224
216

Based on the one-dimensional transport model in Eq. (12), the water discharge for one cement particle is,
Q πa z B α hh hz a
= 4 ( , )−−t t t eff p
p c
t t
1
(14)
where, for brevity, z z t= ( )t , a a t= ( )t , and Beff=effective diffusivity, which is a function of the hydration degree and the inter-particlepore humidity. Assuming both functions to be independent, we can write,
B B f h f α= ( ) ( )eff p0 0 4 (15)
where B0 is an unknown constant. In the present simulations we consider B = 1.0·10 m /day0−11 2 for alite specimens and
B = 1.1·10 m /day0−11 2 for cement specimens. It should be noted that these values are significantly lower than the diffusivity values
for whole concrete specimens (10−6m2/day for saturated concrete). The lower diffusivity for C-S-H shell barrier compared to thewhole concrete sample can be explained by the fact that the C-S-H shell barrier includes C-S-H with small gel porosity and almost nocapillary pores. In addition, the gel barrier may include some dense and ordered C-S-H gel with very low diffusivity for the transportof water. Furthermore, in the transport through barrier case, the relative humidity has a significant effect on reducing the diffusivitysince near the anhydrous cement the relative humidity is lower and, as shown by Bažant and Najjar (1972), the diffusivity may besignificantly lower. Function f α( )4 describes the dependence of B on the hydration degree, and is assumed as follows:
f α γe γ αα
α α( ) = , = for ≤ *γ
max
m
4−
⎛⎝⎜
⎞⎠⎟ (16a)
f α β α e β α α α α α α α( ) = ( / ) , = − * + * / for > *sm β α
s max4( / )c m
(16b)
Here αmax=hydration degree at which the diffusivity reaches its maximum, and α α= /2max c where αc is the critical hydration degree,defined here as the hydration degree at which the C-S-H barrier around the cement particle gets completed (typically about 24 h ).Constants α*, m and αs are empirical and are considered as α α* = 1.5 max, m=2 for alite samples and m=1.8 for cement samples, andα = 0.3s . Note that α α α α α− * + * /s max is used in Eq. (16b) instead of α, for f4 to be continuous.
The expression for f α( )4 gives an increasing water discharge rate until the hydration degree reaches αmax, and a decreasing rateafterwards. The start of f α( )4 from a small value can be explained by the metastable barrier hypothesis (Stein and Stevels, 1964;Jennings and Pratt, 1979; Jennings, 1986; Gartner and Gaidis; Bullard, 2008; Bullard et al., 2011) or the slow dissolution stephypothesis (Barret and Ménétrier, 1980; Barret et al., 1983; Garrault and Nonat, 2001; Damidot et al., 2007; Garrault-Gauffinet andNonat, 1999; Bullard et al., 2011). The gradual decrease of f α( )4 after αmax is explained by the filling of gel pores with hydrationproducts (Powers and Brownyard; Halamickova et al., 1995).
It should be noted that the considered diffusivity function is in agreement with recent NMR results by Königsberger et al. (2016)for evolution of C-S-H density and porous structure. These recent NMR data show that the density of C-S-H initially decreases up toαmax and later increases. This is exactly the same kind of behavior as considered here for diffusivity of C-S-H barrier.
Now that we can calculate the total water discharge, we need to analyze the evolution of hydration degree and pore humiditychange. For the sake of simplicity, we express the volume of each component or phase as a fraction of unit volume of concrete; so,V V V, ,w c a are the volume fractions of water, cement and aggregate per unit volume of concrete and are dimensionless numbers suchthat
V V VV ρV ρ
w cV ρV ρ
a c+ + = 1(m /m ), = / , = /w c aw
wc
c
aa
cc
0 0 03 3 0
0
0
0 (17)
where w c a c/ , / =water-cement and aggregate-cement ratios (by weight); ρw, ρc and ρa are, respectively, the specific mass of water(1000 kg/m3), cement (here considered as 3150 kg/m3), and aggregates (here 1600 kg/m3, for gravel and sand combined). Thecorresponding relative volumes are
Vρ ρ
ρ ρ ρ ρ a c ρ ρ w c=
+ / + /c a w
a w c w c a0
(18a)
Vρ ρ a c
ρ ρ ρ ρ a c ρ ρ w c=
/+ / + /
a c w
a w c w c a0
(18b)
Vρ ρ w c
ρ ρ ρ ρ a c ρ ρ w c=
/+ / + /
w a c
a w c w c a0
(18c)
The number of cement particles, ng, per unit volume of cement, is obtained from the volume of cement and the particle size, a0:
nVπa
=g
c0
43 0
3(19)
The initial volumes of different phases at the time of set may be expressed as
V α V V ζ α V V ζ α V= (1 − ) , = , =setc
setc
setCH
CHc setc
setg
gc setc
0 0 0 (20)
where αset=hydration degree at the time of set, which is approximately related to the end of the dormant period; ζCHc=volume of
S. Rahimi-Aghdam et al. J. Mech. Phys. Solids 99 (2017) 211–224
217

portlandite per unit volume of consumed cement; ζ ζ ζ= /CHc CHw cw where the ζgc value is the same as it is for the C-S-H gel, i.e.,ζ ζ ζ= /gc gw cw. At the time of set, the radius of cement particles aset and radius of C-S-H barrier zset may be calculated as,
aVπn
zV V
πn= , =
+set
setc
gset
setc
setg
g43
13
43
13⎛
⎝⎜⎜
⎞
⎠⎟⎟
⎛
⎝⎜⎜
⎞
⎠⎟⎟
(21)
Having all the necessary parameters at hand for the time of set, we calculate finite increments to track the evolution of statevariables throughout the hydration process. The incremental, Vd g, and total, Vt t
g+d , volumes of C-S-H gel produced during td can be
calculated as,
V V V V n Q ζ t= + d = − dt tc
tc
tc
tc
g t cw+d1 (22a)
V V V V n Q ζ t= + d = + dt tg
tg
tg
tg
g t gw+d1 (22b)
V V V V n Q ζ t= + d = + dt tCH
tCH
tCH
tCH
g t CHw+d1 (22c)
where V V t= ( )t , etc., and ζcw, ζgw and ζCHw are, respectively, the volumes of the cement consumed, the C-S-H gel produced andthe portlandite produced per unit volume of discharged water, all defined in Section 2.
The radius and the hydration degree of the cement particles can be updated from the amount of reacted cement, dVtc;
a a a aπa n
V= + d = + 14
dt t t t tg
tc
+d02 (23a)
α α α απa n
V= + d = − 34
dt t t t tg
tc
+d03 (23b)
Although a sparse solid framework with very limited continuity develops already at the time of set, it is at first so sparse that mostC-S-H barriers surrounding cement particles are too thin to contact each other. Soon, however, more barrier shells touch and later,as the number of contacting shells and their contact areas grow, the ratio of overall free shell surface relative to the square of radiusdiminishes.
Let z be the radius of contact-free shells giving the same free surface area as the actual shell radius z would if the shell surfaceswere free. Exact calculation of z would be complicated but a good approximate formula can be obtained by asymptotic matchingbecause the opposite asymptotic conditions are clear and simple: 1) z z= and z zd /d = 1 for z a= 0, and 2) z zd /d = 0 for large enoughz. These asymptotic conditions can be most simply satisfied by the function:
z zz a
u
=1 + −
22
02⎛
⎝⎜⎞⎠⎟ (24)
where u=constant that may be set as a /100 . Note that the growth of z is theoretically limited by two finite bounds: 1) For low enoughw c/ and large enough cement grains, z could in theory reach the value of zmax for which the volume of all the spherical cement grainswith barrier shells per unit volume of cement paste (without discounting shell overlaps) would be equal to all the pore space withinthe unit volume, i.e.,
z V aπn
= (1 − )4max a
g
2
(25)
where ng=number of cement grains with barrier shells per unit volume, and Va=volume fraction of all aggregates. 2) For smallenough cement grains and large enough w c/ , the cement could hydrate completely, with no anhydrous cement left. In that case,
z V ζπn
= 34max
cgc
g
30
(26)
where V0c=initial volume fraction of anhydrous cement and ζ ζ ζ= /gc gw cw=volume of C-S-H gel produced per unit volume of cement.
One could adjust Eq. (24) to conform to these theoretical bounds. But it is not necessary because: 1) when the volume of all thegrains with barrier shells equals the original pore space, the present model indicates no water to remain and thus the hydration, withthe growth of z , to stop, and 2) the model also indicates the hydration to stop when all the cement gets hydrated.
If z is known, the increment of radius z during time step t t t( , + d ) may be calculated as,
zV V
πzα αd =
d + d4
for >ttg
tc
t c2 (27)
At this stage the only unknown parameter is the inter-particle pore humidity at the end of each time step, ht tp+d . To find the humidity
changes in inter-particle capillary porosity, we rely on the increment of saturation degree, Sip. To relate the saturation degree to therelative humidity, we use the desorption isotherm. To this end, we begin with calculating the total inter-particle water content, Vip
w,and its increment. Noting that the increment of Vip
w should be equal to the incremental total water that diffuses through C-S-H gel,we have
S. Rahimi-Aghdam et al. J. Mech. Phys. Solids 99 (2017) 211–224
218

V ϕ S V ϕ S ϕ S n Q t= , d = d + d = − dipw ip ip
ipw
tip
tip
tip
tip
g t1
(28)
The desorption isotherm, which relates the water saturation degree to the pore relative humidity, may be written as,
h K S h K S(1 − ) = (1 − ), d = dp h tip
p h tip (29)
where Kh is the isotherm slope. The slope depends highly on the water-to-cement ratio, curing conditions and hydration degree ofthe cement paste. Here we limit attention to humidity levels higher than 78% and assume the isotherm slope to be constant, i.e.,K w c w c( / ) = 1 − /h . Combining Eqs. (28) and (29), we derive the humidity increment,
dh Kn Q t ϕ S
ϕ=
− d − dtp
hg t t
iptip
tip
1⎛⎝⎜⎜
⎞⎠⎟⎟
(30)
where ϕd tip is the inter-particle porosity increment (a decrement) calculated as
ϕ V V Vd = −(d + d + d )tip
tg
tCH
tc
(31)
To evaluate Eq. (2d) and subsequently the volumetric ratios in Eq. (3), we need the saturation degree of Kelvin dominated poresinside the gel, SKp. For simplicity, we consider the saturation degree to be equal to the saturation degree in inter-particle pores.
So far, we have not yet considered the variation of diffusivity during hydration. Previous studies have indicated that a decrease ofhumidity strongly reduces the diffusivity of cement paste (Bažant and Najjar, 1972). We model this effect by function f0 in Eq. (15).Using Bažant and Najjar's equation (Bažant and Najjar, 1972), we may define f0 as
f cchh
= +1 −
1 +1 −1 − *
ff
tp n0 h⎛
⎝⎜⎞⎠⎟ (32)
where h*, nh, cf are empirical parameters and f0 is the functional form. In this study, we set nh=8, h* = 0.88 and cf=0.Our analysis up to now implied all of cement particles to have the same size. In reality, each cement has its own particle size
distribution (PSD). This poly-dispersity may approximately be taken into account by defining the effective cement particle size as thesize for which the same degree of hydration is reached as in the poly-disperse cement. Such an approximation is, in fact, necessaryfor our analysis because the particle size distributions of cements are usually unavailable for the experimental data in literature.Since hydration is a surface-driven reaction, it is rational to consider the effective size as the size that keeps the total surface areaconstant. Therefore, in order to calculate the effective cement particle size, D a= 2eff eff , we first calculate the total surface area of allcement particles, Atot. If we have a mono-disperse cement with radius a, the total surface area is,
A V
πaπa V
a= 4
3
(4 ) = 3totc c
3
2
(33)
Thus, for poly-disperse cement with volume probability distribution function Γ, we have,
∫ ∫A dV aa
Γ a daa
= 3 ( ) = 3 ( )totV
c
ac (34)
Considering the effective size as the size that keeps the total surface area constant, we have
∫∫ ∫
∫A Γ a da
aV
a
Γ a da
aa
Γ a da
Γ a a a= 3 ( ) = 3 =
3 ( ), → =
( )
[ ( )/ ]dtot
a
c
eff
a
effeff
a
a (35)
where aeff is the effective particle radius in terms of the volume probability distribution function.
5. Hydration of mono-disperse systems at different conditions
The critical hydration degree of cement paste, αc, as defined earlier, is the hydration degree at which the C-S-H barrier shellbecomes contiguous and complete. The value of αc at room temperature was shown by Bullard et al. (2015) to be almost equal to thehydration degree at the end of first day. This value is strongly affected by the parameters of cement and concrete and by theenvironmental conditions. It depends on various parameters, including the particle size distribution, water-to-cement ratio andtemperature. These control parameters affect the structure of the nano- and capillary pore networks, as well as the reaction rate.Lacking quantitative experimental or theoretical models for the effects of these control parameters, we propose empirical equations,to be validated later, and assume the effects of these parameters to be independent, as follows:
α α f a f w c f T= ( ) ( / ) ( )c c0
1 2 3 (36)
where αc0 is the calibration constant and f1, f2 and f3 are empirical functions.
Assuming that the thickness of C-S-H gel, dc, forming around the cement particle at the critical hydration degree is independentof the particle size, we can introduce the approximation:
S. Rahimi-Aghdam et al. J. Mech. Phys. Solids 99 (2017) 211–224
219

πa d πa α α da
f a aa
4 ≈ 43
, ∝ → ( ) =c c cc2 3
10
(37)
Here a0 is the reference radius, which is assumed as 6.5 µm when there is no further information about the cement's particle sizedistribution. The last approximation is probably crude. A more accurate formulation to derive αc is:
αd
a α
11 −
= 1 +(1 − )c
c
c13
3⎛⎝⎜⎜
⎞⎠⎟⎟
(38)
but in this case we cannot find a closed-form expression for f1 since the last formulation is nonlinear.To consider the effect of water content ratio, we assume a linear function:
α α m w c f w c mα
w c= + ( / − 0.4) → ( / ) = 1 + ( / − 0.4)c c cc
c
02 0 (39)
where αc0=critical hydration degree at w c/ = 0.4 and mc=1.2=slope that is obtained by fitting the model to measured data on
hydration at different w c/ .Similar to Eqs. (4), we assume that αc follows Arrhenius law:
f T ER T T
( ) = exp 1273 +
− 1273 +
α3
0
⎡⎣⎢
⎛⎝⎜
⎞⎠⎟
⎤⎦⎥ (40)
where Eα is an activation energy. Data fitting gave the value E R/ = 800α . We also constrain the critical hydration degree to be lessthan 0.65. For simplicity, we consider a direct relation between αc and the hydration degree αset at the time of set:
αα
αα
=set
set
c
c0 0 (41)
Here αset0 is the hydration degree at the time of set when the critical hydration degree is αc
0.
6. Predicted hydration curves
Now we use the proposed method to predict the hydration curves under different control parameters. Fig. 5 presents the effect ofparticle size distribution on the hydration degree and on the rate of the heat of hydration for alite systems with the mean particlesizes of 13, 18, 38 and 82 µm which, respectively, correspond to effective particle sizes of 12, 17, 34 and 60 µm. We calibrate themodel for the 13 µm particle size only, and the rest are predictions.
The calibration parameters are α = 0.011set and α = 0.21max and the time of set is considered as 2 h. Fig. 6 shows the effect ofwater-cement ratio on the hydration degree of OPC pastes. For the tests of Danielson (1962) (Fig. 6a), the effective diffusivity modelis calibrated for w c/ = 0.3, and the calibration parameters are α = 0.05set and α = 0.21max . For the tests of Bentz (2006) (Fig. 6b), themodel is calibrated for w c/ = 0.35 and α = 0.04set and α = 0.26max .
Fig. 7 shows the effects of hydration temperature and cement type on the hydration degree. The activation energy and effectiveparticle sizes for cements of Type I to Type III in Fig. 7a-c are, respectively, 4.5*104, 4.5*104 and 5.0*104 J/mol and 12.5, 14 and 9 µm(Lin and Meyer, 2009). The calibration parameters for Type I cement with T=24 ° C are α = 0.05set and α = 0.24max . All the otherresults are predicted. Note that, through all the simulations, the Blaine fineness of cement equal to 350 m2/kg was considered tocorrespond to particle size 13 µm.
Finally note that aeff is different from the average particle radius, am. These two should not be used interchangeably. Here weuse the effective size rather than the average size. For further illustration, we use a set of poly-disperse alite systems with the volumeprobability distribution function given in Fig. 8(a). First we calibrate the present effective diffusivity model with an alite system in
Fig. 5. Examining the predictive power of the effective diffusivity model vs. experimental measurements of Fernandez (2008) on alite phase. (a) Hydration degree,(b-e) The rate of heat of hydration for different particle sizes.
S. Rahimi-Aghdam et al. J. Mech. Phys. Solids 99 (2017) 211–224
220
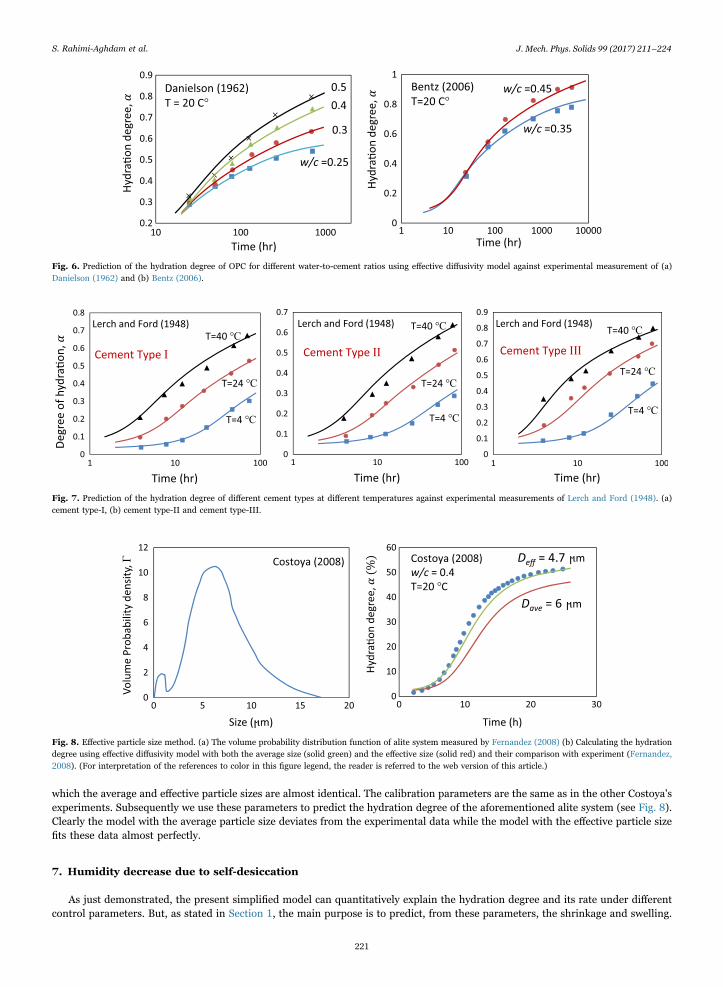
which the average and effective particle sizes are almost identical. The calibration parameters are the same as in the other Costoya'sexperiments. Subsequently we use these parameters to predict the hydration degree of the aforementioned alite system (see Fig. 8).Clearly the model with the average particle size deviates from the experimental data while the model with the effective particle sizefits these data almost perfectly.
7. Humidity decrease due to self-desiccation
As just demonstrated, the present simplified model can quantitatively explain the hydration degree and its rate under differentcontrol parameters. But, as stated in Section 1, the main purpose is to predict, from these parameters, the shrinkage and swelling.
Fig. 6. Prediction of the hydration degree of OPC for different water-to-cement ratios using effective diffusivity model against experimental measurement of (a)Danielson (1962) and (b) Bentz (2006).
Fig. 7. Prediction of the hydration degree of different cement types at different temperatures against experimental measurements of Lerch and Ford (1948). (a)cement type-I, (b) cement type-II and cement type-III.
Fig. 8. Effective particle size method. (a) The volume probability distribution function of alite system measured by Fernandez (2008) (b) Calculating the hydrationdegree using effective diffusivity model with both the average size (solid green) and the effective size (solid red) and their comparison with experiment (Fernandez,2008). (For interpretation of the references to color in this figure legend, the reader is referred to the web version of this article.)
S. Rahimi-Aghdam et al. J. Mech. Phys. Solids 99 (2017) 211–224
221

This requires a realistic prediction of the evolution of humidity profiles throughout the lifetime.Fig. 9 presents the humidity decrease due to self-desiccation as predicted by the present effective hydration model, compared to
the experiments of Jiang et al. (2006), for different water-cement ratios. As it can be seen, there is considerable error in predictingthe hydration degree, especially for the first days of reaction.
The underlying reason for this discrepancy can be our simplifying assumption that the desorption isotherm slope, Kh, remainsconstant during hydration. In fact, as the pore network evolves during hydration, Kh varies over time. Although the effect of thissimplification on the predicted hydration degree is small (less than 1%), it could be significant in calculating the shrinkage ofconcretes with large self-desiccation.
To achieve a better prediction of humidity decrease due to self-desiccation, a non-linear desorption isotherm needs to beconsidered. To this end, having in mind the desorption isotherms measured in various experiments, the following empirical relationfor inverse desorption isotherm slope may be considered,
Km m m1 = + ( − ) 1
1 +h hh
2 1 21 −1 −
3
s
⎛⎝⎜
⎞⎠⎟ (42)
where m1 is the initial slope, m = 12 is the assumed final slope of desorption isotherm and hs is an empirical constant. As transpiredfrom the reported experiments, the initial slope of the desorption isotherm, m1, depends significantly on the water-to-cement ratio.This is described by the empirical formula:
m w c hm
= 1.5 + / − 0.180.15
= 1 − 0.13s1
2
11.3
⎛⎝⎜
⎞⎠⎟ (43)
Fig. 9b shows the predicted desorption isotherms for different w c/ values. As it can be seen, the predicted isotherms are quite close tothe measurements. Using this isotherm, the model predictions for the relative humidity decrease due to self-desiccation can berecalculated; see Fig. 10. Note that the agreement with the measured data gets improved. It may also be mentioned that the use of avariable slope for desorption isotherm leads to a better prediction for the decrease of relative humidity, while the effect on thehydration degree is negligible.
Fig. 9. (a) Humidity decrease due to self-desiccation at different water-to-cement ratios using a linear desorption isotherm; (b) Plots of proposed Eq. (42) fornonlinear desorption isotherm, for different water-to-cement ratios.
Fig. 10. Predicted humidity decrease due to self-desiccation at different water-to-cement ratios using non-linear desorption isotherm for (a) experiment by Jianget al. (2006) (b) experiment by Kim and Lee (1999).
S. Rahimi-Aghdam et al. J. Mech. Phys. Solids 99 (2017) 211–224
222

8. Algorithm for calculation of hydration degree and humidity evolution
1. For the cement paste or concrete with a known water-to-cement w c/ and aggregate-cement a c/ ratios, calculate the initial volumefraction of cement V0
c and water V0w using Eq. (18).
2. calculate the average cement particle size (particle radius) a0 based on the cement type. In this study, the Blaine fineness ofcement equal to 350 m2/kg was considered to correspond to particle radius 6.5 µm. Also, knowing V0
c and a0, calculate thenumber of cement particles, ng, per unit volume of cement using Eq. (19).
3. Based on sample w c/ and temperature T and the effective cement particle size a0, choose a reasonable hydration degree for settingtime, αset, and the time that C-S-H barrier will be completed, αc (critical hydration degree). For a normal cement witha = 6.5μ0 m, w c/ = 0.4 at T C= 20 ° C, α = 0.05set and α = 0.3c are good approximations. For samples with a different T, w c/ andcement type a reasonable value can be calculated using Eqs. (36) to (41). In addition, the sample can be considered saturated atsetting time (h=1, S = 1ip ).
4. Knowing αset, V0c , calculate the volume fraction of cement Vset
c, portlandite VsetCH and gel (C-S-H plus ettrengite) Vset
g.Using Eq. (20), and having these volume fractions, calculate the radius of cement particle aset and the radius of C-S-H barrier zsetusing Eq. (21). For the chemical reaction of hydration, the following volume ratios may be used: ζ = 1.52gc , ζ = 0.59CHc andζ = 1.21wc0 . It should be noted that ζwc can decrease from 1.21 to 1.13 as a function of saturation degree.
5. At each time step, using the hydration degree α and the humidity h from previous step, calculate the water diffusivity Beff usingEqs. (15), (16) and (32).
6. At each time step, using the humidity h, the cement particle size a and the C-S-H barrier size z from the previous time step andalso the calculated diffusivity, calculate the water discharge Qt
1 using Eq. (14).7. At each step, using the calculated water discharge Qt
1, calculate the volume increment of cement Vd tc, portlandite Vd t
CH and gelVd t
g using Eq. (22).8. At each time step, use the calculated Vd t
c to calculate the increment of hydration degree αd t, and cement particle radius ad t usingEq. (23). Also, calculate the increment of gel barrier zd t using Eqs. (24) and (27). In addition, using these increments calculate theupdated values for αt, at and zt.
9. Finally calculate the increment of relative humidity hd tp, saturation degree Sd t
ip and inter-particle porosity ϕd tip using Eqs. (29),
(30) and (31). Also, using these increments calculate the updated humidity, saturation degree and inter-particle porosity. For thesake of simplicity, the desorption isotherm slope may be calculated as K w c= 1 − /h (if the aim is calculating shrinkage, a morecomplex function for desorption isotherm should be considered; see the model by Di Luzio and Cusatis (2009)).
9. Conclusions
1. Long-term cement hydration advancing over decades or even centuries can be explained by the proposed new model in which thehydration rate is controlled by diffusion of water from capillary pores through gradually thickening barrier shells of C-S-H thatenvelop gradually consumed remnants of cement grains.
2. A simple formulation can be obtained by assuming the cross-barrier diffusion to be controlled by a difference in humidity acrossthe barrier, equivalent to the difference in chemical potential of water, while the hydration reaction at the interface of anhydrouscement with the C-S-H barrier is considered virtually immediate.
3. Although, during the first 4–24 h, the C-S-H forms numerous discontinuous nano-globules around the cement grains, a simplemodel can be obtained by introducing and calibrating an equivalent barrier shell control of the hydration rate.
4. After calibration of the proposed model by published data, good agreement is achieved with the measured evolution of hydrationdegree and hydration heat for various cement types, particle size distributions, water-to-cement ratios and temperatures.
5. The decades-long continuation of cement hydration appears to be a hypothesis that can explain why the autogenous shrinkage ofsealed specimens as well as the swelling in water immersion are recently observed to continue logarithmically for at least a decade.
6. Computationally, the model is sufficiently effective for being used as a subroutine for calculating the evolution of hydration degreeor aging at every integration point of every finite element in a large structure.
Acknowledgement
Partial financial supports from the U.S. Department of Transportation, provided through Grant 20778 from the InfrastructureTechnology Institute of Northwestern University, and from the NSF under grant CMMI-1129449, are gratefully appreciated.
References
Baroghel-Bouny, V., Mainguy, M., Lassabatere, T., Coussy, O., 1999. Characterization and identification of equilibrium and transfer moisture properties for ordinaryand high-performance cementitious materials. Cem. Concr. Res. 29 (8), 1225–1238.
Barret, P., Ménétrier, D., 1980. Filter dissolution of C3S as a function of the lime concentration in a limited amount of lime water. Cem. Concr. Res. 10 (4), 521–534.Barret, P., Ménétrier, D., Bertrandie, D., 1983. Mechanism of C3S dissolution and problem of the congruency in the very initial period and later on. Cem. Concr. Res.
13 (5), 728–738.Bary, B., Béjaoui, S., 2006. Assessment of diffusive and mechanical properties of hardened cement pastes using a multi-coated sphere assemblage model. Cem. Concr.
Res. 36 (2), 245–258.Bažant, Z., Najjar, L., 1972. Nonlinear water diffusion in nonsaturated concrete. Matér. Constr. 5 (1), 3–20.Bažant, Z.P., Yunping, X., 1994. Drying creep of concrete: constitutive model and new experiments separating its mechanisms. Mater. Struct. 27 (1), 3–14.
S. Rahimi-Aghdam et al. J. Mech. Phys. Solids 99 (2017) 211–224
223

Bažant, Z.P., Li, G.-H., 2008. Comprehensive database on concrete creep and shrinkage. Acids Mater. J. 105 (6), 635–637.Bažant, Z.P., Hauggaard, A.B., Baweja, S., Ulm, F.-J., 1997. Microprestress-solidification theory for concrete creep. I: aging and drying effects. J. Eng. Mech. 123 (11),
1188–1194.Bažant, Z.P., Hubler, M.H., Yu, Q., 2011. Excessive creep deflections: an awakening. Concr. Int. 33 (8), 44–46.Bažant, Z.P., Jirásek, M., Hubler, M., Carol, I., 2015. RILEM draft recommendation: TC-242-MDC multi-decade creep and shrinkage of concrete: material model and
structural analysis. model B4 for creep, drying shrinkage and autogenous shrinkage of normal and high-strength concretes with multi-decade applicability. Mater.Struct. 48 (4), 753–770.
Bažant, Z.P., Yu, Qiang, Li, Guang-Hua, 2012. Excessive long-time deflections of prestressed box girders. I: record-span bridge in palau and other paradigms. J.Struct. Eng. 138 (6), 676–686.
Bažant, Z., Donmez, A., Masoero, E., Aghdam, S.R. 2015. Intraction of concrete creep, shrinkage and swelling with water, hydration, and damage: Nano-Macro-Chemo, in: Proceedings of the 10th International Conference on Mechanics and Physics of Creep, Shrinkage, and Durability of Concrete and Concrete Structures.
Bažant, Z., Hubler, M., Wendner, R., 2015. Model B4 for creep, drying shrinkage and autogenous shrinkage of normal and high-strength concretes with multi-decadeapplicability, TC-242-MDC multi–decade creep and shrinkage of concrete: material model and structural analysis. RILEM Mater. Struct.
Bentz, D.P., 1997. Three-dimensional computer simulation of Portland cement hydration and microstructure development. J. Am. Ceram. Soc. 80 (1), 3–21.Bentz, D.P., 2006. Influence of water-to-cement ratio on hydration kinetics: simple models based on spatial considerations. Cem. Concr. Res. 36 (2), 238–244.Bentz, D.P., Garboczi, E.J., Digitized simulation model for microstructural development, Ceramic Transactions, 16 pp. 211.Bullard, J.W., 2008. A determination of hydration mechanisms for tricalcium silicate using a kinetic cellular automaton model. J. Am. Ceram. Soc. 91 (7),
2088–2097.Bullard, J.W., Jennings, H.M., Livingston, R.A., Nonat, A., Scherer, G.W., Schweitzer, J.S., Scrivener, K.L., Thomas, J.J., 2011. Mechanisms of cement hydration.
Cem. Concr. Res. 41 (12), 1208–1223.Bullard, J.W., Scherer, G.W., Thomas, J.J., 2015. Time dependent driving forces and the kinetics of tricalcium silicate hydration. Cem. Concr. Res. 74, 26–34.Damidot, D., Bellmann, F., Möser, B., Sovoidnich, T., 2007. Calculation of the dissolution rate of tricalcium silicate in several electrolyte compositions. Cem. Wapno
Beton 12 (74), 2.Danielson, U., 1962. Heat of hydration of cement as affected by water-cement ratio, In: Paper IV-S7, Proceedings of the 4th international symposium on the chemistry
of cement, Washington DC, USA, pp. 519–26.Di Luzio, G., Cusatis, G., 2009. Hygro-thermo-chemical modeling of high performance concrete. i: theory. Cem. Concr. Compos. 31 (5), 301–308, (9).Fernandez, M.M.C., 2008. Effect of particle size on the hydration kinetics and microstructural development of tricalcium silicate (Ph.D. thesis), EPFL, Lausanne.Flatt, R.J., Scherer, G.W., Bullard, J.W., 2011. Why alite stops hydrating below 80% relative humidity. Cem. Concr. Res. 41 (9), 987–992.Garrault, S., Nonat, A., 2001. Hydrated layer formation on tricalcium and dicalcium silicate surfaces: experimental study and numerical simulations. Langmuir 17
(26), 8131–8138.Garrault-Gauffinet, S., Nonat, A., 1999. Experimental investigation of calcium silicate hydrate (CSH) nucleation. J. Cryst. Growth 200 (3), 565–574.Gartner, E.M. Gaidis, J.M. Hydration mechanisms: I, Materials Science of Concrete III, I, 1 pp. 95.Halamickova, P., Detwiler, R.J., Bentz, D.P., Garboczi, E.J., 1995. Water permeability and chloride ion diffusion in Portland cement mortars: relationship to sand
content and critical pore diameter. Cem. Concr. Res. 25 (4), 790–802.Hubler, M.H., Wendner, R., Bažant, Z.P., 2016. Comprehensive database for concrete creep and shrinkage: Analysis and recommendations for testing and recording.
ACI Mater. J. 112 (4), 547–558.Jennings, H., Pratt, P., 1979. An experimental argument for the existence of a protective membrane surrounding Portland cement during the induction period. Cem.
Concr. Res. 9 (4), 501–506.Jennings, H.M., Johnson, S.K., 1986. Simulation of microstructure development during the hydration of a cement compound. J. Am. Ceram. Soc. 69 (11),
790–795, Wiley Online Library.Jennings, H.M., 1986. Aqueous solubility relationships for two types of calcium silicate hydrate. J. Am. Ceram. Soc. 69 (8), 614–618.Jiang, Z., Sun, Z., Wang, P., 2006. Internal relative humidity distribution in high-performance cement paste due to moisture diffusion and self-desiccation. Cem.
Concr. Res. 36 (2), 320–325.Kim, J.-K., Lee, C.-S., 1999. Moisture diffusion of concrete considering self-desiccation at early ages. Cem. Concr. Res. 29 (12), 1921–1927.Königsberger, M., Hellmich, C., Pichler, B., 2016. Densification of C-S-H is mainly driven by available precipitation space, as quantified through an analytical cement
hydration model based on NMR data. Cem. Concr. Res. 88, 170–183.Lerch, W., Ford, C., 1948. Long-time study of cement performance in concrete, In: Journal Proceedings, Vol. 44, pp. 745–796.Lin, F., Meyer, C., 2009. Hydration kinetics modeling of Portland cement considering the effects of curing temperature and applied pressure. Cem. Concr. Res. 39 (4),
255–265.Maekawa, K., Chaube, R., Kishi, T. Modeling of concrete performance: hydration, microstructure formation and mass transport, E and FN SPON, London.Muller, A.C., Scrivener, K.L., Gajewicz, A.M., McDonald, P.J., 2012. Densification of C-S-H measured by 1 h nmr relaxometry. J. Phys. Chem. C. 117 (1), 403–412.Navi, P., Pignat, C., 1996. Simulation of cement hydration and the connectivity of the capillary pore space. Adv. Cem. Based Mater. 4 (2), 58–67.Persson, B., 1998. Self-desiccation and its importance in concrete technology. Nord. Concr. Res. 21, 120–129.Powers, T., Brownyard, T., Studies of the physical properties of hardened Portland cement paste, Bulletin 22.Qomi, M.J.A., Bauchy, M., Ulm, F.-J., Pellenq, R.J.-M., 2014. Anomalous composition-dependent dynamics of nanoconfined water in the interlayer of disordered
calcium-silicates. J. Chem. Phys. 140 (5), 054515.Qomi, M.J.A., Ulm, F.-J., Pellenq, R.J.-M., 2015. Physical origins of thermal properties of cement paste. Phys. Rev. Appl. 3 (6), 064010.Stein, H., Stevels, J., 1964. Influence of silica on the hydration of 3 CaO, SiO2. J. Appl. Chem. 14 (8), 338–346.Taylor, H.F., 1997. Cement chemistry. Thomas Telford 2.Ulm, F.-J., Constantinides, G., Heukamp, F., 2004. Is concrete a poromechanics materials?A multiscale investigation of poroelastic properties. Mater. Struct. 37 (1),
43–58.Van Breugel, K., 1991. Simulation of hydration and formation of structure in hardening cement-based materials. TU Delft, Delft Univ. Technol..Wendner, R., Hubler, M.H., Bažant, Z.P., 2015. Statistical justification of model B4 for multi-decade concrete creep using laboratory and bridge databases and
comparisons to other models. Mater. Struct. 48 (4), 815–833.
S. Rahimi-Aghdam et al. J. Mech. Phys. Solids 99 (2017) 211–224
224