Effect of Perched Water Conditions in MSW Landfills ...
79
Effect of Perched Water Conditions in MSW Landfills: Considerations for Landfill Operators Timothy Townsend Department of Environmental Engineering University of Florida ESD 17 th Annual Solid Waste Technical Conference East Lansing, Michigan April 4, 2006
Transcript of Effect of Perched Water Conditions in MSW Landfills ...

Effect of Perched Water Conditions in MSW Landfills:
Considerations for Landfill Operators
Timothy Townsend Department of Environmental Engineering
University of Florida
ESD 17th Annual Solid Waste Technical ConferenceEast Lansing, Michigan
April 4, 2006

Motivation
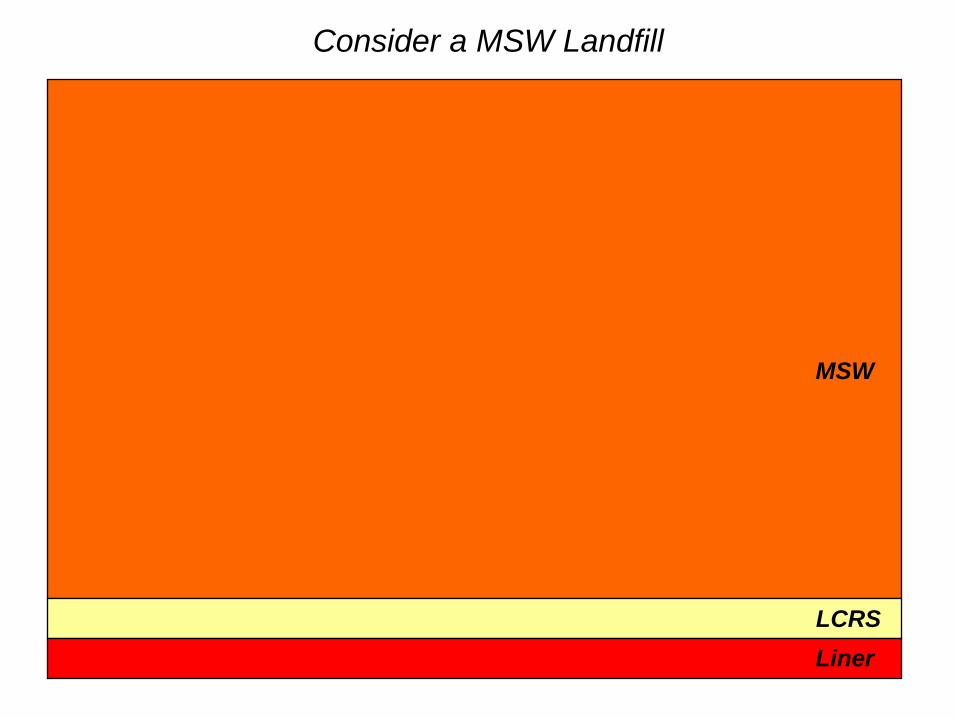
• A common observation at solid waste landfills is the possible presence of saturated waste layers in the deeper parts of landfills.
• The presence and cause of these saturated layers can be interpreted differently.
• The question that we asked: “what should one expect?”

LCRSLiner
MSW
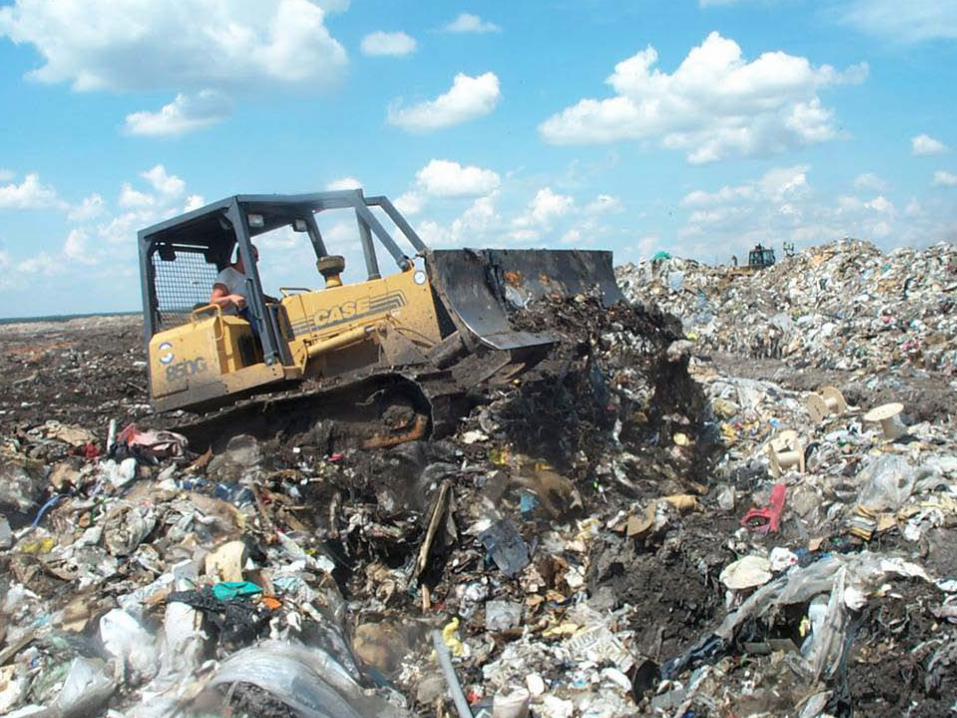
Consider a MSW Landfill

Install Gas Wells
LCRSLiner
MSW
Consider a MSW Landfill

LCRSLiner
MSW
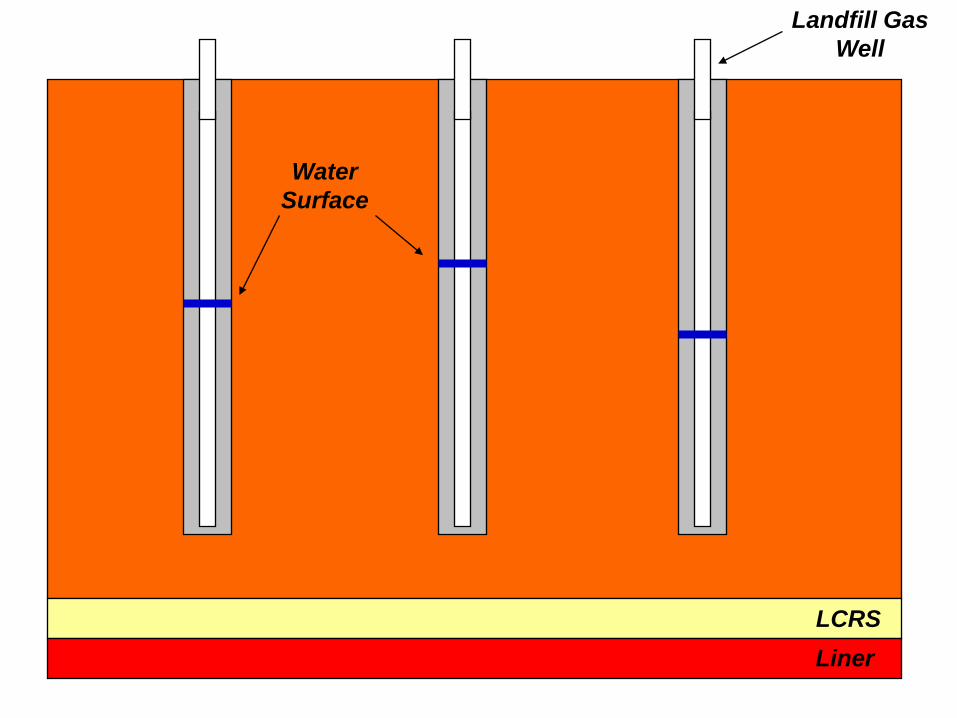
Landfill GasWell

LCRSLiner
Landfill GasWell
WaterSurface

Implications of Perched Water
• Problems with gas recovery?
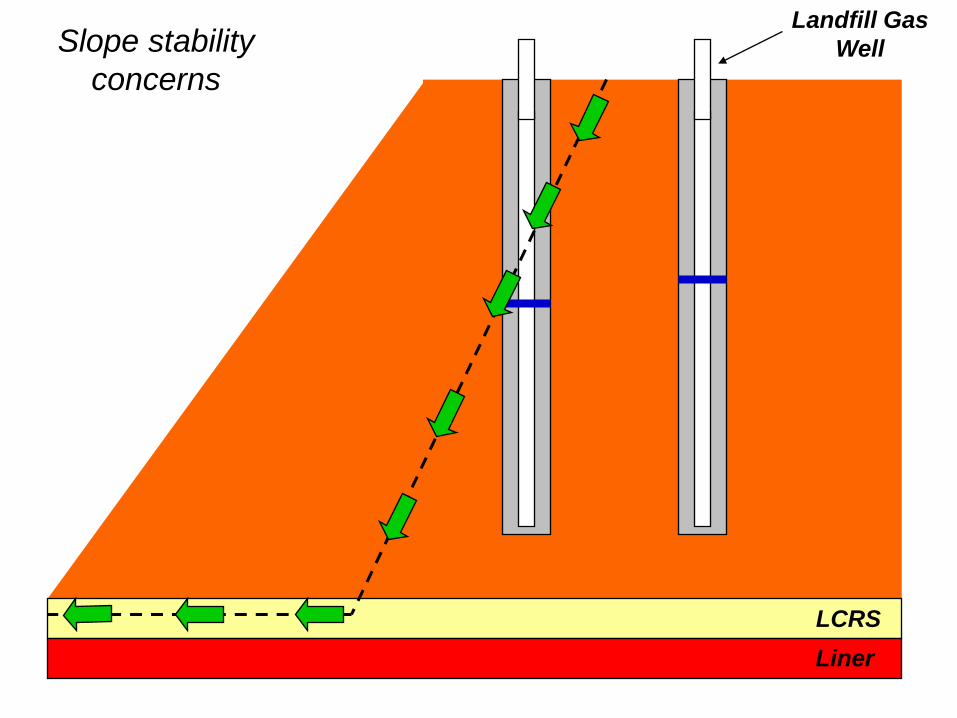
• Slope stability concerns?
• Leachate collection system problems?
• Future side slope seepage issues?

Landfill gas well equipped with liquidpumping system

Pump repairand maintenance

LCRSLiner
Landfill GasWellSlope stability
concerns

LCRSLiner
Landfill GasWellSlope stability
concerns
LCRSLiner
Landfill GasWellSlope stability
concerns

The implications of the perched liquids depend on their true nature
within the landfill
LCRSLiner
Landfill GasWell
WaterSurface

LCRSLiner
Landfill GasWell
Phreaticsurface

LCRSLiner
Landfill GasWell

LCRSLiner
Landfill GasWellSlope stability
concerns

LCRSLiner
Landfill GasWellSlope stability
concerns

LCRSLiner
Landfill GasWellSlope stability
concerns

Let’s examinethe scenario where only
waste around the well is saturated
Some source of water is added to the well at a rate greater that it can drain out. Possible sources:
• Gas condensate• Perched zones of
leachate in the landfill• Short circuiting from
liquids addition

Gas Well

Soil Layer
PerchedLiquids


Flow1 Flow2 Flow3
Vertical Injection Wells at New River Regional Landfill


Modified Version of Richard’s Equation
( )t
St
C
kz
kz
Krr
kKr
kr
K
s
zr
r
∂∂
+∂
∂=
=
+
∂∂
∂∂
+∂∂
+
∂∂
∂∂
ψψψ
ψψψ
Richard’s equation was solvedusing a USGS program called
SUTRA

r0 5 10 15 20
z
0
5
10
15
20
S=1
S=0.2

r0 5 10 15 20
z
0
5
10
15
20
ψ=0
ψ=2 m
ψ=4 m

r (ft)0.0 1.0 2.0 3.0 4.0
z (ft
)
0
10
20
30
0 ft1 ft2 ft3 ft4 ft5 ft
Simulation Parameters
K = 10-5 cm/sec
Q = 17 gallons/day
Duration of Moisture Addition = 10 days
Head in the well ~ 8 ft

LCRSLiner
Landfill GasWell
Phreaticsurface

• If the liquids are added to the landfill at a rate greater than the hydraulic conductivity, saturated conditions will result
Let’s examinethe scenario where saturated conditions will develop in the
landfill even if barrier layers are not present

Consider a Liquids Infiltration Pond
• The waste underneath the pond will become saturated
• In the absence of cover soil layers, a saturated zone will extend to the leachate collection system

LCRSLiner
MSW
Consider a MSW Landfill with an Infiltration Pond

LCRSLiner
MSW
Consider a MSW Landfill with an Infiltration Pond

LCRSLiner
Consider a MSW Landfill with an Infiltration Pond
h
d
ddhi +
=

LCRSLiner
MSW
Consider a MSW Landfill with an Infiltration Pond

LCRSLiner
MSW
Consider a MSW Landfill with an Infiltration Pond

LCRSLiner
MSW
Consider a MSW Landfill with an Infiltration Pond
WaterLevel

Can saturated conditions develop if the liquids are added at a rate less than the permeability of the waste?
• Yes, if the permeability of the waste is reduced with depth
DecreasingPermeability

Col 21 vs Col 22
Density (t/m3)
0.60 0.65 0.70 0.75 0.80 0.85 0.90 0.95 1.00
Hyd
raul
ic C
ondu
ctiv
ity (m
/sec
)
10-8
10-7
10-6
10-5
10-4
10-3
At ~1400 pcyK = 8x10⁻⁵ cm/sec

Air permeability of waste at NRRL at different depths
Air Permeability, k (X10-12 m2)
<0.1
0.1-
2.5
2.5-
5.0
5.0-
7.5
7.5-
10.0
10.0
-12.
5
12.5
-15.
0
15.0
-17.
5
17.5
-20.
0
20.0
-22.
5
22.5
-25.
0
>25.
0
Num
ber o
f Loc
atio
ns
0
3
6
9
12
15

Air Permeability, k (X10-12 m2)
<0.1
0.1-
2.5
2.5-
5.0
5.0-
7.5
7.5-
10.0
10.0
-12.
5
12.5
-15.
0
15.0
-17.
5
17.5
-20.
0
20.0
-22.
5
22.5
-25.
0
>25.
0
Num
ber o
f Loc
atio
ns
0
3
6
9
12
15
Air permeability of waste at NRRL at different depths

Air Permeability, k (X10-12 m2)
<0.1
0.1-
2.5
2.5-
5.0
5.0-
7.5
7.5-
10.0
10.0
-12.
5
12.5
-15.
0
15.0
-17.
5
17.5
-20.
0
20.0
-22.
5
22.5
-25.
0
>25.
0
Num
ber o
f Loc
atio
ns
0
3
6
9
12
15
Air permeability of waste at NRRL at different depths

Bottom Liner
Compacted MSW
Leachate Collection System
27 Gpd K=10-4 cm/s
K=5X10⁻⁵ cm/s
60 ft

Pressure (ft of w.c.)
-8 -6 -4 -2 0 2 4 6 8
Dep
th (f
t)
0
10
20
30
40
50
60

Simulation Parameters
Decreasing K = 10-5
cm/sec (top) to 5X10⁻⁶
cm/sec (bottom at 60 ft deep)
Q = 8.5 gallons/day
Duration of Moisture Addition = 10 days
Head in the well ~ 5 ft
r (ft)0.0 1.0 2.0 3.0 4.0
z (ft
)
0
10
20
30
0 ft1 ft2 ft3 ft4 ft

Review
• The existence of standing liquids in gas wells in landfills does not necessarily result from a phreatic liquid surface in the landfill.
• Liquids added to wells as a result of perched layers in the landfill, gas condensate or other sources can result in relatively large depths of water in the well.

Review
• The decreasing permeability of landfilled waste with depth should have impact.
• Saturated waste conditions may be present, but the pressure of this water may not be accurately reflected by the depth of water that would be measured if a well was installed.
• At large liquid addition rates, saturated conditions in deeper layers may develop.
Implications
• The presence of liquids in gas wells in “dry” landfills should not automatically assumed to represent a phreatic surface.
• In “wet” landfills, the liquid levels in wells may result from both situations.
• When evaluating slope stability, careful thought must be given to the pressures that truly occur.
• Leachate collection systems need to be designed and operated correctly.

New Experiment in FloridaBury piezometers in waste
vertical well and horizontal trench

25’ Between Wells
Well #1 Well #2
10’
VW Piezometer Well
Injection Wells
5’
Current Bioreactor

MSW
10’
5’
20’
30’
40’
VW piezometers
Data Station
Injection Well #1
Cover Soil
10’
20’
35’
Injection Well #2

Piezometer
• Is an instrument to measure pressure– Specifically, the Water Pressures within the
Pores caused by Recirculating Leachate
Installed inCotton bagswith moist sand

Injection line Cross-SectionVibrating Wire Peizometer Grid


Data logger for transducersinstalled in the summer
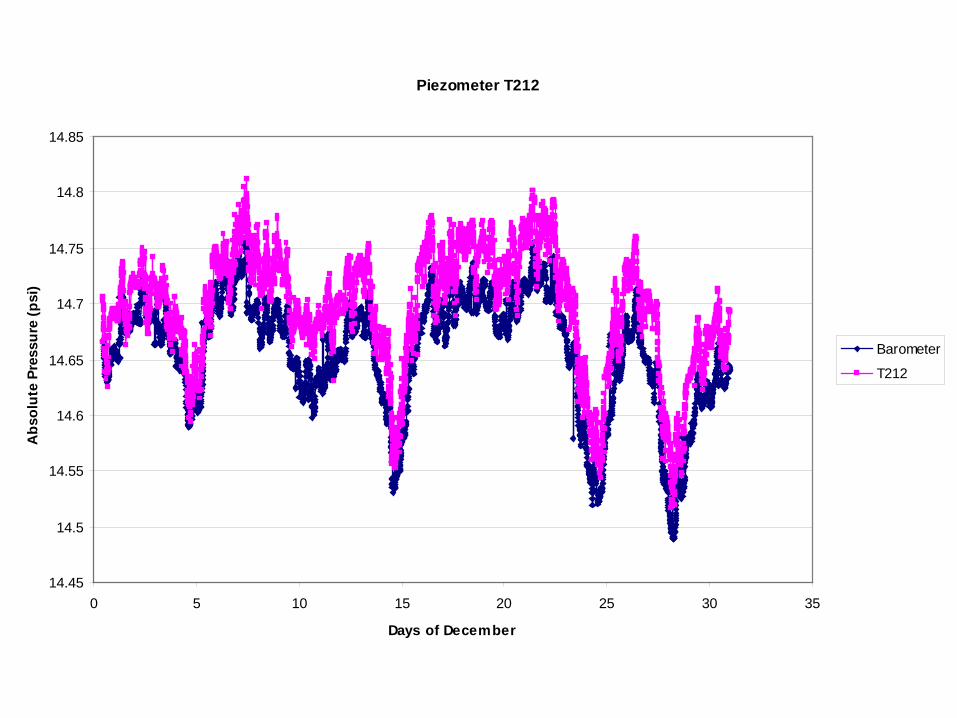
Piezometer T212
14.45
14.5
14.55
14.6
14.65
14.7
14.75
14.8
14.85
0 5 10 15 20 25 30 35
Days of December
Abs
olut
e Pr
essu
re (p
si)
Barometer
T212

Bioreactor Research in Florida
• Leachate recirculation has been practiced in Florida since the 1980s
• Researchers are currently involved with bioreactor activities at multiple landfills

New River Regional Landfill
Alachua CountySouthwest Landfill
Polk CountyNorth Central Landfill


InstrumentedWell Field


C&D Debris Issues

Crush and Load Gypsum Drywall

Install Gas Distribution System

Fine concrete
3% Ca(OH)2
1% Ca(OH)2
Sand
Compost
10% CaCO3
Testing Plots
Sampling Tubes
Fine concrete
3% Ca(OH)2
1% Ca(OH)2
Sand
Compost
10% CaCO3
Testing Plots
Sampling Tubes

Jerome Meter
Flux Chamber
Thermometer
Flow Meter
N2 Gas

EWaste Impacts on Landfills


Cell Phones