Laboratory Study of Color Stability of Different Types of ...
INTRODUCTION
Photo-activated resin composites are commonly used as restorative materials in dentistry for both anterior and posterior restorations and can be bonded to dentin or enamel tissues. The degree and depth of conversion of composite resins that cure under visible light depends on the components of the material (organic matrix, type and volume of the organic filler and the size of filler particles) and on the intensity and duration of exposure to blue light. The degree of conversion (DC) is a measure of the carbon double bonds converted into single bonds1).
Several methods have been reported for studying the DC of composite resins. These include evaluation of hardness2), optical microscopy3) and vibrational methods, i.e. infrared spectroscopy (Fourier Transform Infra Red)4) and Raman spectroscopy (Raman)5). Adequate polymerisation is necessary to achieve optimal mechanical and optical properties6).
Discoloration is a significant aesthetic problem for direct tooth-colored restorations. The shades of both chemical- and light-cured composite resins have been reported to change over time due to extrinsic or intrinsic discoloration7). Changes in color can be attributed to intrinsic discoloration due to physicochemical reactions in the deep portions of the restoration and extrinsic discoloration due to accumulation of plaque and stains8).
In the light-cured composite resins that are currently used, changes in color are usually related to extrinsic factors and depend on several factors, such as the staining agent9), the surface roughness10), contact
time with or immersion in coloring environments11) and the type of composite resin used7). Previous studies of color stability have shown that beverages, such as coffee, tea, red wine, and cola, as well as mouth rinses, can cause staining of chemical and light-cured composite resins to varying degrees. The staining potential of these beverages and solutions varies according to their composition and properties12).
Nanotechnology-based composites are now being used to provide a higher DC compared to Microhybrid resin composites. Recently, nanofill composite materials have been developed. These materials use sub-micrometre particles (nanofillers) to further enhance the optical and physical properties of the resins13).
The aim of this study was to evaluate the effect of different staining solutions on the color stability of Nanocomposites compared with Microhybrid resin and to evaluate their degree of conversion. Two null hypotheses were evaluated: (1) Nano composites with a higher degree of conversion have better color stability compared to Microhybrid composites; and (2) Nanohybrid resin composites (Grandio Nano) are more color stable than Microhybrid (Arabesk Top).
MATERIALS AND METHODS
MaterialsTwo types of light-cured resin composite restorative materials and two different shades of each (A2 and A3.5) were used in this study (Table 1). The two materials investigated were a microhybrid composite (Arabesk Top, Lot No. 0925121, Voco, Germany; AT) and nanocomposite (Grandio Nano, Lot No.1010431, Voco, Germany; GN).
Effect of different beverages on the color stability and degree of conversion of nano and microhybrid compositesAbdul Aziz Abdullah Al KHERAIF1, Sayed Saad Bin QASIM1,2, Ravikumar RAMAKRISHNAIAH1 and Ihtesham ur REHMAN2
1 College of Applied Medical Sciences, Dental Biomaterials Research Chair, Department of Dental Health, King Saud University, Riyadh 11433, P.O Box 10219, Kingdom of Saudi Arabia
2 University of Sheffield, Kroto Research Institute, Materials Science and Engineering Department, Sheffield, South Yorkshire, S3 7HQ, UKCorresponding author, Sayed Saad Bin QASIM; E-mail: [email protected], [email protected]
This study sought to evaluate the effects of different staining solutions on the colour stability of nanocomposites compared with micro hybrid resin and to evaluate the degree of conversion of these two materials. Two different shades of two different composites were cured in polytetraflouroethylene disk rings. Coffee, tea and cola drinks were used as staining solutions, and distilled water was used as a control. Data were statistically analysed using a paired T-test with a significance level of 5%. Nano composite showed the highest degree of conversion (DC) values based on calculation of the bonded and free carbonyl peak intensities in the spectrum. The colour analysis showed that nanohybrid had the highest ΔE values when exposed to coffee solutions; they showed less color stability despite having a higher degree of conversion. Nano resin composite showed significantly higher discoloration than microhybrid composite.
Keywords: Color change, Degree of conversion, FTIR spectroscopy, Microhybrid composites, Nanocomposites
Color figures can be viewed in the online issue, which is avail-able at J-STAGE.Received Dec 21, 2011: Accepted Jan 8, 2013doi:10.4012/dmj.2011-267 JOI JST.JSTAGE/dmj/2011-267
Dental Materials Journal 2013; 32(2): 326–331
Table 1 Types of restorative materials used in the study
Materials Shade Description Composition Monomer
Grandio Nano A2, A3.5
Universal NanoHybrid
87 wt% inorganic filler 71.4 vol %Nano-hybrid composite SiO2 (20–60 nm)
Glass ceramic
Bis-GMA, UDMA, TEGDMAInitiator:
Camphoroquinone
Arabesk top A2, A3.5
Glass ceramic, Microhybrid
resin
77 wt% (56 Vol% microfiller ca. 0.05 μm and very small particles with mean particle size 0.7 μm Bariumaluminiumsilicate glass
Lithiumaluminiumsilicate glass ceramicHighly dispersed silicon dioxide
Bis-GMA,UDMA,
TEGDMA
Bis-GMA: bisphenol-A-glycidyl methacrylate, UDMA: urethane dimethacrylate, TEGDMA: triethyleneglycol dimethacrylate
Degree of conversionA sample of the uncured composite was mixed with potassium bromide (KBr) powder to make a disc shaped specimen. Absorbance peaks were collected before curing from 10 scans at a resolution of 4cm−1, over a range of 4,000–300cm−1, acquired with a Fourier Transform Infra Red Spectrophotometer (Shimadzu, Kyoto, Japan) operating in absorbance mode. The microhybrid and nanohybrid composites were light cured for 40 s with a light emitting diode (LED) in a polytetrafluoroethlyene mould (Diameter 4 mm, thickness 3 mm) covered with a mylar strip on one side and glass slide on other. They were then pulverised into fine powder by a mortar and pestle immediately after curing. The time delay between light polymerization and FTIR measurement was 2–3 min. Fourty micrograms of powder were mixed with 4 mg of potassium bromide powder, similar disc-shapes specimens were placed on a support and analysed to record the absorbance peaks. The amounts of double carbon bonds which are converted in single bonds provide the DC%. The percentage of the unreacted carbon-carbon double bonds (%C=C) was determined from the ratio of absorbance intensities of aliphatic C=C stretching vibrations at 1,637 cm−1 and aromatic C-C stretching vibrations at 1,608 cm−1 to an internal standard before and after curing of the specimen. As the absorption of aromatic carbon-carbon stretching band remains static during curing it serves as in internal standard. The two-frequency technique is used for calculation of the monomer conversion. The degree of conversion was calculated according to equation (1) used by Lohbauer et al. (2005)14).
Degree of conversion (%) = 100×{1−Am(C−C)×Ap(C=C)/Am(C=C) Ap(C−C)} Eq. (1)
Where Am(C−C) (1,608 cm−1) are aromatic stretching vibrations before curing, and Ap(C−C) are aromatic vibrations after curing, Ap(C=C) are similar aliphatic stretching vibrations for cured material and Am(C=C) (1,637 cm−1) are stretching vibrations for aliphatic carbon-carbon double bonds for uncured materials.
Color stabilityTwenty disk shaped specimens of each shade (Diameter
of 11±0.1 mm, thickness of 3±0.1 mm) were prepared in accordance with the manufacturer’s instructions and by using a polytetrafluoroethylene ring. These specimens were then cured with the Elipar free light curing unit (3M ESPE, Dental Products, Germany) for the required number of seconds (40 s). The specimens were stored in a dark environment at 37°C±1°C in an incubator before testing for 24 h. No polishing procedure was performed. To prepare the coffee solution, 15 g of coffee powder (Nescafe Classic, Nestle Hellas, Athens, Greece) was poured into 500 mL of boiling distilled water. After 10 min of stirring, the solution was filtered through filter paper. The tea solution was prepared by immersing 5 pre-packaged doses of tea powder (Golden Sun, Eswaran Brothers, Colombo, Sri Lanka) into 500 mL of boiling distilled water for 10 min. Fresh solutions were made after each sampling. The two staining solutions were stored in separate vials and maintained at the temperature of the oral cavity of (37°C±1°C). Additionally, a new can of Cola Drink (Pepsi Co, Saudi Arabia) was used. Once the samples were placed in the tubes, the lids were tightly sealed.
The color measurements of each specimen were made before immersion (baseline) using a spectrophotometer (Color-Eye 7000A, Gretag Macbeth, New Windsor, NY, USA). The purpose of this instrument is to detect the amount of light illuminated by an object and the amount of light that is reflected from it. Calibration of the spectrophotometer was done using a black and white ceramic tile provided by the manufacturer. After conducting baseline measurements, 5 randomly selected specimens of each shade (A3.5, A2) were submerged in one of the three staining solutions or distilled water (control solution) at 37°±1°C for 90 days. Color measurements were recorded again after 1, 2, 7, 15, 30, 60 and 90 days. The specimens were gently washed with distilled water for 5 min and then dried with tissue paper before each measurement was conducted. The color change of each specimen was then recorded. The CIE LAB (Commission Internationale de l’éclairage) color system was used for recording the values. This system is comprised of an approximately uniform color space with color coordinates for white-black (L*), redness-greenness (a*) and yellowness-blueness (b*). The L* value refers to the lightness of an object and its value ranges from zero
327Dent Mater J 2013; 32(2): 326–331

Fig. 1 FTIR spectra before and after light polymerization showing typical C-C and C=C peaks.
(black) to 100 (white). The a* and b* value are a measure of redness or greenness and yellowness or blueness of an object. The a* and b*chromaticity co-ordinates reach zero for neutral colors and increase in magnitude for saturated or intense colors. These L*, a* and b* values were recorded at least 3 times by the spectrophotometer for each experimental time period. The mean values of L*, a* and b* were calculated where L0, a0, b0 were the values of the stained specimen before bleaching and L1, a1, b1 were recorded after bleaching. The color difference (ΔE*) was calculated from the mean ΔL*, Δa* and Δb* values using the following formula:
ΔE={(L*1−L*0)2+(a*1−a*0)2+(b*1−b*0)2}1/2 Eq. (2)
For each shade of the Grandio Nanohybrid and Arabesk Microhybrid materials, the ΔE values were subjected to statistical analysis using a Paired t-test. The SPSS Version 18 statistical software for Windows was used for the analysis. The interpretation of these results was based on the fact that ΔE values greater than 3.3 are considered to produce a visually or clinically unacceptable discoloration of the specimen. Origin Pro 7.5 (Microsal Software, Northampton, US) was used to make regression curves.
RESULTS
Degree of conversion Figure 1 shows representative spectra before and after polymerization of microhybrid resin composites in which aliphatic C=C is seen at 1,637.56 cm−1 and C=C aromatic stretching vibrations are seen at 1,608 cm−1, since the absorption of the aromatic carbon-carbon stretching bands remain static during polymerization it serves as an internal standard. The black line in Fig. 1 shows the spectrum before polymerization and red line marks the spectrum after polymerization for shade A3.5. The aliphatic peak tends to decrease due to absorption or consumption of C=C bonds. The %DC of Nano Hybrid composites have been calculated to be 70%; this is of the same order of magnitude as similar resins that have been described in the literature. The microhybrid composite AT showed a conversion rate of around 56%. Hence, the nanocomposite exhibited a higher monomer-polymer conversion rate compared with the microhybrid resin composite. The results of the mean (SD) values for degree of conversion are listed in Table 3.
Color stability Table 2 gives the means and standard deviations (SD) of the color change values (ΔE*) of GB and AT (A3.5 and A2). The most severe discoloration was apparent with coffee and tea solutions15). The discoloration in these cases was significant when compared to the neutral samples stored in distilled water16,17). Figures 2 and 3 show the scatter plots and curves adjusted for regression equations between ΔE and immersion time for each material, GN and AT. Each curve is well fitted a regression curve of ΔE=atb, where a and b are constant and t is time. Though
it is difficult to explain a physical meaning of “b” value, change in ΔE with time are experimentally defined by those equations. The regression curves have shown a direct relationship of ΔE with time. The samples stored in coffee displayed an increase in the value of ΔE value over time. The distilled water and cola caused the least discoloration.
With the GN (A3.5 and A2), the highest ΔE value was recorded for specimens exposed to coffee solutions (ΔE=9.863), while the least affected were specimens exposed to cola (ΔE=3.49). The specimens immersed in distilled water (control) showed the least color change throughout the experiment period. Unacceptable color change was noted in all samples immersed in coffee or tea for 2–90 days. Distilled water seemed to produce significant discoloration, but it was within the acceptable range (ΔE<3.3)
After 90 days of immersion, AT showed less color change than GN in all solutions. This difference was statistically significant.
DISCUSSION
The physical, mechanical and biological properties of a photo-activated composite restorative resin are strongly influenced by the DC achieved by the organic matrix18,19).
Ideally, a resin material would have all of its monomer converted to polymer during polymerisation14,20). In the present study, the DC evaluation using FTIR spectroscopy showed that the DC values of the microhybrid composite resin were (56%) and nanocomposite resin were (70%).
A high degree of polymer conversion and efficient polymerization can affect color stability because residual monomer left in the polymeric chain can lead to the formation of colorimetric degradation products that facilitate the penetration of solvents from the oral environment into the polymeric network. This phenomenon promotes hydrolytic degradation of the newly formed chain18). However, this was not observed in the present study; therefore, the first hypothesis can
328 Dent Mater J 2013; 32(2): 326–331

Table 2 Mean (Standard Deviation) of the color change value ΔE
Resin Composite ShadeImmersion
Period
Staining Solution
Distilled water Coffee Tea Pepsi Cola
Grandio NanoHybrid A3.5
1 day 2 days 7 days15 days30 days60 days90 days
0.546(0.01)a
0.808(0.05)1.144(0.09)b
1.383(0.12)1.638(0.16)2.27(0.22)3.352(0.43)*c
2.134(0.51)a
3.802(0.22)*5.936(0.32)*b
6.661(0.30)6.475(0.21)*7.748(0.70)*8.848(1.17)*c
1.812(0.10)a
2.776(0.30)3.637(0.43)*b
4.471(0.42)*6.354(0.41)*7.636(0.20)*8.676(1.01)* c
0.938(0.04)a
1.11(0.11)1.445(0.03)b
2.095(0.23)2.436(0.51)2.89(0.31)3.697(0.40)*c
Arabesk light-cured MicroHybrid A 3.5
1 day 2 days 7 days15 days30 days60 days90 days
0.816(0.05)a
1.243(0.21)1.849(0.04)b
2.149(0.31)2.544(0.12)3.082(0.31)3.659(0.51)*
3.114(0.12)a
3.383(0.46)*4.109(0.25)*b
5.019(0.26)*5.668(0.81)*5.931(0.32)*6.78(0.51)*c
2.449(0.31)a
3.012(0.51)3.743(0.13)*b
4.646(0.20)*4.854(1.04)*5.206(0.26)*5.659(0.81)*c
1.095(0.21)a
1.538(0.10)2.019(0.32)b
2.669(0.22)3.067(0.52)3.211(0.51)3.632(0.40)*
Grandio NanoHybrid A2
1 day 2 days 7 days15 days30 days60 days90 days
0.354(0.01)a
0.754(0.05)1.525(0.10)b
2.052(0.32)2.367(0.13)2.701(0.51)3.168(0.43)c
3.232(0.13)a
3.518(0.31)*6.11(0.41)*b
6.96(1.04)*7.546(0.23)*8.97(0.26)*9.863(2.12)*c
2.443(0.70)a
3.866(0.12)*4.604(0.50)*b
5.246(0.23)*6.732(0.41)*8.608(0.63)*9.404(1.41)*c
0.973(0.02)a
1.072(0.42)1.408(0.10)b
2.085(0.05)2.685(0.70)3.171(0.31)3.498(0.40)*c
Arabesk light-cured MicroHybrid A 2
1 day 2 days 7 days15 days30 days60 days90 days
0.925(0.12)a
1.229(0.09)2.042(0.23)b
2.528(0.70)2.957(0.11)3.122(0.51)3.593(0.12)*
4.163(0.20)*5.389(0.35)*5.865(0.81)*6.748(0.20)*7.885(1.04)*8.851(0.41)*9.273(2.12)*c
2.734(0.13)a
3.21(0.23)3.993(0.43)*b
4.387(1.12)*5.405(0.32)*6.086(0.52)*6.282(0.35)*c
1.548(0.10)a
1.937(0.05)2.397(0.70)b
2.721(0.11)3.204(0.1203.804(0.43)*4.204(1.04)*
*Indicates clinically unacceptable values (ΔE=>3.3).Similar superscripted letters in the same column indicate statistical significance (p<0.05).
Table 3 Percent Mean (SD) of the degree of conversion values
Resin Composite A3.5 A2
Grandio Nano 69.6 (1.81) 69 (2.92)
Arabesk top 55.8 (1.92) 56.7 (2.91)
be rejected. An increase in degree of conversion does not improve the optical properties of the material, as the Nano hybrid composite resin showed more staining than the microhybrid21). For clinically successful restorative dentistry a minimum DC has still not been precisely established22). According to Kournetas, the degradation of the matrix results in hydrolysis of the bond with the silane coupling agent. Consequently it causes detachment of the filler, which accounts for most of the color change23). The increase in color change of resin composites stored in distilled water with time may occur due to presence
of water which tends to soften the polymer by causing swelling of the network and reducing the frictional forces between polymer chain20,21). In this study the use of the glass plate provided smoother surface for all materials tested. In agreement with our study it was found that Mylar strip formed the smoothest surface23). In addition to the finishing and polishing procedures may result in different surface textural changes and sub surface defects. In general the regression curves for GN and AT yielded a strong correlation between ΔE and time. This correlation could be due to the difference in the filler size and load, resin type and photoinitiator present in the material. The coffee samples of AT for shade A3.5 showed the highest values for color change with time24).
Villalta et al.24) showed that a nanocomposite (Filtek Supreme) underwent a more significant color change than a microhybrid composite (Esthet-X) as a result of staining with coffee or red wine solutions. Yazici et al. also reported that the nanocomposites had a higher color change than the microhybrid composites after staining15). These results are in agreement with our study, which
329Dent Mater J 2013; 32(2): 326–331
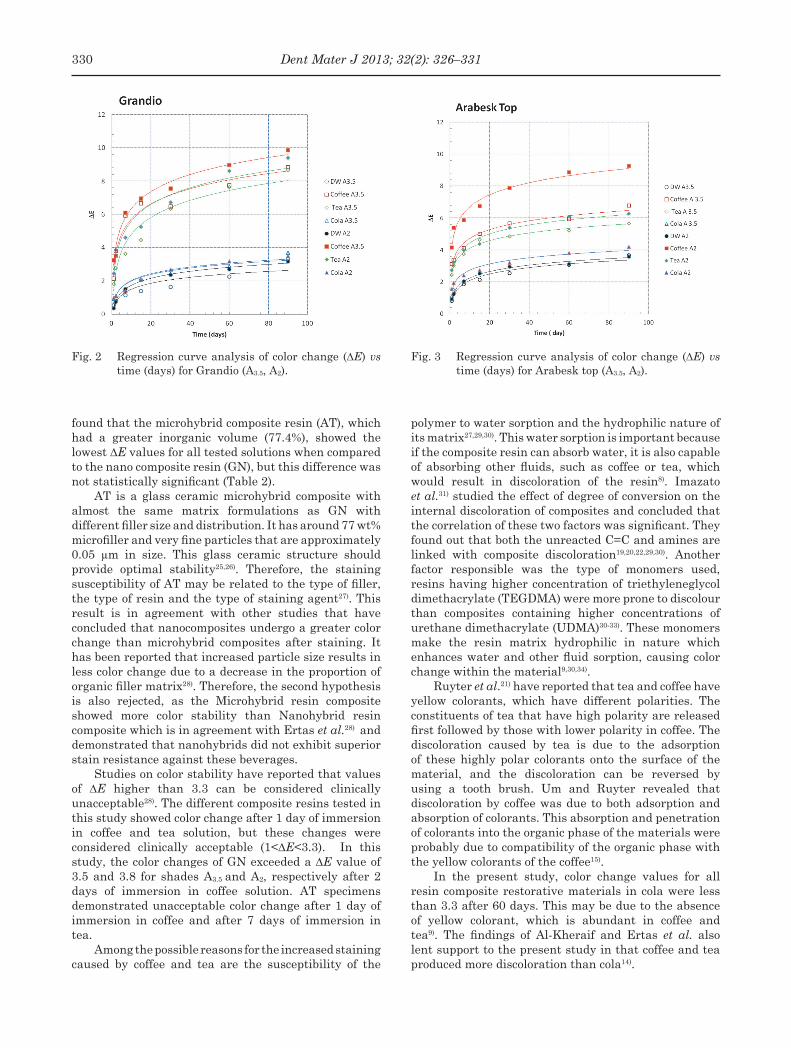
Fig. 2 Regression curve analysis of color change (ΔE) vs time (days) for Grandio (A3.5, A2).
Fig. 3 Regression curve analysis of color change (ΔE) vs time (days) for Arabesk top (A3.5, A2).
found that the microhybrid composite resin (AT), which had a greater inorganic volume (77.4%), showed the lowest ΔE values for all tested solutions when compared to the nano composite resin (GN), but this difference was not statistically significant (Table 2).
AT is a glass ceramic microhybrid composite with almost the same matrix formulations as GN with different filler size and distribution. It has around 77 wt% microfiller and very fine particles that are approximately 0.05 μm in size. This glass ceramic structure should provide optimal stability25,26). Therefore, the staining susceptibility of AT may be related to the type of filler, the type of resin and the type of staining agent27). This result is in agreement with other studies that have concluded that nanocomposites undergo a greater color change than microhybrid composites after staining. It has been reported that increased particle size results in less color change due to a decrease in the proportion of organic filler matrix28). Therefore, the second hypothesis is also rejected, as the Microhybrid resin composite showed more color stability than Nanohybrid resin composite which is in agreement with Ertas et al.28) and demonstrated that nanohybrids did not exhibit superior stain resistance against these beverages.
Studies on color stability have reported that values of ΔE higher than 3.3 can be considered clinically unacceptable28). The different composite resins tested in this study showed color change after 1 day of immersion in coffee and tea solution, but these changes were considered clinically acceptable (1<ΔE<3.3). In this study, the color changes of GN exceeded a ΔE value of 3.5 and 3.8 for shades A3.5 and A2, respectively after 2 days of immersion in coffee solution. AT specimens demonstrated unacceptable color change after 1 day of immersion in coffee and after 7 days of immersion in tea.
Among the possible reasons for the increased staining caused by coffee and tea are the susceptibility of the
polymer to water sorption and the hydrophilic nature of its matrix27,29,30). This water sorption is important because if the composite resin can absorb water, it is also capable of absorbing other fluids, such as coffee or tea, which would result in discoloration of the resin8). Imazato et al.31) studied the effect of degree of conversion on the internal discoloration of composites and concluded that the correlation of these two factors was significant. They found out that both the unreacted C=C and amines are linked with composite discoloration19,20,22,29,30). Another factor responsible was the type of monomers used, resins having higher concentration of triethyleneglycol dimethacrylate (TEGDMA) were more prone to discolour than composites containing higher concentrations of urethane dimethacrylate (UDMA)30-33). These monomers make the resin matrix hydrophilic in nature which enhances water and other fluid sorption, causing color change within the material9,30,34).
Ruyter et al.21) have reported that tea and coffee have yellow colorants, which have different polarities. The constituents of tea that have high polarity are released first followed by those with lower polarity in coffee. The discoloration caused by tea is due to the adsorption of these highly polar colorants onto the surface of the material, and the discoloration can be reversed by using a tooth brush. Um and Ruyter revealed that discoloration by coffee was due to both adsorption and absorption of colorants. This absorption and penetration of colorants into the organic phase of the materials were probably due to compatibility of the organic phase with the yellow colorants of the coffee15).
In the present study, color change values for all resin composite restorative materials in cola were less than 3.3 after 60 days. This may be due to the absence of yellow colorant, which is abundant in coffee and tea9). The findings of Al-Kheraif and Ertas et al. also lent support to the present study in that coffee and tea produced more discoloration than cola14).
330 Dent Mater J 2013; 32(2): 326–331
Further studies should be done to better understand the relationship between the physicochemical properties of composites and the degree of conversion.
CONCLUSIONS
From the FTIR spectroscopy data, we determined that the degree of conversion for Nano composites was higher than the values obtained for Microhybrid resin composites (70% vs 56%). The discoloration of GN was significantly higher after 90 days of immersion in coffee and tea (ΔE>3.3), and the discoloration was considered clinically acceptable after immersion in cola (1<ΔE<3.3) for periods shorter than 90 days. No correlation was found between the degree of conversion and color stability.
ACKNOWLEDGMENTS
The authors extend their appreciation to the deanship of Scientific Research at King Saud University for funding the work through the research group project NO RGP-VPP-152. The work was carried out as a collaborative effort between University of Sheffield and King Saud University.
REFERENCES
1) Barron DJ, Rueggeberg FA, Schuster GS. A comparison of monomer conversion and inorganic filler content in visible light-cured denture resins. Dent Mater 1992; 8: 4: 274-277.
2) Matsumoto H, Gres JE, Marker VA, Okabe T, Ferracane JL, Harvey GA. Depth of cure of visible light-cured resin: clinical simulation. J Prosthet Dent 1986; 2: 80-84.
3) Newman SM, Murray GA, Yates JL. Visible lights and visible light-activated composite resins. J Prosthet Dent 1983; 50: 31-35.
4) Rueggeberg A, Hashinger DT, Fairhust CW. Calibration of FTIR conversion analysis of contemporary dental resin composites. Dent Mater 1990; 6: 241-249.
5) Shin WS, Li XF, Schwartz B, Wunder SL, Baran GR. Determination of the degree of cure of dental resins using Raman and FT-Raman spectroscopy. Dent Mater 1993; 9: 317-324.
6) Rastelli ANS, Jacomassi DP, Bagnato VS. Effect of power densities and irradiation times on the degree of conversion and temperature increase of a microhybrid dental composite resin. Laser Phys 2008; 18: 9: 1074-1079.
7) Abu-Bakr N, Han L, Okamoto A, Iwaku M. Color stability of compomer after immersion in various media. J Esthet Dent 2000; 12: 258-263.
8) Mundim FM, Garcia LFR, Pires-De-Souza FCP. Effect of staining solutions and repolishing on color stability of direct composites. J Appl Oral Sci 2010; 18: 249-254.
9) Bagheri R, Burrow MF, Tyas M. Influence of food-simulating solutions and surface finish on susceptibility to staining of aesthetic restorative materials. J Dent 2005; 33: 389-398.
10) Reis AF, Giannini M, Lovadino JR, Ambrosano GM. Effects of various finishing systems on the surface roughness and staining susceptibility of packable composite resins. Dent Mater 2003; 19:12-18.
11) Omata Y, Uno S, Nakaoki Y, Tanaka T, Sano H, Yoshida S, Sidhu SK. Staining of hybrid composites with coffee, oolong tea, or red wine. Dent Mater J 2006; 25:125-131.
12) Asmussen E. Softening of BISGMA-based polymers by
ethanol and by organic acids of plaque. Scand J Dent Res 1984; 92: 257-261.
13) Chen MH. Update on dental nanocomposites. J Dent Res 2010; 89: 549-560.
14) Lohbauer U, Rahiotis C, Kramer N, The effect of light curing units on fatigue behavior and degree of conversion of a resin composite. Dent Mater 2005; 21: 7: 608-615.
15) Yazici AR, Çelik C, Dayanga B, Özgünaltay G. The effect of curing units and staining solutions on the color stability of resin composites. Oper Dent 2007; 32: 616-622.
16) Um CM, Ruyter IE. Staining of resin based veneering material with coffee and tea. Quintessence Int 1991; 22: 337-386.
17) Türker SB, Koçak A, Aktepe E. Effect of five staining solutions on the color stability of two acrylics and three composite resins based provisional restorations. Eur J Prosthdont Restor Dent 2006; 14: 2-6.
18) Kheraif AA. Effects of curing units and the staining solutions on the color susceptibility of a microhybrid composite resin. J Dent Sci 2011; 6: 33-40.
19) Eliades GC, Vougiouklakis GJ, Caputo AA. Degree of double bond conversion in light-cured composites. Dent Mater 1987; 3: 1:19-25.
20) Asmussen E. Factors affecting the quantity of remaining double bonds in restorative resin polymers. Scand J Dent Res 1982; 90: 490-496.
21) Ruyter IE, Oysaed H. Analysis and characterization of dental polymers. Crit Rev Biocompat 1988; 4: 3: 247-279.
22) Anusavice KJ. In: Anusavice KJ, editor. Phillips’ science of dental materials. 11th edition. St. Louis: Saunders Co; 2003. p.
23) Kournetas N, Chakmakchi M, Kakaboura A, Rahiotis C, Gerstorfer GJ. Marginal and internal adaptation of Class II ormocer and hybrid resin composite restorations before and after load cycling. Clin Oral Investig 2004; 8: 123-129.
24) Villalta P, Lu H, Okte Z, Gracia-Godoy F, Powers JM. Effects of staining solutions and bleaching on color change of dental composite resins. J Prosthet Dent 2006; 95: 137-142.
25) Besty KM, Luiz RDMCA, Prates LHM, Bertolinod JR, Pires ATN. Influence of drinks on resin composites: evaluation of degree of cure and color change. Polym Test 2007; 26: 438-434.
26) Voco GmbH. Arabesk Top, Scientific Product Information, 1997.
27) Vichi A, Ferrari M, Davidson CL. Color and opacity variation in three different resin based composite products after water aging. Dent Mater 2004; 20: 530-534.
28) Ertas E, Guler AU, Yucel AC, Koprulu H, Guler E. Color stability of resin composites after immersion in different drinks. Dent Mater J 2006; 25: 371-376.
29) Paravina RD, Roeder L, Lu H, Vogel K, Powers JM. Effect of finishing and polishing procedures on surface roughness, gloss and color of resin-based composites. Am J Dent 2004; 17: 262-266.
30) Ferracane JL, Berge XH, Condor JR. In vitro aging of dental composites in water effect the degree of conversion, filler volume and filler/matrix coupling. J Biomed Mater Res 1998; 42: 465-472.
31) Imazato S, Tarumi H, Kobayashi K, Hiraguri H, Oda K, Tsuchitani Y. Relationship between degree of conversion and internal discoloration of light activated composites. Dent Mater J 1995; 14: 1: 23-30.
32) Ozgunaltay G, Yazici AR, Gorucu J. Effect of finishing and polishing procedures on the surface roughness of new tooth coloured restoratives. J Oral Rehabil 2003; 30: 218-224.
33) Kalachandra S, Turner DT. Water sorption of polymethacrylate networks; bisGMA/ TEGDMA copolymers. J Biomed Mater Res 1987; 21: 329-338.
34) Yousef M, Naga AE. Color stability of different restoratives after exposure to coloring agents. J Am Sci 2012; 8: 20-26.
331Dent Mater J 2013; 32(2): 326–331