Stability of the color-opponent signals under changes...
12
Stability of the color-opponent signals under changes of illuminant in natural scenes P. G. Lovell Department of Experimental Psychology, University of Bristol, 8 Woodland Road, Bristol BS8 1TN, UK D. J. Tolhurst Department of Physiology, University of Cambridge, Downing Street, Cambridge CB2 3EG, UK C. A. Párraga, R. Baddeley, and U. Leonards Department of Experimental Psychology, University of Bristol, 8 Woodland Road, Bristol BS8 1TN, UK J. Troscianko Department of Zoology, University of Oxford, South Parks Road, Oxford OX1 3PS, UK T. Troscianko Department of Experimental Psychology, University of Bristol, 8 Woodland Road, Bristol BS8 1TN, UK Received January 31, 2005; revised manuscript received April 7, 2005; accepted April 28, 2005 Illumination varies greatly both across parts of a natural scene and as a function of time, whereas the spectral reflectance function of surfaces remains more stable and is of much greater relevance when searching for spe- cific targets. This study investigates the functional properties of postreceptoral opponent-channel responses, in particular regarding their stability against spatial and temporal variation in illumination. We studied images of natural scenes obtained in UK and Uganda with digital cameras calibrated to produce estimated L-, M-, and S-cone responses of trichromatic primates (human) and birds (starling). For both primates and birds we cal- culated luminance and red–green opponent (RG) responses. We also calculated a primate blue–yellow- opponent (BY) response. The BY response varies with changes in illumination, both across time and across the image, rendering this factor less invariant. The RG response is much more stable than the BY response across such changes in illumination for primates, less so for birds. These differences between species are due to the greater separation of bird L and M cones in wavelength and the narrower bandwidth of the cone action spectra. This greater separation also produces a larger chromatic signal for a given change in spectral reflectance. Thus bird vision seems to suffer a greater degree of spatiotemporal “clutter” than primate vision, but also enhances differences between targets and background. Therefore, there may be a trade-off between the degree of chro- matic clutter in a visual system versus the degree of chromatic difference between a target and its background. Primate and bird visual systems have found different solutions to this trade-off. © 2005 Optical Society of America OCIS codes: 330.1720, 330.4060. 1. INTRODUCTION The spectrum of light reaching an observer’s eye from an object is determined not just by the reflectance function of the object’s material but also by the spectral properties of the illuminant. The illuminant typically varies markedly in intensity over time and space and this is especially true of objects of high three-dimensional spatial complexity, such as the foliage of a tree. An important task of vision is therefore to be able to detect the invariant material prop- erties of the surface (e.g., the reflectance function) while being invariant to the highly variable illumination. It has been suggested that opponent-color vision might fulfill this task. 1,2 The work of DeValois and his colleagues 3–5 has pro- vided ample evidence that the postreceptoral channels in monkeys consist of three opponent channels, which can be thought of as encoding the red–green (RG), blue–yellow (BY), and light–dark (Lum) aspects of a scene. There is also ample evidence that human perception of color uses RG and BY opponent channels, as originally proposed by Hering. 6 The BY (or blue–green) opponent system is found in many mammalian orders, 7 but the paradoxical RG system has much more limited mammalian distribu- tion, mostly in old-world monkeys and apes. The paradox is that the amount of RG outflow from the monkey retina is immensely greater than the BY, 8,9 and yet RG changes within the natural world are relatively rare. 10 In the present paper, we explore the manner in which such op- ponent channels might sample natural images containing real noise such as shadows and specularities. We also ex- plore how the opponent channels respond in an environ- ment in which light changes naturally in intensity and 2060 J. Opt. Soc. Am. A/Vol. 22, No. 10/October 2005 Lovell et al. 1084-7529/05/102060-12/$15.00 © 2005 Optical Society of America
Transcript of Stability of the color-opponent signals under changes...

1Tottiostebbt
vm
2060 J. Opt. Soc. Am. A/Vol. 22, No. 10 /October 2005 Lovell et al.
Stability of the color-opponent signals underchanges of illuminant in natural scenes
P. G. Lovell
Department of Experimental Psychology, University of Bristol, 8 Woodland Road, Bristol BS8 1TN, UK
D. J. Tolhurst
Department of Physiology, University of Cambridge, Downing Street, Cambridge CB2 3EG, UK
C. A. Párraga, R. Baddeley, and U. Leonards
Department of Experimental Psychology, University of Bristol, 8 Woodland Road, Bristol BS8 1TN, UK
J. Troscianko
Department of Zoology, University of Oxford, South Parks Road, Oxford OX1 3PS, UK
T. Troscianko
Department of Experimental Psychology, University of Bristol, 8 Woodland Road, Bristol BS8 1TN, UK
Received January 31, 2005; revised manuscript received April 7, 2005; accepted April 28, 2005
Illumination varies greatly both across parts of a natural scene and as a function of time, whereas the spectralreflectance function of surfaces remains more stable and is of much greater relevance when searching for spe-cific targets. This study investigates the functional properties of postreceptoral opponent-channel responses, inparticular regarding their stability against spatial and temporal variation in illumination. We studied imagesof natural scenes obtained in UK and Uganda with digital cameras calibrated to produce estimated L-, M-, andS-cone responses of trichromatic primates (human) and birds (starling). For both primates and birds we cal-culated luminance and red–green opponent (RG) responses. We also calculated a primate blue–yellow-opponent (BY) response. The BY response varies with changes in illumination, both across time and across theimage, rendering this factor less invariant. The RG response is much more stable than the BY response acrosssuch changes in illumination for primates, less so for birds. These differences between species are due to thegreater separation of bird L and M cones in wavelength and the narrower bandwidth of the cone action spectra.This greater separation also produces a larger chromatic signal for a given change in spectral reflectance. Thusbird vision seems to suffer a greater degree of spatiotemporal “clutter” than primate vision, but also enhancesdifferences between targets and background. Therefore, there may be a trade-off between the degree of chro-matic clutter in a visual system versus the degree of chromatic difference between a target and its background.Primate and bird visual systems have found different solutions to this trade-off. © 2005 Optical Society ofAmerica
OCIS codes: 330.1720, 330.4060.
t(aRHfRtiiwpprpm
. INTRODUCTIONhe spectrum of light reaching an observer’s eye from anbject is determined not just by the reflectance function ofhe object’s material but also by the spectral properties ofhe illuminant. The illuminant typically varies markedlyn intensity over time and space and this is especially truef objects of high three-dimensional spatial complexity,uch as the foliage of a tree. An important task of vision isherefore to be able to detect the invariant material prop-rties of the surface (e.g., the reflectance function) whileeing invariant to the highly variable illumination. It haseen suggested that opponent-color vision might fulfillhis task.1,2
The work of DeValois and his colleagues3–5 has pro-ided ample evidence that the postreceptoral channels inonkeys consist of three opponent channels, which can be
1084-7529/05/102060-12/$15.00 © 2
hought of as encoding the red–green (RG), blue–yellowBY), and light–dark (Lum) aspects of a scene. There islso ample evidence that human perception of color usesG and BY opponent channels, as originally proposed byering.6 The BY (or blue–green) opponent system is
ound in many mammalian orders,7 but the paradoxicalG system has much more limited mammalian distribu-
ion, mostly in old-world monkeys and apes. The paradoxs that the amount of RG outflow from the monkey retinas immensely greater than the BY,8,9 and yet RG changesithin the natural world are relatively rare.10 In theresent paper, we explore the manner in which such op-onent channels might sample natural images containingeal noise such as shadows and specularities. We also ex-lore how the opponent channels respond in an environ-ent in which light changes naturally in intensity and
005 Optical Society of America
“a
cioaTvdtlmsposdtdsFtsTstmwt
mpjccpmmti
pSbspoegt
e
2AWcl(h
tgi
9asssctacfiflpfebrrmupqpsw
twso2mammtimtLttm
ssofaneasetLdflm
Lovell et al. Vol. 22, No. 10 /October 2005 /J. Opt. Soc. Am. A 2061
color” over time as a result of changes in solar positionnd atmospheric properties.Color vision is proposed as a means of removing the
amouflaging effects of shadows in the belief that directlylluminated and shadowed parts of an object will differnly in the intensity of illuminant.11 However, shadowedreas do not differ solely in the intensity of illumination.he “color” of the natural illuminant is not constant. Itaries over the time course of a day, primarily in the BYirection of color space,12 although the light filteringhough a tree canopy also varies in its greenness.13 Theight from a cloudy sky is bluer than direct sunlight. This
eans that on a sunny day, any shadowed area receivescattered light from the blue sky, which has a higher pro-ortion of short wavelengths than direct sunlight. Shad-ws are therefore blue in comparison with areas of theame material lit by direct sunshine. Even on a cloudyay, it has been shown that the area of sky correspondingo the position of the sun is more yellow than sky moreistant from the sun’s location,14 so similar, thoughmaller, effects may be expected on cloudy days as well.urthermore, the shadowed areas may receive illumina-ion locally reflected from other objects and, in naturalcenes, those other objects are likely to be green foliage.he BY system may therefore not be invariant acrosshadow boundaries.15,16 If the visual system is attemptingo extract reflectance, and therefore changes due to illu-ination are viewed as noise, the YB opponent systemill show substantial illumination noise both as a func-
ion of space and time.The purpose of this paper is to explore these issuesore formally. Specifically, does the RG opponent system
rovide a means of encoding the spectral properties of ob-ects such as edible fruit in an invariant manner, over theourse of a day, during which time illumination willhange markedly? And how badly affected is the BY op-onent system by shadows and daily changes in the illu-inant? This proposal for a RG system as adapted toinimize illumination noise complements proposals that
he primate RG opponent system is optimized for detect-ng and differentiating potentially edible objects.17–21
We will also consider how some of the scenes in this pa-er will be encoded by birds—specifically by starlings,turnus vulgaris, whose receptor sensitivity is describedy Hart et al.22 We do this because birds have a differentet of spectral sensitivities for their L and M cones com-ared with primates, and are thought to have a RGpponent-color mechanism.23 A comparison of the neuralncoding of trichromatic primates and birds is expected toive an interesting insight into the design of both sys-ems.
Part of this work has been described brieflylsewhere.24–26
. METHODS. Cameras and Calibratione took photographs of natural scenes with Nikon digital
ameras and used their uncompressed outputs to calcu-ate how human long-, medium-, and short-wavelengthL, M, S) cones and how starling L and M cones wouldave responded at every point in a scene. This required
horough characterization of each camera’s nonlinearamma function and the spectral activation functions ofts three (R,G,B) sensors.
The cameras used in this work were a Nikon Coolpix50 (camera 1) and a Nikon Coolpix 5700 (camera 2). Allutomatic settings were turned off; these included imageharpening, selection of white balance, selection of expo-ure aperture, and integration time. White balance waset to “cloudy,” as was the case during the calibration pro-ess, and central-spot metering was used. The lens aper-ure value was manually fixed to allow the maximumvailable depth of focus (f11.4 in camera 1 and f7.4 inamera 2) and the cameras’ built-in software was free tond the optimal integration time (shutter speed); theash was disabled. The picture outputs were uncom-ressed .tif images. Image sizes were 1600�1200 pixelsor camera 1 and 2560�1920 pixels for camera 2. How-ver, photographs taken with camera 2 were subsampledy averaging odd and even rows and columns in order toeduce computer-processing time; this gave an effectiveesolution of 1280�960 pixels. The cameras wereounted on tripods, and a remote shutter release wassed to avoid small camera movements and registrationroblems between successive pictures in time-lapse se-uences, in which the cameras were programmed to takeictures at intervals of 4 min of the same scene. Figure 1hows a montage of some of the colored photographs thate use as the basis for analysis in this paper.To obtain the LMS cone activations for every point of
he visual scene from the RGB pixel values in the .tif files,e characterized the cameras, using the methodology de-
cribed below, in terms of the LMS cone representationsf humans27,28 (see Fig. 2(A)) and starlings (see Fig.(B)).22 It will be noted that, by comparison with the hu-an, the starling (like many birds) has four cones whose
ction spectra are narrower than in the human and areore evenly spaced across the visible spectrum. Oneight surmise that birds would have “better” color vision
han a human. In any case, the L and M cone character-stics are markedly different and a comparison with hu-
an vision should be revealing. We concentrate uponhose cones of the starling that correspond best to theMS sensitivities of primates, and so we have excluded
hose cones sensitive to UV and double cones. We verifiedhe extent of the error in our polynomial RGB-to-LMSapping as follows:Characterization of a camera in terms of LMS re-
ponses would yield exact results only if the spectral sen-itivities of the imaging system are exact transformationsf the LMS cone representations (e.g., one could trans-orm exactly from camera RGB space to LMS space using3�3 transformation matrix). However, this condition isot normally satisfied by commercial camera manufactur-rs, and therefore our color space transformations will bepproximations and subject to error. There is also the is-ue of device metamerism, where theoretically, two differ-nt surfaces under the same illumination may producehe same camera response and be modeled with the sameMS values. To overcome these limitations of the imagingevice, we took advantage of the fact that the spectral re-ectance of most natural surfaces (as well as natural illu-ination) are relatively smooth functions of

wbd
tClslptrte
ofrbpto3etlftt
Ffadwbs
2062 J. Opt. Soc. Am. A/Vol. 22, No. 10 /October 2005 Lovell et al.
avelength29–32 and can be represented by a small num-er of basis functions33 (this issue has been a subject ofiscussion in the literature).34,35
The cameras’ RGB pixel values were characterized inwo stages. First, the cameras were pointed at a MacbetholorChecker card illuminated by a tungsten-halogen
ight source (Osram HLX 64657FGX, 250 W). The lightource was supplied with constant current from a stabi-ized DC power supply (custom-made accurate to 30 partser million in current). We illuminated a white card withhis lamp and measured the CIE-Y value with a spectro-adiometer (TopCon, Model SR1, calibrated by the Na-ional Physical Laboratory, UK). Once both pieces ofquipment were warm, the CIE-Y value varied with a SD
ig. 1. (Color online) This montage shows examples of the digeatures ripe and unripe tomatoes; the opponent responses to tomnd z are illuminated by direct sunlight. Photographs B and C aataset. Photograph D is one of a time-lapse sequence taken athich was used to take radiometric measurements of the illumineen linearized or gamma corrected for display. In D, thin blueurrounding area defined by the thin red lines.
f less than 0.25% of the mean. Several pictures (at dif-erent exposure durations) were taken of the card’s lowerow of gray squares, and their RGB values were computedy averaging the central part (underexposed and overex-osed values were discarded) and scaled by dividing byhe corresponding integration time. The spectral radiancef the same regions was measured in the range80–760 nm in 10 nm steps using the TopCon radiom-ter, allowing us to relate each sensor’s gray-level outputo a physical measure of the total spectral energy stimu-ating them. The linearity of the camera’s responses as aunction of integration time was corroborated by a set ofhree neutral density filters (0.5, 1.0, and 2.0 log units)hat forced the camera to adopt different shutter speeds
color photographs that we analyze in this paper. Photograph Ax, y, and z are examined later. Note that x is shadowed while yples of the 113 photographs of ripe fruit taken from the Kibale
intervals from dawn till dusk; note the gray card in upper left,ese images are the regular output of the cameras; they have notutline one or more fruits whose pixels were compared with the
itizedatoes
re exam4 minant. Thlines o

wuript
saacstwrtismtomFvirsgr
ut
wcro
t
w
mfb
wa
wmN=F=r
BWcUigftcp
4gsfnwdn
Fcd
Lovell et al. Vol. 22, No. 10 /October 2005 /J. Opt. Soc. Am. A 2063
hen photographing the white target. The data alloweds to characterize the nonlinear relation between sceneadiance and the magnitude of the pixel values inherentn the camera (we did this for the “cloudy” setting) and toroduce inverting functions for each of the RGB sensorshat would linearize the camera output.
The second stage consisted of measuring the cameraensor’s spectral sensitivities by pointing the cameras at
white target (Kodak-Eastman “standard white” cy-noacrylate powder of approximately 99% reflectance,onstant through the visible spectrum) illuminated by theame light source. Images of the target were takenhrough a set of 31 narrowband color filters (10 nm band-idth, Ealing Electronics, Watford, UK) spanning the
ange 400–700 nm. Spectral radiance was measuredhrough the same filters by the TopCon radiometer, mak-ng it possible to determine the camera’s RGB sensor’spectral sensitivities. We used a second-order polynomialodel to map linearized RGB value triplets into LMS
riplets.36–41 This characterization technique differs fromthers in that it allows us to find the optimal colorimetricapping for a given set of reflectances and illuminations.or example, given a typical set of Northern Europeanegetation and soil reflectances42 and naturalllumination,43 it is possible to estimate both the cameraesponse values and the LMS values for the naturalcenes that we investigate. For the Kibale forest photo-raphs we used another database of illuminants andeflectance.44
We computed the LMS output by calculating the prod-ct of the cone sensitivities with half of the samples in ourraining database using
L = ��
l���*Q���*I���, M = ��
m���*Q���*I���,
S = ��
s���*Q���*I���, �1-3�
here l ,m ,s are the Smith and Pokorny27,28 (or starling)one sensitivities, � is the wavelength, Q is the spectraleflectance of the samples, and I is the spectral radiancef the illuminant.
At the same time we calculated the camera’s responseo the same reflectances and illuminations using
ig. 2. (A) Cone sensitivities for humans, scaled to unity. (B) Cones are much closer to one another for humans than they areiffer; they are narrower for the starling.
R = ��
r���*Q���*I���, G = ��
g���*Q���*I���,
B = ��
b���*Q���*I���, �4-6�
here r ,g ,b are the camera’s spectral sensitivities.The predicted camera RGB responses where thenapped to LMS activities using our polynomial trans-
orm, created using the other half of the training data-ase.The relative error of the polynomial transformation
as calculated for each of the samples of the test datasetccording to
Err =��L − L�2 + �M − M�2 + �S − S�2
min��L2 + M2 + S2,�L2 + M2 + S2�, �7�
here L ,M , S represent the mapped cone activities. Theean error (Err) was 0.034 �SD=0.034,n=1095� for theorthern European dataset and 0.016 �SD=0.0159, n783� for the Ugandan dataset for human (unity) cones.or starlings the mean errors were 0.056 �SD=0.05, n783� and 0.01 �SD=0.01,n=1095� for the Northern Eu-ope and Ugandan datasets, respectively.
. Datasetse use two main datasets in our analyses, one of which
onsists of 113 images of fruit taken in Kibale Forest,ganda (Fig. 1(B) and1(C)). This area features in some
mportant studies of optimization of primate vision to fru-ivory and folivory18,19 because of its large population oforaging primates. The images within this dataset wereaken with camera 1. Figure 1(A), taken with the sameamera, is part of the British garden dataset usedreviously.21
The second main dataset is a time-lapse sequence (min intervals) taken from dawn till dusk in a British
arden, in the village of Garndiffaith (South Wales), of acene in which edible fruits have been situated amongstoliage. These were taken with camera 2. Photographsear the beginning or end of the sequence were excludedhere the exposure duration exceeded 2 s since the con-itions were then too dark for the camera to provide aoise-free image. At the same time, the TopCon radiom-
sitivities for the selected starling cones. Note that the L and Mcase of the starling. The bandwidths of the L and M cones also
one senin the

eo1ttcwt
CFwMtn
Isu
Nl
wbvf1at
DTsvarTfwb
3AITtpbsmlnittnchn3(cflwptspcsa
cTtt“jbstncm
BSBnrspSso
tdrab
2064 J. Opt. Soc. Am. A/Vol. 22, No. 10 /October 2005 Lovell et al.
ter was used to make measurements (1–2 min intervals)f the total radiance and of the spectrum (380–720 nm,0 nm intervals) of a 2° patch gray card at the top left ofhe composition (Fig. 1(D)). A time-lapse animation ofhe opponent responses and spectral measurementsan be downloaded from the following website alongith the raw images: http://psy223.psy.bris.ac.uk/george/
imelapse/.
. Modeling and Calculation of Opponent Signalsollowing calculation of the LMS activation at each pixel,e established the opponent activity using theacLeod–Boynton45 formulas. Equations (8)–(10) define
he calculations for the Lum, RG, and BY, opponent chan-els, respectively, as
Lum = L + M, �7��
RG = L/Lum, �8�
BY = S/Lum. �9�
t will be noted that our present formulation of the RGignal [Eq. (9)] is directly proportional to the one we havesed before46,47:
RG = �L − M�/Lum. �8a�
oise within the L, M, and S cones was simulated48 fol-owing estimates derived from reported thresholds43:
n = s* exp�y�, �10�
here s is the L, M, or S signal estimated from our cali-rated cameras; n is the noisy signal; and y is a randomariable with a standard deviation matching the Weberractions for the S, M, and L channels (8.7%, 1.9%, and.8%, respectively, based on a 1° (visual angle) stimulusnd 0.2 s presentation time at the level of 10� absolutehreshold).
. Distinguishing Fruit from Leaveso illustrate how well an opponent signal might helpeparate a fruit from surrounding leaves, we calculate d�alues [Eq. (11)], where the x and y values represent thectivation levels for the signal (fruit) and noise (leafy sur-ound), respectively, in a particular opponent channel.he metric is intended to show how much the signals
rom fruit and background overlap rather than to suggesthether one could tell that a fruit was different fromackground, given enough measurements
d� =�2��x� − �y��
� 2 2. �11�
� �x� + � �y�
. RESULTS. Examining Opponent Channel Activation for Directly
lluminated and Shadowed Fruithe potential role for RG opponency in helping primates
o find ripe fruit is shown in Fig. 3. Figure 1(A) shows ahotograph of tomatoes (some ripe, some not) against aackground of leaves; the scene was illuminated by directunlight, so it contains many shadows [one of the ripe to-atoes (x) is shadowed]. Figures 3(A) and 3(B) show gray-
evel representations of the signals generated in the oppo-ent channels. In both the RG and BY channels, the
ndividual tomatoes are obvious as separate entities, buthe ripe tomatoes are distinguished only from all else inhe RG channel. All ripe tomatoes (whether in shadow orot) have the same RG signal magnitude (solid blackurves Fig. 3(C)). For the BY signals the shadowed tomatoas a signature different from those under direct illumi-ation (Fig. 3(D), solid black curves). The plots in Figs.(E) and 3(F) show the d� value for the ripe fruit regionsx, y, and z) compared to their immediate surround (ex-luding other ripe fruit). Clearly, the d� values are greateror the RG channel than they are for the BY channel, il-ustrating the benefit of the RG channel for frugivory. Buthy has the RG channel performed so well? Clearly therimary reason for the success of the RG channel is thathe system contrasts red and green activity. Another rea-on for the strong performance of the RG system is theroximity of the L and M cones; by having these coneslose to one another the RG opponent channel becomes in-ensitive to variations in illumination, both over time andcross space. This issue is explored in Subsection 3.B.The relatively poor performance of the BY channel
ompared with the RG channel is perhaps unsurprising.he color of the illuminant is not constant, either during
he day (see below) or even within a scene.14,15 The lighthat falls directly on an object in bright sunlight will bewhite” or yellow, but the light falling on shadowed ob-ects will have come from the blue part of the sky or wille reflected from local objects (probably green ones). Con-equently the BY system will respond very differently tohe shadowed fruit compared with the directly illumi-ated fruit. Conversely, the �max values for the L and Mones are so close that their responses to a varying illu-inant will correlate to a very high degree.
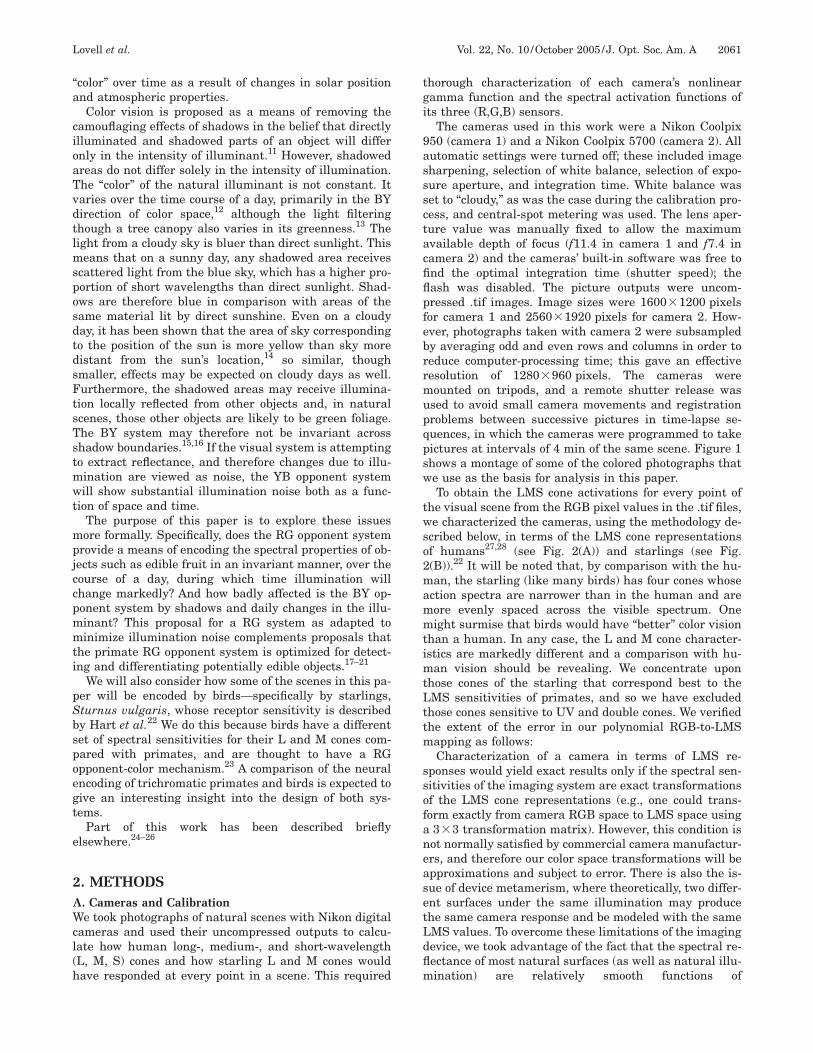
. Changes in the Illuminant During a Dayubsection 3.A has shown that at an instant in time, theY opponent system seems disrupted by spatial disconti-uities in illumination. In this section we look at tempo-al changes in the illuminant and how the BY and RGystems are affected. Figure 4 shows the results of an ex-eriment where we measured the radiance spectrum (seeection 2) of a gray card placed in an open garden; mea-urements were made every 1–2 min from dawn to duskn an autumn day when the weather was mostly cloudy.
Figure 4(A) shows examples of normalized spectra, i.e.,he radiance in each wavelength is divided by the total ra-iance at all wavelengths in a particular recording. T1epresents the spectrum at dawn; here the illuminant has
reddish tint. T2 shows how the illuminant becomesluer as clouds became thicker. Over the course of the day

tdsp(wmf
Btvftcsf
FifBr area in
Lovell et al. Vol. 22, No. 10 /October 2005 /J. Opt. Soc. Am. A 2065
he spectrum of the illuminant has changed substantially,epending on weather conditions and the elevation of theun in the sky. Figure 4(B) shows calculations of how therimate RG chromatic opponent signal from the gray cardsolid curve) and the BY opponent signal (dotted curve)ould have changed. Despite the spectral changes in illu-ination, the RG signal is fairly stable, as we would hope
rom an opponent chromatic mechanism. However, the
ig. 3. Top row, gray-level representations of the activation inmage of tomatoes in Fig. 1(A). Middle row, histograms of pixel aruit; note the largely separate distributions for fruit (black curvY channel the distribution for the shadowed fruit (x) is similar to
egion compared with its surrounding (nonripe fruit and leaves)
Y signal is affected more substantially, which is boundo reduce the likelihood of the BY system producing in-ariant responses from differently colored objects at dif-erent times of day. In contrast to the primate RG signalhe equivalent activation for the bird (dotted-dashedurve) varies to a greater extent because of the greatereparation of the bird L and M cones (standard deviationsor these RG signals were 0.004 for primate and 0.009 for
imate (A) RG- and (B) BY opponent channels calculated for thelevels for the ripe fruit (x, y, z) and the area surrounding eachthe surround (gray curves) in the RG channel [plot (C)]. In the
f its surround [plot (D)]. Bottom row, d� values for each ripe-fruitthe RG channel [(plot E)] and the BY channel [(plot F)].
the prctivity
es) andthat o
bt
CTAmtmottewwrsFttir
(s
T1fsluf(apdmi5fdpgIssc
ae
Fwno
2066 J. Opt. Soc. Am. A/Vol. 22, No. 10 /October 2005 Lovell et al.
ird, while the primate BY signal had a standard devia-ion of 0.034.
. Opponent Encoding of Fruit and Foliage at Differentimes of Dayt the same time these radiance measurements wereade, we took time-lapse photographs with camera 2 of
he scene depicted in Fig. 1(D). The illuminant measure-ents of Fig. 4 are thus a description of the illuminant at
ne location within this scene. From the sequence of pho-ographs, we determined how the luminance signal andhe primate RG and BY chromatic opponent signals gen-rated by each of the fruits would change during the day;e also examined how the bird RG signal from each fruitould change. We also examined the light reflected from a
egion of interest around each fruit—this was a region theame shape as the fruit but with five times the area (seeig. 1(D)). The fruit itself was obviously excluded fromhe surround region of interest, and, where there werewo fruits close together (regions 3 and 6), the neighbor-ng fruit was also excluded from the analysis of the sur-ounding area.
Figure 5(A) shows how the d� scores for the primateblack curves) and starling (gray curves) RG-opponentignals vary as the illuminant changes during the day.
ig. 4. Summary of spectral radiance measures of sunlight durinas 07:50 GMT. (A) Plots of the normalized spectra at T1 and T2ormalized spectra is also shown. (B), The primate RG (solid curf the light reflected from the gray card are plotted against time
he d� scores are shown only for two of the fruit in Fig.(D); the results for the others were similar. The d� scoreor the primate is consistently higher than it is for thetarling. However, note that plums actually reflect UVight so that a starling (with UV-sensitive cones) may wellse this as an added aid to detection. As one would expectrom the stability of the illuminant in RG opponent spaceFig. 4), the d� values for both fruit remain fairly constantll day. By contrast, the d� scores for the tomato in therimate BY-opponent system change markedly during theay, as one might expect given the instability of the illu-inant in BY opponent space (Fig. 4). It is at first surpris-
ng that the d� scores for the plum are so constant. Figure(C) shows how this can be; it plots the actual BY signalsrom plum, tomato, and their leafy surrounds during theay. All signals, especially from the plum, do vary as ex-ected. However, the plum signal and the leafy back-round signal covary so that d� remains roughly constant.n this case, the BY opponent system might allow a con-tant level of detection for the plum, but the changing BYignal would mean that its “color” and identity might beonfused as the illuminant changes during the day.
Figure 6 presents the mean d� score for each fruitgainst its surround over the course of the day. A high av-rage d score could be considered evidence that the op-
day November 23, 2004, in a British garden (Fig. 1(D)); time zeroe times are indicated as vertical lines on (B). The average of the
By (dotted curve) chromatic opponent signals [Eqs. (8) and (9)]tarling RG signal is also plotted (dotted–dashed) curve.
g the; thes
ve) and. The s
�

pflcnaacFiv
DPWgtescaw
“iptpvpfg
sLa7(tiwshmfcsS
EfIh
FsfsnBBs(r
FrfstaTSc
Lovell et al. Vol. 22, No. 10 /October 2005 /J. Opt. Soc. Am. A 2067
onent channel was successful at contrasting the fruitrom the surround areas under many variations of the il-umination. The primate RG signals provide the best dis-rimination, consistently surpassing the starling RG sig-als. The primate BY signals vary more during the day asconsequence of the varying illuminant (see Fig. 3) and
s fruits become illuminated directly or have shadowsast on them. The variation during the day is shown inig. 6 by the sizes of the standard deviation bars which,
n most cases are 2–3 times larger for the (smaller) BY d�alues than for the (larger) RG d� values.
. Opponent Encoding of Fruit and Foliagehotographed in Kibale Foreste performed similar analyses on each of 113 photo-
raphs of fruit taken in Kibale Forest in Uganda.25 Two ofhese photographs are shown as Figs. 1(D) and 1(E). Inach image we traced a region of interest (ROI) around aingle isolated fruit or cluster of fruit; isolated fruits werehosen so comparisons between fruit and the surroundrea would not be confounded by the presence of fruitithin the surround. All pixels within the ROI constituted
ig. 5. Plots (A) and (B) show the d� values for the RG and BYignals, respectively, for a tomato in Fig. 1(D) and for a plum as aunction of the time of day. The d� values for both fruit are verytable in the RG opponent system despite the changes in illumi-ant (see Fig. 4) during the day. The d� values for the plum in theY system are also surprisingly stable. Plot C shows the actualY signals generated from the plum, the tomato, and their leafyurrounds during the day. The BY signals do vary considerablyconsistent with Fig. 4), but the signals from plum and leafy sur-ound co-vary, so that the d value stays fairly constant.
�the fruit.” To give the surround pixels, the fruit ROI wasteratively rescaled and recentered until the number ofixels in the surround region was five times greater thanhat of the fruit region—this operation excluded thoseixels that constituted the fruit. The distribution of signalalues (Lum, RG, or BY) within the fruit region was com-ared with the distribution of corresponding signal valuesrom the surrounding background area (generally ofreen leaves).
For each of the 113 photographs, we calculated d�cores for the primate Lum, RG, and BY channels andum and RG for the starling. Figure 7 summarizes thesenalyses. Clearly the values given by the RG system (Fig.(B)) are much higher than those given by either the LumFig. 7(A)) or the BY (Fig. 7(C)) systems, implying thathe RG system would be substantially better at allowingdentification of food than the other two systems. Thehite blocks in Figs. 7(A) and 7(B) show that putative
tarling Lum and RG systems would behave similarly touman ones. So regardless of species, the RG channel isost successful at achieving a strong separation between
ruit and leafy background. The d� scores for the RGhannel are once again slightly better for primate than fortarling and have a magnitude similar to that reported inubsection 3.D.
. What Factors Led to the Discrepancy in the d� Scoresor the Primate and Starling RG Channel?n all three datasets reported above, the d� scores for theuman RG channel were consistently greater than they
ig. 6. (A) Averaged d� scores for each fruit versus the sur-ounding area in the Lum channel. (B) shows the mean d� scoresor each fruit and surround region, i.e., the leftmost black barhows the average of the topmost trace in Fig. 5. (C) d� scores forhe primate BY channel. Note the y scale for the Lum channel isn order of magnitude smaller than for the RG and BY channels.he error bars represent the standard deviations of the d� scores.olid bars are for primate channels; open bars for starlinghannels.

wmFtf
4dcrcwtdMwbwss
barcpwfagcTtc
4Tfm
Fwcpwgsanto
Fcds
2068 J. Opt. Soc. Am. A/Vol. 22, No. 10 /October 2005 Lovell et al.
ere for the starling RG channel. The starling and pri-ate L and M cones differ in two respects (see Fig. 2):irst the primate cones are more closely spaced, secondhe bandwidths of the action spectra of the cones also dif-er (for the human cones the bandwidth is approximately
ig. 7. 113 photographs of fruits in the Kibale Forest (Uganda)ere analyzed as in Fig. 3. The values of the three opponent
hannels for both human and starling were measured for all theixels within a ROI comprising the outline of a ripe fruit, andere compared with the values in a region of the leafy back-round surrounding the fruit. The bar charts show the mean d�cores for (A) the luminance signal, (B) the RG opponent signal,nd (C) the BY opponent signal. Solid bars are for primate oppo-ent systems; open bars in A and B are for putative starling sys-ems. Note that the y scale for the Lum channel bars is an orderf magnitude smaller than for the BY and RG bars.
ig. 8. Time-lapse photographs were reanalyzed as in Fig. 3 whiones. The d� scores represent the mean d� score for all fruit anifference in d� scores reported for starlings and primates is dupectra.
0 nm while for the starling this is 20 nm). In order to un-erstand the significance of these differences, we havealculated the RG d� scores for all fruit versus surroundegions in the time-lapse photographs while varying theharacteristics of simulated L and M cones whose band-idth and separation could be changed. Action spectra of
he L and M cones were modeled with normal probability-ensity functions using a least-squares fit. The �max of the
cone was fixed at 543 nm while the �max of the L coneas varied from 553–633 nm in steps of 10 nm. Theandwidths of the action spectra of the L and M conesere varied together from 10–80 nm in steps of 10 nm. d�
cores were computed for each combination of L cone po-ition and cone bandwidth.
The d� scores are presented in Fig. 8, along with sym-ols indicating the actual cone action spectra of humansnd starlings. The Fig. 8 surface plot reveals that theelative improvement in d� scores for the human RGhannel over the starling RG channel is due to both theroximity of the L and M cones and to the increased band-idth of the human cones. This simulation was repeated
or the Kibale photo dataset reported in Subsection 3.Dnd the results correlated closely. We estimated the de-ree of error likely in the polynomial transformation ofamera RGB values to the L value of our moving red cone.his error was never greater than 12% for the red cone in
he positions tested [see Eqs. (1–7) for details of the erroralculation].
. DISCUSSIONhe basic question underlying this paper concerns the
unctional roles of the opponent-color systems, both in pri-ates and in a bird species (starling) that has rather dif-
ing the position of the L cone and the bandwidth of the L and Mon pairings over all time intervals. The symbols show how thee distance between the cones and the bandwidth of their action
le varyd regi
e to th

fopbm
c(ntlnist(otaGsas
ohfiposrattdwtwstswsat
fm(ttSecmddipad
tsaihvspiw
onswcdpglsttottstrlr
fsslwtwe
sdttat
ATlE((TcEBSgs
Lovell et al. Vol. 22, No. 10 /October 2005 /J. Opt. Soc. Am. A 2069
erent color vision. When De Valois and his co-workers3,4
btained evidence for the existence of postreceptoral op-onent channels, little was known about the relationshipetween these and the structure of the visual environ-ent and the visual tasks that need to be performed on it.The results presented here suggest a major role for
olor channels in informing the system about materialreflectance) properties of objects. This in itself is not aew story; many others have discussed color vision alonghese lines.11,16,17 Our results are in keeping with a low-evel “cleaning up” of the information incident in the reti-al image: removing shadows, compensating for changes
n illumination, and thus allowing a cleaner object-basedegmentation to be carried out.16 It is worth comparinghis with the shadow problem in lightness perceptionmonochrome vision). Here the work of Gilchrist andthers49,50 suggests that a strategy for removing illumina-ion changes needs to be high level, since it needs to knowbout scene 3D geometry: the “coplanar ratio principle” ofilchrist makes this explicit. On the other hand, color vi-
ion can remove shadows much more simply; see for ex-mple the work of Olmos and Kingdom.16 This in itselfuggests a major role for color information in early vision.
But how is this role distributed between the two color-pponent systems (RG and BY) in primate vision, andow does this vary compared with a different species? Therst point of note here is that the BY system does a sur-risingly imperfect job of removing shadows, since theseften have a blue tint due to the inhomogeneity of solar/ky illumination. The BY system is best thought of as car-ying out an approximate segmentation of the scene intoreas of different spectral reflectance, but this segmenta-ion is confounded with shadow/illumination effects. Itherefore follows that a dichromatic mammal (as most or-ers of mammal are likely to be) will be able to functionell in situations in which light is relatively “flat” and/or
he chromatic target is large/strongly colored. Foragingill work well in simple viewing conditions, but a visual
earch will become less efficient as shadows increase, orarget salience decreases. Also since the output of the BYystem is larger than that of the RG, it will operate betterhen the individual receptors are operating at lower
ignal-to-noise ratios (say at lower luminance levels). Thisbility to work at lower light levels would present advan-ages to an animal foraging primarily at dawn and dusk.
The RG system in primates seems to be much less con-ounded by capricious changes in illumination and will re-ain efficient at such search tasks for much longer, since
in primates at least) it has two important properties thathe BY system does not have. First, it is optimally set upo distinguish edible fruit/leaves from inedible leaves.econd, it ignores shadows and changes in illuminationxcept just after dawn and just before sunset. It is thisombination of properties that gives trichromatic mam-als a foraging advantage. The work presented here pre-
icts that differences in foraging success in primateichromats and trichromats should depend on the type ofllumination prevailing at the time. Indeed, a recent ex-erimental study has shown that trichromatic primatesre more efficient at selecting ripe fruit thanichromats.51
However, we know that primates are not the only crea-
ures with a RG-opponent system. Birds, which have conepectral sensitivities that are different from primate Lnd M cones, also have RG opponency.23 Indeed, we mightnfer that birds would have better color vision than weave, since they have four cone types with narrower acti-ation spectra that are more evenly spaced across thepectrum. However, our conclusions are somewhat sur-rising: In some sense, the even spacing of the cone peakss not always an advantage, nor is the narrower band-idth of the starling cones.How does a bird RG system compare with the primate
ne? Our results suggest that a bird’s RG-opponent sig-als from a single surface would be more confounded byhadows and changes in natural lighting conditions thanould a primate’s. The bird RG is confounded by such
hanges almost as much as the primate’s BY system. Thisifference arises because primate L and M cones haveeak absorptions at very close wavelengths, so thatradual changes over the width of the spectrum will haveess differential effect on the cones. The greater spectraleparation of L and M cones in the starling retina (likehe large spacing of the S cones from the L or M cones inhe primate) has the consequence that invariance to shad-ws and changes in illumination is compromised. Areas ofhe image such as dappled foliage, which appear uniformo a primate RG system, may appear less uniform to atarling RG system. However, we predict that, if one wereo equate the cone capture ratios of a target against a sur-ound for humans and starlings, then humans would beess impaired by the incursion of shadows into the sur-ound in a search task.
Many questions remain to be settled. Are there tasksor which the BY system is particularly good and the RGystem pretty useless? Some data, not presented here,uggest that the discrimination of Rayleigh-scatteredight from direct sunlight (i.e., sky versus solar disk) isell detected by mammalian BY vision. Thus, the detec-
ion of distance over hundreds of meters or more might beell encoded by BY opponent channels. Such work awaitsxperimental verification.
In general, we have provided more questions than an-wers. It is relatively easy to run mathematical models ofetection across images of foliage and fruit; much hardero gather relevant behavioral data. However, we suggesthat the results of this paper provide some indicationsbout the functional role of the peculiar color vision sys-ems in primates and one other species.
CKNOWLEDGMENTShis research was supported by Biotechnology and Bio-
ogical Sciences Research Council (BBSRC) (S11501) andngineering and Physical Sciences Research Council
EPSRC)/Defence Science and Technology LaboratoryDSTL) (RG/S56405/01) grants to D. J. Tolhurst and T.roscianko and by a BBSRC grant (S18903) to T. Tros-ianko and I. Cuthill. P. G. Lovell was supported by thePSRC/DSTL grant, C. A. Párraga was supported by theBSRC grants, and U. Leonards was supported by thewiss National Science Foundation (83R-069377). We arerateful to I. Cuthill and M. Vorobyev for helpful discus-ions. We are also grateful to two referees for their chal-

lABKsGK
ea
R
1
1
1
1
1
1
1
1
1
1
2
2
2
2
2
2
2
2
2
2
3
3
3
3
3
3
3
3
3
3
4
4
4
4
4
2070 J. Opt. Soc. Am. A/Vol. 22, No. 10 /October 2005 Lovell et al.
enging suggestions. We also thank the Ugandan Wildlifeuthority and all the personnel at Makerere Universityiological Field Station in Uganda, especially Johnasenene, its director. Karen Spencer is thanked for as-
isting in the UK time-lapse recording. Finally, we thankeorge Hayward for the use of his garden in the Unitedingdom time-lapse sequences.
Corresponding author P. G. Lovell may be reached by-mail, [email protected]; phone, 44-117-928-8581;nd fax, 44-117-928-8588.
EFERENCES1. K. T. Mullen and F. A. A. Kingdom, “Colour contrast in form
perception,” in The Perception of Colour, P. Gouras, ed.(Macmillan, 1991), pp. 198–217.
2. V. V. Maximov, “Environmental factors which may have ledto the appearance of colour vision,” Philos. Trans. R. Soc.London, Ser. B 355, 1239–1242 (2000).
3. R. L. De Valois, “Analysis and coding of color vision in theprimate visual system,” Cold Spring Harbor Symp. Quant.Biol. 30, 567–580 (1965).
4. R. L. De Valois, I. Abramov, and G. H. Jacobs, “Analysis ofresponse patterns of LGN cells,” J. Opt. Soc. Am. 56,966–977 (1966).
5. R. L. De Valois and K. K. De Valois, “A multistage colormodel,” Vision Res. 33, 1053–1065 (1993).
6. L. M. Hurvich and D. Jameson, “An opponent-processtheory of colour vision,” Psychol. Rev. 64, 384–404 (1957).
7. G. H. Jacobs, “Primate photopigments and primate colorvision,” Proc. Natl. Acad. Sci. U.S.A. 93, 577–581 (1996).
8. T. N. Wiesel and D. H. Hubel, “Spatial and chromaticinteractions in the lateral geniculate nucleous of the rhesusmonkey,” J. Neurophysiol. 29, 1115–1156 (1966).
9. F. M. De Monasterio and P. Gouras, “Functional propertiesof ganglion cells of the rhesus monkey retina,” J. Physiol.(London) 251, 167–195 (1975).
0. D. L. Ruderman, T. W. Cronin, and C. C. Chiao, “Statisticsof cone responses to natural images: implications for visualcoding,” J. Opt. Soc. Am. A 15, 2036–2045 (1998).
1. J. D. Mollon, ““Tho she kneeld in that place where theygrew.” The uses and origins of primate colour vision,” J.Exp. Biol. 146, 21–38 (1989).
2. G. D. Finlayson and S. D. Hordley, “Color constancy at apixel,” J. Opt. Soc. Am. A 18, 253–264 (2001).
3. C. C. Chiao, D. Osorio, M. Vorobyev, and T. W. Cronin,“Characterization of natural illuminants in forests and theuse of digital video data to reconstruct illuminant spectra,”J. Opt. Soc. Am. A 17, 1713–1721 (2000).
4. T. Troscianko and J. P. Harris, “Phase discrimination inchromatic gratings,” Perception 15, A18 (1986).
5. D. Steverding and T. Troscianko, “On the role of blueshadows in the visual behaviour of tsetse flies,” Proc. R.Soc. London, Ser. B 271, S16–S17 (2003).
6. A. Olmos and F. A. A. Kingdom, “A biologically inspiredalgorithm for the recovery of shading and reflectanceimages,” Perception 33, 1463–1473 (2004).
7. M. G. Nagle and D. Osorio, “The tuning of humanphotopigments may minimize red-green chromatic signalsin natural conditions,” Proc. R. Soc. London, Ser. B 252,209–213 (1993).
8. P. Sumner and J. D. Mollon, “Catarrhine photopigmentsare optimized for detecting targets against a foliagebackground,” J. Exp. Biol. 203, 1963–1986 (2000).
9. N. J. Dominy and P. W. Lucas, “Ecological importance oftrichromatic vision to primates,” Nature (London) 410,363–365 (2001).
0. B. C. Regan, C. Julliot, B. Simmen, F. Vienot, P. Charles-Dominique, and J. D. Mollon, “Fruits, foliage and theevolution of primate colour vision,” Philos. Trans. R. Soc.London, Ser. B 356, 229–284 (2001).
1. C. A. Párraga, T. Troscianko, and D. J. Tolhurst,
“Spatiochromatic properties of natural images and humanvision,” Curr. Biol. 12, 483–487 (2002).
2. N. S. Hart, J. C. Partridge, and I. C. Cuthill, “Visualpigments, oil droplets and cone photoreceptor distributionin the European starling (Sturnus vulgaris),” J. Exp. Biol.201, 1433–1446 (1998).
3. D. Osorio, M. Vorobyev, and C. D. Jones, “Colour vision ofdomestic chicks,” J. Exp. Biol. 202, 2951–2959(1999).
4. C. A. Párraga, T. Troscianko, and D. J. Tolhurst,“Performing a naturalistic visual task when the spatialstructure of colour in natural scenes is changed,”Perception 32, Suppl., 168 (2003).
5. T. Troscianko, C. A. Párraga, U. Leonards, R. J. Baddeley,J. Troscianko, and D. J. Tolhurst, “Leaves, fruit, shadows,and lighting in Kibale Forest, Uganda,” Perception 32,Suppl., 51 (2003).
6. T. Troscianko, C. A. Párraga, P. G. Lovell, D. J. Tolhurst, R.J. Baddeley, and U. Leonards, “Natural illumination,shadows and primate colour vision,” Perception 33, Suppl.,45A (2004).
7. V. C. Smith and J. Pokorny, “Spectral sensitivity of color-blind observers and the cone photopigments,” Vision Res.12, 2059–2071 (1972).
8. V. C. Smith and J. Pokorny, “Spectral sensitivity of thefoveal cone photopigments between 400 and 500 nm,”Vision Res. 15, 161–171 (1975).
9. J. A. Endler, “The color of light in forests and itsimplications,” Ecol. Monogr. 63, 1–27 (1993).
0. L. T. Maloney and B. A. Wandell, “Color constancy: amethod for recovering surface spectral reflectance,” J. Opt.Soc. Am. A 3, 29–33 (1986).
1. W. S. Stiles, G. Wyszecki, and N. Ohta, “Countingmetameric object-colour stimuli using frequency-limitedspectral reflectance functions,” J. Opt. Soc. Am. 67,779–784 (1977).
2. L. T. Maloney, “Evaluation of linear models of surfacespectral reflectance with small numbers of parameters,” J.Opt. Soc. Am. A 3, 1673–1683 (1986).
3. J. L. Dannemiller, “Spectral reflectance of natural objects:how many basis functions are necessary?” J. Opt. Soc. Am.A 9, 507–515 (1992).
4. D. H. Foster, K. Amano, and S. M. C. Nascimento, “Coloranisotropy for detecting violations of color constancy innatural scenes under daylight changes,” Invest.Ophthalmol. Visual Sci. 42, Suppl., S720 (2001).
5. E. K. Oxtoby, D. H. Foster, K. Amano, and S. M. C.Nascimento, “How many basis functions are needed toreproduce coloured patterns under illuminant changes?”Perception 31, Suppl., 66 (2002).
6. V. Cheung, S. Westland, D. Connah, and C. Ripamonti, “Acomparative study of the characterisation of colourcameras by means of neural networks and polynomialtransforms,” Coloration Technol. 120, 19–25 (2004).
7. D. Connah, S. Westland, and M. G. A. Thomson,“Recovering spectral information using digital camerasystems,” Coloration Technol. 117, 309–311 (2001).
8. G. Hong, M. R. Luo, and P. A. Rhodes, “A study of digitalcamera colorimetric characterization based on polynomialmodeling,” Color Res. Appl. 26, 76–84 (2000).
9. T. Johnson, “Methods for characterising colour scannersand digital cameras,” Displays 16, 183–191 (1996).
0. M. Shi and G. Healey, “Using reflectance models for colorscanner calibration,” J. Opt. Soc. Am. A 19, 645–656(2002).
1. S. Westland and C. Ripamonti, Computational ColorScience Using Matlab (Wiley, 2004).
2. J. Parkkinen, T. Jaaskelainen, and M. Kuittinen, “Spectralrepresentation of color images,” presented at the IEEE 9thInternational Conference on Pattern Recognition, Rome,Italy, November 14–17, 1988.
3. G. Wyszecki and W. S. Stiles, Color Science: Concepts andMethods, Quantitative Data and Formulas (Wiley, 1967),pp. xiv, 628.
4. P. Sumner, B. C. Regan, and J. D. Mollon, “Cambridge

4
4
4
4
4
5
5
Lovell et al. Vol. 22, No. 10 /October 2005 /J. Opt. Soc. Am. A 2071
database of natural spectra” (2004); http://vision.psychol.cam.ac.uk/spectra/.
5. D. I. A. MacLeod and R. M. Boynton, “Chromaticitydiagram showing cone excitation by stimuli of equalluminance,” J. Opt. Soc. Am. 68, 1183–1187 (1979).
6. C. A. Párraga, G. Brelstaff, T. Troscianko, and I. R.Moorhead, “Color and luminance information in naturalscenes,” J. Opt. Soc. Am. A 15, 563–569 (1998).
7. C. A. Párraga, T. Troscianko, and D. J. Tolhurst, (2000).“The human visual system is optimised for processing thespatial information in natural visual images,” Curr. Biol.
10, 35–38 (2001).8. M. Vorobyev, [email protected] (personalcommunication, 2005).
9. A. Gilchrist, “Perceived lightness depends on perceivedspatial arrangement,” Science 195, 185–187 (1977).
0. A. Gilchrist and V. Annan, “Articulation effects inlightness: historical background and theoreticalimplications,” Perception 31, 141–150 (2002).
1. A. C. Smith, H. M. Buchanan-Smith, A. K. Surridge,D. Osorio, and N. I. Mundy, “The effect of colourvision status on the detection and selection of fruits bytamarins (Saguinus spp.),” J. Exp. Biol. 206, 3159–3165
(2003).