eeeeeeeeeeeee
34
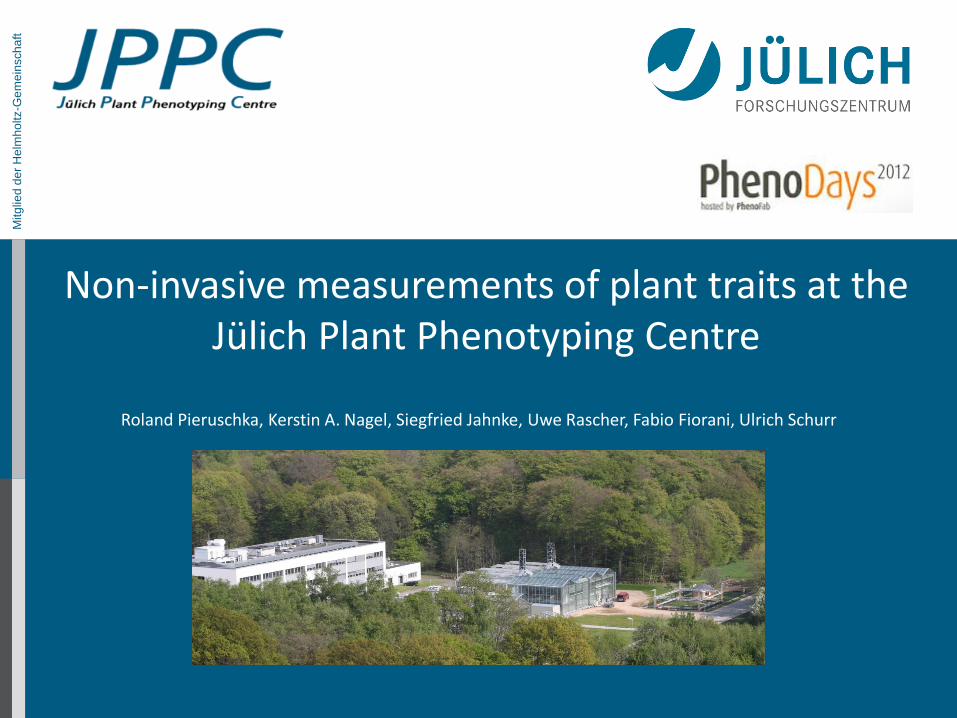
Mitglied der Helmholtz-Gemeinschaft Non-invasive measurements of plant traits at the Jülich Plant Phenotyping Centre Roland Pieruschka, Kerstin A. Nagel, Siegfried Jahnke, Uwe Rascher, Fabio Fiorani, Ulrich Schurr
-
Upload
shrub-madcap -
Category
Documents
-
view
213 -
download
0
description
rrrrrrrrrrrrrrrrrr
Transcript of eeeeeeeeeeeee
Mitg
lied
de
r H
elm
ho
ltz-G
em
ein
sch
aft
Non-invasive measurements of plant traits at the Jülich Plant Phenotyping Centre
Roland Pieruschka, Kerstin A. Nagel, Siegfried Jahnke, Uwe Rascher, Fabio Fiorani, Ulrich Schurr
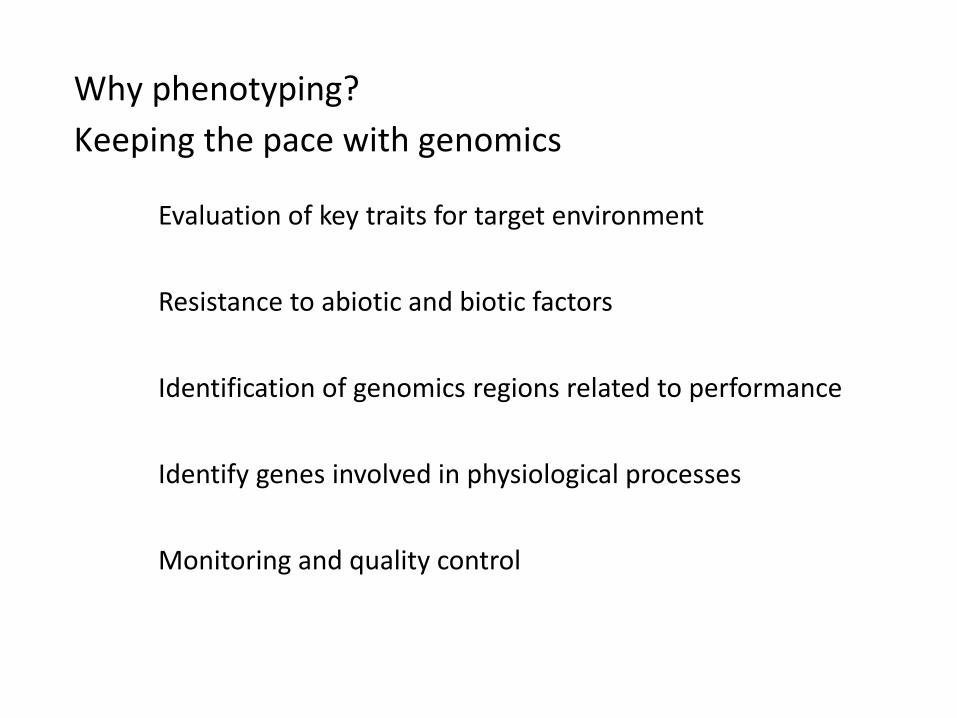
Why phenotyping?
Keeping the pace with genomics
Evaluation of key traits for target environment
Resistance to abiotic and biotic factors
Identification of genomics regions related to performance
Identify genes involved in physiological processes
Monitoring and quality control

Plant phenotyping science requires integrated solutions

IMAGING AND ROBOTICS Automation and Integration Quantitative Image Analysis
SPECIALIZED PLANT GROWTH FACILITIES UV-transparent greenhouse Automated growth chambers Field positioning systems
DATA MANAGEMENT Environment Data Base Plant Information System
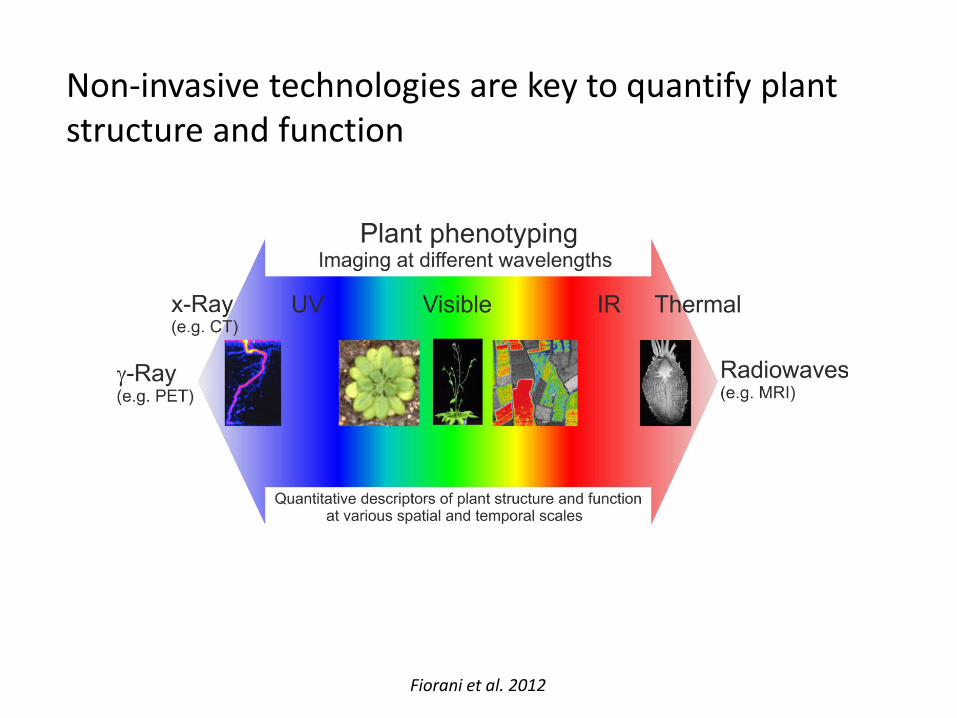
Non-invasive technologies are key to quantify plant structure and function
Fiorani et al. 2012
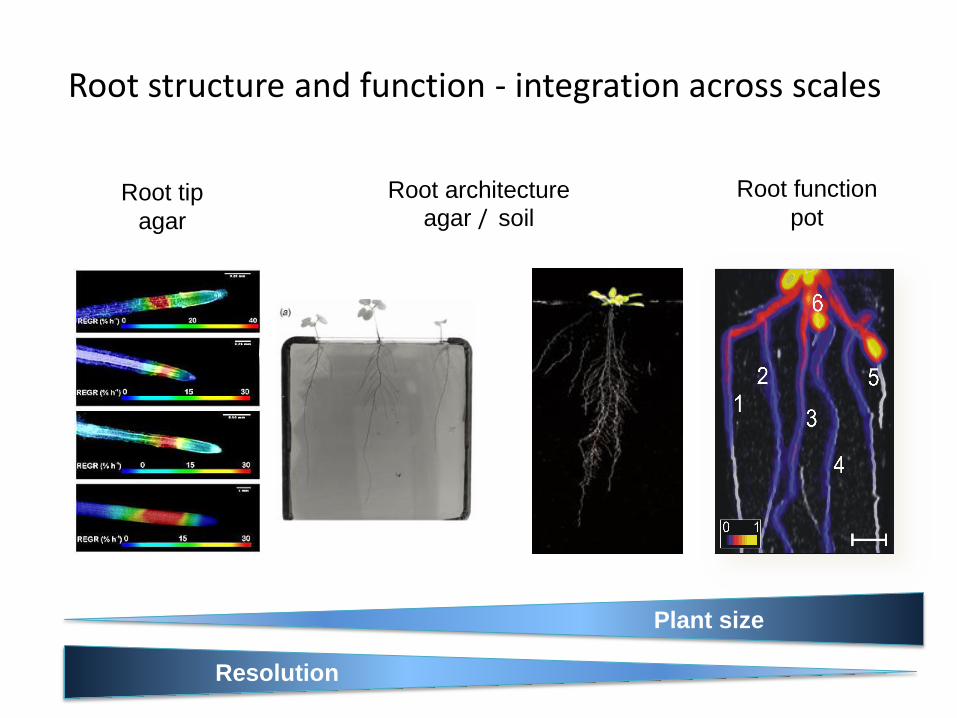
Plant size
Root tip
agar
Root architecture agar / soil
Resolution
Root function
pot
Root structure and function - integration across scales

throughput: 300 plants – 12 min
Quantification of root architecture in agar
Nagel et al. 2009
Arabidopsis Small seedlings
• Nutrients (N, P) • Temperature • Osmotic
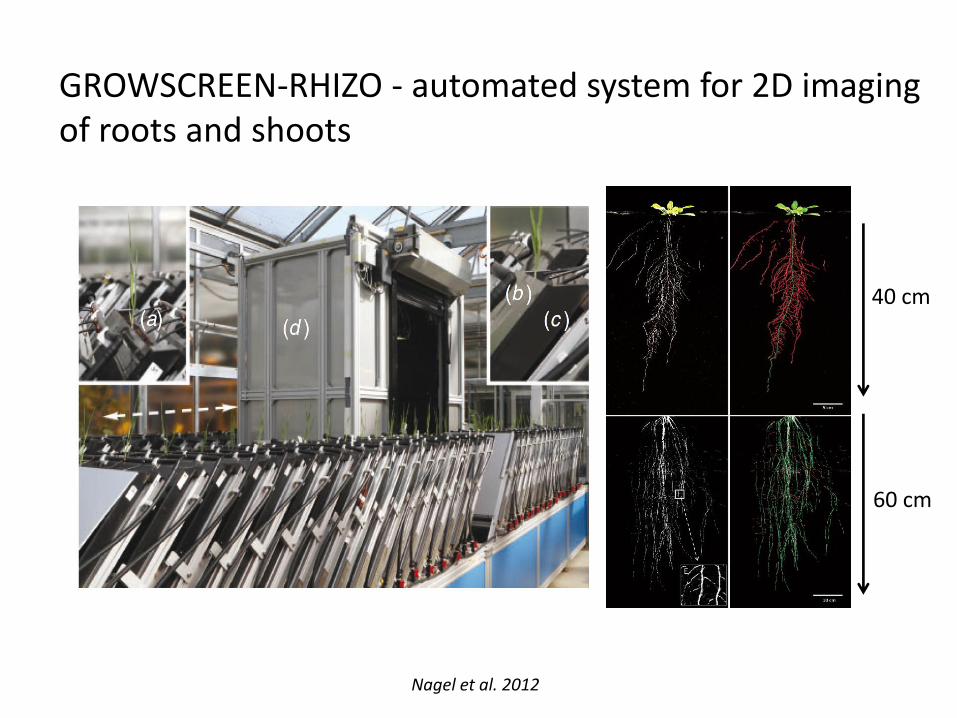
GROWSCREEN-RHIZO - automated system for 2D imaging of roots and shoots
40 cm
60 cm
Nagel et al. 2012
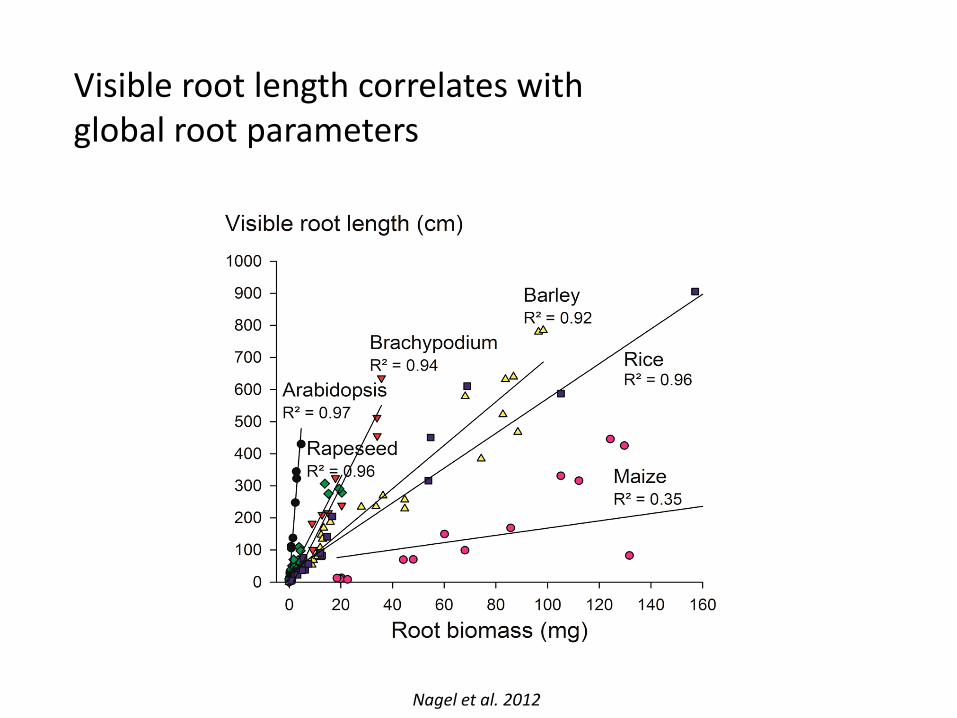
Visible root length correlates with global root parameters
Nagel et al. 2012

Correlation with average root diameter?
Plant species Ratio visible / total
root length
Arabidopsis 77%
Rapeseed 42%
Barley 33%
Wheat 33%
Rice 32%
Brachypodium 24%
Maize 17%
Nagel et al. 2012

Root mass distribution
Time (days after sowing)
24 26 28 30 32 34 36 38 40 42 44 46
Ro
ot
ma
ss (
%)
0
20
40
60
inner half (50% of volume)
outer part (20% of volume)
Mean ±SD, n = 6
Pot size matters - barley root mass distribution in a pot
Poorter et al. 2012
Root mass %

4.7T
11CO2
CYPRES Cyclotron for Plant Research
1.5T
MRI Magnetic Resonance Imaging
PET Positron Emission Tomograph
MRI-PET combining structure and functuion

Jahnke et al. 2009
MRI PET Coregistration
MRI-PET insight into carbon flow

Shoot structure and function - integration across scales
Leaf and plant Greenhouse and field

Growth and chlorophyll fluoroescence of Arabidopsis
Jansen et al. 2009
Time (d a.s.)
15 20 25 30 35 40 45 50 55
Qu
an
tum
yie
ld
0.30.40.50.6
0.7
0.8
Time (d a.s.)
15 20 25 30 35 40 45 50 55
AP
T (
cm
²)
5
10
15
20
25
30
35
40
minimal nutrient soil
normal nutrient soil
Projected Leaf Area (cm²)
Quantum Yield

• Biomass (image based)
• Biomass (micro wave based)
• Geometric parameters
• Transpiration
SCREEN House phenotyping of plants with different size and structure

Automated field positioning systeme
Plückers et al. 2012
FieldScreen (developed at FZJ IBG-2 in 2009)
• an outdoor field system for automated and
repeated optical measurements over canopies
• the system consists of a large 4 meter high
computer-programmable x-y-moving stage
equipped with diverse sensors

Remote measurement from a distance up to 50 m Laser Induced Fluorescence Transient (LIFT) approach
ETRA / PPFD
0.0 0.1 0.2 0.3 0.4 0.5
F F
m'-1
0.0
0.2
0.4
0.6
0.8
PAM (X. strumarium)
LIFT (H. annuus)
LIFT (Ph. vulgaris)
LIFT (Citrus spec.)
PAM: y=2.236x+0.024
R²=0.993
LIFT: y=1.373x-0.021
R²=0.947
(A)
ETRA [µmol m-2
s-1
]
0 50 100 150
ET
RP
AM &
ET
RLIF
T [µ
mol m
--2 s
-1]
0
50
100
150 (B)
Pieruschka et al. 2010

W E
6:00 8:00 10:00 12:00 14:00 16:00 18:00
20:00 22:00 6:00 8:00 10:00 12:00 14:00 16:00
0.10 – 0.90
LIFT based maps of diurnal dynamics of photosynthetic
efficiency in a tree canopy
Nichols et al. 2012

Solar and earth atmosphere is a spectrally selective filter
Two oxygen bands are at the spectral region for fluorescence retrieval
Sun-induced fluorescence
https://sites.google.com/site/jamestuttlekeane/astronomy/physics

Sun-induced fluorescence retrieval concept
slope:
reflectance
intercept:
fluorescence
Fluorescence retrieval according to the Fraunhofer Line Depth (FLD) method
Rascher & Damm 2010, Meroni et al. 2009

Sun-induced fluorecence can be mapped in the field giving new insight into canopy energy conversion
Rascher et al. 2009

Imaging spectroscopy in the field
Specific wavebands are characteristic
for plant constituents
Non-invasive monitoring of seasonal
and variety specific traits
Rascher & Damm 2010, Fiorani et al. 2012, Jansen et al. in press

Deapth (disparity) map
Leaf orientation
NDVI PRI
Stereo plus multispectral reflectance imaging: quantification of canopy structure and function
Fiorani et al. 2012
1. Phenotyping requires systematic approaches
2. Phenotyping ‘chains’ to bridge between lab and field
3. Relevant environmental conditions are crucial
4. Multi-mode - multi-scale - multi-disciplinary
26
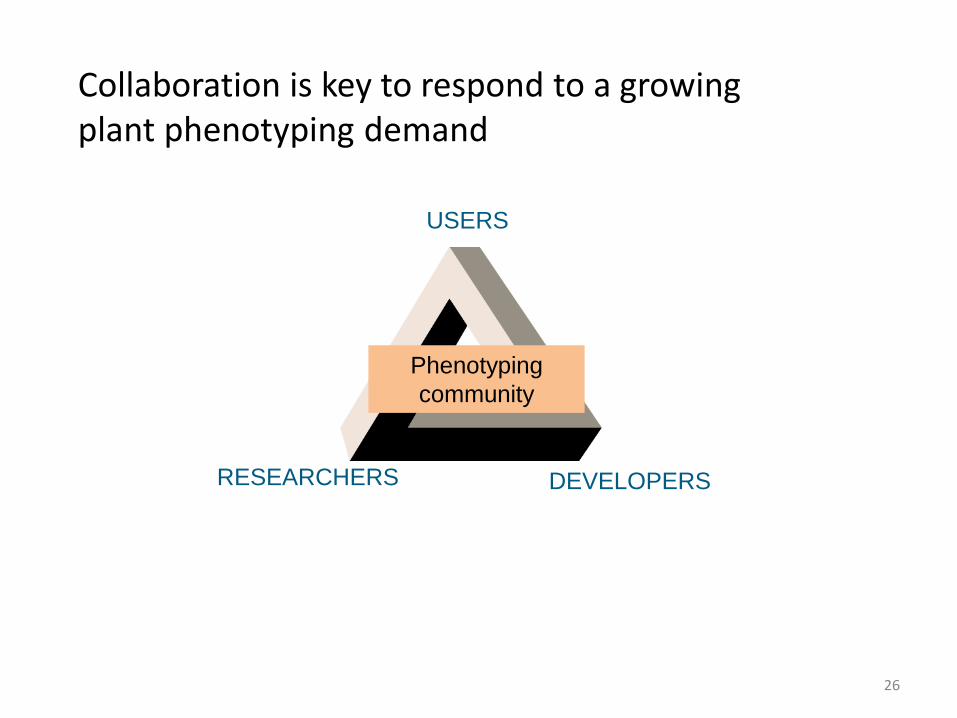
Phenotyping
community
USERS
DEVELOPERS RESEARCHERS
Collaboration is key to respond to a growing plant phenotyping demand
Phenotyping – a networking approach
Phenotyping projects coordinated by JPPC

Goals:
Create a European integrated network
Provide Tansnational Access for the user community
Develop novel instrumentation for non-invasive methods
Establish definition of standards
Duration: January 2012 – December 2015
Budget: 5 500 000 €
EPPN is the first integrated FP 7 EU
Research Infrastructure project
in Plant Sciences
Grant Agreement No. 284443.

The EPPN consortium consists of 14 Partners

FZJ IPK HMGU INRA UNOTT HAS ABER
Transnational Access
23 facilities across Europe open for access:
free of charge
simple selection procedure
1. Screen Chamber
2. Screen House
3. ScreenRoot LP
4. Screen Root SP
5. APPP
6. MP
7. ExpoScreen
8. SunScreen
9. Phenopsis
10. Phenodyn
11. PPHD
12. Diaphen
13. MicroCT
14. Root Trace
15. Screen Glasshouse
16. Vertical Confocal
17. Screen Field
18. RSDS
19. SSDS
20. FTIR/NMR
21. IPC
22. Micro Raman
23. TGA-py GC/MS

Transnational Access call is permanently open
for 23 facilities across Europe
Several workshops and summer schools
will be organized
Standards and protocols will be accessible
Contact information
Resources: www.plant-phenotyping-network.eu

JPPC in the national and international framework
Transnational access Root resource use efficiency in cereals
PREBREED YIELD Sensor technology for crop breeding and management
Nested association mapping in canola
Building a national plant phenotyping platform
Worldwide network

Mitg
lied
de
r H
elm
ho
ltz-G
em
ein
sch
aft