EDUCATIONAL FACILITIES PLANNING: A SYSTEMS …media.cefpi.org/EFP_SystemsModel.pdf · ·...
315
EDUCATIONAL FACILITIES PLANNING: A SYSTEMS MODEL by Frederick Story Withum III Submitted in partial fulfillment of the requirements for the degree Doctor of Education Interdisciplinary Doctoral Program for Educational Leaders School of Education Duquesne University December, 2006
Transcript of EDUCATIONAL FACILITIES PLANNING: A SYSTEMS …media.cefpi.org/EFP_SystemsModel.pdf · ·...

EDUCATIONAL FACILITIES PLANNING: A SYSTEMS MODEL
by
Frederick Story Withum III
Submitted in partial fulfillment of
the requirements for the degree
Doctor of Education
Interdisciplinary Doctoral Program for Educational Leaders
School of Education
Duquesne University
December, 2006


iii
Copyright
By
Frederick Story Withum III
2006

iv
ABSTRACT
Utilizing a primarily experiential literature base, a thematic analysis of text and a
synthesis of literature from education, educational administration, architecture, and
organizational sociology, a systems model of public educational facilities planning was
developed. The model represents a theoretical construct from which design professionals
and educators can better organize, understand, analyze, communicate, and research
complex cause-effect relationships that occur when educational facilities are designed
and constructed. The Systems Model for Planning of Educational Facilities attempts to:
(1) identify and describe complicated social, cultural, political, and economic
mechanisms at work when public schools are designed and constructed in a pluralistic
democratic society, (2) make understandable the relationships between those mechanisms
and educational facility planning, and (3) formalize causal inferences between social,
cultural, political, and economic mechanisms, educational facility planning, and
educational facilities. The goal of this study was to determine the validity of the Systems
Model for Planning of Educational Facilities. In order to accomplish determine the
validity of the Systems Model for Planning of Educational Facilities a sequential
transformative research design, grounded in the pragmatic tradition, was employed. A
sequential transformative research design capitalizes on concurrent quantitative and
qualitative data collection as a means to offset the weakness inherent within one
methodology with the strengths of the other methodology. The research design
maximized leverage over the complexity of the systems model and provided the greatest
opportunity to make generalizations to other contexts and settings. In order to examine
the cohesiveness and validity of the Systems Model for Educational Facilities Planning

v
the research design necessitated a three-tiered approach. The first tier utilized aggregated
and disaggregated data from a quantitative survey of 501 educators employed at fifteen
middle schools constructed between 1990 and 2002 in the Commonwealth of
Pennsylvania. The second tier of the study utilized data from a comparative case study of
four purposefully selected middle schools. The four schools, each significantly different
from the other fourteen in the sample, were selected from the fifteen schools surveyed
during the first tier of the study. The third tier of the study utilized the quantitative and
qualitative data from the first two tiers in order to cross-validate the findings of the other.
Quantitatively across the aggregated and disaggregated data, qualitatively across a
comparative case analysis, and further supported by a cross-validation of the data from
both methodologies, the Systems Models for Educational Facilities Planning was found
to be cohesive and valid.

vi
TABLE OF CONTENTS
Chapter
I. Introduction and Overview ......................................................................................1
Background..............................................................................................................1
Significance of the Problem.....................................................................................3
Developing the Research Base.................................................................................4
Limitations and Assumptions of Related Literature ................................................6
Limitations and Assumptions of the Theoretical Construct ....................................7
Limitations of the Research Design.......................................................................11
Researcher Bias......................................................................................................13
Definitions..............................................................................................................14
II. Literature Review...................................................................................................19
Introduction............................................................................................................19
Developing the Research Base – Phase 1 ..............................................................19
Developing the Research Base – Phase 2 ..............................................................26
Developing the Research Base – Phase 3 ..............................................................32
III. Methodology..........................................................................................................44
Research Tradition .................................................................................................44
Selection of Research Design ................................................................................46
Research Parameters ..............................................................................................49
Research Design – Phase 1 ....................................................................................51
Determining the Validity of the Systems Model Through Univariate
Analysis and Multiple Regression .........................................................................54

vii
Research Design – Phase 2 ....................................................................................65
Selection of Sites for Comparative Analysis – Tier 1............................................68
Selection of Sites for Comparative Analysis – Tier 2............................................71
Qualitative Comparative Analysis .........................................................................72
Cross-Validation ....................................................................................................76
IV. Analysis of Data.....................................................................................................77
Introduction............................................................................................................77
Quantitative Data: Survey Information and Results .............................................79
Survey Results: Educational Vision.......................................................................90
Survey Results: Management of Variables Within Domains of Planning.............93
Survey Results: Management of Variables Across Domains of Planning.............97
Survey Results: Supposition I................................................................................98
Supposition I: A Descriptive Analysis.................................................................100
Supposition I: Regression Analysis .....................................................................104
Survey Results: Supposition II ............................................................................105
Supposition II: A Descriptive Analysis ...............................................................106
Supposition II: Regression Analysis....................................................................108
Qualitative Data ...................................................................................................109
Selection of Schools for Comparative Case Study ..............................................110
ANOVA and Post Hoc (LSD) Analysis...............................................................111
Profile of Selected Schools for Comparative Case Study....................................115
Comparative Case Studies ...................................................................................123
School Twelve .....................................................................................................125

viii
Findings of Twelve ..............................................................................................143
School Fifteen ......................................................................................................153
Findings of Fifteen...............................................................................................171
School Nine..........................................................................................................182
Findings of Nine ..................................................................................................199
School Ten ...........................................................................................................209
Findings of Ten ....................................................................................................228
V. Discussions and Recommendations.....................................................................236
Significance of Problem.......................................................................................236
Purpose and Goal of the Study.............................................................................236
Research Tradition and Design Parameters .........................................................237
Research Method .................................................................................................239
Maximizing Leverage over the Complexity of the Model...................................239
Primary Suppositions of the Systems Model for Educational
Facilities Planning................................................................................................240
Summary of Findings: Supposition I ...................................................................241
Summary of Findings: Supposition II..................................................................243
Interpretation of Quantitative Results..................................................................245
Quantitative Conclusion.......................................................................................247
Qualitative Analysis.............................................................................................248
Summary of Qualitative Findings........................................................................253
Interpretation and Cross-Verification School 12 .................................................253
Conclusions of 12 ................................................................................................258

ix
Interpretation and Cross-Verification School 15 .................................................259
Conclusions of 15 ................................................................................................263
Interpretation and Cross-Verification School 09 .................................................264
Conclusions of 09 ................................................................................................269
Interpretation and Cross-Verification School 10 .................................................270
Conclusions of 10 ................................................................................................273
Conclusions of Study ...........................................................................................274
Model Revisions Based on Study ........................................................................275
Recommendations for Further Research..............................................................279
Recommendations for Practice ............................................................................280
References............................................................................................................282
Appendices...........................................................................................................289

x
LIST OF TABLES
Table Page(s)
1. Topology of Planning Models .................................................................................23
2. Truth Table One ......................................................................................................57
3. Truth Table Two......................................................................................................58
4. Truth Table Three................................................................................................... 59
5. Truth Table Four .................................................................................................... 60
6. Truth Table Five..................................................................................................... 61
7. Truth Table Six....................................................................................................... 62
8. Truth Table Seven .................................................................................................. 63
9. Truth Table Eight ................................................................................................... 64
10. Cronbach’s Alpha Scores ....................................................................................... 81
11. Demographics of Survey Participants .................................................................... 84
12. Summary of Survey Statements/Questions and Analysis ...................................... 88
13. Summary of Mean Responses of Critical Components of the Systems Model…...92
14. Schools Ranked High to Low: Vision.................................................................... 93
15. Schools Ranked High to Low: Mean of Six Domains ........................................... 96
16. Schools Ranked High to Low: Mean of Interaction of Variables .......................... 98
17. Schools Ranked High to Low: Physical Representation of Vision .......................100
18. Summary of Differences Between Min/Max of Critical Variables.......................103
19. Supposition I Regression Model ...........................................................................105
20. Schools Ranked High to Low: Facility Meets Needs............................................106
21. Summary of Differences Between Min/Max: Physical Rep. and Meets Needs....108

xi
22. Supposition II Regression Model ..........................................................................109
23. ANOVA of Four Schools for Comparative Case Study........................................112
24. Post Hoc (LSD): Educational Vision ....................................................................113
25. Post Hoc (LSD): Mean of Means of Six Domains................................................113
26. Post Hoc (LSD):Interaction of Variables ..............................................................114
27. Post Hoc (LSD): Facility is Phys. Rep. of Vision .................................................114
28. Post Hoc (LSD): Facility Meets Need...................................................................115
29. Comparison of Characteristics of Schools in Sample ...........................................118
30. Summary of Characteristics of Schools in Sample ...............................................120
31. Comparison of Schools Selected for Comparative Case Study ............................121
32. Summary of Characteristics of Schools and School Districts Selected for
Comparative Study...............................................................................................122
33. Tier One and Two Selection Data for School 12 ..................................................150
34. Ranked Mean Responses for School 12 ................................................................151
35. Summary of Survey Responses and Analysis for School 12 ................................152
36. Tier One and Two Selection Data for School 15 ..................................................179
37. Ranked Mean Responses for School 15 ................................................................180
38. Summary of Survey Responses and Analysis for School 15 ................................181
39. Tier One and Two Selection Data for School 09 ..................................................206
40. Ranked Mean Responses for School 09 ................................................................207
41. Summary of Survey Responses and Analysis for School 09 ................................208
42. Tier One and Two Selection Data for School 12 ..................................................233
43. Ranked Mean Responses for School 12 ................................................................234

xii
44. Summary of Survey Responses and Analysis for School 12 ................................235
45. Cross-Validation Table: School 12 .......................................................................258
46. Cross-Validation Table: School 15 .......................................................................263
47. Cross-Validation Table: School 12 .......................................................................268
48. Cross-Validation Table: School 12 .......................................................................273

xiii
LIST OF FIGURES
Figure Page
1. Concept Map: Educational Facilities Planning. An Analysis
and Synthesis of Literature From Education, Educational
Administration, Architecture, and Organizational Sociology .............................. 30
2. Educational Facilities Planning: A Systems Model.............................................. 39
3. Research Design.................................................................................................... 52
4. Articulation of Educational Vision v. Degree to Which Facility
is a Physical Representation of the Educational Vision ....................................... 70
5. Graph: Distribution of Schools on Tier One Variables ........................................ 111
6. Revised Systems Model for Educational Facilities Planning ............................... 278

xiv
For my family, especially my grandfather, father, sons, and my wife.
For James A. Ryland, a mentor and friend who exemplifies what all great teachers strive
to be…trusted, respected, and caring.
For the teachers who have nurtured me as a student, and the faculty, administrators,
and staff who I have worked beside, especially the administrative team of the
South Middleton School District, the faculty and staff of
Yellow Breeches Middle School, and Boiling Springs High School.
Most of all, for the students of the South Middleton School District who I have learned
more from than I have ever taught. My hope is that your children, grandchildren, and
their children will have the time of their lives attending joyous schools where the
freedoms of this country pass from generation to generation.

1
CHAPTER I
INTRODUCTION AND OVERVIEW
Background
American schools are facing tremendous pressure from three very dramatic
forces. Shifting population demographics, the deteriorating condition of American
educational facilities and rapid societal and technological changes are challenging the
American public’s long held beliefs about its schools. In response to the challenges, both
educators and architects have endeavored to determine how twenty-first century
educational facilities should be designed, respond to the needs of learners, and interact
with the community.
The recognition by both educators and architects of the importance of this
endeavor has resulted in an ongoing collaboration between the two professions. Over the
last decade, this collaboration, as evidenced in a historical review of the literature, has
become so vital to educational facilities planning that it has given rise to a single
intertwined branch of architecture and education. Educators, architects, engineers,
interior designers, artists, and environmentalists have converged on this new branch of
architecture and education, and collectively represent a contemporary group of
professionals who specialize in planning and designing educational facilities.
Throughout the 1990s and the initial years of this century, the marriage of
architecture and education, and the new group of design professionals that it yielded,
resulted in an expanded body of knowledge pertaining to: (1) the relationship between
educational facilities, teaching, and learning, (see for example, Earthman and Lemasters,
1997), (2) the design and construction of educational facilities (see for example, Castaldi,

2
1994), and (3) the social, cultural, and physical roles that an educational facility plays in
the community (see for example, the U.S. Department of Education [USDE], 2000).
Through the support of the American public, the expansion of information related
to the design and construction of educational facilities has been substantially increased.
A nationwide survey published in 1999 on the infrastructure of America demonstrated
clear consensus regarding the importance of improving “the infrastructure of education”
(Luntz Group, 1999). Two-thirds of those polled expressed that they would be willing to
pay more in taxes to “ensure we have modern schools that are safe and healthy” (Luntz
Group, 1999). Since that report, Americans have corroborated the findings by investing
record amounts into school construction. In 2004, school districts invested a record
$28.64 billion in school construction. This single year investment in educational
facilities is, to date, the largest in the history of American schools (Argon, 2005).
With increasing physical, social, and technological pressures on a clearly
deteriorating educational infrastructure, with a greater understanding of the role that
educational facilities play in teaching, learning and the community, and with the
American public clearly in support of improving our schools, one would consider it a
foregone conclusion that American schools are being renovated, modernized, or replaced
in order to better meet the needs of children and communities they serve. In reality,
modernizing the American educational infrastructure is an issue that is dividing
communities across the country. Educators, design professionals, citizens, and
government officials often find themselves at odds when debating large capital
improvement projects. Joe Perkins, the President of the American Association of Retired
Persons (AARP), highlighted the rifts caused by large capital improvement projects for

3
school districts when he stated: “Schools should be a point of unity; not division between
and among the generations” (USDE, 2000). The divisions among those responsible for
renovating, modernizing, or replacing American public schools often result in poorly
conceived capital improvement projects. As Hamity and Lines point out, “Unfortunately,
all too often schools have been designed that failed to respond to the school districts’
present, let alone their future educational needs” (1999).
What is disconcerting about this dilemma is how a review of the literature reveals
that educators and design professionals, backed by a decade of intense efforts, have
demonstrated that they can, regardless of pedagogical philosophy or an architectural
school of thought, design and build successful educational facilities.
Significance of the Problem
The contrast of a sound base for knowledge and the apparent failures of newly
constructed educational facilities, raises the central research question of this work:
If educators and design professionals have demonstrated the ability to design and
construct educational facilities that meet the needs of children and the
communities that they serve, what are the variables that intervene when they fail
to do so?
This question is far easier proposed than answered.
Over the last two decades the literature base in educational facility planning has
expanded greatly. However, this particular base remains predominantly experiential—
not experimental. The experimental portion of this base for literature focuses almost
exclusively on the relationships between educational facilities and learning. Although
this research provides empirical justification for the record expenditures for American

4
educational facilities, there remains, in comparison to the investment being made, little
comprehensive, research-based resources and materials which fully describe the
dynamics of the public school facility planning.
Nearly fifteen years ago on the absence of experimental data from the literature,
Harold Coffey wrote, “There are insufficient amounts of comprehensive, research-based
resources and materials for public school facility planning” (1992). In that same year,
Glen Earthman wrote, “Resources are limited in guiding administrators through the
planning process. The majority of the texts and journal articles written about school
facilities and the process of planning, designing, and constructing them rely heavily on
descriptions of what the buildings should look like and typically do not spend a great deal
of time describing the planning process” (1992). Fourteen years later, a review of the
base for this literature continues to find these observations true.
Developing the Research Base
Early in the development of this study, it became evident that it was necessary to
deal with the void in the research base, the complexity of the environment in which
public schools are planned, and any concerns regarding the empirical assessment of
schools as organizations. Therefore, a construct which endeavored to delimit and
explain in a systematic way, complex patterns, interactions, and relationships between the
physical, social, pedagogical, cultural, and economic components of educational facilities
planning was needed. However, such a construct does not exist, nor does a broad
empirical base for research on which such a construct could be built. As a result, a
theoretical construct needed to be developed from which design professionals and
educators can better organize, understand, analyze, communicate, and research complex

5
cause-effect relationships that occur when educational facilities are designed and
constructed. In order to meet this goal, it is necessary to: (1) identify and describe
complicated social, cultural, political, and economic mechanisms at work whenever
public schools are designed and constructed in a pluralistic democratic society, (2)
understand the relationships between these mechanisms and educational facility planning,
and (3) validate a model which formalizes causal inferences between social, cultural,
political, and economic mechanisms, educational facility planning, and educational
facilities.
A thematic content analysis of text was completed in order to develop a unifying
theoretical construct of educational facilities planning. The purpose of a thematic
analysis of text is to identify major themes and ideas within a set of documents (Trochim,
2001). The documents analyzed for this study encompassed a detailed review of texts,
journals, and internet sources that related to all aspects of educational facilities and
educational facilities planning. To bolster this conceptual framework and provide a
sound base for which it could be grounded on, it was also necessary to review, analyze,
and synthesize literature from education, educational administration, architecture, and
organizational sociology. This process is known as casing.
The processes of thematic analysis and casing led to the development of nine
suppositions. These nine suppositions established categories of practices in educational
facility planning, relevant patterns of planning within the categories of planning, and
grounded with a synthesis of literature from architecture, education, and organizational
sociology. Melded together, these suppositions constitute a systems model designed to

6
serve as a unifying theoretical construct, and illustrates the dynamic processes which take
place when American public schools are designed and constructed.
To return to the central research question of this study, it asks: If educators and
design professionals have demonstrated the ability to design and construct educational
facilities that meet the needs of children and the communities they serve, what are the
variables that intervene when they fail to do so? The answer to this question, established
by the systems model, would state that:
An educational facility which fails to meet the needs of its stakeholders is the
result of educators and design professionals who failed to manage the dynamics of
the planning environment. As a result, they did not obtain the support, services,
and/or materials necessary to design and construct an educational facility that is a
physical representation of a clearly articulated educational vision.
The validity of the answer established by the systems model, and in turn, the validity of
the system model itself, is the basis for this study. The research methodology is designed
to collect quantitative and qualitative evidence across multiple cases of public school
facility planning in order to validate or invalidate the model.
Limitations and Assumptions of Related Literature
As previously stated, after a decade of effort, educators and design professionals
have greatly expanded the body of knowledge pertaining to educational facilities. This
expanded body of knowledge, however, remains largely experiential or perceptual, and
not experimental. There remains little comprehensive, research-based resources and
materials which describe the planning process for educational facilities. The absence of
experimental research is a limitation, but also a guiding factor in this study.

7
Limitations and Assumptions of the Theoretical Construct
All literature on educational facility planning from the past decade, whether
experiential or experimental, addresses one or more of four elements. These elements
are: (1) the structure and nature of the organization for which planning occurs, (2) the
environment in which planning takes place, (3) the purpose and method for planning, and
(4) the architectural product which results from the planning. In order to define a
framework and parameters for this study, it is necessary to develop well-grounded and
defendable assumptions with regard to each of these elements. To accomplish this goal,
it is necessary to review, analyze, apply, and synthesize literature from educational
facilities planning, education, educational administration, architectural practice, and
organizational sociology. These assumptions are central to the development of the
systems model for educational facility planning, and both guide and delimit this study.
These assumptions address the structure and nature of schools as organizations, the
environment in which public schools are planned, the purpose and method of planning,
and educational facilities as an architectural product.
The Structure and Nature of Schools as Organizations
Hoy and Miskel argue that “the larger social, cultural, economic, demographic,
political, and technological trends all influence the internal operations of schools and
districts. Because school organizations are conceptualized as part of a larger
environment, an argument can be made that anything that happens in the larger
environment may affect the school and vice versa” (1996). In other words, it is assumed
that a school district is a product of the environment within which it resides, and in turn,
the environment is partly a product of the school district that resides within it. It is not a

8
new theoretical framework to guide and define organizational behavior through an
examination of the organization and the environment in which it resides. Following
World War II, attempts to define organizational behavior through the interactions
between the organization and the environment emerged as a compilation of ideas
collectively known as open-systems theories (Scott, 1998).
Due to the fact that organizations, dramatically different from public schools, can
be defined as open-systems, it is necessary to further refine the definition of public
schools as an organization. After a review of organizational research, Richard Scott
defines institutions, such as schools, as organizations that are “comprised of cognitive,
normative, and regulative structures which exist to promote and sustain orderly behavior”
(1995). Regulative structures consist of formal written rules as well as typically
unwritten codes of conduct that underlie and supplement formal rules. An essential part
of an institution is the adherence to rules and codes of conduct, and the punishments
which result when they are not followed (Scott, 1998). Normative structures provide a
moral framework for an organization. Unlike externally enforced rules, normative
structures are internalized by participants that provide a sense of what is appropriate and
a commitment to common values (Scott, 1998). Finally, cognitive structures are
symbolic systems and shared meanings that provide stability, order, and cultural identity
for an organization. They are the beliefs, attitudes, or modes of conduct that are deeply
ingrained within the participants of an organization (Scott, 1998). In a fully developed
institutional system, cognitive, normative, and regulative forces interact to promote and
sustain order (Scott, 1998). Though there are other ways to describe the organizational
behavior and patterns of school districts, for the purpose of this dissertation, it is assumed

9
that school districts are open-systems with cognitive, normative, and regulative
structures.
The Environment in Which Public Schools are Planned
Building on the concept of schools as open-systems, the environment in which
planning occurs can be conceptualized through organizational sociology. The Resource
Dependency Theory is among the various theoretical frameworks for open-systems
(Johnson, 1995). The main premise of the Resource Dependency Theory is that no
organization is totally self-sufficient; therefore, it must engage the outside environment
for needed resources. The flow or exchange of resources creates dependencies and power
differentials between organizations that have resources and organizations that need
resources. These power differentials have restraining effects on an organization’s actions
(Johnson, 1995). Though there are other ways to describe the relationship and
interactions between a school district and the environment in which it resides, for the
purpose of this dissertation, it is assumed that school districts are open-systems and
resource dependant.
The Purpose and Method of Planning
If school districts are considered open-systems and resource dependant, then one
of the primary purposes of planning is to reduce the restraining effects of resource
dependency. Furthermore, planning must occur within the cognitive, normative, and
regulative structures of both the organization and the environment in which the
organization resides. Based on a review of the literature, these organizational theories
evidence themselves in the practices of educational facility planning.

10
Design professionals have developed and/or refined five broad categories of
models for planning educational facilities. Though there are overlaps in philosophy and
structure of the models, each of the five categories approaches the planning and design of
educational facilities differently, and each result in an architectural product with distinct
features. However, regardless of the differences in process or product, all five categories
address the same six domains when planning educational facilities. Those domains of
planning can be termed as pedagogy, demographics, politics, culture, economics, and
architectural acuity. What is germane in the light of organizational theory is the fact that
though broad in nature, scope, and complexity, the hundreds of variables within the six
domains of planning can easily be identified as cognitive, normative, and/or regulative
structures of the school district, and/or the environment in which the school district
resides.
Educational Facilities as an Architectural Product
An analysis of the literature base demonstrates that educators and architects have
collectively demonstrated a firm belief that an educational facility will meet the needs of
learners and the community that it serves when it is a physical representation of a clearly
articulated educational vision. Reviewing the literature from the architectural field, it is
apparent that design professionals, regardless of their school of thought on pedagogy or
architecture, predicate the planning and design of educational facilities on one of the most
basic premises for twentieth century modern architectural design: form follows function.
For the purpose of this dissertation, the goal of educators and design professionals is to
construct schools (architectural product) which are a clear physical representation (form)
of a well-articulated educational vision (function).

11
Limitations of Research Design
The absence of comprehensive research-based resources and materials on
educational facilities planning may evidence the complexity of the environments in
which American public schools are planned. The fact that public schools in the United
States are being planned and constructed in a pluralistic, democratic society makes the
process of facilities planning difficult to measure and evaluate.
When writing about attempts to empirically assess organizations, such as school
districts, and the environment in which they reside, Richard Scott states, “attempts have
not met with marked success and have raised numerous issues. First, there is the question
of whether objective or subjective measures are more appropriate. Second, assessing
environmental features is made more difficult by the differentiated nature of
organizations” (1998). Scott further argues that institutional systems, such as schools, are
comprised of cognitive, normative, and regulative structures which exist to promote and
sustain orderly behavior. Depending on whether the researcher comes from an economic,
political, sociological, or cognitive-cultural approach, the focus, arguments, and
assumptions of the research can be very different (Scott, 1998).
When endeavoring to design this study, the difficulty of establishing a
quantitative means of describing facilities planning was quickly encountered. Due to
the need to simultaneously utilize nominal, ordinal, and interval data for an adequate
description of educational facilities planning, standard statistical techniques were quickly
dismissed as a sole means of evaluation. For example, many of the variables such as the
number of students, cost per square foot, and debt load could be collected directly. Other
variables such as population growth, optimal location, and the ability to raise future

12
revenue need to be projected. Yet others, such as those which relate to the climate and
culture of a school district, require the use of latent variables as indicators of underlying
constructs. As a means to map and analyze complex relationships that occur during the
course of planning educational facilities, structural equation modeling was explored.
However, it again became apparent that even hybrid models which allowed both directly
observed and latent variables, required sample sizes so large in order to ensure validity,
that quantitative analysis through structural equation modeling was not possible (Kline,
1998).
Utilizing a pure quantitative or a pure qualitative research design is not feasible
due to the complex patterns, interactions, and relationships between the physical, social,
pedagogical, cultural, and economic variables contained in the systems model. However,
as a means to offset the weakness inherent in a pure quantitative or a pure qualitative
research design, a mixed methodological approach can be employed. A mixed
methodological approach offsets the weaknesses inherent within one methodology with
the strengths of the other (Creswell, 2003). A sequential transformative research design
is such a methodology. As defined by Creswell (2003), sequential transformative
research is a mixed methodological approach which utilizes a theoretical lens (in this
case, the systems model) to ground a study. A sequential transformative research design
maximizes leverage over the complexity of the systems model and provides the greatest
opportunity to make generalizations to other contexts and settings.

13
Researcher Bias
Research was conducted on the development of current practices, thought, and
trends in educational facilities planning. Due to the literature base that consists of
predominately experiential not experimental text, commonalties, differences, and changes
in the literature base from 1990 to 2004 were analyzed. Robert Bartos (1999) describes
this type of research as historical. He defines historical research as a means of “achieving
a better understanding of present institutions, practices, and problems” through the
“systematic search of documents and other sources that contain facts relating to the
historians questions about the past” (1999). Thematic analysis and casing of text can be
utilized as a vehicle to complete historical research. Both require interpretation on the
part of the researcher. The researcher's bias can affect the results of these interpretations
and can limit the results of a study. This researcher was involved in the planning and
construction of a middle school in south central Pennsylvania. Though the research
design of this study utilizes a quantitative component to minimize the impact of the
researcher’s personal bias on interpretation of data collected, the qualitative component
of the research will be influenced by the experience of the researcher. This potential for
bias is recognized prior to data collection. The goal of the research design is to limit the
bias of the researcher through purposeful sampling, data triangulation, and the
recognition that bias may exist.

14
Definitions
Architectural Product – An architectural product will be defined as a completed
educational facility.
Educational Vision - A feasible and attainable picture or image of what the school district
can become in the future. An educational vision helps focus attention on what is
important, provides purpose, motivates staff, students, and the community and increases
the sense of shared responsibility for student learning (NCREL, 2002).
Organizational Systems Theories - Organizational systems theories are a collection of
ideas which define the behavior of organizations through the interactions between the
organization and the environment in which the organization resides (Scott, 1998). Two
broad classifications exist within organizational systems theories:
Closed System Frameworks - Closed system frameworks attempt to define
organizational structure and processes solely within the context of the
organization (Scott, 1998).
Open System Frameworks - Open system frameworks attempt to define
organizational behavior through an examination of the organization and the
environment in which it resides. In other words, the larger social, cultural,
economic, demographic, political, and technological trends all influence the
internal operations of the organization (Scott, 1998). Resource dependency
theory is an example of an open system framework. School organizations can
also be considered as an open system framework (Hoy & Miskel, 1996). For the
purpose of this dissertation, schools will be conceptualized as open-framed,
resource-dependent systems.

15
Planning Models - A systematic approach to planning and designing an educational
facility. Planning models are the means by which educators and design professionals
transform an educational vision into an architectural product. There are five distinct
categories of planning models which includes:
Bureaucratic Planning Models - Bureaucratic planning models are characterized
by a linear, top-down process that relies heavily on input from teachers and
administrators. It is typically organized by discipline or pedagogical practices,
places the focus on the teacher, and develops highly specialized spaces within the
facility.
Long-Range or Master Planning Models - Long-range or master planning models
utilize a multi-disciplinary team which crosses lines of responsibility and
expertise to evaluate facilities, student demographics, and educational programs
in order to identify problems, evaluate alternative solutions, and determine a
sound course of action.
Community Based Planning Models - Community based planning models utilize a
committee of facility stakeholders that represent the demographic and
ethnographic make-up of the community. The ultimate goal of this planning
model is to plan a facility which can be utilized for both educational and
community purposes.
Vision Planning Models - Vision planning models examine the school as a small
part of a larger learning environment. Vision planning utilizes a committee of
community-wide educational stakeholders to examine and challenge traditional
ideas about curriculum, utilization of staff, scheduling, assessment, facilities, and

16
where learning can best take place in a post-industrial society. Unlike community
planning which views the educational facility as the center of the community,
vision centered planning views the community itself as a diverse environment in
which learning can take place.
Sustainable Planning Models - Sustainable planning models focus on how
learning spaces change over time. Sustainable planning focuses on three
premises. The first is that an educational facility will remain the anchor for
generations of learning. The second is that educational spaces within a facility
need to be efficient and flexible. The final is that building materials and
architectural practices must be environmentally friendly and/or increase the life
span of a facility.
Resource Dependency Theory - Resource dependency theory is based on the premise that
no organization is totally self-sufficient and must engage in exchanges for needed
resources. The flow or exchange of those resources creates dependencies and power
differentials between organizations that have resources and organizations that need
resources. These power differentials have restraining effects on an organization’s actions
(Johnson, 1995).
Six Domains of Planning - All educational planning models address six domains when
planning educational facilities. The first five domains of planning represent the physical,
social, academic, cultural, and economic characteristics of both the school district for
which the facility is being planned and the community in which the facility will reside.
The sixth domain encompasses all physical characteristics of the facility being planned
which includes the design, layout, engineering, mechanical systems, technology,

17
aesthetics, and materials from which the facility will be constructed. The six domains
can be termed: pedagogy, demographics, politics, climate and culture, economics, and
architectural acuity. Definitions of each are as follows:
Architectural Acuity - The art and science of building in which the relationship of
spaces, construction materials, structural practices, mechanical systems,
technology, and aesthetics are applied by architects, engineers, and design
professionals in an educational facility (infoplease.com, 2002 & American
Heritage, 2000).
Culture - The cognitive and normative structures which help promote and sustain
order in an organization (Scott, 1998). The cognitive and normative structures
represent a system of socially acquired values, beliefs, attitudes, standards,
traditions, customs, and rules of conduct which delimit the range of accepted
behaviors in a school district (infoplease.com, 2002 & American Heritage, 2000).
Demographics - The vital statistics which describe both the human population and
the physical characteristics of a given area or market niche (Investorwords.com,
2002). For the purpose of this dissertation, demographics will refer to the vital
statistics which describe both the human population and the physical
characteristics of a school district or the environment in which a school district
resides.
Economics - Economics is defined by the American Heritage dictionary as
economically significant financial considerations (2000). Economics
encompasses all significant financial considerations of a school district which
include, but are not limited to, the ability to raise revenue, manage debt load, and

18
structure, state and federal reimbursement rates, and support for capital
improvement projects, local consumer and producer indexes, welfare and poverty
rates, the number of jobs in the local economy, the unemployment rate, and the
economic outlook (Investorwords.com, 2002 & infoplease.com, 2002).
Pedagogy - Pedagogy is defined by Merriam-Webster’s Unabridged Dictionary as
the art and science of teaching. Pedagogy will be defined as the collective
instructional methods and strategies employed by educators within a school
district (2002).
Politics - Politics is defined as the competition between competing interest groups
or individuals for power and leadership (Merriam-Webster, 2002). Politics also
refers to the methods and tactics of formal and informal groups that attempt to
gain control, power, or alter the direction of a government, social unit, or
organization (American Heritage, 2000). For the purpose of this dissertation,
politics is defined as the methods and tactics of formal and informal groups that
attempt to gain control, power, or alter the direction of a school district’s capital
improvement project.

19
CHAPTER II
REVIEW OF THE LITERATURE
Introduction
Early in the development of this study, it became evident that a theoretical
construct was needed in order to deal with: (1) the complexity of the research question,
(2) the void in the literature base, and (3) concerns with regard to the empirical
assessment of organizations. The theoretical construct must delimit, in a systematic way,
the complex patterns, interactions, and relationships between the physical, social,
pedagogical, cultural, and economic components of educational facilities planning. As a
result, the goal of this study is to provide a theoretical construct from which design
professionals and educators can better organize, understand, communicate, analyze, and
research complex cause-effect relationships that occur when educational facilities are
designed and constructed in a pluralistic, democratic society.
Developing the Research Base – Phase 1
In order to develop a unifying theoretical construct on which a study could be
anchored, a thematic content analysis of text has been completed. The purpose of a
thematic analysis of text is the identification of major themes and ideas within a set of
documents (Trochim, 2001). In this case, the documents encompass a detailed review of
texts, journals, and internet sources relating to all aspects of educational facilities and
educational facilities planning. To bolster this conceptual framework and provide a
sound base, it is also necessary to review, analyze, apply, and synthesize literature from
education, educational administration, architecture, and organizational sociology. The
process of developing a conceptual framework is known as casing. Casing, as detailed in

20
the work of Charles C. Ragin, is a process to “slice and dice the web of human social life
for the goal of testing the generality of theoretical ideas” (2000).
To discern the relationship between thematic analysis and casing, it is helpful to
think of the results of thematic analysis as the “guts” of a theoretical construct, while
casing provides the “skeletal system” that keeps it together. Thematic analysis of text
and casing provide the framework for this study; together these methodologies are central
to this work.
The process of thematic analysis of text finds its roots in the methodology of
analytical induction. As described and named by Florian Znaniecki, analytical induction
utilizes inductive, rather than deductive reasoning, for the purpose of developing
concepts and relationships to describe phenomena (Ratcliff, 2003). The ultimate goal of
analytical induction is to accurately represent the reality of the situation that is being
researched. In order to accurately describe the essential characteristics of a system,
Znaniecki, as cited by Ratcliff, emphasizes the importance of distinguishing essential
characteristics from irrelevant details that may co-occur within a system. Equally as
important, analytical induction necessitates that essential elements of a system are not
described in isolation, but described as they are interrelated to one another through
comprehensive, logical theories and classifications (2003).
A three phase process was utilized to complete the thematic analysis of text and
process of casing. The first phase began with a thematic analysis of the literature base for
the purpose of identifying and categorizing practices, patterns, and themes in educational
facility planning. Through constant comparison of literature sources, and the processes

21
of note taking, coding, classification, reclassification, and memoing, themes in
educational facility planning emerged from the literature base.
The process of thematic analysis of text was open-ended and emergent. It began
with no pre-designated categories for analysis. Both the sample size and the location of
sources were not restricted. The only limiting factors that were placed on any literature
source was that the source was: (1) scholarly and (2) demonstrated a relationship to
educational facilities planning. Notes on key concepts were taken as literature sources
were identified and reviewed. Coding of text documents helped identify themes,
categories, and sub-categories across the literature base. As a result, underlying concepts
began to emerge from the literature base. Memoing provided consistency in comparing
and contrasting literature sources across an ever-increasing sample of documents.
Through repeated cycles of identification of literature sources, note taking, coding,
classification of new sources, and reclassification of existing sources, memoing provided
a framework for constant comparison. After the initial cycle of note taking, coding,
classifying, and memoing, these processes continued simultaneously until the point of
saturation. The point of saturation occurred when repeated attempts to classify new ideas
and concepts in literature sources failed to identify or categorize practices in educational
facility planning outside the framework which emerged through memoing.
Five classifications of planning models have been identified at the point of
saturation. Each of the five categories of models approaches the planning and design of
educational facilities differently, and each result in an architectural product with distinct
features. The five categories of planning and design models are appropriately termed

22
Bureaucratic, Long-Range or Master Planning, Community Based, Vision Based, and
Sustainable.
The five classifications of planning models are distinguished from one another
based on nine distinct criteria. The nine criteria which emerged from within the literature
used to distinguish the characteristics of each of the five categories of planning models
include: (1) the primary objective of the planning process, (2) the primary function of the
educational facility being planned, (3) the perspective from which planning is conducted,
(4) the principal participants in the planning process, (5) the means by which support for
the building project is gained, (6) primary data sets collected during the planning phase,
(7) secondary data sets collected during the planning phase, (8) the focus of design
specifications, and (9) the method and timing of cost analysis within the planning
process. Table 1: A Topology of Planning Models shows each of the five classifications
and the unique representation of each of the nine criteria within each model.

23
Table 1
Topology of Planning Models
Criteria: Bureaucratic
Planning
Long-Range or Master Planning
Community Based
Planning Vision Based
Planning Sustainable
Planning The primary objective of the planning process is to design and construct an educational facility which will...
serve the needs of the school district.
serve the needs of the school district while maximizing the efficient use of resources furnished by the community.
serve the needs of the community and the needs of the school district through the efficient use of the mutual resources of both.
create a new paradigm in the way the school district and community interact to serve the needs of learners.
be flexible, efficient, environmentally friendly, and with a life span well beyond that of normal facility.
The primary function of the educational facility being planned is to provide…
highly specialized spaces designed to support established pedagogical practices.
flexible, efficient, and cost-effective spaces designed to meet the needs of teachers, students, and the school district.
a combina- tion of specialized and flexible spaces designed to serve as a center for education and the hub of community activities.
spaces as part of a larger network of locations that provide educational experiences for learners.
an anchor within the community designed and built to serve the needs of generations of learners.
Planning is conducted from the perspective(s)...
of the needs of the school district.
of the needs of the school district and the ability of the community to provide resources for the school district.
of the needs of the community and the needs of the school district.
that the school district is a small part of a much larger learning environment.
(1) that the school district will remain an anchor in the community. (2) that educational space must be efficient and flexible. (3) that building materials and architectural practices must be environmentally friendly and/or increase the life span of a facility.

24
Table 1 (continued).
Criteria: Bureaucratic
Planning
Long-Range or Master Planning
Community Based
Planning
Vision Based
Planning Sustainable
Planning
The principal participants in the planning process include…
administrators, teachers, and members of the school board.
a multi-disciplinary team of educational stakeholders from the school district and from the community.
a community -based team of educators, citizens and civic leaders responsible for providing public spaces and services. The team represents the demographic and ethnographic make-up of the community.
a team of visionary educational stakeholders from the school district and the community.
a multi-disciplinary team of educational stake-holders who can gain consensus to build a flexible, environmental friendly facility, with greater up-front costs, but less expendi- tures over the extended life cycle of the facility.
Support for the building project is gained…
from within the school district.
through the collection of objective data culminating in a detailed plan to maximize the efficient use of school district and community resources. The objective data is bolstered by ethnographic data.
by planning and designing a facility through a community-based team of citizens and civic leaders, and through a plan for public organizations to efficiently share and consume resources.
by creating strong links between the school district, the community, families, businesses, industries, and learning, by developing new educational paradigms. Planners capitalize on previously unidentified community resources to support educational programs.
by developing a plan to build a flexible, environmental friendly facility, which will serve as a durable symbol of the community’s commitment to education and will cost less to build and maintain when expenses are calculated over the extended life of the facility.

25
Table 1 (continued).
Criteria: Bureaucratic
Planning
Long-Range or Master Planning
Community Based
Planning
Vision Based
Planning Sustainable
Planning
Primary data sets collected during the planning phase include...
quantitative data on the needs of the school district.
quantitative data on the needs of the school district and on the community that provides resources for the school district.
quantitative and ethnographic data on the needs of the school district, community, and community organizations.
quantitative and ethnographic data on the dynamics of community, family, work, and learning.
Quantitative data on educational resources throughout the community.
quantitative data on the present needs, expected growth, and future needs of the school district and on the community.
Secondary data sets collected during the planning phase include...
quantitative data on the resources that the community can provide.
ethnographic information on the school district and the community.
quantitative data on resources which may be common to the school district, community, and community organizations.
quantitative data on the needs of the school district and needs of the community.
quantitative data on environmental impact of decisions, architectural practices, and the quality and durability of different building materials.
Design
specifications ...
focus on departmentalization, specialization, or pedagogical practices.
focus on the relationships between student demographics, educational programs, and space.
focus on the needs of the community and the needs of the school district.
focus on where learning can best take place.
focus on how the need for space and the type of space will change over time.
Accommodates all foreseeable changes.

26
Table 1 (continued).
Criteria: Bureaucratic
Planning
Long-Range or Master
Planning
Community Based
Planning Vision Based
Planning Sustainable
Planning
Cost analysis is...
completed early in the process and is an important factor in the development of education specifications.
completed as alternative solutions are developed and analyzed.
based on how efficiently organizations serving the public can collectively share and consume resources.
completed as new educational paradigms are evaluated.
based on “Life-Cycle Costing”. Life cycle costing is an analysis of the total cost of facility over the length of ownership.
Developing the Research Base – Phase 2
Two distinct characteristics mark the second phase of thematic analysis of text
and casing. First, a thematic analysis of text examines commonalities and differences
across the five classifications of planning models. As in the first phase, the process was
open-ended and emergent. It began with no pre-designated themes, patterns, or
categories, and no limit on the quantity of identifiable relevant patterns. Second, as
relevant patterns and themes emerged across the topology of planning models, and in
order to generate sound suppositions for a framework on which this study could be built,
it was necessary to review and analyze literature from education, educational
administration, architecture, and organizational sociology.
The efforts of this phase resulted in the development of six interdependent
suppositions. These six suppositions are the critical foundation on which the systems
model is built and through which a framework for inquiry manifests itself. It is important
to note that the six suppositions are consistent with the assumptions made regarding: (1)
the structure and nature of the organization for which planning occurs, (2) the

27
environment in which planning takes place, (3) the purpose and method for planning, and
(4) the architectural product which results from the planning. These four assumptions are
detailed in chapter one of this study. The six suppositions developed from the first two
phases of analysis are as follows:
Supposition 1
Educators and design professionals, though primarily experiential in nature, have
a solid body of knowledge pertaining to pedagogy and the planning of educational
facilities.
Supposition 2
Using a defined body of knowledge, educators and design professionals have
demonstrated the ability to design and construct educational facilities that meet the needs
of children and the communities they serve.
Supposition 3
In order to design and construct educational facilities that meet the needs of
children and communities, educators and design professionals have developed and/or
refined five broad categories of educational facilities planning models. These five
categories of planning models can be suitably termed Bureaucratic, Long-Range or
Master Planning, Community Based, Vision Based, and Sustainable.
Supposition 4
An examination of the five categories of planning models demonstrates that each
category of models approaches the planning and design of educational facilities
differently and each results in an architectural product with distinct features. However,
all five categories of planning models are grounded in the same basic design principle,

28
and regardless of process or product, they all strive to reach a common goal of: "form
following function." This concept, coined by pioneering architect Louis Sullivan and
further refined by renowned architect Frank Lloyd Wright, became the basis for twentieth
century modern design (Whole Building Design Guide [WBDG], 2002). In terms of
educational facility planning, this design concept is evident in the fact that regardless of
the school of thought on pedagogical practices, planning, or facility design, educators and
design professionals consistently demonstrate the belief that if an educational facility is a
clear physical representation (form) of a well articulated educational vision (function),
the facility will meet the needs of those it serves.
Supposition 5
In order to design and construct educational facilities which are a physical
representation of a well articulated educational vision, all planning models, to varying
degrees, endeavor to address six distinct domains of planning. These six domains of
planning are represented by quantitative and qualitative variables which are intimately
linked and interdependent. In other words, when something occurs within one domain,
there is an impact on the other five. The six domains of planning which are common in
all five categories of the planning model encompass the physical, social, academic,
cultural, and economic characteristics of the environments which the facility will serve,
as well as all physical characteristics of the facility that is being planned. The six
domains can be appropriately termed: pedagogy, demographics, politics, culture,
economics, and architectural acuity.

29
Supposition 6
The literature denotes a clear shift away from utilizing the six domains of
planning in a manner which focuses primarily on the relationship between educational
programs and the educational facility, to the utilization of the six domains of planning in
a manner which focuses on both the relationship between educational programs and the
educational facility, and the relationship between the educational facility and the
environment in which it will reside. As Hoy and Miskel reason, “Because school
organizations are conceptualized as part of a larger environment, an argument can be
made that anything that happens in the larger environment may affect the school and vice
versa” (Hoy & Miskel, 1996). In other words, it has been recognized that an educational
facility, and the teaching and learning which occurs within that facility, have a dynamic
impact on the larger environment in which a facility resides. Likewise, the dynamics of
the larger environment impact both an educational facility and the teaching and learning
which occurs within that facility.
These six suppositions are melded together and represented graphically in the
concept map labeled: Figure 1: Concept Map: Educational Facilities Planning. An
Analysis and Synthesis of Literature From Education, Educational Administration,
Architecture, and Organizational Sociology.

30
Figure 1. Concept Map: Educational Facilities Planning. An Analysis and Synthesis of Literature From Education, Educational Administration, Architecture, and Organizational Sociology
Demographics
Politics
Culture
Pedagogy
Architectural Acuity
EDUCATIONAL VISION
Educational Facility
External Environment in
Which Educational
Facility is Planned
Internal Environment in
Which Educational
Facility is Planned The Educational Vision May Precede the Planning
Model or the Educational Vision May Be a Product of the Planning Model
PLANNING MODEL
Bureaucratic
Planning or
Long Range/ Master
Planning or
Community Based
Planning or
Vision Based Planning
or Sustainable
Planning
ARC
HITE
CTU
RA
L FOR
M
PLANNING MODEL
Bureaucratic
Planning or
Long Range/ Master
Planning or
Community Based
Planning or
Vision Based Planning
or Sustainable
Planning
AR
CH
ITEC
TUR
AL FU
NC
TION
PLANNING PROCESS
Economics

31
Though at first, the concept map and the suppositions on which it is based may
seem complicated, for those who participate as actors in the public school arena, a careful
examination of figure 1 portrays a rather common sense description of the process of
educational facilities planning in public education in the United States. Examining the
model from left to right, on the left side of the diagram there are three rectangles. The
middle rectangle represents the Educational Vision. On either side of the Educational
Vision are rectangles which represent the five categories of learning models. This is due
to the fact that the educational vision may precede the selection of a planning model, or it
may be a product of the planning model. On the far right of the diagram, the rectangle
represents the Educational Facility. In order to move from the educational vision to an
educational facility, the planning process (i.e. the implementation of a planning model)
acts as the necessary catalyst. True to the basic 21st century design premise of Sullivan
and Wright, the planning process connects the theoretical world of architectural function
to the physical world of architectural form. The model shows form following function.
Next, the planning process moves through the six interlocking rings labeled
pedagogy, demographics, politics, culture, economics, and architectural acuity. These
six intimately linked and interdependent rings are domains of quantitative and qualitative
variables which all planning models, to varying degrees, endeavor to manage.
Since the planning of an educational facility cannot occur in a vacuum, the small circle in
the center of the diagram with hash marks left to right represent the internal environment
of the school district. Shown with the hash marks right to left, the large circle which
encases the six domains of planning, and the internal environment of the school district
represents the larger environment in which the facility resides. It is important to note that

32
the six interlocking rings labeled pedagogy, demographics, politics, culture, economics,
and architectural acuity cross the line between the internal environment of the school
district and the larger environment in which the school district resides. This represents
the concept that the six domains of planning are functions of both the internal
environment and the external environment.
Developing the Research Base – Phase 3
The first two phases of this process utilize a thematic analysis of the literature
base to provide relevant themes and patterns within educational facility planning. These
themes and patterns are supported through a review and analysis of related literature from
education, educational administration, architecture, and organizational sociology. In
order to delimit in a systematic way, the complex patterns, interactions, and relationships
between educational facility planning, the structure and nature of schools as
organizations, and the pluralistic, democratic environment in which schools in the United
States are planned, the final phase of the review of the literature utilizes the process of
casing. The most distinguishing feature of this third and final phase is that of synthesis.
Upon completion of the second phase of analysis, it is evident that it’s necessary
to develop and define the relationships between the internal environment of the school
district and the external environment in which the school district resides. Fortunately, it
is not a new theoretical framework to guide and define organizational behavior through
an examination of the organization in relation to the environment in which it resides.
Following World War II, attempts to define organizational behavior through interactions
between the organization and the environment emerged as a collection of ideas
collectively known as open systems theories (Scott, 1998). Unlike closed system theories

33
which attempt to define organizational structure and processes solely within the context
of the organization, open system frameworks attempt to define organizational behavior
through an examination of the organization and the environment in which it resides
(Scott, 1998). In open systems theories, organizations are perceived as being embedded
in an environment, and import resources from the environment to export products and
services to the environment. In drawing a conclusion with regard to schools as open
systems, Hoy and Miskel argue that “the larger social, cultural, economic, demographic,
political, and technological trends all influence the internal operations of schools and
districts. Because school organizations are conceptualized as part of a larger
environment, an argument can be made that anything that happens in the larger
environment may affect the school and vice versa” (1996).
Among the different theoretical frameworks for open systems is the Resource
Dependency Theory. The main premise of this theory is that no organization is totally
self-sufficient and must engage in exchanges within the external environment for
necessary resources. The flow or exchange of resources creates dependencies and power
differentials between organizations and the environments in which they reside. These
power differentials have restraining effects on an organization’s actions (Johnson, 1995).
There is never a time when this is more evident in an educational setting as when a
school district faces large capital improvement costs.
If the theory of resource dependency is applied as a means to define and frame the
relationship between a school district and the environment in which it resides during a
large capital improvement project, the following statement can be made:

34
During any large capital improvement project, the flow or exchange of resources
between the larger environment and a school district creates dependencies and
power differentials that have a restraining effect on a school district’s actions.
This statement, drawn from a synthesis of the literature from educational facility
planning, educational administration, and organizational sociology, becomes the seventh
supposition and the first supposition necessary for the casing of a systems model.
In light of the seventh supposition, examination the first six suppositions as
represented by the concept map (figure 1.), immediately raises the question: Where can
the restraining effects of resource dependency manifest themselves? The concept map
consists of five components; moving left to right they are: (1) the Five Categories of
Planning Models, (2) the Educational Vision, (3) the Six Domains of Planning, (4) the
Boundaries of the Internal and External Environments, and (5) the Educational Facility.
The restraining effects of resource dependency will not manifest themselves in the
boundaries of the internal and external environments. They are abstract political,
economic, cultural, and social boundaries over which resources flow. The five categories
of planning models are categories of methods used to identify resources and reduce the
effects of resource dependency. The two remaining components of the model are the
educational vision and the educational facility. In architectural terms, the educational
vision and the educational facility represent the form and the function of the educational
facility. From the beginning of the planning process, regardless of the planning model,
the educational vision (the function) may be tempered by the resources that are available
in the internal and external environments, and more importantly, the resources which are
allowed to flow between the two. Consequently, based on the same logic, the

35
construction of the facility (the form) will also be tempered by the resources that are
available in the internal and external environments, and the resources which are allowed
to flow between them. Therefore, the eighth supposition in this construct and the second
in the process of casing the systems model states that the restraining effects of resource
dependency can impede the articulation of an educational vision and/or impede an
educational facility from being constructed as a physical representation of an educational
vision.
Examining the group of six suppositions generated from the thematic analysis of
the literature, and the seventh and eighth suppositions generated from casing, a ninth
supposition can be drawn. This is the final supposition and the third supposition
necessary for casing the systems model. When drawing this supposition, it is important
to recall that through the analysis of the literature, the five categories of planning models
all approach the planning and design of educational facilities differently and each result
in an architectural product with distinct features. However, all five categories of
planning models strive to design and construct facilities which are a physical
representation of a well-articulated educational vision by addressing the same six
domains of planning. Therefore, the ninth supposition in this theoretical construct is that
the variables which design professionals attempt to control in order to reduce the
restraining effects of resource dependency are represented within six domains of
planning. Consistent with the assumption that school districts are open systems with
cognitive, normative, and regulative structures, this supposition can also be stated as
such: In order to reduce the restraining effects of resource dependency, design
professionals attempt to control cognitive, normative, and regulative structures of the

36
organization and the environment by managing variables represented within and across
six domains of planning.
Again, as with the first six suppositions generated from the thematic analysis of
text, the final three suppositions generated through casing are consistent with the four
basic assumptions with regard to: (1) the structure and nature of the organization for
which planning occurs, (2) the environment in which planning takes place, (3) the
purpose and method for planning, and (4) the architectural product which results from the
planning. Equally as important, these nine suppositions are not contradictory to one
another. In fact, systematically, each supposition builds on the others to provide a
theoretical construct which delimits the complex patterns, interactions, and relationships
between the physical, social, pedagogical, cultural, and economic components of
educational facilities planning in a pluralistic, democratic environment. A summary of
the nine suppositions is as follows:
Supposition 1
Educators and design professionals, though primarily experiential in nature, have
a solid body of knowledge pertaining to pedagogy and the planning of educational
facilities.
Supposition 2
Using their knowledge base, educators and design professionals have
demonstrated the ability to design and construct educational facilities that meet the needs
of children and the communities they serve.

37
Supposition 3
In order to design and construct educational facilities that meet the needs of
children and the communities they serve, educators and design professionals have
developed and/or refined five broad categories of educational facilities planning models.
These five categories of planning models can be suitably termed Bureaucratic, Long-
Range or Master Planning, Community Based, Vision Based, and Sustainable.
Supposition 4
Regardless of the school of thought on pedagogical practices, planning, or facility
design, educators and design professionals consistently demonstrate the belief that if an
educational facility is a clear, physical representation (form) of a well articulated
educational vision (function), the facility will meet the needs of those it serves.
Supposition 5
In order to design and construct educational facilities which are a physical
representation of a well articulated educational vision, all planning models, to varying
degrees, endeavor to address six distinct domains of planning. These six domains of
planning are represented by quantitative and qualitative variables which are intimately
linked and interdependent. The six domains can be appropriately termed: pedagogy,
demographics, politics, culture, economics, and architectural acuity.
Supposition 6
An educational facility and the teaching and learning which occur within have a
dynamic impact on the larger environment in which a facility resides. Likewise, the
dynamics of the larger environment impact both an educational facility and the teaching
and learning which occurs within.

38
Supposition 7
During any large capital improvement project, the flow or exchange of resources
between the larger environment and a school district creates dependencies and power
differentials that have a restraining effect on a school district’s actions.
Supposition 8
The restraining effects of resource dependency can impede the articulation of an
educational vision and/or impede an educational facility from becoming a physical
representation of an educational vision.
Supposition 9
The variables which design professionals attempt to control in order to reduce the
restraining effects of resource dependency are represented within six domains of
planning. Consistent with the assumption that school districts are open systems with
cognitive, normative, and regulative structures, another way to state this supposition is: In
order to reduce the restraining effects of resource dependency, design professionals
attempt to understand and manage the cognitive, normative, and regulative structures of
the school district and the environment by managing variables represented within six
domains of planning.
All nine suppositions have been combined graphically into figure 2: Educational
Facilities Planning: A Systems Model.

39
Figure 2. Educational Facilities Planning: A Systems Model
EDUCATIONAL VISION
EDUCATIONAL FACILITY
External Environment in Which Educational
Facility is Planned
Internal Environment in Which Educational Facility is Planned
PLANNING MODEL
BureaucraticPlanning
orLong Range/
Master Planning
orCommunity
Based Planning
orVision Based
Planningor
Sustainable Planning
AR
CH
ITECTU
RAL FO
RM
RESOURCEDEPENDANCY
PLANNING MODEL
BureaucraticPlanning
orLong Range/
Master Planning
orCommunity
Based Planning
orVision Based
Planningor
Sustainable Planning
AR
CH
ITECTU
RAL FU
NC
TION
100% of the Necessary
Resources Flow from the External
to the Internal Environment
0% of Necessary Resources Flow
From the External to the
Internal Environment
The Educational Vision may precede the planning model or the Educational
Vision may be a product of the planning model
A facility will stress the balance between form and function as the needs of the stakeholders change and because all facilities age. With enough stress the
process begins again.
Demographics Economics
Politics
Culture
Pedagogy
ArchitecturalAcuity
STAGNATION
REORGANIZATION
RENOVATION
CONSTRUCTION
DECOMMISSION
DEMOLITION
PLANNING PROPOSAL

40
At first examination, Figure 2: Educational Facilities Planning: A Systems Model
may seem complicated. However, for those who participate as actors in the public school
arena, a careful examination of figure 2 portrays a rather common sense description of
the process of educational facilities planning in public education in the United States. On
the left side of the diagram there are three rectangles. The middle rectangle represents the
Educational Vision. On either side of the educational vision are rectangles which
represent the five categories of learning models. This is due to the fact that the
educational vision may precede the selection of a planning model or it may be a product
of the planning model.
On the far right of the diagram, the rectangle represents the Educational Facility.
In order to move from the educational vision to an educational facility, the planning
process (i.e. the implementation of a planning model) acts as the necessary catalyst. True
to the basic 21st century design premise of Sullivan and Wright, the planning process
connects the theoretical world of architectural function to the physical world of
architectural form. The model shows form following function.
Next, the planning process moves through the six interlocking rings labeled
pedagogy, demographics, politics, culture, economics, and architectural acuity. These
six intimately linked and interdependent rings are domains of quantitative and qualitative
variables which all planning models endeavor to address to varying degrees.
Since the planning of an educational facility cannot occur in a vacuum, the small
circle in the center with hash marks left to right represents the internal environment of the
school district. Shown with a hash marks right to left, the large circle which encases the
six domains of planning and the internal environment of the school district represents the

41
larger environment in which the facility resides. It is important to note that the six
interlocking rings labeled pedagogy, demographics, politics, culture, economics, and
architectural acuity cross the line between the internal environment of the school district
and the larger environment in which the school district resides. This represents the
concept that the six domains of planning are functions of both the internal environment
and the external environment. The arrows around the circle separating the internal and
external environment demonstrate the interaction of variables across the six domains of
planning. That interaction of variables occurs in both the internal and external
environments.
The arrow representing the planning process leaves the six domains of planning as
a “Proposal” for how educational facilities of the district can become physical
representations of the educational vision. Depending on the success to which educators
and design professionals identify and manage the variables within and across the six
domains of planning, based on the premise of resource dependency the system model
establishes three possible resulting outcomes: (1) one hundred percent of the necessary
resources flow from the external environment to the internal environment. In this
scenario, there is no restraining effects which are manifested in the articulation of an
educational vision or the degree to which the educational facility is a physical
representation of that vision, (2) no resources are allowed to flow between the external
environment and the internal environment. This represents the extreme opposite of the
first scenario; facility changes are fully restrained, and (3) the resources allocated are
limited in some way. In this scenario, some, but not all of the facility changes are
possible.

42
Depending on the resources that become available to facility planners, there are
five possible courses of actions that are available. These actions may happen in isolation
or in combination and are as follows: (1) “Stagnation”-- In this case, nothing is done, and
everything is status quo. (2) “Renovation”-- In this case, existing educational facilities
are refurbished. (3) “Construction”-- In this case, new facilities are constructed or
additions to existing facilities are completed (4) “Decommission” -- Facilities which are
decommissioned no longer serve students. They may be converted to administrative
offices, sold, or left vacant for future use by the school district. (5) “Demolition” -- In
this situation, the facility is destroyed. As stated, these options can be exercised in
combination. For example, a new school may be constructed and the old school may be
decommissioned, but refurbished to serve as district offices.
It is important to recognize that the model is dynamic and represents an
environment which is always in a state of change. Depending on the environment and
assets of the school district, change may come slowly or it may come quickly, but change
is inevitable. Change is assured by the simple fact that all facilities age. It is change that
creates an imbalance between the educational vision of the school district and the degree
to which the educational facilities are a physical representation of that vision. The central
research question of this study then asks:
If educators and design professionals have demonstrated the ability to design and
construct educational facilities that meet the needs of children and the
communities they serve, what are the variables that intervene when they fail to do
so?

43
As established by the systems model, the answer to this question would state:
Educational facilities which fail to meet the needs of children and the
communities they serve are the result of educators and design professionals who
fail to reduce the restraining effects of resource dependency through the
identification and management of some or all of the quantitative and qualitative
variables represented within six domains of planning.
The validity of the answer established by the systems model and in turn, the validity of
the system model itself, is the basis for this study.

44
CHAPTER III
METHODOLOGY
Research Tradition
Prior to describing the research design used to determine the validity of the
systems model (figure 2), it is important to establish the epistemological foundation from
which research will be conducted. Creswell’s “Elements of Inquiry” and “Alternative
Knowledge Claim Positions” are utilized to determine the proper epistemological
foundation for this study (Creswell, 2003). These two hierarchies are utilized to consider
the traditions of Advocacy/Participatory, Postpositivism, Constructivism, and
Pragmatism.
In the advocacy/participatory tradition, inquiry must be intertwined with politics
and a political agenda. The goal of research in this tradition is to promote meaningful
change in the lives of the participants, institutions, or the researcher. This is simply not
the goal to which this research strives.
The postpositivism tradition, quantitative in nature, requires that researchers are
attempting to establish objective, measurable “truth statements” in order to explain a
phenomena (Creswell, 2003). As previously stated, the complex patterns, interactions,
and relationships of variables during the planning of an educational facility require the
simultaneous examination of ordinal, ratio, and nominal variables. For a quantitative
researcher, this will raise questions of validity and reliability.
During an initial inspection, constructivism appears to be a viable research
tradition for this study. According to Creswell, the constructivist researcher seeks to
understand the complexity and dynamics of the phenomena being studied rather than

45
narrowing his/her understanding into a few categories or ideas (Creswell, 2003). This
understanding, however, is developed through the participant’s experiences, perspectives,
and explanations of the phenomena and can be influenced by the researcher’s experiences
and bias. This type of research is primarily qualitative, largely subjective and inductive
by nature, and as a result excludes numerical descriptors and explanations of causal
relationships through statistical probabilities. Since the purpose of this study is to attempt
to develop a platform from which design professionals and educators can better organize,
understand, communicate, analyze, and research complex cause-effect relationships
operating when educational facilities are being designed and built, an absolute
prerequisite for that platform must be that it can be generalized or transferred to other
contexts or settings. Basing this study on participant’s experiences, perspectives, and
explanations limits the degree to which the results of the research can be generalized or
transferred to other contexts or settings. Constructivism, by design, seeks to examine
elements of phenomena which are both broad and situation specific. In order to
overcome this obstacle and make the study more transferable, it would be necessary to
completely describe the attributes of the school districts being studied and how those
attributes affect the study as a whole. This task could become very arduous while limiting
the degree to which the results could be confirmed or corroborated by others.
In the pragmatic tradition of research, the truth of a proposition is measured by its
correspondence with experimental results and by its practical outcome (Columbia, 2001).
In this light, pragmatic research is problem-centered and is always conducted in a social,
historical, political and other context. Central to pragmatic inquiry is the research
problem, not the research methodology. Pragmatic inquiry frees the researcher to select

46
from methods, techniques and procedures that maximizes the quality of experimental
results and the practical benefits of the study (Creswell, 2003).
Even a cursory review of the preconditions for pragmatic research draws an
immediate and strong parallel with the purpose of this study. As stated, the goal of this
study is to develop and provide a construct from which design professionals and
educators can better organize, understand, communicate, analyze, and research complex
cause-effect relationships that occur when educational facilities are designed and
constructed in a pluralistic, democratic society. This goal, by its very nature, is pragmatic
and therefore requires that the validity of the systems model being examined be measured
by its experimental results and by the practicality of its use.
A pragmatic view of educational facilities planning, like the systems model,
assumes that educational facilities planning in a democratic society arise out of actions,
situations, and consequences rather than antecedent conditions. For these reasons, this
study and the selection of the research design will be grounded in the pragmatic tradition.
Selection of Research Design
Equally as important to establishing the epistemological foundation from which
this study is to be conducted are the principal justifications for the selection of a research
design within the pragmatic tradition. As previously discussed, the complexity of the
environment in which public schools are planned may account for the void in the
literature base. However, the absence of research and the record expenditures on public
schools emphasize the need for a construct from which design professionals and
educators can better organize, understand, communicate, analyze, and research complex
cause-effect relationships that occur when educational facilities are designed and

47
constructed in a pluralistic, democratic society. From the literature review it is clear that
developing such a construct is a difficult task. As previously cited, Richard Scott’s
review of studies in organizational sociology indicates that empirically assessing
organizations is difficult. In his work, he suggests three major reasons for these findings.
First, there is the concern whether objective or subjective measures are more appropriate
for assessing organizations. Second, he indicates that assessing environmental features is
made more difficult by the differentiated nature of organizations. Finally, he raises the
issue that the focus, arguments, and assumptions of the research can be very different if
researcher comes from an economic, political, sociological, or cognitive-cultural
approach (Scott, 1998). Coinciding with the development of the systems model and
consistent with the concerns raised by Scott, four critical considerations arise regarding
the methodology of the research design for this study. These four considerations are as
follows:
(1) The complex patterns, interactions, and relationships between the physical,
social, pedagogical, cultural, and economic components of the environments in
which educational facilities planning requires the simultaneous examination of
both quantitative and qualitative variables. This consideration is consistent with
the assumption that schools are open systems with cognitive, normative, and
regulative structures and the supposition that design professionals attempt to
control these structures by managing variables represented within six domains of
planning. Therefore, in order to develop and validate a comprehensive systems
model, the simultaneous examination of both quantitative and qualitative

48
variables which represent cognitive, normative, and regulative structures within
the six domains of planning is an absolute prerequisite.
(2) The exclusive use of quantitative methods with ordinal, ratio, and nominal
variables quickly raise questions of validity and reliability. Variables such as
enrollment and the cost per square foot are easily calculated. Other variables,
relating to the culture and politics within a school district, require the use of latent
variables as indicators of underlying constructs. Finally, other variables like
pedagogical practices and the clarity of an educational vision can only be
identified and ranked on a Likert or summative scale. Structural equation
modeling is explored as a means to map and analyze complex relationships that
occur during the planning of educational facilities. However, it again becomes
apparent that even the most sophisticated models which allow a simultaneous
examination of ordinal, ratio, and nominal variables require sample sizes so large
in order to ensure validity that analysis through structural equation modeling is
not possible (Kline, 1998).
(3) The use of qualitative methods allows the application and synthesis of ideas
for the purpose of structuring and delimiting complex descriptions of our world.
Empirical research can be perceived as culminating in theoretically structured
descriptions (Ragin, 2000). The exclusive use of qualitative methods, however,
excludes numerical descriptors and explanations of causal relationships through
statistical probabilities.
(4) The use of concurrent quantitative and qualitative data collection is a means to
offset the weakness inherent within one method with the strengths of the other

49
method and maximize the opportunity to make generalizations to other contexts
or settings (Creswell, 2003).
Due to these reasons, it is evident that a pure quantitative or a pure qualitative
research design cannot be utilized. The application of a mixed methodological approach,
however, offsets the weakness inherent within one method with the strengths of the other
method (Creswell, 2003). Furthermore, a mixed methodological approach can address
many of the issues in organizational sociology regarding empirically assessing
organizations (Scott, 1998). For these reasons, this study employs a sequential
transformative research design. As defined by Creswell (2003), sequential transformative
research is a mixed methodological approach which utilizes a theoretical lens (in this
case, the systems model) to ground a study. A sequential transformative research design
maximizes leverage over the complexity of the systems model and provides the greatest
opportunity to make generalizations to other contexts and settings.
Research Parameters
As stated earlier, this study is an attempt to develop and determine the validity of
a unifying theoretical construct from which design professionals and educators can better
organize, understand, analyze, communicate, and research complex cause-effect
relationships that occur when educational facilities are designed and constructed. In
order to meet this goal, the research design strives to: (1) identify and describe
complicated social, cultural, political, and economic mechanisms at work when public
schools are designed and constructed in a pluralistic democratic society, (2) understand
the relationships between those mechanisms and educational facility planning, and (3)
validate a systems model which formalizes causal inferences between social, cultural,

50
political, and economic mechanisms, educational facility planning, and educational
facilities.
It is recognized that the complexity of the phenomenon being studied, the
difficulty in establishing valid causal inferences in social research of this nature, and the
need for high generalizability creates a daunting challenge for any research design.
Nonetheless, this study attempts to utilize a research design that is creative, multi-
layered, and grounded in sound methodological practices.
Utilizing the systems model as a lens, the research design of this study conducts
the investigation in two sequential stages. The first phase of the investigation utilizes
quantitative methods to describe the sample population and examine, through univariate
analysis and multiple regression, the validity of the core components of the systems
model and the systems model as a whole. The second phase of the investigation utilizes
qualitative methods to complete a comparative analysis of four purposefully selected case
studies, and for the purpose of examining the validity of core components of the systems
model and the systems model as a whole.
By comparing and contrasting the results of two distinct methodologies, the
research design provides the greatest opportunity to: (1) describe complicated social,
cultural, political, and economic mechanisms at work when public schools are designed
and constructed in a pluralistic democratic society, (2) elaborate on the relationships
between those mechanisms and educational facility planning, and (3) cross-validate,
through quantitative and qualitative methods, a systems model which formalizes causal
inferences between social, cultural, political, and economic mechanisms, educational

51
facility planning, and educational facilities. The research design is represented
graphically in figure 3.
Research Design – Phase One
Target Population and the Survey Instrument
The investigation into the validity of the systems model will utilize all middle
schools constructed and opened in the Commonwealth of Pennsylvania between 1992
and 2003. During this time period, the Pennsylvania Department of Education (PDE)
reports that thirty-six middle school facilities were constructed (2004). This twelve year
time period allows each of the schools in the population to have been operating for a
minimum of two years prior to the study. At the same time, it does not extend so far back
that the majority of educators, architects, design professionals, artifacts, and records have
been lost through attrition. The investigation will begin by collecting data, on each of the
thirty-six schools, through the use of a survey instrument. Like the research design, the
survey was constructed using the systems model as a framework. The 65-question survey
instrument was developed by the researcher and is broken into three components (see
appendix 1).
The first component of the survey collects basic demographic information for purposes of
description and to assist in the selection of four schools for qualitative comparative
analysis. To accomplish these goals, demographic data on the educators in each school
will be examined to determine: (1) years of service in the school district, (2) years of
service in the facility under study, and (3) the number of educators within each school
involved in the planning process (see appendix 1 questions 1-5).

52
Figure 3. Research Design.
PRAGMATIC INQUIRY THROUGHSEQUENTIAL TRANSFORMATIVE STRATEGY
QUANTITATIVE QUALITATIVE
SURVEY OF MIDDLE
SCHOOLS DESIGNED AND CONSTRUCTED
IN THE COMMONWEAL
TH OF PA BETWEEN
1992 to 2003
SURVEY OF MIDDLE
SCHOOLS DESIGNED AND CONSTRUCTED
IN THE COMMONWEAL
TH OF PA BETWEEN
1992 to 2003
EDUCATIONAL FACILITIES PLANNING:
A SYSTEMS MODEL
School Meets Stakeholders
Needs
Management of Variables
Articulated Vision
FacilityPhysically
Represents Vision
Articulated Vision
School Meets Stakeholders
Needs
Management of Variables
FacilityPhysically
Represents Vision
MultipleRegression
Univariate Analysis
Document Review
Interviews Artifact Collection
PRAGMATIC INQUIRY THROUGHSEQUENTIAL TRANSFORMATIVE STRATEGY
QUANTITATIVE QUALITATIVE
PRAGMATIC INQUIRY THROUGHSEQUENTIAL TRANSFORMATIVE STRATEGY
QUANTITATIVE QUALITATIVE
SURVEY OF MIDDLE
SCHOOLS DESIGNED AND CONSTRUCTED
IN THE COMMONWEAL
TH OF PA BETWEEN
1992 to 2003
SURVEY OF MIDDLE
SCHOOLS DESIGNED AND CONSTRUCTED
IN THE COMMONWEAL
TH OF PA BETWEEN
1992 to 2003
SURVEY OF MIDDLE
SCHOOLS DESIGNED AND CONSTRUCTED
IN THE COMMONWEAL
TH OF PA BETWEEN
1992 to 2003
SURVEY OF MIDDLE
SCHOOLS DESIGNED AND CONSTRUCTED
IN THE COMMONWEAL
TH OF PA BETWEEN
1992 to 2003
EDUCATIONAL FACILITIES PLANNING:
A SYSTEMS MODEL
EDUCATIONAL FACILITIES PLANNING:
A SYSTEMS MODEL
School Meets Stakeholders
Needs
Management of Variables
Articulated Vision
FacilityPhysically
Represents Vision
School Meets Stakeholders
Needs
Management of Variables
Articulated Vision
FacilityPhysically
Represents Vision
Articulated Vision
School Meets Stakeholders
Needs
Management of Variables
FacilityPhysically
Represents Vision
Articulated Vision
School Meets Stakeholders
Needs
Management of Variables
FacilityPhysically
Represents Vision
MultipleRegression
Univariate Analysis
MultipleRegression
Univariate Analysis
Document Review
Interviews Artifact Collection
Document Review
Interviews Artifact Collection

53
The second component of the survey utilizes a Lickert scale to determine the
degree to which educators in each school believe: (1) their school has an articulated
vision, (2) those responsible for planning their facility understood and managed variables
within each of the six domains of planning, (3) those responsible for planning their
facility understood and managed the interaction of variables across the six domains of
planning, (4) their facility is a physical representation of their educational vision and (5)
their facility meets the needs of the stakeholders (see appendix 1, questions 6-59).
The third section of the survey asks educators to respond to a series of statements
designed to determine if, since the opening of the facility, there have been any changes:
(1) in teaching practices, (2) size, composition or needs of the student body, and/or (3)
the economics, politics, or culture of the school district or community. The section also
determines if respondents believe that if since the facility opened, if it has been used as
intended by the designers (see appendix 1, questions 60-65).
The content validity of the survey is established by three methods. First, the
survey questions are grounded in the definitions formulated by the systems model.
Second, two facility planning experts and a superintendent of schools with a background
in public school renovation and new construction review the instrument. Finally, the
instrument is field-tested by a forty-five member middle school faculty and a five
member administrative team from the researcher’s school district. Though the middle
school falls within the parameters for inclusion in the study, due to the relationship of the
researcher with the middle school and the school district, it is not considered part of the
population. This is due to the potential for researcher bias during qualitative analysis.

54
The educators are, however, appropriate for establishing the content validity of the survey
instrument.
Determining the Validity of the Systems Model through
Univariate Analysis and Multiple Regression
The quantitative phase of this investigation, through univariate analysis and
multiple regression, will seek the answers to five critical research questions. Each of
these questions represents a critical component of the Systems Model for Educational
Facility Planning and collectively represents the model as a whole. Through an
examination of the individual components and the model as a whole, a determination of
soundness of can be estimated. The five critical research questions ask: (1) Does the
school have an articulated educational vision? (2) Did the design professionals and
educators manage variables within the six domains of planning when designing the
facility? (3) Did the design professionals and educators manage the interaction of
variables across the six domains of planning when designing the facility? (4) Is the
facility a physical representation of that vision? and (5) Does the educational facility
meet the needs of the stakeholders?
Collectively these five questions examine two primary suppositions of the
Systems Model for Educational Facilities Planning. Those suppositions state: (1) If a
school has an educational vision and if those responsible for designing and constructing
the facility manage the interaction of economic, political, and social forces as well as the
needs of teachers and students, then using the resources available, design professionals
and educators can design and construct an educational facility that is a physical
representation of an educational vision and (2) If an educational facility is a physical

55
representation of an educational vision, it will meet the needs of its stakeholders.
Univariate analysis will be utilized to examine the distributional properties of
central tendencies of educators’ responses of: (1) the degree to which they believe their
school has an educational vision, (2) the degree to which they believe those responsible
for planning their facility understood variables within the six domains of planning, (3) the
degree to which they believe those responsible for planning their facility understood the
interaction of variables across the six domains of planning, and (4) the degree to they
believe their facility is a physical representation of the school’s educational vision. The
examination of central tendencies will be completed in order to: (1) develop a thorough
description of the responses of each variable being examined; (2) provide a descriptive
analysis of the convergence and divergence of central tendencies across different
variables; and (3) as means to determine the appropriateness of multivariate analysis.
In order to determine the validity of the core components of the Systems Model
for Educational Facility and the model as a whole, a multiple regression analysis will be
conducted. The degree to which educators report that their facility is a physical
representation of the schools educational vision will be identified as the dependent
variable. The degree educators report their school has an educational vision, facility
planners understood the six domains of planning, and facility planners understood the
interaction of the variables across the six domains will be entered as the independent
variables.
A second univariate analysis will examine the distributional properties of central
tendencies of educators’ responses of the degree to which they believe their facility is a
physical representation of the school’s educational vision and the degree to which they

56
believe their facility meets the needs of stakeholders. Again, the examination of central
tendencies will be completed in order to: (1) develop a thorough description of the
responses of each variable being examined; (2) provide a descriptive analysis of the
convergence and divergence of central tendencies across different variables; and (3) as
means to determine the appropriateness of multivariate analysis.
A multiple regression analysis will be conducted with the degree to which
educators report that their facility is a physical representation of the school’s educational
vision as the dependent variable. The degree to which educators report that their facility
meets the needs of stakeholders will serve as the dependent variable.
If the two primary suppositions of the Systems Model for Educational Facilities
Planning are valid, the validity of the systems model as a whole can be further
determined. By comparing, for each school in the sample, what the model predicts and
what was actually measured by the survey, the validity of the systems model can be
further determined. For example, if an individual school has an articulated vision, the
facility is a physical representation of the educational vision, and was constructed
through the management of variables within and across the six domains of planning, the
systems model predicts the facility will meet the needs of the stakeholders. If the survey
reveals the facility meets the needs of the stakeholders, the model is valid. However, if
the survey reveals that the facility does not meet the needs of the stakeholders, the model
would not be valid. All totaled, there are eight possible combinations of answers to the
first three questions listed above. For each unique set of combinations, the system model
predicts whether the facility will or will not meet the needs of the stakeholders. For a
complete listing of the possible combinations, see tables 6-13: Truth Table One through

57
Truth Table Eight. By comparing what has been predicted and what is measured, one can
quantitatively determine the validity of the systems model.
Table 2
Truth Table One
Does The School
Have An Articulated
Vision?
Is The Facility A Physical
Represen-tation Of
The Educational
Vision?
Do Design Professionals
And Educators Manage
Variables Within The
Six Domains Of Planning
When Designing The
Facility?
Resulting Statement
What Does The Model Predict Based On The
Resulting Statement?
School Meets The
Needs Of
Stake-Holders
Validity Of
Model
Yes
Model is valid.
Yes Yes Yes There is an articulated vision
for the school. The facility is a
representation of that vision. During the
planning of the facility the
physical, social, pedagogical, cultural, and
economic components of
the environment were managed.
The school will meet the needs
of the stakeholders.
No Model is not valid.

58
Table 3 Truth Table Two
Does The School
Have An Articulated
Vision?
Is The Facility A Physical
Represen-tation Of
The Educational
Vision?
Do Design Professionals
And Educators Manage
Variables Within The
Six Domains Of Planning
When Designing The
Facility?
Resulting Statement
What Does The Model Predict Based On The Resulting Statement?
School Meets The
Needs Of
Stake-Holders
Validity Of
Model
Yes
Model is not valid.
No No No There is not an articulated
vision for the school. The
facility is not a representation of
that vision. During the
planning of the facility the
physical, social, pedagogical, cultural, and
economic components of
the environment were not managed.
The school will not meet the needs of the stakeholders.
No Model is valid.

59
Table 4 Truth Table Three
Does The School
Have An Articulated
Vision?
Is The Facility A Physical
Represen-tation Of
The Educational
Vision?
Do Design Professionals
And Educators Manage
Variables Within The
Six Domains Of Planning
When Designing The
Facility?
Resulting Statement
What Does The Model Predict Based On The
Resulting Statement?
School Meets The
Needs Of
Stake-Holders
Validity Of
Model
Yes
Model is valid.
Yes Yes No There is an articulated vision
for the school. The facility is a
representation of that vision. During the
planning of the facility the
physical, social, pedagogical, cultural, and
economic components of
the environment were not managed.
The school should meet the
needs of the stakeholders.
The management of the physical,
social, pedagogical, cultural, and
economic components of
the environment was limited or non existent. However, a
scenario existed which allowed the acquisition
of the necessary resources from
the external environment.
An example of such a scenario
would be a district which
required minimal resources from an environment with extensive
resources.
No Model is not valid.

60
Table 5 Truth Table Four
Does The School
Have An Articulated
Vision?
Is The Facility A Physical
Represen-tation Of
The Educational
Vision?
Do Design Professionals
And Educators Manage
Variables Within The
Six Domains Of Planning
When Designing The
Facility?
Resulting Statement
What Does The Model Predict Based On The
Resulting Statement?
School Meets The
Needs Of
Stake-Holders
Validity Of
Model
Yes
Model is not valid.
No Yes Yes There is not an articulated
vision for the school. The facility is a
representation of that vision. During the
planning of the facility the
physical, social, pedagogical, cultural, and
economic components of
the environment were managed.
Though the planning of the facility included management of
the physical, social,
pedagogical, cultural, and
economic components of
the environment, the lack of a
vision results in a school which does not meet
the needs of the stakeholders.
No Model is valid.

61
Table 6 Truth Table Five
Does The School
Have An Articulated
Vision?
Is The Facility A Physical
Represen-tation Of
The Educational
Vision?
Do The Design
Professionals And Educators
Manage Variables
Within The Six Domains Of Planning
When Designing The
Facility?
Resulting Statement
What Does The Model Predict Based On The Resulting Statement?
School Meets The
Needs Of
Stake-Holders
Validity Of
Model
Yes
Model is not valid.
Yes No Yes There is an articulated vision
for the school. The facility is
not a representation of
that vision. During the
planning of the facility the
physical, social, pedagogical, cultural, and
economic components of
the environment were managed.
Though there was an
articulated vision for the building it will not meet the needs of the
stakeholders. Even though the physical, social,
pedagogical, cultural, and
economic components of
the environment were managed, the building is not a physical
representation of that vision. An example of such a scenario would
be a district which had a
vision and the necessary
resources, but limited
architectural acuity.
No Model is valid.

62
Table 7 Truth Table Six
Does The School
Have An Articulated
Vision?
Is The Facility A Physical
Represen-tation Of
The Educational
Vision?
Do Design Professionals
And Educators Manage
Variables Within The
Six Domains Of Planning
When Designing The
Facility?
Resulting Statement
What Does The Model Predict Based On The Resulting Statement?
School Meets The
Needs Of
Stake-Holders
Validity Of
Model
Yes
Model may be valid
No No Yes There is not an articulated vision
for the school. The facility is
not a representation of
that vision. During the
planning of the facility the
physical, social, pedagogical, cultural, and
economic components of
the environment were managed.
This facility should not meet
the needs of stakeholders
because it has no articulated vision unless by chance the management
of the environment
freed the resources to
build a facility which does not
match the physical
representation of the poor vision,
but ends up meeting the needs of the stakeholders.
No Model is valid

63
Table 8 Truth Table Seven
Does The School
Have An Articulated
Vision?
Is The Facility A Physical
Represen-tation Of
The Educational
Vision?
Do Design Professionals
And Educators Manage
Variables Within The
Six Domains Of Planning
When Designing The
Facility?
Resulting Statement
What Does The Model Predict Based On The Resulting Statement?
School Meets The
Needs Of
Stake-Holders
Validity Of
Model
Yes
Model is not valid.
Yes No No There is an articulated vision
for the school. The facility is
not a representation of
that vision. During the
planning of the facility the
physical, social, pedagogical, cultural, and
economic components of
the environment were not managed.
This facility should not meet the needs of the
stake holders because it is not
a physical representation of
the articulated vision.
Variables within the six domains
of planning were not managed.
No Model is valid

64
Table 9 Truth Table Eight
Does The School
Have An Articulated
Vision?
Is The Facility A Physical
Represen-tation Of
The Educational
Vision?
Do Design Professionals
And Educators Manage
Variables Within The
Six Domains Of Planning
When Designing The
Facility?
Resulting Statement
What Does The Model Predict Based On The
Resulting Statement?
School Meets The
Needs Of
Stake-Holders
Validity Of
Model
Yes
Model is not valid.
No Yes No There is not an articulated vision
for the school. The facility is a
representation of that vision. During the
planning of the facility, the
physical, social, pedagogical, cultural, and
economic components of
the environment were not managed.
This facility should not meet the needs of the
stakeholders because there is
not an articulated
vision. The facility is a
physical representation of
a poor vision, and the
components of the environment in which it was
planned were not managed.
No Model is valid

65
Research Design – Phase Two
Research Parameters
As stated earlier, it is recognized that the complexity of the phenomenon being
studied, the difficulty in establishing valid causal inferences in social research, and the
need for high generalizability creates daunting challenges for any research design. This
is especially true for the qualitative phase of this study.
Of these challenges, generalizability presents a particularly difficult obstacle for
qualitative research. As Johnson and Christensen (2000) point out, generalizability is
traditionally not the purpose of qualitative research because of two reasons. First, a
random selection of the population being studied is rarely performed. Second, most
qualitative researchers are interested in the documentation of “particularistic” findings
rather than “universalistic” findings (Johnson & Christensen, 2000). However, Johnson
and Christensen go on to cite experts who believe that “rough generalizations” can be
made through the utilization of qualitative research. Johnson and Christensen believe
defendable generalizations can be made in qualitative research through the examination
and identification of commonalities between people, circumstances, or phenomena in the
original research, and the people, circumstances, or phenomena to which the research is
applied (Johnson & Christensen, 2000).
Replication logic is a strategy for strengthening what Johnson and Christensen
(2000) termed “defendable generalizations.” The basic logic behind the argument of
replication in qualitative studies is consistent with the logic of replication in quantitative
studies. Yin, as summarized by Jones, Smaling, and Tillis, reasons that the more times a

66
qualitative research finding is shown to be true with different sets of people and/or in
different contexts, the more confidence one can place in the finding and in the conclusion
that the finding can be generalized beyond the original study (Jones, 2003; Smaling,
2003; Tillis, 1997).
A final means of gaining generalizability is through maximum variation sampling.
As summarized by Patton (2002), maximum variation sampling is a method of purposeful
sampling which “aims at capturing and describing the central themes that cut across the
greatest variation. For small samples, a great deal of heterogeneity can be problematic
because individual cases are unique. The maximum variation strategy turns that
weakness into a strength by applying the following logic: Any common patterns that
emerge from great variation are of particular interest and value in capturing the core
experiences, along with central, shared dimensions of a setting or phenomenon” (Patton,
2002).
The research design of this study capitalizes on the three concepts and strategies
defined by Johnson and Christensen, Yin, and Patton in order to provide the optimum
opportunity for in-depth understanding of the core components of the systems model,
generate the greatest influence over internal validity, and maximize generalizability.
First, as Patton argues, “any common patterns that emerge from great variation are of
particular interest and value in capturing the core experiences, along with central, shared
dimensions of a setting or phenomenon” (Patton, 2002). Therefore, the research design
requires that the sites selected for case study demonstrate the greatest variation in two
core components of the systems model. Those two core components are the degree to
which each school has an educational vision (the educational form) and the degree to

67
which each school is a physical representation of that vision (the architectural function).
Utilizing data from the survey completed in phase one of this study, four schools are
selected through maximum variation sampling for participation in a multi-site case study
of comparative analysis. Maximum variation sampling reduces researcher bias, increases
internal validity, and provides a means of replication. Once selected, methods of cross-
verification at each site are utilized to compare what the system model predicts, what the
quantitative data yields about the site, and the qualitative data collected. The exact
method of selecting these schools will be discussed later in this chapter.
Second, as Johnson and Christensen believe, the more similar people and
circumstances in a particular case are to the people and circumstances in another case, the
more defensible a generalization will be, and the more readily generalizations can be
made (Johnson & Christensen, 2000). Therefore, while the sites selected for case study
show the greatest variation to the degree in which each school has an educational vision
and the degree to which each school is a physical representation of that vision, they are
all middle schools built and opened in the Commonwealth of Pennsylvania between 1992
and 2003. Selecting middle schools built and opened in the Commonwealth of
Pennsylvania between 1992 and 2003 creates commonalities in the: (1) geographic
region, (2) age of the facilities, (3) statues and regulations under which the facilities were
built, (4) teaching certifications required, (5) age range of students, and (6) fact that
curriculum, instructional practices, and programs at the sites are designed to meet the
needs of early adolescents.
The third strategy utilized is based on Yin’s premise that the more times a
qualitative research finding is shown to be true with different sets of people and/or in

68
different contexts, the more confidence one can place in the finding and in the conclusion
that the finding can be generalized beyond the original study (Jones, 2003; Smaling,
2003; Tillis, 1997). To this end, four sites are selected for comparative analysis. In
treating each of the four cases as unique and separate entities, but holding the
methodology constant, leverage over generalizability is gained through replication logic.
Selection of Sites for Comparative Analysis: Tier One
Consistent with the pragmatic tradition in which this study is grounded, the
qualitative phase of this study requires that the validity of the systems model be measured
by its experimental results and by the practicality of its use. Driven by the need for sound
experimental procedures and generalizability of the results, the selection of schools for
qualitative study is the most critical step of this phase.
As stated earlier, the complex patterns, interactions, and relationships of the
environment in which educational facilities are planned make it difficult to evaluate the
validity of the systems model based on only quantitative data. Therefore, the survey will
also be used to determine the degree to which each school in the sample: (1) has an
articulated vision, (2) is a physical representation of that vision, (3) is designed and
constructed through the management of variables within and across the six domains of
planning, and (4) meets the needs of the stakeholders.
The four schools selected for comparative analysis are chosen based on a two-
tiered process. On the first tier, schools will be sorted based on two variables: (1) the
degree of articulation of the educational vision and (2) the degree to which the facility is
a physical representation of that vision. The selection of the four schools over the widest
possible continuum of these two variables is consistent with the maximum variation

69
strategy and better addresses concerns of validity, transferability, and researcher bias
which often arise during a qualitative analysis of this nature.
In order to make a valid selection over the widest continuum, it is
necessary to return to Louis Sullivan’s basic design principle of form follows function.
Through the literature review it has been established that regardless of the fact that all
five categories of models approach the planning and design of educational facilities
differently and each result in an architectural product with distinct features, Louis
Sullivan’s basic design principle of form follows function is found at the core of
educational facility planning models. In other words, regardless of the school of thought
on pedagogical practices, planning, or facility design, architects and design professionals
consistently demonstrate the belief that if an educational facility is a clear physical
representation (form) of a well articulated educational vision (function), the facility will
meet the needs of those it serves. If one considers the two basic elements of this belief as
separate but intersecting continua, they can be placed on an x and y axis. The x axis
represents the degree of clarity of the educational vision and the y axis represents the
degree to which the educational facility is a physical representation of that vision. The
intersection of these axis yields four distinct contingencies (see figure 4).
The quadrant labeled “1” represents a clearly articulated educational vision and a
facility that is a clear, physical representation of that vision. This quadrant illustrates the
fulfillment of the basic design principle to which all facility planning models strive. In
addition, it provides a means of illustrating why the systems model predicts that some
newly constructed schools become vital to the success of students and critical to the
health of the community.

70
Educational Facility is a Clear Physical Representation of the Educational Vision
y
Poorly 2 1 Clearly
Articulated Articulated Educational x Educational Vision 3 4 Vision Educational Facility is a Poor Physical Representation of the Educational Vision
Figure 4. Articulation of An Educational Vision v. the Degree to Which an Educational Facility is a Physical Representation of an Educational Vision
The quadrant labeled “2” results from an educational vision that is poorly
articulated and a facility that is a clear, physical representation of a poorly articulated
vision. The quadrant labeled “3” represents an educational vision which is poorly
articulated and a facility which is a poor physical representation of that vision. Quadrants
2 and 3 are based on the premise that a clearly articulated educational vision does not
exist. At this point, the degree to which a facility is a physical representation of that
vision is a moot point. From the onset, these two quadrants cannot fulfill Sullivan’s basic

71
design principle, and the resulting facility cannot meet the needs of those it serves. In
other words, without a clearly defined function, a successful form can not follow. This is
a very plausible explanation that illustrates why the systems model predicts how some
newly constructed facilities fail to meet the needs of children and/or the community.
The quadrant labeled “4” represents a clearly articulated educational vision, but
the facility is a poor representation of that vision. Unlike quadrants 2 and 3, this quadrant
assumes that a clearly articulated educational vision does exist. The facility, however,
fails to become a physical representation of that vision. In this case, the function exists,
but the form does not follow. This too, is a plausible explanation which illustrates why
the systems model predicts how some newly constructed facilities fail to meet the needs
of children and/or the community.
Selection of Sites for Comparative Analysis: Tier Two
The second tier of the selection process will utilize the demographic data
compiled with the first component of the survey and the univariate analysis of the degree
to which educators within each school believe their school: (1) has an articulated
educational vision, (2) is a physical representation of their educational vision, (3) is
designed by the design professionals and educators who manage variables within and
across the six domains of planning, and (4) meets the needs of the stakeholders. The
purpose of this second tier of selection is to ensure that along with the strategy of greatest
variation, the sites that are selected are information-rich and provide the greatest
opportunity to yield insights and understanding.

72
Qualitative Comparative Analysis
With the identification of the four schools for case study, a qualitative
comparative analysis will be completed. Comparative analysis, as detailed by Charles
Ragin (2000), involves representing each case study as a combination of causal and
outcome conditions and then comparing those combinations of conditions across multiple
sites. Ragin’s strategy utilizes “truth tables” which are developed by coding the presence
or absence of each attribute of interest. The information in the truth table displays the
different combinations of conditions that produce a specific outcome. Through the
systematic identification of causal and outcome conditions, similarities and differences
can be explored while preserving the uniqueness of each case (Ragin, 2000).
In phase one of this research design, univariate analysis and multiple regression is
utilized to examine eight possible combinations of conditions predicted by the systems
model. These eight combinations are represented in tables 6-13: Truth Tables One, Two,
Three, Four, Five, Six, Seven, and Eight. Through a utilization of these same tables for
phase two of the study, three highly desired outcomes are achieved: (1) consistency is
provided across the quantitative and qualitative phases of the investigation, (2) the
research design of the qualitative phase maintains focus to determine the validity of the
systems model, and (3) through the comparison of what has been predicted and what is
measured, one can qualitatively determine the validity of the systems model.
Using the systems model as a lens, the answers to five critical questions for each
of the four schools will be sought. These questions directly reflect the core components
of the systems model and are identical to the questions sought in the quantitative phase of
this study. These questions are: (1) Does the school have an articulated educational

73
vision? (2) Is the facility a physical representation of that vision? (3) Do the design
professionals and educators manage variables within the six domains of planning when
designing the facility? (4) Do the design professionals and educators manage variables
across the six domains of planning when designing the facility? and (5) Does the
educational facility meet the needs of the stakeholders? For the purpose of this study, the
four questions have only one of two possible answers: “yes” or “no”.
The strategy of data triangulation will be utilized to qualitatively determine the
answers to the five questions listed above and to establish a sound method of cross-
verification. According to Denzin, data triangulation is a process of authenticating
observations through the use of a variety of data sources in a study (1989). Three
separate data sources will be collected for each site. Within each set of data sources,
evidence will be sought to qualitatively determine the answers to questions which directly
reflect the core components of the systems model. These data sources will include text
documents, interviews, and artifacts.
The case study for each site will begin with a thorough review of text documents
in the form of public construction records housed at the Pennsylvania Department of
Education. These records, collectively known as PlanCon, represent a set of documents
required for every public school construction project that seeks reimbursement from the
Commonwealth of Pennsylvania. The PlanCon documents provide in-depth information
about the: (1) description of a proposed project and the justification for its need, (2)
technical review of the conceptual drawings, site plan, and educational specifications, (3)
site acquisition, (4) estimated project costs and various tests of a district's financial ability
to make payments, (5) review of architectural aspects of a project when the design is fully

74
developed, (6) architectural aspects of the project and documentation that other state and
local agency requirements have been met or will be met before entering into construction
contracts, (7) construction bids, and (8) financing and final costs (PlanCon, 2003).
Second, at each site, interviews will be conducted with representatives from each
of the following subgroups: (1) teachers, (2) administrators, and (3) the building
architects and/or design professionals. The interviews will follow a standardized open-
ended format. The standardized open-ended format as described by Patton (2002)
requires that the exact wording and sequencing of the questions be determined in
advance, and that all interviewees are asked the same base set of questions in the same
order. However, the questions are worded in a completely open-ended format. The
interviews are taped, transcribed, and analyzed. The transcripts are analyzed using the
strategy of thematic analysis of text and memoing. This is the same strategy utilized in
the analysis of the literature base and described in chapter one.
Like the survey instrument used in phase one of this investigation, the interview
questions are broken into three components (see appendix 2). The first component
collects basic demographic information about each respondent which includes: (1) years
of service, (2) their role in the school district and school, and (3) involvement with the
planning the facility. The second component of the interview determines if the
respondent recognizes the presence of an educational vision, variables within the six
domains of planning, interaction between the domains of planning, if the facility is a
physical representation of the educational vision, and if the facility meets the needs of the
stakeholders. The final component of the interview asks the respondent for each of the
six domains of planning to explain: (1) the importance of each domain with regard to

75
facility planning, (2) if those responsible for planning the facility understand the domain,
and (3) the degree to which variables within the domain impact the final design.
Finally, in order to gain a more thorough understanding of the data uncovered
during the document analysis and interviews, the presence or absence of artifacts will be
utilized to complete the third element of triangulation. Artifacts represent how people
use and conceptualize objects. In the broadest sense, Creswell defines artifacts as what
people make and use (1998). Artifacts are examined from any number of perspectives,
including where the objects are, how many there are, their functional role, their
conversational role, their physical characteristics, or their flexibility of use through
different situations (Usability Glossary, 2004). As with the first two data sources,
physical artifacts will be used to indicate: (1) the presence or absence of an articulated
vision, (2) if a school is or is not a physical representation and educational vision, (3) if
design professionals and educators do or do not manage variables within and across the
six domains of planning when designing the facility, and (4) if the educational facility
meets or does not meet the needs of the stakeholders. Artifacts may include, but are not
limited to: ways in which educators, students, parents, and the community utilize the
building, building design, reflections of the culture of the school district in architecture,
spaces to showcase or support the history, traditions, and success of the school, minutes
from meetings, informational flyers, newsletters, and any physical objects from the
design and construction of the facility. In addition, the absence of artifacts also serves as
indications of the absence of a variable. For example, a school with a well articulated
vision may have a formal place for the posting of their mission statement. On the other
hand, a school with a poorly articulated educational vision may have no such space.

76
Cross-Validation
Upon completion of both phases of the research design and through an
examination of the similarities and differences in the conclusions of each, the
transformative sequential research design grounded in the pragmatic tradition, provides
the opportunity to measure the validity of the systems model by both quantitative and
qualitative experimental results. In turn, the cross-validation between the two
methodologies provides a better opportunity to examine its generalizability and
practicality of its use.
Assuming that the proper degree of validity exists, the systems model formalizes
causal inferences between social, cultural, political, and economic mechanisms, the
planning of educational facilities. This provides insight and promotes discussion on the
complicated social, cultural, political, and economic mechanisms at work when public
schools are designed and constructed in a pluralistic democratic society. In turn,
elaboration’s are made on the relationships between those mechanisms, educational
facility planning, and educational facilities.

77
CHAPTER IV
ANALYSIS OF DATA
Introduction
This study attempts to develop a theoretical construct from which design
professionals and educators can better organize, understand, analyze, communicate, and
research complex cause-effect relationships that occur when educational facilities are
designed and constructed. Through the utilization of a primarily experiential literature
base, a thematic analysis of text, and a synthesis of literature from education, educational
administration, architecture, and organizational sociology, a systems model of public
educational facilities is developed. This model represents an attempt to develop a
theoretical construct from which design professionals and educators can better organize,
understand, analyze, communicate, and research complex cause-effect relationships that
occur when educational facilities are designed and constructed. The Systems Model for
Educational Facilities Planning attempts to: (1) identify and describe complicated social,
cultural, political, and economic mechanisms at work when public schools are designed
and constructed in a pluralistic democratic society, (2) make understandable the
relationships between those mechanisms and educational facility planning, and (3)
formalize causal inferences between social, cultural, political, and economic mechanisms,
educational facility planning, and educational facilities. The goal of this study is to
determine the validity of the Systems Model for Planning of Educational Facilities.
It is recognized that the complexity of the phenomenon being studied, the
difficulty in the establishment of valid causal inferences in social research of this nature,
and the need for high generalizability creates a daunting challenge for any research

78
design. A sequential transformative research design grounded in the pragmatic tradition
is employed. As defined by Creswell (2003), sequential transformative research is a
mixed methodological approach which utilizes a theoretical lens (in this case, the systems
model) to ground a study. A sequential transformative research design capitalizes on
concurrent quantitative and qualitative data collection as a means to offset the weakness
inherent within one methodology with the strengths of the other methodology (Creswell,
2003). A sequential transformative research design maximizes leverage over the
complexity of the systems model and provides the greatest opportunity to make
generalizations to other contexts and settings.
Through the utilization of the systems model as a lens, this study is conducted to
use a research design with two sequential stages. The first phase of the investigation
utilizes quantitative methods to describe the sample population and examine, through
univariate analysis and multivariate analysis, the validity of the core components of the
systems model and the systems model as a whole. Data collection is accomplished
through the use of a fifty question survey instrument (see Appendix A). The second
phase of the investigation utilizes qualitative methods to complete a comparative case
study analysis of four purposefully selected case studies, and like the first phase, it does
so to examine the validity of core components of the systems model and the systems
model as a whole.
Both the quantitative study and qualitative study examine five critical research
questions. Those questions, identical in both sequential stages of the research, directly
reflect the core components of the Systems Model for Educational Facilities Planning and
the systems model as a whole. The five critical research questions were as follows: (1)

79
Does the school have an articulated educational vision? (2) Do the design professionals
and educators manage variables within the six domains of planning when designing the
facility? (3) Do the design professionals and educators manage the interaction of
variables across the six domains of planning when designing the facility? (4) Is the
educational facility a physical representation of the educational vision? and (5) Does the
educational facility meet the needs of the stakeholders?
By comparing and contrasting the results of two distinct methodologies, the
research design provides the greatest opportunity to: (1) describe complicated social,
cultural, political, and economic mechanisms at work when public schools are designed
and constructed in a pluralistic democratic society, (2) elaborate on the relationships
between those mechanisms and educational facility planning, and (3) cross-validate,
through quantitative and qualitative methods, a systems model which formalizes causal
inferences between social, cultural, political, and economic mechanisms, educational
facility planning, and educational facilities.
Quantitative Data: Survey Information and Results
Survey Overview
The survey instrument (appendix A) is designed to collect data regarding
educators’ beliefs on the degree to which: (1) their school has an articulated vision, (2)
their educational facility is a physical representation of the educational vision, (3) design
professionals and educators responsible for planning the building manage physical,
social, pedagogical, cultural, and economic components of the environment, and (4) the
educational facility meets the needs of the stakeholders.
The superintendents and principals of fifteen schools granted permission to

80
conduct research in their school district. The fifteen schools in which the survey was
administered were all middle facilities built and opened in the Commonwealth of
Pennsylvania between 1992 and 2003. Selecting middle schools built and opened in the
Commonwealth of Pennsylvania between 1992 and 2003 created commonalities in the:
(1) geographic region, (2) age of the facilities, (3) statues and regulations under which the
facilities were built, (4) teaching certifications required of the faculty, (5) age range of
students, and (6) fact that curriculum, instructional practices, and programs at the sites are
designed to meet the needs of early adolescents. Collectively, the fifteen schools
employed 792 educators (PDE, 2004). With the consent of the superintendent of schools
and building principals, surveys were mailed to each facility, voluntarily completed and
returned in August, September, and October of 2005. The survey had a return rate
63.26% with 501 of the potential 792 educators responding.
Survey Validity
In order to validate the survey developed for this study, it is reviewed by
nationally recognized experts in educational facility planning and by university faculty
acknowledged for their expertise in data collection and analysis. In addition, the survey
is field tested with the faculty of a newly constructed middle school that met all the
criteria to be in the sample population, but would be excluded from participating in the
research study. Through these procedures, content validity is attained. Finally, when the
surveys are returned, the responses are analyzed to evaluate their internal consistency
reliability. The estimate of the internal consistency for the surveys as a whole is very
high, with a reliability coefficient of 0.975. The estimates for the internal consistency of

81
individual categories of items are also high, with the reliability coefficients ranging from
0.818 to 0.920 (see table 10).
Table 10
Cronbach’s Alpha Scores for Full Survey and Question Groupings
Survey Section Survey Questions Cronbach’s Alpha Respondent Background 1-3 N/A All Questions (Other Than Background) 4-50 .975 Educational Vision 4, 14, 15, 16, 17, 18 .867 Building is Physical Representation of Educational Vision
5, 19, 20, 21, 22, 23 .919
Demographics 6, 24, 25. 26 .849 Pedagogy 7, 27, 28, 29 .855 Culture 8, 30, 31, 32, 33, 34 .872 Economics 9, 35, 36, 37 .827 Politics 10, 38, 39, 40 .818 Architectural Acuity 11, 41, 42, 43, 44 .862 Facility Meets the Needs of Stakeholders 12, 45, 46, 47 .920 Interaction of Variables Within and Across the Six Domains of Planning
13, 48, 49, 50 .842
Survey Design
The fifty item survey consists of three questions and forty-seven statements to
which educators are asked to respond. The survey statements are designed so that a
response does not require direct involvement with planning the educational facility. The
responses are made using a Likert scale. Written instructions on the survey inform

82
participants that, “responding to many of the statements require that you answer based on
your impressions or interpretations of this school, community, facility, and/or the
planning and design of public schools. Statements requiring the use of impressions or
interpretations were included with intent. Furthermore, the instructions request that
participants “respond to the statements based on their experience teaching in this facility
(building).”
The survey is divided into eight distinct sections. In order to build a profile of the
respondents, the first section contains three questions with the first being: “Were you
involved in the planning of this facility?” Out of the 501 participants, 179 or 36.03%
respond “yes” to this question. The responses to this statement are used as secondary
criterion in determining schools selected for a comparative case study. The second asks:
“Since the opening of this facility (building), do you believe that it has been used as
intended by the designers?” In response to this question, 88.93% answer “yes”. Again,
the data serves as secondary criterion in the selection of four schools for a comparative
case study. The final question of this section is as follows: “How many years have you
worked in the facility (building)?” Through an analysis of the responses to this question
in the context of the year that each facility opened, estimations are made with regard to
the potential quantity and quality of data which is collected during qualitative analysis.
This too is important secondary criterion in the determination of a school to be selected
for a comparative case study.
In the second section of the survey, educators are asked to respond to two
statements, using a six-point Likert scale. The first of these statements is as follows:
“Within this school and the community that it serves, there is a shared sense of purpose

83
and a focus on what is important for students.” This statement is designed to measure the
degree to which an educational vision exists. The second statement, designed to
determine the degree to which the facility contributes to the attainment of the educational
vision reads: “This facility contributes to a shared sense of purpose and a focus on what is
important for students.” The mean responses from these two statements are utilized as
the primary criteria in a two-tiered selection process to choose the four schools for
comparative case analysis. The research design of this study specifies that the four
schools selected for qualitative analysis have the widest possible values of the means of
the responses to the two statements. This is consistent with the maximum variation
strategy and better helps to offset concerns of external validity, transferability, and
researcher bias which often arise during qualitative analysis. The second tier of the
selection process utilizes the profile of the respondents developed from information
gained from the questions in the first section of the survey. The purpose of the second
tier of selection is to ensure that along with the strategy of greatest variation, the sites
selected are information-rich and provide the greatest opportunity to yield insights and
understanding.

84
Table 11:
Demographics of Survey Participants
Question Number
Demographics of Respondents Response
Count
Percent
Number of Schools 15 Possible Participants 792 Total Participants 501 63.26% 1 Involved in Planning Yes 179 36.02% No 318 63.98% 2 Years Spent in Facility 0 to 2 68 13.65% 3 to 4 149 29.92% 5 to 6 101 20.28% 7 to 8 68 13.65% 9 to 10 26 5.22% 10+ 86 17.27% 3 Facility Utilized As Designed Yes 434.00 88.93% No 54.00 11.07% Total 488.00 100.00%
The third section of the survey contains eight questions, which again, uses a six-
point Likert scale; the participants respond to a series of statements designed to determine
the degree to which those responsible for planning their school understand each of the six
domains of planning, the interaction of these domains, and the degree to which the
facility meets the needs of faculty, staff, students, and the community.
The remaining sections of the survey utilizes a seven-point Likert scale. Three
positive and three negative choices on either side of a neutral response is utilized in order
to divide the responses into positive and negative groupings, with three on either side of
the neutral response. This was done for the purpose of completing analysis through
logistic regression. However, when the survey responses are analyzed, a disproportionate
number of positive responses make analysis through logistic regression impossible. The

85
fourth section of the survey contains five statements. The first four statements are
designed to determine the degree to which: (1) educators, (2) parents, (3) the community,
and (4) students each have a shared sense of purpose and a focus on what is important for
students. The fifth statement directly requires educators to respond to the statement:
“This school has an educational vision.”
The fifth section of the survey also contains five statements. The first four
statements require educators to respond with the degree to which the facility helps
promote a shared sense of purpose and focus on what is important for students among:
(1) educators, (2) parents, (3) the community, and (4) students. The fifth question
directly requires educators to respond to the statement: “The design and appearance of
this facility conveys the educational vision of the school.”
The next six sections of the survey presents educators with statements with regard
to the degree to which: (1) a detailed understanding of each of the six domains is
necessary for planning an educational facility, (2) those responsible for planning the
respondent’s school understand each of the six domains, and (3) variables within each
domain impact the final design of the facility.
The seventh section consists of three statements. Each statement requires
respondents to state the degree to which the facility meets the individual needs of: (1)
teachers, (2) students, and (3) the community.
The eighth section requires educators to respond to three statements with regard to
the degree to which: (1) a detailed understanding of the interaction of the variables across
the six domains of planning is necessary for planning an educational facility, (2) those
responsible for planning the respondent’s school understand the interaction of variables

86
across the six domains, and (3) the interaction of variables across the six domains impact
the final design of the facility.
Across the entire survey, the statements to which educators respond are grouped
into twelve categories. The categories of statements reflect the critical components of the
Systems Model for Educational Facilities Planning and the model as a whole, and are
designed to collect information on the process of educational facilities planning and/or
the impact of educational facilities planning on the final design of an educational facility.
In addition, the categories of questions are utilized as a means to cross-validate the
responses of individuals and faculties as a whole. These categories are used to cross-
validate responses that reflect critical components of the educational facilities planning
model and the model as a whole. The twelve categories and their descriptions are as
follows: (1) Respondent Background – Information on survey participants, (2) All
Questions Other Than Respondent Background – Survey statements which collectively
examine the model as a whole, (3) Educational Vision – Survey statements which
examine the shared sense of purpose and focus on what is important for students within
the school district and community, (4) The Facility as a Physical Representation of the
Educational Vision – Survey statements which examine the degree to which a facility
contributes to a shared sense of purpose and focus on what is important for students, (5)
Demographics – Survey statements which examine the size, composition, and needs of
the student body, (6) Pedagogy – Survey statements which examine methods of
instruction and how students learn, (7) Culture – Survey statements which examine the
values, attitudes, beliefs standards, traditions, and customs of the school district and
community, (8) Economics – Survey statements which examine the economics of the

87
school district and community, (9) Politics – Survey statements which examine the
relationships between educators, elected officials, parents, community groups and
citizens within the community, (10) Architectural Acuity – Survey statements which
examine the ability of an architect and design professionals to understand the needs of a
school district and community, and their ability to design a school which is a physical
representation of the educational vision, (11) The Degree to Which the Facility Meets the
Needs of Stakeholders – Survey statements which examine the degree to which a facility
meets the needs of faculty, staff, students, and the community (12) The Interaction of
Variables Within and Across the Six Domains of Planning – Survey statements which
examine the interaction of economic, political, and social forces, as well as the needs of
teachers and students.

88
Table 12
Summary of Survey Statements/Questions and Analysis of Responses
Survey Number Summary of Statement/Question n Mean SD SE
4 Shared Purpose and Focus – Vision 501 5.026 0.9388 0.0419 5 Facility Contributes to Vision 500 5.056 0.9223 0.0412
6 Those responsible for planning understood size, needs, composition of the student body – Demographics 496 4.139 1.2960 0.0582
7 Those responsible for planning understood teaching and learning – Pedagogy 498 4.494 1.1598 0.0520
8 Those responsible for planning understood values, attitudes, beliefs, standards, traditions, and customs – Culture 497 4.674 1.0523 0.0472
9 Those responsible for planning understood economics of school district and community – Economics 495 4.709 1.0437 0.0469
10
Those responsible for planning understood relationships between educators, elected officials, parents, community groups, and citizens – Politics 493 4.527 0.9989 0.0450
11 The architect and design professionals understood needs – Architectural Acuity 491 4.271 1.1526 0.0520
12 Facility meets needs of faculty, staff, students, and the community 499 4.202 1.3343 0.0597
13
Those responsible for planning understood the interaction of economic, political, and social forces, as well as needs of teachers and students – Interaction 490 4.288 1.0876 0.0491
14 Educators have a shared sense of purpose and focus 499 6.056 1.0064 0.0451
15 Parents have a shared sense of purpose and focus 500 5.296 1.1309 0.0506
16 Community has a shared sense of purpose and focus 498 5.253 1.1224 0.0503
17 Students have a shared sense of purpose and focus 500 5.168 1.0873 0.0486
18 School has an educational vision 498 6.046 1.0671 0.0478
19 Facility helps promote sense of Purpose and focus for educators 497 5.658 1.2097 0.0543

89
Table 12 (continued).
Survey Number Summary of Statement/Question n Mean SD SE
20 Facility helps promote sense of Purpose and focus for parents 499 5.515 1.0761 0.0482
21 Facility helps promote sense of Purpose and focus for community 498 5.448 1.0998 0.0493
22 Facility helps promote sense of Purpose and focus for students 498 5.490 1.1281 0.0505
23 Design and appearance of facility Conveys educational vision of school 498 5.526 1.3094 0.0587
24 Planning requires detailed understanding of demographics 496 5.760 1.2859 0.0577
25 Those responsible for planning facility understand demographics 495 4.810 1.6883 0.0759
26 Demographics impacted final design of the facility 495 4.766 1.6064 0.0722
27 Planning requires detailed understanding of pedagogy 495 5.487 1.2611 0.0567
28 Those responsible for planning facility understood pedagogy 492 4.915 1.4444 0.0651
29 Pedagogy impacted final design of the facility 491 4.931 1.5184 0.0685
30 Planning requires detailed understanding of culture 490 5.416 1.1450 0.0517
31 Those responsible for planning facility understand culture 491 5.004 1.3340 0.0602
32 Culture impacted final design of the facility 489 5.039 1.3059 0.0591
33 Facility promotes sense of community 495 5.329 1.4519 0.0653
34 Facility promotes school pride 492 5.772 1.2097 0.0545
35 Planning requires detailed understanding of economics 487 5.559 1.1332 0.0513
36 Those responsible for planning facility understood economics 489 5.284 1.2959 0.0586
37 Economics impacted final design of the facility 489 5.558 1.2016 0.0543
38 Planning requires detailed understanding of politics 489 5.311 1.1863 0.0536
39 Those responsible for planning facility understood politics 489 5.000 1.3306 0.0602
40 Politics impacted final design of the facility 486 4.912 1.3677 0.0620
41 Planning requires detailed understanding of architectural acuity 487 5.544 1.1375 0.0515

90
Table 12 (continued).
Survey Number Summary of Statement/Question n Mean SD SE
42 Those responsible for planning facility understood architectural acuity 488 4.857 1.4627 0.0662
43 Architectural acuity impacted final design of the facility 489 4.939 1.4071 0.0636
44
Arrangement of spaces, materials, mechanical and electrical systems, and overall appearance demonstrate architects expertise in turning the vision into a facility 487 4.600 1.6966 0.0769
45 Facility meets needs of teachers 494 4.899 1.6269 0.0732 46 Facility meets needs of students 496 4.988 1.6068 0.0721 47 Facility meets needs of community 492 5.244 1.3842 0.0624
48
Planning requires detailed understanding of Interaction of variables within and across the domains of planning 491 5.436 1.1471 0.0518
49
Those responsible for planning facility understood interaction of variables within and across the domains of planning 488 4.881 1.3872 0.0628
50
Interaction of variables within and across the domains of planning impacted final design of the facility
489
4.926
1.4050
0.0635
Survey Results: Educational Vision
The quantitative phase of this investigation, through univariate analysis and
multiple regression, yields the answers to five critical questions. Each of these questions
represents a critical component of the Systems Model for Educational Facility Planning.
Through an examination of the individual components as well as the model, as a whole, a
determination of soundness of the model can be estimated.
The first of these five critical questions is as follows: “Does the school have an
educational vision?” For the purpose of this study, an educational vision is defined as a
feasible and attainable picture or image of what the school district can become in the

91
future. An educational vision helps focus attention on what is important, provides
purpose, motivates staff, students, and the community, and increases a sense of shared
responsibility for student learning (NCREL, 2002). Educators respond to the statement:
“This school has an educational vision.” A summary of the mean responses to this
statement, number 18 in the survey, can be reviewed in table 13, column C. The mean
responses from each of the fifteen schools are ranked from high to low in table 14,
column B. In addition, the ranking in the table 14 is separated into a top, middle, and
bottom third.

92
Table 13 Summary of Mean Responses to Survey Questions Designed to Examine Critical Pieces of the Systems Model for Educational Facility Planning and the Model as a Whole
A
School
B n
C
Degree to Which
School has an
Educational Vision (18)
D
Those Responsible for Planning Understood
Demographics (6)
E
Those Responsible
for Planning
Understood Pedagogy
(7)
F
Those Responsible
for Planning
Understood Culture
(8)
G
Those Responsible
for Planning
Understood Economics
(9)
H
Those Responsible
for Planning
Understood Politics
(10)
I
Those Responsible
for Planning
Understood Arch. Acuity
(11)
J Average of Means
of Six Domains
of Planning (Average of Last 6 Columns)
K
Those Responsible
for Planning
Understood Interaction of Domains
(13)
L
Design/ Appearance
Conveys Vision (23)
M
Building Meets
the Needs (12)
All Schools 501 5.658 4.139 4.494 4.674 4.709 4.527 4.271 4.469 4.288 5.526 4.202 School 01 36 6.278 2.750 3.917 4.417 4.278 4.278 3.639 3.880 3.611 4.861 3.111 School 02 29 6.069 4.310 4.621 5.000 4.897 4.690 4.379 4.649 4.483 5.793 4.138 School 03 12 6.000 4.000 4.400 4.900 4.700 4.400 3.700 4.350 3.900 5.500 3.300 School 04 42 5.533 4.370 4.600 4.622 4.587 4.568 4.341 4.515 4.477 5.689 4.391 School 05 67 6.478 4.603 4.768 4.884 4.940 4.788 4.582 4.761 4.463 5.824 4.362 School 06 37 5.946 4.243 4.514 4.622 4.730 4.622 4.297 4.505 4.459 5.324 4.297 School 07 32 6.688 4.419 4.969 5.156 5.000 4.719 4.656 4.820 4.781 6.281 4.813 School 08 55 5.745 4.185 4.455 4.491 4.407 4.055 4.296 4.315 4.204 5.691 4.418 School 09 12 5.909 4.636 4.636 4.818 4.727 4.636 4.545 4.667 4.364 6.273 4.545 School 10 13 5.333 3.750 4.167 4.417 4.333 4.000 3.917 4.097 3.917 5.167 3.750 School 11 31 6.645 4.903 5.194 5.355 5.323 5.129 4.968 5.145 4.968 6.323 5.129 School 12 33 6.818 5.242 5.406 5.500 5.485 5.182 5.061 5.313 5.063 6.485 5.333 School 13 52 5.404 3.981 4.132 4.250 4.490 4.314 4.080 4.208 4.082 5.038 3.981 School 14 11 5.909 4.545 4.636 4.636 4.545 4.727 4.455 4.591 4.273 5.545 4.818 School 15 35 5.629 2.147 3.057 3.486 4.114 3.857 2.735 3.233 2.943 4.171 2.371

93
Table 14 Schools Ranked High to Low on the Educators Mean Response to the Statement: “This school has an educational vision.”
A
Rank Based on
Mean Response High to
Low
B
Degree to Which
School has an
Educational Vision (18)
1 School 12 2 School 07 3 School 11 4 School 05 5 School 01
Top Third
6 School 02 7 School 03 8 School 06 9 School 09
10 School 14
Middle Third
11 School 08 12 School 15 13 School 04 14 School 13 15 School 10
Bottom
Third
Survey Results: Management of Variables within the Six Domains of Planning
The second critical question is as follows: “Do the design professionals and
educators manage variables within the six domains of planning when designing the
facility?” Statements six through eleven on the survey are designed to examine the
degree to which educators believe that those responsible for planning their school
understand each of the domains of planning. The six domains of planning each represent
a collection of quantitative and qualitative variables organized around a central theme.

94
The six domains include: (1) Architectural Acuity, (2) Culture, (3) Demographics, (4)
Economics, (5) Pedagogy, and (6) Politics, and are defined as follows:
Architectural Acuity - The art and science of building in which the relationship of spaces,
construction materials, structural practices, mechanical systems, technology, and
aesthetics are applied by architects, engineers, and design professionals in an educational
facility (infoplease.com, 2002 & American Heritage, 2000).
Culture - The cognitive and normative structures which help promote and sustain order in
an organization (Scott, 1998). The cognitive and normative structures represent a system
of socially acquired values, beliefs, attitudes, standards, traditions, customs, and rules of
conduct which delimit the range of accepted behaviors in a school district
(infoplease.com, 2002 & American Heritage, 2000).
Demographics - The vital statistics which describe both the human population and/or the
physical characteristics of a given area or market niche (Investorwords.com, 2002). For
the purpose of this research, demographics refer to statistics which describe the size,
composition, and needs of the student body.
Economics - Economics is defined by the American Heritage dictionary as economically
significant financial considerations (2000). Economics encompasses all significant
financial considerations of a school district including, but not limited to, the ability to
raise revenue, debt load and structure, state and federal reimbursement rates, and support
for capital improvement projects, local consumer and producer indexes, welfare and
poverty rates, the number of jobs in the local economy, the unemployment rate, and the
economic outlook (Investorwords.com, 2002 & infoplease.com, 2002).
Pedagogy - Pedagogy is defined by Merriam-Webster’s Unabridged Dictionary as the art

95
and science of teaching. Pedagogy is defined as principals, methods of instruction, and
how students learn (2002).
Politics - Politics is defined as the competition between competing interest groups or
individuals for power and leadership (Merriam-Webster, 2002). Politics also refers to the
methods and tactics of formal and informal groups that attempt to gain control, power, or
alter the direction of a government, social unit, or organization (American Heritage,
2000). For the purpose of this dissertation, politics is defined as the methods and tactics
of formal and informal groups that attempt to gain control, power, or alter the direction of
a school district’s capital improvement project. For purposes of clarity, these concepts
are summarized as the relationships between educators, elected officials, parents,
community groups, and citizens within a community.
Statements six through eleven on the survey are designed to examine each of
these six domains. However, in order to gain a single measure of the degree to which
educators believe those responsible for designing their facility understand variables
within the six domains, an average score is determined through a calculation of the mean
of the responses for each of the six questions. The value which results is a single score
for the purpose of modeling, provided that the average degree to which educators in each
school believe that those responsible for planning their school understand the six domains
of planning. A summary of the mean responses for each of the six domains of planning
can be reviewed in table 13, columns D, E, F, G, H, and I. The average of the means
calculated for the purpose of this study can be found in column J of the same table. The
mean of the means is used to rank, from high to low; the fifteen schools participating in
the study appears in table 15, column D. Column C of that table includes, with intent, the

96
same data and ranking from table 14 at the degree to which educators believe their school
has an educational vision.
Table 15 Schools Ranked High to Low on the Mean of the Mean Responses at the Degree to Which Educators Believe Planners Understand Each of the Six Domains of Planning
A B
Rank Based on
Mean Response High to
Low
C
Degree to Which
School has an
Educational Vision (18)
D
Average of Means
of Six Domains
of Planning
1 School 12 School 12 2 School 07 School 11 3 School 11 School 07 4 School 05 School 05 5 School 01 School 09
Top Third
6 School 02 School 02 7 School 03 School 14 8 School 06 School 04 9 School 09 School 06
10 School 14 School 03 M
iddle Third
11 School 08 School 08 12 School 15 School 13 13 School 04 School 10 14 School 13 School 01 15 School 10 School 15
Bottom
Third

97
Survey Results: Management of the Interaction of Variables Across
the Six Domains of Planning
The third critical question is as follows: “Do the design professionals and
educators manage the interaction of variables across the six domains of planning when
designing the facility? This question is examined through educators’ responses to
statement 13 on the survey. Statement 13 reads: “Those responsible for designing this
facility understand the interaction of economic, political, and social forces, as well as the
needs of teachers and students.” The Systems Model for Educational facilities planning
postulates that changes in variables within one of the six domains of planning affect
variables in the other five domains. It should be noted that the suppositions on which the
systems model is built considers the interaction of variables across the domains distinctly
different from the management of variables within a single domain. Recognition of the
differences in these two components of the model serve to underscore the dynamic nature
of the environment in which American public schools are planned. A summary of the
mean responses for statement 13 is reviewable in table 13, column K. The mean
responses from each of the fifteen schools are ranked from high to low in table 16,
column E. Columns C and D contain the ranking from the educators’ response with
regard to educational vision and the average of the means of the degree to which
educators’ believed planners understood each of the six domains of planning. These were
the same data and ranking from tables 14 and 15.

98
Table 16 Schools Ranked High to Low on the Educators Mean Response to the Statement: “Those responsible for designing this facility understood the interaction of economic, political, and social forces as well as the needs of teachers and students.”
Survey Results: Supposition I
As exploration of the data continues throughout this chapter, tables are built to
include data from each of the five critical questions evaluated. This is done in order to
examine trends within the data that emphasize critical pieces of the systems model, and
how the pieces relate to one another and the systems model as a whole. The next column
added to the table is critical in to understand if continued exploration of the model is
A B
Rank Based on
Mean Response High to
Low
C
Degree to Which
School has an
Educational Vision (18)
D
Average of Means
of Six Domains
of Planning
E
Those Responsible
for Planning
Understood Interaction of Domains
(13) 1 School 12 School 12 School 12 2 School 07 School 11 School 11 3 School 11 School 07 School 09 4 School 05 School 05 School 07 5 School 01 School 09 School 14
Top Third
6 School 02 School 02 School 05 7 School 03 School 14 School 06 8 School 06 School 04 School 09 9 School 09 School 06 School 14
10 School 14 School 03 School 08
Middle Third
11 School 08 School 08 School 13 12 School 15 School 13 School 10 13 School 04 School 10 School 03 14 School 13 School 01 School 01 15 School 10 School 15 School 15
Bottom
Third

99
warranted. With the next step in this process, the first examination of the model as a
whole is made.
As a whole, the Systems Model for Educational Facilities Planning is built on the
primary supposition that if a school has an educational vision, and if those responsible for
the design and construction of a facilities manage the interaction of economic, political,
and social forces, as well as the needs of teachers and students, then by using the
resources available, design professionals and educators can design and construct an
educational facility that is a physical representation of an educational vision. As a result,
the fourth critical question asks: “Is the educational facility a physical representation of
the educational vision?” Survey statement 23 reads: “The design and appearance of this
facility conveys the educational vision of the school” and is designed to evaluate this
premise. A summary of the mean responses for statement 23 is reviewable in table 13,
column L. The mean responses from each of the fifteen schools are ranked from high to
low in table 17, column F.

100
Table 17 Schools Ranked High to Low on the Educators Mean Response to the Statement: “The design and appearance of this facility conveys the educational vision of the school” A B
Rank Based on
Mean Response High to
Low
C
Degree to Which
School has an
Educational Vision (18)
D
Average of Means
of Six Domains
of Planning
E
Those Responsible
for Planning
Understood Interaction of Domains
(13)
F
Design/ Appearance
Conveys Vision (23)
1 School 12 School 12 School 12 School 12 2 School 07 School 11 School 11 School 11 3 School 11 School 07 School 07 School 07 4 School 05 School 05 School 02 School 09 5 School 01 School 09 School 04 School 05
Top Third
6 School 02 School 02 School 05 School 02 7 School 03 School 14 School 06 School 08 8 School 06 School 04 School 09 School 04 9 School 09 School 06 School 14 School 14
10 School 14 School 03 School 08 School 03
Middle Third
11 School 08 School 08 School 13 School 06 12 School 15 School 13 School 10 School 10 13 School 04 School 10 School 03 School 13 14 School 13 School 01 School 01 School 01 15 School 10 School 15 School 15 School 15
Bottom
Third
Supposition I: A Descriptive Analysis
A visual examination of the data in table 17 yields a discernable pattern. The
most obvious pattern is the fact that seven of the fifteen schools (07, 10, 11, 12, 13, 14,
15) remain exclusively within the same one third for all four variables listed. For
example, school seven is ranked the second highest for educational vision and third
highest for the average of the six domains of planning, the interaction of the domains, and

101
the degree to which the facility is a physical representation of an educational vision.
Considered as independent, the first three variables (columns C, D, E) for school 07 are
in the top third, while the fourth dependent variable (column F), is also in the top third.
In total, this occurs three times in the top third (schools 07, 11, 12), once in the middle
third (school 14), and three times in the bottom third (schools 10, 13, and 15).
The Systems Model for Educational Facilities Planning is built on the premise
that if a school has an educational vision and if those responsible for the design and
construction of that facility manage the interaction of economic, political, and social
forces, as well as the needs of teachers and students, then by using the resources
available, design professionals and educators can design and construct an educational
facility that is a physical representation of an educational vision. The fact that these
seven schools demonstrate a distinct relationship between the educational vision, the
degree to which planners understand the variables within the six domains and the
interaction of the variables across the domains, and the degree to which the facility is a
physical representation of the educational vision, all provides justification for further
investigation.
Of the remaining eight schools, six schools (02, 03, 05, 06, 08, 09) have variables
split between the top third and middle third or between the middle third and the bottom
third. In other words, in the case of these six schools, variables never fall outside of
adjacent thirds. Of the remaining two schools, one (school 01) has an educational vision
in the top third, yet the other variables are in the bottom third; the degree to which the
design and appearance is a physical representation ranks in the majority of the variables
in the bottom third. This is consistent with what the Systems Model for Educational

102
Facilities Planning predicts. In this case, the systems model predicts that if a school has
an articulated educational vision, but those responsible for planning the facility do not
manage variables within and across the six domains of planning, then the school is not a
physical representation of the educational vision. The final school (04) has each of the
three independent variables in different thirds. The educational vision for school 04 is
ranked in the bottom third, the degree to which planners understand the domains of
planning as being ranked in the middle third, and the degree to which the facility planners
understand the interaction of the domains as being the bottom of the top third. The
degree to which the design and appearance is a physical representation ranks in the
middle third.
For the eight schools that do not have the three independent and dependent
variables within the same third, it is important to note that at no time do any of the fifteen
schools with a majority of the independent variables that rank in the top third with a
dependent variable that ranks in the bottom third. Likewise, at no time do any of the
fifteen schools with a majority of the independent variables that rank in the bottom third
have a dependent variable which ranks in the top third.
The relevance of these patterns is even greater if it is considered that amongst the
fifteen schools, the difference between the maximum and minimum mean response for
the educational vision sorts the ranking of the fifteen schools over a range of 1.485. The
difference of the maximum and minimum means for the average degree to which facility
planners understand the six domains of planning rank the schools over a range of 2.080.
The difference in the mean responses for the degree to which educational facility
planners understand the interaction of the domains of planning is 2.120. The maximum

103
and minimum mean responses of the degree to which the educational facility is a physical
representation of the educational vision ranks the fifteen schools over a range of 2.313.
Given the fact that a pattern in the data emerges through a high to low ranking of
the mean responses of educators’, and indicates a possible relationship between the three
independent variables and the dependent variable provides justification for further
analysis. This justification is further supported by the fact that the difference between the
minimum and maximum mean responses of all the variables result in each variable
containing a unique range over which it was ranked.
Table 18
Summary of the Difference between the Minimum and Maximum Mean Responses for the Three Independent Variables and Dependent Variables Degree to Which Educators Report that the School has an Educational Vision Max. Min. Difference
6.818 5.333 1.485 Average of Means of Degree to Which Educators Report that Facility Planners Understand Each of the Six Domains of Planning Max. Min. Difference
5.313 3.233 2.080 Degree to Which Educators Report Facility Planners Understand Interaction of Variables Across the Six Domains of Planning Max. Min. Difference
5.063 2.943 2.120 Degree to Which Educators Report that the Design of the Facility Conveys the Educational Vision of the School Max. Min. Difference
6.485 4.171 2.313

104
Supposition I: A Regression Analysis
As a result of the univariate analysis, the main objective at this juncture of the
study is to determine the predictive value of the degree to which an educational facility is
a physical representation of an educational vision. Multiple regression analysis is used to
ascertain if: (1) the degree to which the school has an educational vision, (2) the degree to
which facility planners understand the six domains of planning, and (3) the degree to
which facility planners understand how the interaction of variables across the six domains
of planning explain the degree to which the educational facility is a physical
representation of the educational vision. A multiple regression analysis is conducted to
the degree at which educators report that their facility is a physical representation of the
schools educational vision (survey statement 23) as the dependent variable. The degree
to which the school has an educational vision (survey statement 18), the degree to which
facility planners understand the six domains of planning (the mean of the means of
survey statements 6 to 11), and the degree to which facility planners understand the
interaction of variables across the six domains (survey statement 13) are entered as the
independent variables. These variables account for a significant percentage of the
variance in the model. The coefficient of determination (R2) is 0.513, which indicates
that these variables explain 51 percent of the variance to the degree at which an
educational facility is a physical representation of the educational vision. The multiple
regression analysis is significant at a confidence interval of 95%.

105
Table 19 Regression Model Supposition I: Based on the Premise that if a School has an Educational Vision and if those Responsible for Designing the Facility Manage the Variables within the Six Domains of Planning and the Interaction of Variables Across the Six Domains of Planning then an Educational Facility will be a Physical Representation of an Educational Vision.
Variables Entered R R Squared Adjusted R Square
Std. Error of the Estimate
Survey Statements 13, 18, and the Avg. Mean of Six Domains of Planning 0.717 0.513 0.51 0.909 Note. Dependent Variable: 23 p < .05
Survey Results: Supposition II
The second primary supposition of the Systems Model for Educational Facilities
Planning states that a school which is a physical representation of an educational vision
meets the needs of its stakeholders. Examining this premise is the purpose of survey
statement 12 which reads: “This facility meets the needs of faculty, staff, parents, and the
community.” A summary of the mean responses for statement 12 is reviewable in table
13, column M. The mean responses from each of the fifteen schools are ranked from
high to low in table 20, column G. Like the previous tables, the ranking in the table is
divided into a top, middle, and bottom third, and the table contains data from the critical
components of the Systems Model previously analyzed.

106
Table 20 Schools Ranked High to Low on the Educators Mean Response to the Statement: “This facility meets the needs of faculty, staff, parents, and the community”
Supposition II: A Descriptive Analysis
Examination of table 20 yields a trend which validates the justification for more
in-depth analyses. Most notable, eleven of the fifteen schools (01, 02, 04, 07, 08, 09, 10,
11, 12, 13, 15) remain exclusively within the same third for both variables. Of the
remaining 4 schools, one school (05) is in the top third at the degree to which the
appearance conveys the educational vision, and the middle third at the degree to which
A B
Rank Based on
Mean Response High to
Low
C
Degree to Which
School has an
Educational Vision (18)
D
Average of Means of
Six Domains
of Planning
E
Those Responsible for Planning Understand
Interaction of Domains
(13)
F
Design/ Appearance
Conveys Vision (23)
G
Building Meets the Needs of
the Stakeholder
s (12)
1 School 12 School 12 School 12 School 12 School 12 2 School 07 School 11 School 11 School 11 School 11 3 School 11 School 07 School 07 School 07 School 14 4 School 05 School 05 School 02 School 09 School 07 5 School 01 School 09 School 04 School 05 School 09
Top Third
6 School 02 School 02 School 05 School 02 School 08 7 School 03 School 14 School 06 School 08 School 04 8 School 06 School 04 School 09 School 04 School 05 9 School 09 School 06 School 14 School 14 School 06
10 School 14 School 03 School 08 School 03 School 02
Middle Third
11 School 08 School 08 School 13 School 06 School 13 12 School 15 School 13 School 10 School 10 School 10 13 School 04 School 10 School 03 School 13 School 03 14 School 13 School 01 School 01 School 01 School 01 15 School 10 School 15 School 15 School 15 School 15
Bottom
Third

107
the facility meets the needs of the stakeholders. One school (14) is in the middle third at
the degree to which the appearance conveys the educational vision, and in the top third at
the degree to which the facility meets the needs of the stakeholders. School (03) is in the
middle third at the degree to which the appearance conveys the educational vision is in
the bottom third. The degree to which the facility meets the needs of the stakeholders is
in the bottom third. The final school (06) is in the bottom third at the degree to which the
appearance conveys the educational vision, and middle third for the degree to which the
facility meets the needs of the stakeholders.
For the four schools not exclusively in one of the thirds, three of the four (3, 5,
and 6) fall in the separation between two of the thirds. Again, as in the previous analysis,
at no time does a school with one of the two variables found in the top third have a
ranking of the other variable in the bottom third. Likewise, at no time does a school
found with one of the two variables in the bottom third have a ranking of the other
variable in the top third. The significance of these observations is even greater to the
consideration that amongst the fifteen schools, the range of mean responses to the degree
at which the educational facility is a physical representation of educational vision is 2.313
while the range of the degree to which the facility meets the needs of faculty, staff,
students, and the community is 2.962 (see table 18).

108
Table 21 Summary of the Difference between the Minimum and Maximum Mean Responses of the Degree to Which an Educational Facility is a Physical Representation of the Educational Vision and the Degree to Which the Facility Meets the Needs of Faculty, Staff, Students, and the Community
Degree to Which Educators Report that the Design of the Facility Conveys the Educational Vision of the School Max. Min. Difference
6.485 4.171 2.313 Degree to Which Educators Report that the Facility Meets the Needs of Faculty, Staff, Students, and the Community Max. Min. Difference
5.333 2.371 2.962
Supposition II: A Regression Analysis
As a result of the univariate analysis, the main objective at this juncture of the
study is to determine the predictive value of the degree to which an educational facility
meets the needs of its stakeholders. Multiple regression analysis is used to ascertain if
the degree to which an educational facility is a physical representation of the educational
vision that can explain the degree to which the educational facility meets the needs of
faculty, staff, students, and the community. A multiple regression analysis is conducted
to the degree at which educators report that their facility meets the needs of faculty, staff,
students, and the community (survey statement 12) as the dependent variable. The
degree to which educators report that their facility is a physical representation of the
educational vision (survey statement 23) is entered as the independent variable. This
single variable accounts for a significant percentage of the variance in the model. The
coefficient of determination (R2) is 0.392, which indicates that these variables explain 39

109
percent of the variance to the degree at which an educational facility meets the needs of
faculty, staff, students, and the community. The multiple regression analysis is
significant at a confidence interval of 95%.
Table 22 Regression Model Based Supposition II: Based on the Premise that if an Educational Facility is a Physical Representation of an Educational Vision then it will Meet the Needs of the Stakeholders
Variables Entered R R Squared
Adjusted R Square
Std. Error of the Estimate
23 0.626 0.392 0.390 1.042
Note. Dependent Variable: 12 p < .05
Qualitative Data
Introduction
The second phase of the investigation utilizes qualitative methods to complete a
comparative analysis of four purposefully selected case studies. This is done, like in the
first phase of the study, for the purpose of the examination of the soundness of core
components of the systems model and the systems model as a whole. Consistent with the
pragmatic tradition, the qualitative phase of this study requires that the validity of the
systems model be measured by its experimental results and by the practicality of its use.
Driven by the need for rigorous experimental procedures and generalizability of the
results, the selection of schools for qualitative study is the most critical step of this phase.

110
Selection of Schools for Comparative Case Study
The four schools selected for comparative analysis are based on a two-tiered
process. The purpose of the two-tiered process ensures that the sites selected demonstrate
the greatest possible variation and are information-rich. On the first tier, schools are
sorted based on two variables. These variables are as follows: (1) the degree to which
educators report that within the school and community that it serves there is a shared
sense of purpose and focus on what is important for students (educational vision), and (2)
the degree to which the facility contributes to a shared sense of purpose and a focus on
what is important for students. The selection of the four schools is made over the widest
possible continuum of these two variables. This is consistent with the maximum
variation strategy, and better helps offset concerns of external validity, transferability,
and researcher bias which often arise during qualitative analysis. Based on the primary
criterion, schools 9, 10, 12, and 15 are selected for further evaluation. The distribution of
schools in the sample across this tier are shown in figure 5.
On the second tier of the selection process, the broad profile of the respondents
within each school collected through the use of the survey instrument is utilized to ensure
that with the strategy of greatest variation, the sites which are selected are information-
rich and provide the greatest opportunity to yield insights and understanding. The
number of faculty that responds to the survey, the percentage of educators in each facility
involved with the planning process, and the number of educators employed in the
building since its opening are all evaluated as a means of evaluating the potential quality
and quantity of the data at each site.

111
Degree of Vision v. Degree to Which Building Represents Vision
School 1
School 2
School 3School 4
School 5
School 6
School 7
School 8
School 9
School 10
School 11School 12
School 13
School 14
School 15
4.00
4.10
4.20
4.30
4.40
4.50
4.60
4.70
4.80
4.90
5.00
5.10
5.20
5.30
5.40
5.50
5.60
5.70
5.80
5.90
6.00
4.00 4.10 4.20 4.30 4.40 4.50 4.60 4.70 4.80 4.90 5.00 5.10 5.20 5.30 5.40 5.50 5.60 5.70 5.80 5.90 6.00Mean of Vision
5.03
Mea
n of
Phy
sica
l Rep
rese
ntat
ion
5.06
Figure 5. Tier-One: The Distribution of Schools Based on the Degree to Which Educators Report Educational Vision and the Facility is a Physical Representation of the Vision
ANOVA and Post Hoc Analysis of the
Least Significant Differences (LSD)
ANOVA and a Post Hoc Analysis of the Least Significant Differences (LSD) are
performed on the means of the survey responses from each of the four schools considered
for study for the purpose of assuring that the four schools selected demonstrated the
greatest possible variance from each other and across the variables being researched. It is
found that four schools under consideration are significantly different from one another

112
(refer to table 23). In addition, Post Hoc Analysis (LSD) is performed on the variables in
question across the four schools. It is determined that the majority of the variables which
represent the five critical research questions are significantly different across the four
schools, and that no other schools within the population can provide a larger spread over
the variables (refer to tables 24 through 28). These are the same variables used to
develop the regression models in the quantities phase of the study. As a result schools 9,
10, 12, and 15 that are consistent with the maximum variation strategy, provide the
greatest continuum over the sample as a whole and the variables under study, and as a
result, best offset the concerns of external validity, transferability, and researcher bias.
Table 23
ANOVA Sum of Squares Df Mean of Square F Sig.
18 Between Groups Within Groups Total
132.633 445.794 578.427
14 475 489
9.474 .939
10.094 .000
Mean of 6 Between Groups (Mean of Within Groups Means Total Survey Statements 6-11)
110.051 455.886 565.938
14 483 497
7.861 .944
8.328 .000
13 Between Groups Within Groups Total
122.064 294.139 416.203
14 469 483
8.719 .627
13.902 .000
23 Between Groups Within Groups Total
185.970 666.1891 852.161
14 483 497
13.284 1.379
9.631 .000
12 Between Groups Within Groups Total
265.985 620.572 886.557
14 484 498
18.999 1.282
14.818 .000
Note. *p<.05

113
Table 24
Post Hoc Analysis (LSD): Educational Vision (survey statement 18)
Dependent Variable: 18
School School 10 School 12 School 15
Mean Dif.
Std. Error Sig.
Mean Dif.
Std. Error Sig.
Mean Dif.
Std. Error Sig.
School 9 .576 .406 .156 -.909* .338 .007 .281 .336 .404
School 10 -1.485* .328 .000 -.295 .325 .364
School 12 1.190* .236 .000
Note. *p<.05
Table 25 Post Hoc Analysis (LSD): Mean of Mean Six Domains of Planning (Mean of Means survey statements 6-11)
Dependent Variable: Mean of 6
School School 10 School 12 School 15
Mean Dif.
Std. Error Sig.
Mean Dif.
Std. Error Sig.
Mean Dif.
Std. Error Sig.
School 9 .56944 .33057 .086 -.651* .2768 .019 1.475* .2757 .000
School 10 -1.220* .2680 .000 .9053* .2670 .001
School 12 2.126* .1964 .000
Note. *p<.05
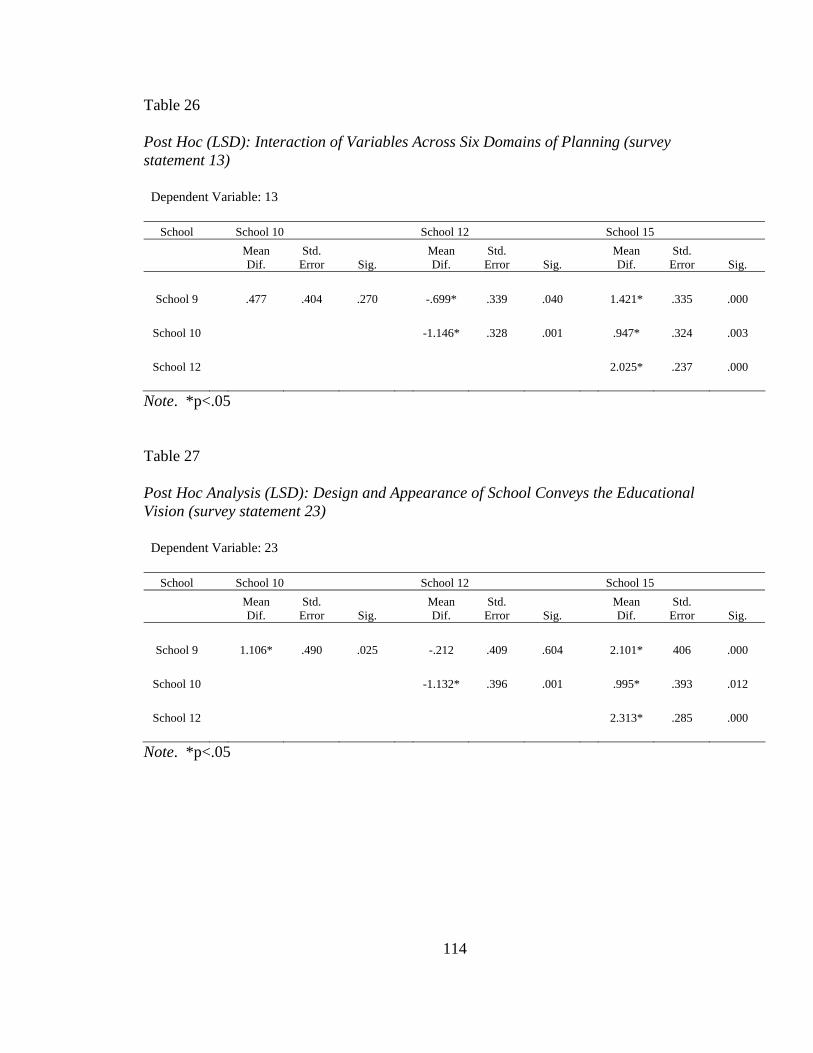
114
Table 26 Post Hoc (LSD): Interaction of Variables Across Six Domains of Planning (survey statement 13)
Dependent Variable: 13
School School 10 School 12 School 15
Mean Dif.
Std. Error Sig.
Mean Dif.
Std. Error Sig.
Mean Dif.
Std. Error Sig.
School 9 .477 .404 .270 -.699* .339 .040 1.421* .335 .000
School 10 -1.146* .328 .001 .947* .324 .003
School 12 2.025* .237 .000
Note. *p<.05
Table 27 Post Hoc Analysis (LSD): Design and Appearance of School Conveys the Educational Vision (survey statement 23)
Dependent Variable: 23
School School 10 School 12 School 15
Mean Dif.
Std. Error Sig.
Mean Dif.
Std. Error Sig.
Mean Dif.
Std. Error Sig.
School 9 1.106* .490 .025 -.212 .409 .604 2.101* 406 .000
School 10 -1.132* .396 .001 .995* .393 .012
School 12 2.313* .285 .000
Note. *p<.05

115
Table 28 Post Hoc Analysis (LSD): Facility Meets the Needs of Stakeholders (survey statement 12)
Dependent Variable: 12
School School 10 School 12 School 15
Mean Dif.
Std. Error Sig.
Mean Dif.
Std. Error Sig.
Mean Dif.
Std. Error Sig.
School 9 .795 .473 .093 -.788* .394 .046 2.174* .391 .000
School 10 1.583* .382 .000 1.379* .379 .000
School 12 2.962* .275 .000
Note. *p<.05
Profile of Schools Selected for Comparative Case Analysis
The four schools selected for comparative case study show the greatest variance
over two core components of the systems model and are information-rich. School 12
(twelve) is selected for having the highest mean responses of the degree to which
educators believe that: “Within this school and community that it serves, there is a shared
sense of purpose and a focus on what is important for students” and: “This facility
contributes to a shared sense of purpose and a focus on what is important for students.
School 10 (ten) is selected for having the lowest mean responses to these same two
statements. School 09 (nine) is selected for having a low mean response to the statement:
“Within this school and community that it serves, there is a shared sense of purpose and a
focus on what is important for students” and a high mean response to the statement: “This
facility contributes to a shared sense of purpose and a focus on what is important for
students. Finally, school 15 (fifteen) is selected for having a high mean response to the

116
statement: “Within this school and community that it serves, there is a shared sense of
purpose and a focus on what is important for students” and a low mean response of the
statement: “This facility contributes to a shared sense of purpose and a focus on what is
important for students.
Although the schools are not selected based on differences in physical, social
cultural, economic, or academic characteristics, the four schools are nonetheless diverse.
Twelve is in a very affluent suburb of a major city in eastern Pennsylvania. Fifteen is in
a well-established, middle-class suburb of a major city in eastern Pennsylvania. Nine is
in an economically-distressed school district outside a major city in western Pennsylvania
and serves four large federally-funded housing projects. And finally, school ten is
located in a small town in the Appalachian coal region of central Pennsylvania.
The four schools selected for case study are designed and constructed by four
different architectural firms in three different counties of Pennsylvania. Three of the
schools opened in 2002 and the fourth opened in 1992. The school’s sizes are 72,400,
143,400, 162,798, and 185,500 square feet respectively. At the time of their construction,
the cost to the taxpayers is $9.0 million, $13.1 million, $16.2 million, and $34.4 million.
Both the least and most expensive projects of the fifteen schools are represented in the
sample (see table 29). The school districts, in which the schools reside, range in size,
from 2.9 to 125.2 square miles. This range represents the smallest and the largest
districts of the fifteen schools (see table 29). Economically, the percent of the student
body’s economically disadvantaged are 3.0%, 11.40%, 17.6%, and 66.3%. Of the fifteen
schools surveyed, the four schools selected for site visits include the schools with the
lowest and highest percentage of economically disadvantaged students (see table 29).

117
The same is true academically. On the Pennsylvania State System of Assessment
(PSSA), passing rates ranged from 27.7% to 58.10%; 70.20% to 84.50%. The sample of
four schools of the fifteen that participate, contains the lowest and highest percentages of
eighth grade students achieving grade level proficiency in reading and math (see table
29).

118
Table 29 Comparison of Characteristics of Schools in Sample
School
Arch. Firm Code
County Code Classification
Grade Span
# of Students
Sq. Miles
of Dist.
School Dist. Pop
Year Opened Cost
% of Economically Disadvantaged
PSSA Passing
Rate
School 01 5 1 Rural/Inside Metro Area 6, 7, 8 1,013 103.8 40,001 1/1/1995 $17,007,639.00 5.80% 74.40%
School 02 7 2 Urban/Fringe of Large City 6, 7, 8 928 21.4 12,536 9/1/1992 $12,184,541.00 1.30% 78.40%
School 03 6 3 Urban/Fringe of Large City 6, 7, 8 950 42.9 23,476 9/1/2000 $26,753,981.00 7.30% 78.00%
School 04 2 3 Urban/Fringe of Large City 6, 7, 8 913 34.9 16,152 9/1/2002 $31,739,412.00 29.20% 62.60%
School 05 2 4
Urban/Fringe of Mid Size
City 6, 7, 8 1,008 90.3 20,934 8/26/1994 $16,093,406.00 13.80% 67.50%
School 06 10 5
Urban/Fringe of Mid Size
City 6, 7, 8 565 95.5 34,573 9/1/1994 $12,872,678.00 12.50% 67.80%
School 07 3 1
Urban/Fringe of Mid Size
City 6, 7, 8 870 16.1 24,366 1/1/2002 $23,970,927.00 12.70% 68.90%
School 08 8 6 Rural Outside
Metro 6, 7, 8 766 283.3 21,531 9/1/1998 $15,847,702.00 46.70% 57.90%

119
Table 29 (continued).
School
Arch. Firm Code
County Code Classification
Grade Span
# of Students
Sq. Miles
of Dist.
School Dist. Pop
Year Opened Cost
% of Economically Disadvantaged
PSSA Passing
Rate
School 09 4 7 Urban/Fringe of Large City 6, 7, 8 451 2.9 15,372 9/3/2002 $8,993,485.00 66.30% 26.70%
School 10 11 8 Small Town 6, 7, 8 599 125.2 16,827 9/30/2002 $16,206,428.00 17.60% 58.10%
School 11 12 9 Small Town 6, 7, 8 611 198.9 15,338 9/1/1999 $10,135,868.00 40.10% 60.00%
School 12 1 10 Urban/Fringe of Large City 7, 8, 9 1,056 121.8 71,079 9/3/2002 $34,426,816.00 3.00% 84.50%
School 13 2 11
Urban/Fringe of Mid Size
City 5, 6, 7, 8 998 292.7 19,201 9/1/1999 $12,872,678.00 31.70% 55.30%
School 14 13 12 Rural/Inside Metro Area 6, 7, 8 609 34.2 46,820 9/1/1993 $15,298,556.00 20.70% 67.70%
School 15 9 10 Urban/Fringe of Large City 6, 7, 8 1,035 42.3 64,707 9/1/1992 $13,106,571.00 11.40% 70.20%

120
Table 30 Summary of Characteristics of Schools and School Districts in Sample Characteristic Analysis Number of Schools 15 Number of Different Architectural Firms 12 Number of Different Counties 13 Number of Different Municipal Census Classes 5 of 8 Number of Different Middle School Grade Spans 3 Total Number of Students Attending Schools 12,372 Range in Size of Student Populations 451 to 1,056 Range in Size of Districts (Square Miles) 2.9 to 292.7 Range in School District Populations 12,536 to 71,079 Total Population Served by Schools 442,913 Range Years Opened (by Research Design possible Years Include 1992 through 2002)
8 of 11 (1992–1, 1993–2, 1994-1, 1995-2, 1998-1, 1999-2, 2000-1, 2002-5)
Range in Cost $9.0 million to $34.4 million Total Cost $267,510,688 Range of Percent of Student Body from Low Income Homes
1.3% to 66.3%
Range of Percent of Student Body Passing PSSA (Combined Reading and Math)
27.7% to 84.5%

121
Table 31 Comparison of Characteristics of Schools Selected for Comparative Case Study
School
Arch. Firm Code
County
Code Classification Grade Span
# of Students
Sq. Miles
of Dist.
School Dist. Pop
Year Opened Cost
% Economic. Disadvanta
ge
PSSA Passing
Rate School
09 4 7 Urban/Fringe of Large City 6, 7, 8 451 2.9 15,372 2002 $8,993,485.00 66.30% 26.70%
School 10 11 8 Small Town 6, 7, 8 599 125.2 16,827 2002 $16,206,428.00 17.60% 58.10%
School 12 1 10
Urban/Fringe of Large City 7, 8, 9 1,056 121.8 71,079 2002 $34,426,816.00 3.00% 84.50%
School 15 9 10
Urban/Fringe of Large City 6, 7, 8 1,035 42.3 64,707 1992 $13,106,571.00 11.40% 70.20%

122
Table 32 Summary of Characteristics of Schools and School Districts Selected for Comparative Case Study Characteristic Analysis Number of Schools 4 Number of Different Architectural Firms 4 Number of Different Counties 3 Number of Different Municipal Census Classes 2 Number of Different Middle School Grade Spans 2 Total Number of Students Attending Schools 3,141 Range in Size of Student Populations 451 to 1,056 Range in Size of Districts (Square Miles) 2.9 to 125.2 Range in School District Populations 15,372 to 71,079 Total Population Served by Schools 167,445 Range Years Opened (by Research Design possible Years Include 1992 through 2002)
2 of 11 (1992–1, 2002-3)
Range in Cost $9.0 million to $34.4 million Total Cost $72,733,300 Range of Percent of Student Body from Low Income Homes
3.0% to 66.3%
Range of Percent of Student Body Passing PSSA (Combined Reading and Math)
26.7% to 84.5%

123
Comparative Case Studies
Using qualitative research methods and the systems model as a lens, the answers
to five critical questions for each of the four schools are researched. The questions
directly reflect core components of the systems model and are identical to the questions
sought in the quantitative phase of this study. These questions are as follows: (1) Does
the school have an articulated educational vision? (2) Do the design professionals and
educators manage variables within the six domains of planning when designing the
facility? (3) Do the design professionals and educators manage the interaction of
variables across the six domains of planning when designing the facility? (4) Is the
educational facility a physical representation of the educational vision? and (5) Does the
educational facility meet the needs of the stakeholders?
In order to qualitatively determine the answers to these questions and in order to
establish a sound method of cross-verification, the strategy of data triangulation is
utilized. Three separate data sources are collected for each site. Within each set of data
sources, evidence is sought to qualitatively determine the answers to the questions listed
above. These data sources include text documents, interviews, and artifacts.
The case study for each site begins with a thorough review of text documents in
the form of public construction records filed at the Pennsylvania Department of
Education. These records, collectively known as PlanCon, represent a set of documents
required for every public school construction project that seeks reimbursement from the
Commonwealth of Pennsylvania. The PlanCon documents provide in-depth information
about: (1) the description of a proposed project and the justification of its need, (2) a
technical review of the conceptual drawings, site plan, and educational specifications, (3)

124
site acquisition, (4) estimated project costs and various tests of a district's financial ability
to make payments, (5) a review of the architectural aspects of a project when the design
is fully developed, (6) architectural aspects of the project and documentation that other
state and local agency requirements have been met or will be met before entering into
construction contracts, (7) construction bids, and (8) financing and final costs (PlanCon,
2003).
Following a review of text documents, interviews are conducted at each of the
four locations. The interviews follow a standardized open-ended format. The
standardized open-ended format as described by Patton (2002) requires that the exact
wording and sequencing of the questions be determined in advance and all interviewees
are asked the same base set of questions in the same order. However, the questions are
worded in a completely open-ended format. The interviews are taped, transcribed, and
analyzed. The transcripts are analyzed using the strategy of thematic analysis of text and
memoing.
Finally, in order to gain a more thorough understanding of the data uncovered
during the document analysis and interviews, the presence or absence of artifacts is
utilized to complete the third element of triangulation. Artifacts may include, but are not
limited to: ways in which educators, students, parents, and the community utilize the
building, building design, reflections of the culture of the school district in architecture,
spaces to show case or support the history, traditions, and success of the school, minutes
from meetings, informational flyers, newsletters, and any physical objects from the
design and construction of the facility, and reports from local newspapers.

125
School Twelve
Qualitative Data
School number 12 (twelve) is the newest of five middle schools located in a
school district classified as “urban on the fringe of a large city (NCES, 2004)”. In total,
the 122 square mile school district educates 19,089 students and serves a community of
114,410 residents (Standard & Poor’s, 2005). Twelve has a student population of 1,056
children served by the full time equivalent of 46 teachers (Great Schools, 2004). Twelve
is selected as one of the four purposefully selected sites for a comparative case study
from the population of 15 schools surveyed as a result of having the highest mean
responses to the degree at which educators feel that their school has an educational
vision, and the degree to which the educators believe that the design of their facility
conveys that educational vision (see table 33).
Twelve is a 186,000 square foot middle school that opened in 2002. Housing
grades seven, eight and nine; the facility contains: thirty-five academic classrooms, nine
science labs, four computer labs, a band, orchestra, and choral suite adjacent to a 750 seat
auditorium, a full gymnasium, auxiliary gym, and fitness/adaptive physical education
space, a technical educational suite, art suite, family and consumer science suite, and
library. The facility also contains accommodations for the administration, counselors,
and support staff, instructional planning centers for teachers, and a cafeteria with a
seating capacity of 450, a student common area, and an outdoor terrace. The building is
situated on a fifty-eight acre site which also includes an outdoor all weather track, four-
fenced tennis courts, three all purpose fields for soccer, lacrosse, and field hockey, three
softball/baseball fields, and a football field. The tract of land on which the school sits is

126
adjacent to property owned by the township. Together, the properties are utilized to
benefit both the school district and the residents of the community.
According to the Pennsylvania Department of Education Division of School
Facilities (PDE DSF) the cost of site acquisition, structure, and movable fixtures, and
equipment for school twelve equals $34,426,816.00 (PDE DSF, 2002). PDE DSF
calculates the per square foot cost of an educational facility by adding the cost of the
structure, architects’ fee, and sewage disposal, and then divides it by the architectural
area in square feet. PDE DSF calculates the per square foot cost of school twelve to be
$140.64 (PDE DSF, 2002).
The student demographics of school twelve reveals a student body which is
homogenous, academically excelling, and coming from middle and upper middle class
homes. The composition of the student body is 94.4% white; 2.7% Asian/Pacific
Islander; 1.6 % African American; 1.2 % Hispanic; and less than 1.0% American
Indian/Alaskan National (Standard & Poor’s, 2004). In 2004, while attaining adequate
yearly progress in all areas defined by the federal government’s No Child Left Behind Act
of 2002, 92% of eighth grade students test proficient in reading and 89% test proficient in
math (Standard & Poor’s, 2004). In that same year, the school district posts a graduation
rate of 94% (Standard & Poor’s, 2004). The median household income in the school
district is $126,847.00 and the median home value is $212,059.00 (Standard & Poor’s,
2004). According to the Pennsylvania Department of Education, only 2.8% of the
student body is from low income households (PDE Stats, 2004).
As reported by Standard and Poor’s in 2004, the school district in which school
twelve resides has an average operating expenditure of $8,000.00 per student. The

127
$8,000.00 per child represents expenditures on instruction, support services, and non-
instructional services, among other day-to-day purposes, from the general fund, special
revenue fund, food services, child care, non-major fund and other enterprise funds.
Operating expenditures include salaries and benefits, supplies and materials, and
purchased services. Operating expenditures exclude capital and debt-related
expenditures, adult education, community service, as well as trust and agency funds, and
internal service funds. Of the $8,000.00 per child operating expenditures, $5,998.00 is
spent on instruction and instructional support (Standard & Poor’s, 2004). In the same
year, the school district carries a debt with expenditures that equal $823.00 per student
and capital expenditures of $2,712.00 per student (Standard & Poor’s, 2004).
Traveling past vineyards, horse farms, veterinary clinics, specialty boutiques, and
large, newly constructed residential homes, one can speculate that school twelve is
situated in a fairly affluent community that experiences population growth. Beautifully
landscaped, single family homes situate in excess of 3,500 square feet and are
constructed on lots larger than an acre, bound by old fieldstone walls. Often, clusters of
these homes include a prominent and beautifully restored farmhouse that clearly once
presided over acreage on which the neighborhood now sits. Though there are still open
spaces and working farms, one need not drive far on crowded two lane roads to find
fields which still show signs of recent crops, but are dotted with surveyor stakes, marked
by a sign which foretells the sale of “Building Lots”.
Beyond the physical appearance of the community, congestion on the roads, and
amount of new residential construction, a review of local newspaper articles provides
empirical evidence of rapid population growth. In October of 2000, the superintendent of

128
the school district in which school twelve resides presents a report on enrollment
statistics to the board of school directors. In this report, he indicates that in middle
schools alone, 137 new students are added in one year to bring the total number of
students in seventh, eighth, and ninth grades to 4,004 (Local Newspaper 12, 2000). In
order to deal with the rapid increase in student population, the superintendent in his
report recommends the use of portable classrooms, the relocation of kindergarten classes,
and an addition of a fifteenth elementary school. By the summer of 2002, the year in
which school twelve opens, the school district is involved in 56 separate capital
improvement projects which are primarily brought about as a result of rapid population
growth (Local Newspaper 12, 2002).
In an interview with the building principal of twelve, the principal describes how
rapid changes in the size, composition, and needs of the student body (demographics)
have created a “culture of change”. “Our parents, teachers, and students, consider change
the norm,” the principal comments, and then supports the observation by saying: “I don’t
remember a time since I began working in the district that we haven’t been involved with
a major capital improvement project!” (Interview 12-1, 2006). Quantitatively, the
observations made by the principal are supported by the survey results of the educators at
school twelve. During the first phase of this study, 84.6% of the educators at school
twelve participate in the quantitative survey (see table 33). In that survey, demographics
is the domain of planning that that educators feel require the greatest level of detailed
understanding by those responsible for planning schools. During the structured
interviews with educators from school twelve, five out of the seven educators interviewed
speak about the growing student population and how this brings about a need for

129
additional facilities (Interviews 12-1, 12-2, 12-5, 12-6, 12-7, 2006). Though school
twelve is a very large structure, how the facility is utilized provides a very different
“feel”. One of the teachers interviewed states that the building “helps (maintain) the
close relationship that we have with students” (Interview 12-5, 2006). As mentioned
earlier, each grade level is academically housed on a separate floor, creating three schools
within one. On each floor, there are three academic teams. The teachers on each team
share adjacent rooms and student lockers are in the hall outside their rooms. When the
students move to auxiliary spaces, they do so as a team or grade level. The auxiliary
spaces are all adequate to support the size of the student body. For example, the cafeteria
has a seating capacity of 450 students, while each grade level contains approximately 350
students. As a result, the cafeteria effectively, efficiently, and comfortably serves and
houses the students of an entire grade. During structured interviews, one of the teachers
state: “One of the fun things that I see is that because of the layout (of the building),
though there are so many students, you never feel crowed. You don’t feel like there are as
many students as there really are. If you say to someone we have over 1,100 students,
most people (when in the building) wouldn’t even know that” (Interview 12-6, 2006).
At the time school twelve is being planned and constructed, the economics
associated with rapid growth in the student population do not appear to be an issue in the
school district or community. While the mean response of all educators (n = 496) who
participate in the survey in the first phase of this study rank the economics of the school
district and community as the second most important domain that educational facility
planners need to understand, the educators at school twelve (n = 32) rank economics sixth
out of seven domains (see table 34). A review of the economic data explains why

130
economics is not considered a primary factor in the planning of school twelve. Fifty-four
percent of household incomes in the school district exceed $75,000, 22% have household
incomes between $100,000 and $149,000, and 16% of household incomes exceed
$150,000 (Standard & Poor’s, 2004). During a building tour, the principal discusses the
budget for the project and his ability to make decisions with regard to the construction of
the facility and the purchase of furniture, fixtures, and movable objects. The principal
has freedom to make changes to the facility and determine purchases that he feels are
educationally sound if they are within reason and remain within the fixed budget. The
Pennsylvania Department of Education Division of School Facilities (PDE DSF, 2002)
reports that the budget for furniture, fixtures, and movable objects for school twelve is
just over a million dollars. From the interview and as evidenced by the building tour, the
principal takes this responsibility seriously. Student desks and chairs, teacher desks and
chairs, filing cabinets, and audio-visual equipment are identical throughout the building.
Through a standardization and bid for bulk quantities, costs are reduced. With the trust
of the superintendent of schools, the mindset that the principal needs to make sound,
reasonable decisions about changes and purchases, and with the school district and
community turned attention towards the onset of another major capital improvement
project, the principal reports that he and his core team of educators made those decisions
with few questions asked. In the words of the principal, “The superintendent was pretty
much hands-off”. In two separate interviews, educators directly involved with the
planning of the facility echo the same sentiments as the principal when they discuss
decisions with regard to changes to the facility and the purchase of slightly over one
million dollars of furniture, fixtures, and movable objects, (Interviews 12-2, 12-3, 2006).

131
One states that: “As long as we were not making any wild decisions (about spending), we
were flying under the radar. The community was more concerned with the high school
project” (Interview 12-3, 2006).
Though the economic and tax implications associated with the construction of a
new school are often a point of contention within the community, a review of local
newspaper articles do not evidence any friction in the relationships between educators,
elected officials, parents, community groups, and citizens (politics) with the decision to
build school twelve, or the economic impact that comes with that decision. In December
1999, the board of school directors, votes 8-0, with 1 member absent, in order to proceed
with plans to build a fifth middle school in the school district (PlanCon Twelve, 2000).
Though the decision to proceed with plans to build a new middle school is unanimous
and a review of newspaper articles reveal no negative comments on the decision, the
decision of where to build the school becomes a divisive political issue. Newspaper
articles chronicle a nearly year long battle between the school district and one of the nine
municipalities that the school district serves. The controversy centers around
constructing the school on an “environmentally sensitive” piece of land (Local
Newspaper 12, 2000). The issue becomes “such a hot topic” that school board members
vow “to proceed with the plan at all costs”, regardless of the township supervisors’
wishes (Local Newspaper 12, 2000). The township officials block the school board’s
efforts to proceed with the project with an argument that the school district’s initial plans
will never meet zoning requirements, and also by a refusal to issue variances necessary
for construction (Local Newspaper 12, 2000). Although initially the school board refuses
to enter into discussions with the township, “supervisors continued to implore the district

132
to join them in creating a cooperative solution, advantageous to both the municipality and
the district.” (Local Newspaper 12, 2000). In the end, the township and school district
enter into a joint agreement to cooperatively develop a different property for both school
district and township use (Local Newspaper 12, 2000). The final agreement transfers
property owned by the township to the school district, and property owned by the school
district to the township. After these transfers, the school district owns a fifty-eight acre
site on which the school would be constructed. The township retained ownership of an
existing farmhouse and two acres of land adjacent to the fifty-eight acre property for use
as a community center. Also, as part of the agreement, the township is given “first
priority” rights, after the school district, for use of its fields by the township via its own
clubs or athletic organizations. In addition, the school is designed to allow community
access after school hours for use of the gym, athletic facilities, and cafeteria (Building
Tour 12, Interview 12-3, 2006). Around the campus and adjacent township property, the
school district and township provide walking paths for the general public. Due to the fact
that township and school officials mutually agree to the size, shape, and location of the
school on the tract of land, and the specifics for site development, the school district is
permitted to submit their land development plan as a preliminary/final draft, which
effectively accelerates the review process. In the end, the agreement saves the school
district nearly $500,000, accelerates the issuance of permits necessary to begin
construction, provides for community-wide use of the campus and adjoining township
property, and preserves the “environmentally sensitive” tract of land which is the original
point of contention (Local Newspaper 12, 2002). Once the controversy over where to
build the school is resolved, articles with regard to the construction project are not found

133
in the archives of the local newspaper until the building is near completion. This is
further evidenced through a review of public documents on file with the Pennsylvania
Department of Education (PDE). The Commonwealth of Pennsylvania requires a public
hearing prior to the construction of a new public building. Act 34 of 1973, also known as
the Taj Mahal Act, is designed to keep the public aware of and involved with public
construction projects. The format of the hearing provides citizens and governmental
officials the opportunity to enter their questions, concerns, opposition, or support of the
project into the public record. A review of the transcripts on file with the Pennsylvania
Department of Education from this hearing show that not a single parent, educator,
member of the community, or elected official expresses concerns, asks questions, or
enters comments into the public record when afforded the opportunity to do so (PlanCon
Twelve, 2000). The community does, however, turn their immediate attention to another
large capital improvement project that is proposed by the school district. Newspaper
articles of that time show how the large high school project acts as the catalyst to
politically charge the community (Local Newspaper 12, 2000, 2001).
Passing through meadows and lightly wooded areas on what has every appearance
of being a two lane rural road, one would never expect to round a bend and find a
building such as school twelve. The academic wing, fronted by a smoked glass enclosed
stair tower, rises three stories above the landscape. To provide perspective on the size of
school twelve, each story of the academic wing houses all of the necessities for a full
grade level of over three hundred students, and more than fifteen core and support
teachers. To the left of the academic wing and central to the structure is a one to one and
a half story entrance. Clearly defined and inviting, the entrance to the main lobby leads

134
to offices for the administration, counselors, support staff, and the auditorium. To the left
of the main lobby and auditorium is the two story gymnasium and athletic facilities.
Though the facility is large and basic in its design, an institutional feel is muted through
the use of changes in colors, materials, and architectural details. Tan block, brown
smoked glass, enameled window frames, curved-roofed porticos, and landscaping break
what otherwise would be huge expanses of brown brick.
The planning of school twelve can best be characterized as a bureaucratic. Based
on newspaper articles of reports given by the superintendent of schools to the board of
school directors, the justification to construct a new middle school is developed through
an assessment of existing facilities, student demographics, educational programs, and the
development and evaluation of alternate solutions (Local Newspaper 12, 2000, 2001).
However, once the decision is made to build, the planning process is top-down and relies
heavily upon input from administrators and teachers (Interviews 12-1, 12-2, 12-5, 12-6,
12-7, 2006). A tour of the facility, coupled with structured interviews, support this
assertion to reveal that all primary considerations during the design of the facility center
around the development, arrangement, and utilization of educational spaces and areas
within the facility (Building Tour 12, 2006; Interviews 12-1, 12-2, 12-5, 12-6, 12-7,
2006). A review of Plan Con documents on file at PDE further support this observation,
as the school district reports, “preparation of the educational specifications was
developed through a series of discussions with students, parents, community members,
teachers, administrators, and members of the board of education, as well as a review of
the educational research and literature available from other districts with similar building
programs, the National Middle School Association, the National Education Association,

135
research databases and visitations to recently constructed middle schools throughout
Pennsylvania” (PlanCon, 2002). In this statement, no specific mention is made of any
formal mechanism to utilize input of individuals outside the formal structure of the
school district to directly impact the design of the facility. This point is also supported by
the fact that newspaper articles (Local Newspaper 12, 2000, 2001) and interviews
(Interview 12-1, 2006) can support the supposition that the superintendent of schools and
the principal understand the dynamics of the community, needs of the students,
educational philosophy and practice, and history of the school district, there is little
evidence that participants outside the formal structure of the school district are included
in the formal planning process. During structured interviews, three of the teachers
involved with the planning process indicate that they have no interaction with the general
public during planning of the facility (Interviews 12-2, 12-5, 12-7, 2006). This indication
is in contrast to what is reported in PlanCon. The remaining educators that are
interviewed make no mention at all of participants from outside the formal structure of
the school district. Given the facts that the planning for school twelve rely heavily on
input from teachers and administrators, and that when educators at this school are asked
about the degree to which their facility “contributes to a shared sense of purpose and a
focus on what is important for students”, their mean response is higher than that of the
other fourteen schools in the sample (see table 13). One might expect to find a school
building that is highly customized and geared specifically to meet the needs of the
teachers and students of school twelve; however, this is not the case. A tour of school
twelve (2006) reveals that the instructional spaces are generic and flexible.
One of the reasons that the instructional spaces in school twelve are generic and

136
flexible is due to the fact that its initial design began with the blueprint from another
school that the architectural firm has already constructed (Interviews 12-1, 12-2, 12-5,
12-6, 12-7, 2006). As the superintendent of the school’s primary designee for the design,
construction, and opening of the facility, the principal reports that, although he and the
lead architect have some freedom to alter spaces within the facility, the footprint of the
building can not be changed, and that any changes made to the blueprint have to stay
within the established budget. In addition, the principal and architect are also charged
with the responsibility of making sure that the facility does not contain any design
features which would prohibit it from being converted into an elementary or high school
in the future, should the needs of the school district change. The principal estimates that
that 60% to 70% of the final design remain unchanged from the original blueprints
(Interview 12-1, 2006).
Though the instructional spaces are designed to be both generic and flexible this
does not indicate that principles and methods of instruction, and how students learn
(pedagogy) is not an important domain during the planning process. The school district
has had a long-standing tradition in middle level education. Over forty years ago, in
recognition of the unique needs for young adolescents, the school district demonstrates
their commitment to this age group and opens a new junior high school; the third in the
district (School District Web Site 12, 2006). Since this time, the school district,
consistent with changes in national educational movements, evolves from a junior high
school model into a middle school model. By the time that school twelve is being
planned, the school district is operating four middle school programs. As the number of
students in middle level grades increase and tax the capacity of existing facilities, there is

137
no evidence that the school district has seriously considered moving away from their
current grade alignment, structure, or educational philosophy. In development of
educational specifications for school twelve, the district indicates in its PlanCon (2002)
documents that it has reviewed educational research and literature available from the
National Middle School Association. In addition, at the opening ceremonies for twelve,
in a speech the principal cites the support of an assistant superintendent who “challenged
us to make sure that the academic program would be commensurate with the existing
middle schools.” To this end, all teachers on the core planning team are middle school
teachers. Although the core planning team has little impact on the overall design of the
facility, their primary responsibility is to refine and fashion goals, programs, policies, and
procedures to govern the educational program within the new facility. In other words,
their goal is development, communication, and implementation of the school districts,
and the building of the principal’s vision for what the middle school program could be
within that facility. As the building principal notes in his dedication speech: “These
individuals (core planning team) met throughout last year to plan and prepare and
develop a vision for the future of our new middle school” (Dedication Speech 12, 2002).
Within the school district and community, the concept of an “educational mission
and vision” is not just a means of guiding the planning process for a new facility. The
concept and process of developing, maintaining, and communicating an educational
mission and vision is central to the culture of the school district. Over the last decade, the
three strategic plans for the school district greatly emphasize the concepts of educational
mission and vision. The 1992-2000 strategic plan titled “Charting the Course”, the 2000-
2006 strategic plan titled “Staying the Course”, and the 2006-2112 strategic plan,

138
currently being written and titled “Expanding the Course”, all place an emphasis on the
development, maintenance, and communication of an educational mission and vision
(District 12 Website, 2006). In the school district’s most recent strategic planning
documents, two of the stated goals for the district are; (1) expand the communication
network using existing community and cultural groups to share information, and
showcase the work and achievements of our students, and (2) structure permanent ways
to engage all community stakeholders in a meaningful dialogue with the school district to
foster a better sense of involvement (Strategic Planning Document 12, 2006). The school
district’s public relations department provides up-to-date information, in both traditional
and electronic forms, to the general public with regard to district goals, initiatives,
programs, successes, and concerns (School Twelve’s Website, 2006). During structured
interviews, all seven participants are able to clearly articulate vision statements of the
school and/or school district (Interviews 1, 2, 3, 4, 5, 6, 7, 2006).
A second theme central to the culture of the school district is concept of “change”.
In a discussion of rapid population growth, the principal of school twelve describes the
school district as a “culture of change” (Interview 1, 2006). However, rather than feeling
overwhelmed by change, the school district embraces it. In literature for perspective
teachers the school district describes itself as “one of the largest and fastest growing
districts in Pennsylvania accommodating over 600 new students each year without ever
losing its focus” (Perspective Teacher Information 12, 2006). The strategic planning
themes of “Charting the Course”, “Staying the Course”, and “Expanding the Course”, all
focus on the change that the district has experienced over the last fifteen years and
expects to continue experiencing throughout the term of the new strategic plan.

139
A final theme central to the culture of the school district is that of “excellence”.
The packet for realtors and new residents promotes the school district with the phrase:
“Excellent Results, Outstanding Recognition, A Reputation of Value to Our Community”
(New Resident Packet 12, 2005). In this packet, the school district proceeds to
substantiate these claims by providing objective evidence as to why they are an
acknowledged leader in curriculum, instruction, assessment, and staff development.
They provide lists of students and staff that have local, state, national awards, and
recognitions to their credit, and provide data on students who are meeting rigorous
academic standards. The district builds the case that the success of the school system has
created a reputation that, “crosses state boundaries and draws people to the area” (New
Resident Packet 12, 2005).
The concepts of “an educational mission and vision”, “change”, and “academic
excellence” may seem like unusual concepts to reflect the values, attitudes, beliefs,
standards, traditions, and customs of the school district and community (culture).
However, these are the repeated hallmarks of the school district that guide the actions of
individuals and the institution as a whole; they draw the community into the educational
process and provide a sense of institutional identity for the district. When considering
this notion, it is important to remember the size of this school district, because it is one of
the largest in the Commonwealth of Pennsylvania. It encompasses nine municipalities
and contains fifteen elementary schools, five middle schools, and three high schools
which serve nearly 20,000 students and over 100,000 residents. What binds the citizenry
of this school district together and creates an institutional identity, is very different than
that of a small, single municipality school district.

140
In order to design a building that reflects the culture, mission, and vision of the
school district, and successfully meet the needs of faculty, staff, students, and the
community, the architect and design professionals must understand the needs of the
school district and community and have the ability to utilize available resources, and
convert their educational vision into a physical structure (architectural acuity). The
educators at school twelve that participate in the survey during phase one of this study,
rank architectural acuity as the second highest domain in terms of the degree of detailed
understanding of those responsible for planning their school. During the building tour
(2006) and the structured interviews, and during times when the researcher is free to
move about the building and interact with faculty and students, everyone readily speaks
about how pleased they are with the facility. During the building tour, the principal
expresses that when asked to help design school twelve, his experience of working with a
middle school program housed in a facility originally constructed as a junior high school
is invaluable. (Building Tour 12, 2006). In addition to his experience, the architectural
firm has previously constructed a facility that uses the blueprints from which school
twelve is designed from. The lead architect comes to the project with a working
knowledge of the finished product. The combination of practical experience and working
knowledge of existing facilities gives the principal and lead architect a tremendous
advantage. Their efforts, along with those of the core planning team, result in a school
building that the faculty rates higher in being a physical representation of the educational
vision, and higher in meeting the needs of the faculty, staff, students, and community
than the other fourteen faculties did for each of their schools in the sample.
Planning an educational facility that meets the needs of the faculty, staff, students,

141
and community in a pluralistic democratic society is a complicated social, cultural,
political, and economic process. The mechanisms at work are dynamic and those
responsible for planning and constructing educational facilities need to understand the
interaction of economic, political, and social forces at work as well as the needs of
teachers and students. In short, the relationships between the six domains of planning are
as important as the variables within any single domain. Those responsible for planning
school twelve demonstrate that they have an understanding of these relationships. When
the educators at school twelve are asked to respond to the statement: “Those responsible
for designing this facility understood the interaction of economic, political, and social
forces as well as the needs of teachers and students” their mean response is higher than
that of any of the other fourteen faculties which participated in the survey.
Consistent with the quantitative data, an analysis of the qualitative data yields
three themes in this area. These themes can best be termed as: (1) understanding, (2)
modification, and (3) focus. When educators at school twelve, who are directly involved
with the planning of the facility are asked: “Can you please talk about how the final
design of this school may have been impacted by the interaction between economic,
political, and social forces at work in the school district and the needs of teachers and
students”, all those interviewed return precise and thoughtful answers. Their responses
indicate that they understand the very nature of the question (Interviews 12-1, 12-2, 12-3,
12-4, 2006). The educators demonstrate an understanding of the relationships between
the economics of the project and the politics that would have arisen had they not
remained on budget (Interview 12-1, 12-2, 12-3, 2006). They discuss the ideal design of
the building verses footprint and blueprint mandated as a starting point (Building Tour

142
12, Interviews 12-1, 12-2, 2006). They understand the nature and intent of the agreement
between the school district and how that impacts the location of the building on the fifty-
eight acre site, and the location and construction of playing fields (Interviews 12-1, 12-3,
2006). All educators interviewed understand the mission and vision of middle level
education in the school district and how the facility is best utilized to fulfill that mission
(Interviews 12-1, 12-2, 12-3, 12-4, 12-5, 12-6, 12-7, 2006).
To understand the economic, political, and social forces at work, as well as to
understand the needs of teachers and students, those responsible for planning strive to
balance these forces by making the appropriate modifications. For example, the principal
is restricted by the budget and the footprint of the building; however, he is instrumental in
arranging the spaces within the building around a middle school model, thereby
ultimately reflecting the educational mission and vision of the school district. The
teachers on the core planning team have little impact on the overall design of the facility
or the arrangement of spaces within the facility. However, these teachers are successful
at fashioning goals, programs, policies, and procedures to govern the educational
program within the new facility that reflects the culture of academic excellence expected
within the school district and community.
Finally, to make modifications does not mean to compromise their mission and
vision. As those responsible for planning school twelve make adaptations to deal with
economic, political, and social forces, they do so by remaining focused on the needs of
teachers, students, and the community. First and foremost, they remain focused on their
beliefs, philosophy, and on the instructional practices they feel are in the best interest of
middle school students. In his dedication speech, the principal of school twelve thanks

143
the superintendent of schools for his trust and support, and for always reminding the core
planning team that their “first order of business was the students”.
Findings of School Twelve
Does School Twelve have an Articulated Educational Vision?
Quantitatively, the survey reveals that when educators at school twelve are asked
to respond to the statement: “This school has an educational vision”, their mean response
is 6.818 out of a possible 7 (see table 35, statement 18), higher than any of the other
fourteen schools in the sample. Qualitatively, as evidenced in structured interviews, a
review of local newspaper articles, public documents filed with the Pennsylvania
Department of Education, and a review of artifacts from the school district, the concepts
of an educational mission and vision are part of the culture in the school district in which
school twelve resides. The process associated with developing, maintaining, and
communicating an educational mission and vision is central to the culture of the school
district. These ideas have been the emphasis of fifteen years of strategic planning, are
highlighted in the principal’s dedication speech during the opening ceremonies, and can
readily be expressed by educators during structured interviews.
Is School Twelve a Physical Representation of the School District’s Educational Vision?
Quantitatively, the survey reveals that when educators at school twelve are asked
to respond to the statement: “The design and appearance of this facility conveys the
educational vision of the school”, their mean response is 6.485 out of a possible 7 (see
table 35, statement 23)— higher than any of the other fourteen schools in the sample.
Qualitatively, as evidenced in structured interviews, a review of local newspaper articles
and public documents filed with the Pennsylvania Department of Education, a tour of the

144
facility, and a review of artifacts from the school district, school twelve is a physical
representation of the school district’s educational vision.
The combination of practical experience and working knowledge of existing
facilities gives the principal and lead architect a tremendous advantage in designing and
arranging the spaces in a manner that facilitates a middle school model consistent with
the educational mission and vision of the school district. The teachers on the core
planning team are equally successful at fashioning goals, programs, policies, and
procedures to govern the educational program within the new facility to reflect an
expectation of academic excellence commensurate with the four existing middle schools.
In the end, even with the educational spaces designed to be generic, flexible, and
built for change, it is understood by those involved with the planning, that these design
traits are necessary and represent the stress of rapid population growth being experienced
by educators, school district and township officials, and citizens within the community.
Do the Design Professionals and Educators who Plan School Twelve Manage Variables
within and Across the Six Domains of Planning when Designing the Facility?
Quantitatively, an analysis of the survey reveals that when educators at school
twelve are asked to respond to the statement: “Those responsible for planning and
constructing this facility understood the interaction of economic, political, and social
forces at work as well as the needs of teachers and students”, their mean response is the
highest of all fifteen schools participating in the survey. Their mean response is 5.813
out of 7.0 (see table 35, statement 49). In addition, every educator is asked six questions,
one for each of the domains of planning, with regard to the degree at which “those
responsible for planning the facility understood” each domain. Again, of the fifteen

145
schools, the educators at school twelve have the highest mean response when the
responses of all six questions are averaged. The average of the mean responses to the six
questions is 5.313 out of 7 (see table 13).
As evidenced in structured interviews, a review of local newspaper articles and
public documents filed with the Pennsylvania Department of Education, a tour of the
facility, and a review of artifacts from the school district, those responsible for planning
school twelve understand and manage each of the domains of planning as well as the
interaction of those domains. Evidence of these observations, arranged by domains, are
as follows:
Demographics. When considering demographics, planners design a facility that not
only addresses the current size, composition, and needs of the student body, but if future
changes in demographics deem necessary, the building can contain design traits that
prohibit it from being converted into an elementary or high school facility. Though
school twelve is a very large structure, the arrangement of academic spaces within the
facility helps foster a close relationship between teachers and students. The auxiliary
spaces are all adequate to support the size of the student body. As stated by one of the
teachers during the structured interview (2006) and evidenced during the building tour,
the facility never feels crowded or impersonal.
Pedagogy. Though the building design is generic and flexible, this does not indicate
that the domain of pedagogy is not important to the planners. The school district has a
long- standing philosophy of treating young adolescences as an age group with unique
educational needs. The principal of school twelve and the core planning team which
consists primarily of middle school teachers, make decisions about the arrangement and

146
assignment of instructional spaces, the purchase of furniture and fixtures, and fashions
goals, programs, policies, and procedures to govern the educational program within the
new facility. Their stated goal is to make sure that the academic program commensurate
with the existing middle schools.
Culture. The educators at school twelve rank culture as the domain of planning
that requires the second highest level of detailed understanding in being the domain their
planners understand better than any of the others, and the second highest domain of
planning in terms of its impact on the final design of the facility. The concepts of “an
educational mission and vision”, “change”, and “academic excellence”, are the hallmarks
of the school district that guide the actions of individuals and the institution as a whole.
They draw the community together and into the educational process. School twelve is
designed to be flexible and built for change. The arrangement of spaces within school
twelve reflects the educational mission and vision of the school district. The goals,
programs, policies, and procedures developed to govern the educational program within
the new facility reflect a culture of academic excellence. In these ways, the culture of the
school district is reflected in the architecture of school twelve and through the way
educators interact with this architecture.
Architectural acuity. The combination of practical experience and working
knowledge of existing facilities gives the principal and lead architect a tremendous
advantage in converting the school district’s educational vision into a facility that meets
the needs of faculty, staff, students, and the community. During the building tour (2006)
and times when the researcher was free to move about the building to interact with

147
faculty and students, everyone readily speaks about how pleased they are with the
facility.
Economics. The economics associated with rapid shifts in student demographics
is not an issue in the school district or community. This is likely the result of two factors.
First, the school district is large, affluent, and has a substantial resource base. Second,
the principal, lead architect, and core planning team work to assure that all changes to the
facility stay in the fixed budget, and that the million dollar expenditures for furniture,
fixtures, and movable objects are justifiable and educationally sound.
Politics. Though the decision to proceed with plans to build a new middle school
is unanimous and a review of newspaper articles reveals no negative comments on the
action, the decision of where to build the school becomes a divisive political issue.
Newspaper articles chronicle a near year long battle between the school district and one
of the nine municipalities that the school district serves. In the end, the school district
and municipality reach a joint agreement that is of mutual benefit. The agreement
provides an alternative site, saves the school district nearly $500,000, provides for
community-wide use of the campus and adjoining township property during the school
day, and results in the selection of a facility design that allows community use of athletic
and common areas within the school after hours.
Interaction of domains. An analysis of the qualitative data yields three themes
with regard to the interaction of the six domains of planning. These themes are: (1)
understanding, (2) modification, and (3) focus. Those responsible for planning school
twelve understand the interaction between economic, political, and social forces at work
in the school district and in the needs of teachers and students. With an understanding of

148
the economic, political, and social forces at work, planners strive to create a balance in
these forces and make the appropriate adaptations. However, these planners demonstrate
that to make adaptations does not mean to compromise their mission and vision. They
remained focused on the needs of teachers, students, and the community—especially the
students.
Does School Twelve Meet the Needs of the Stakeholders?
Quantitatively, the survey reveals that when educators at school twelve are asked
to respond to the statement: “This facility meets the needs of faculty, staff, students, and
the community”, their mean response is 5.813 out of a possible 6.0 (see table 13)—higher
than any of the other fourteen schools in the sample. The qualitative results are
consistent with the quantitative results.
From the onset, based on a forty year tradition of treating the middle grades as a
unique group within the educational program, the educators involved with planning
school twelve are charged with the responsibility of making sure that the academic
program is commensurate with the existing middle schools. To this end, the core
planning team’s primary goal is the development, communication, and implementation of
the school district’s and principal’s vision of what the middle school program could be
within the new facility. During the building tour (2006) and structured interviews with
educators, and during times when the researcher is free to move about the building and
interact with faculty and students, everyone readily speaks about how pleased they are
with the facility. Formally and informally educators speak of how the building meets
their needs and the needs of their students.

149
Even though initially concerns are raised with regard to the school district’s
proposal to build it on an environmentally sensitive property, an agreement with
township supervisors provides an alternative site, saves the school district nearly
$500,000, provides for community-wide use of the campus and adjoining township
property during the school day, and results in the selection of a facility design that allows
community use of athletic and common areas within the school after hours. As a result,
both the facility and the campus better meet the needs of the community.

150
Table 33
Tier One and Two Selection Data for School Twelve
School 12 Mean of Vision (4) 5.667 Mean of Physical Representation (5) 5.697 Year of Opening 9/3/2002 Count Percent Possible Participants 39 Total Participants 33 84.62% Involved in Planning (1) Yes 10 30.30% No 23 69.70% Total 33 100.00% Years Spent in Facility (2) 0 to 2 4 12.12% 3 to 4 29 87.88% 5 to 6 0 0.00% 7 to 8 0 0.00% 9 to 10 0 0.00% 10+ 0 0.00% Total 33 100.00% Facility Utilized As Designed (3) Yes 33.00 100.00% No 0.00 0.00% Total 33.00 100.00%

151
Table 34
Ranked Responses Mean Responses for School Twelve
School 12
Rank Order of Degree to Which Planning of Facility Requires Knowledge of Domains
Mean of Responses
Rank Order of Degree to Which Facility Planners Understood Domain
Mean of Responses
Rank Order of Degree of Impact on Design of Facility
Mean of Responses
Demographics 6.091 Culture 5.844 Economics 6.063
Culture 5.969 Architectural Acruity 5.839 Culture 5.906
Pedagogy 5.909 Economics 5.813 Interaction 5.813
Interaction 5.906 Interaction 5.813 Architectural Acruity 5.806
Architectural Acruity 5.774 Demographics 5.788 Pedagogy 5.719 Economics 5.750 Pedagogy 5.742 Demographics 5.531 Politics 5.500 Politics 5.581 Politics 5.375

152
Table 35
Summary of Survey Responses for School 12
Survey Statement n Mean SD SE 4 33 5.667 0.4787 0.0833 5 33 5.697 0.4667 0.0812 6 33 5.242 0.7513 0.1308 7 32 5.406 0.7121 0.1259 8 32 5.500 0.6720 0.1188 9 33 5.485 0.7550 0.1314
10 33 5.182 0.7687 0.1338 11 33 5.061 0.7044 0.1226 12 33 5.333 0.6455 0.1124 13 32 5.063 0.7594 0.1342 14 32 6.813 0.4709 0.0832 15 33 6.061 0.9663 0.1682 16 33 5.818 0.9505 0.1655 17 33 5.939 0.8993 0.1565 18 33 6.818 0.3917 0.0682 19 33 6.667 0.4787 0.0833 20 33 6.485 0.6185 0.1077 21 33 6.242 0.8671 0.1509 22 33 6.333 0.8165 0.1421 23 33 6.485 0.6185 0.1077 24 33 6.091 0.9799 0.1706 25 33 5.788 1.1390 0.1983 26 32 5.531 1.2177 0.2153 27 33 5.909 1.0113 0.1760 28 31 5.742 1.0945 0.1966 29 32 5.719 0.9583 0.1694 30 32 5.969 0.8224 0.1454 31 32 5.844 0.9197 0.1626 32 32 5.906 0.9284 0.1641 33 32 6.375 0.8707 0.1539 34 32 6.781 0.4908 0.0868 35 32 5.750 1.1914 0.2106 36 32 5.813 1.0906 0.1928 37 32 6.063 1.1053 0.1954 38 30 5.500 1.2526 0.2287 39 31 5.581 1.1188 0.2009 40 32 5.375 1.2115 0.2142 41 31 5.774 1.0555 0.1896 42 31 5.839 0.8204 0.1474 43 31 5.806 0.9458 0.1699 44 32 6.063 0.9483 0.1676 45 31 6.290 0.6925 0.1244 46 32 6.375 0.7071 0.1250 47 32 6.281 0.8126 0.1436 48 32 5.906 0.9284 0.1641 49 32 5.813 0.9651 0.1706 50 32 5.813 1.0298 0.1820

153
School Fifteen
Qualitative Data
School number fifteen (15) is a sixth, seventh, and eighth grade middle school
located in a district classified as “urban on the fringe of a large city” (NCES, 2004). In
total, the forty-two square mile school district educates just over 11,000 students and
serves a community of 74,000 residents (Standard & Poor’s, 2005). Fifteen currently
have a student population of 1,056 children served by the full time equivalent of forty-six
teachers (Great Schools, 2004). However, when the facility is first opened it is designed
to serve only 800 students. A substantial addition added four years after the building is
completed increases its total capacity to over a 1,000 students. School fifteen is chosen
as one of the four purposefully selected sites for a comparative case study because when
evaluated against the other fourteen schools in the sample, the educators at school fifteen
have a high mean response at the degree to which they feel that their school has an
educational vision, and the low mean response at the degree to which they believe that
the design of their facility conveys this educational vision (see table 36). Based on these
criteria and on an analysis of variance (ANOVA) of the mean survey responses of the
educators at school fifteen, as a single case it was significantly different from the other
fourteen schools in the population. It is notable that school fifteen is the oldest school
which participates in the study. During the quantitative phase of this study, 53.85% of
the educators participate in the survey. Of these participants, 40% have been in the
facility for more than ten years, and six of the approximate ten-member team that assists
with the planning of the facility still works in the school. Four of these six educators
participate in the structured interviews.

154
In 1992, when the facility opened, the 110,000 square foot middle school houses
grades six, seven, and eight (PlanCon 15, 1990). At this time, the facility contains:
twenty-five core academic classrooms, six science labs, one computer lab, band and
chorus rooms; a gymnasium, auxiliary gym, a technical educational room and industrial
arts shop; an art room, family and consumer science suite, and a library. The facility also
contains accommodations for the administration, counselors, and support staff,
instructional planning centers for teachers, and a cafeteria with a stage. The cafeteria
seats 600 students during lunches and 800 students during assemblies (PlanCon 15, 2006,
Building Tour 15, 2006, Interviews 15-2, 15-8, 2006). The building is situated on a
campus adjacent to the district’s other two middle schools. Together, the three middle
schools share playing fields and athletic facilities. In 1996, the school district constructs
a large addition to school fifteen, thereby increasing the number of core academic
classrooms by a full one third (Building Tour 15, 2006, Interview 15-2). Though the
enlarged facility still houses grades six, seven, and eight, the school district is
reconfigured so that school fifteen receives students from four, rather than three
elementary schools (Interview 1-15, 2-15, 2006). While the addition increases the
number of academic classrooms, and in turn, the rated capacity of the facility by 200
students, it is impossible to increase the size of halls in the original portion of the
building; the district chose not to enlarge the common areas that include the lobby,
library, cafeteria, gymnasium and athletic facilities, and the main entrance and exit into
the campus (Building Tour 15, 2006, Interview 1-15, 2-15, 3-15, 4-15, 5-15, 2006).
The student demographics of school fifteen reveal a student body which is

155
somewhat homogenous, achieves a fair level of academic success, and contains a
majority of children that come from middle class homes. The composition of the student
body is 88% Caucasian, 4.8% African American 2.1% Hispanic, 4.8% Asian/Pacific
Islander, and 0.3% American Indian/Alaskan National (Standard & Poor’s, 2004). In the
2004/2005 school year, 54% of the eighth grade students at school fifteen test proficient
in reading and 45% test proficient in math on the standardized Pennsylvania State System
of Assessment (PDE, 2005). While overall, these percentages meet adequate yearly
progress as defined by the federal government’s No Child Left Behind Act of 2002, due to
the fact that students identified with special education needs, as a sub-group within the
student population, they do not meet mandated goals, and the school and school district
are cited by the Pennsylvania Department of Education. In 2004, the school district posts
a graduation rate of 97% (Standard & Poor’s, 2004). As stated, the majority of students
in school fifteen come from middle class homes. The median household income in the
school district is $114,238.00 and the median home value is $158.154.00 (Standard &
Poor’s, 2004). According to the Pennsylvania Department of Education, 11.0% of the
student body is from low income households (PDE Stats, 2004).
As reported by Standard and Poor’s in 2004, the school district in which school
fifteen resides has an average operating expenditure of $9,783.00 per student (Standard &
Poor’s, 2004). The $9,783.00 per child represents money spent on instruction, support
services, and non-instructional services, among other day-to-day purposes, from the
general fund, special revenue fund, food services, child care, non-major fund and other
enterprise funds. Operating expenditures include salaries and benefits, supplies and
materials, and purchased services. Operating expenditures exclude capital and debt-

156
related expenditures, adult education, community service, as well as trust and agency
funds, and internal service funds. Of the $9,783.00 per child operating expenditures,
$7,407.00 is spent on instruction and instructional support (Standard & Poor’s, 2004). In
the same year, the school district carries no debt service or capital project expenditures
(Standard & Poor’s, 2004).
Driving past strip malls, professional buildings, dry cleaners, and neighborhoods
that are clearly built in the 1950s and 1960s, the school district in which school fifteen
resides appears to have been at the heart of a suburban landscape for decades. A review
of the history of supports these observations. After World War II, the U.S. Steel
Corporation announces that it plans to construct a major steel mill in the county where
school fifteen now resides. The communities which grow around the new steel mill
eventually become the schools district.
U.S. Steel’s announcement and subsequent construction of the mill leads to a
historic sequence of events in a county that, for the first forty years of the twentieth
century, average a 1% population growth (CensusScope, 2006). These events change the
face of the urban landscape in the United States. Over the next quarter century, veterans
who grew up during the depression and came of age on battlefields in Europe and the
Pacific return home from World War II to build one of the major industrial centers in the
northeastern United States. Along with U.S. Steel, other mid-century manufacturing and
industrial giants are drawn to the area due to its geographic relationship to major
metropolitan areas, the availability of road, rail and river ports, and by a skilled and
motivated work force.
Within six months of the steel mill breaking ground, a well known post-war

157
construction company begins building one of the first planned communities. By the time
it is completed in 1958, the planned community occupies over 5,500 acres which includes
churches, schools, swimming pools, shopping centers, and 17,311 single-family homes
(The State Museum of PA, 2003). The community was billed as “the most perfectly
planned community in America” (The State Museum of PA, 2003). With the promise of
good jobs and home ownership, families flock to the community that represents the post-
war American Dream. Over the next twenty years, the community grows and prospers.
In 1974, the steel mill reaches its peak employment of just over 8,000 workers (U.S.
Steel, Press Release, 2002).
Through the 1950s and into the 1960s, the four municipalities that eventually
combine to form the current school district race to keep their school facilities ahead of the
population growth. Then, in 1966, the four municipalities enter into an agreement to
create the current school district. The primary goal of the agreement enables the newly
formed school district to provide more varied programs in better facilities with better
equipment than any township or borough could provide by itself (District Information
Packet 15, 1990). In order to deal with the pressures of a growing population, the newly-
formed school district, governed by a single board of education, organizes and
reorganizes its grade alignment, internal boundaries for elementary school assignment,
and the way it utilizes facilities. Eventually, the school district settles into a K-6, 7-8, 9-
10, 11-12 grade structure which it maintains through the 1970s (District Literature 15,
1990).
Beginning in the mid-to-late 1970s and over the decade that followed, the school
district sees a loss of its industrial pre-eminence, suffers economic decline, and is subject

158
to dramatic population swings. From the mid-1970s to the mid-1980s, 10,000 jobs are
lost at U.S. Steel and other major manufacturers due to downsizing and plant closures.
This leaves the county with an unemployment rate that it has not experienced since the
Great Depression, especially among skilled workers (County Redevelopment Report 15,
2004). In the spring of 1979, with the decline of enrollments (District Literature 15,
1990) and the nation going through a series of economic recessions (National Bureau of
Economic Research, 2006), the board of school directors form a “Steering Committee” to
study grade reorganization (District Literature 15, 1990). The committee utilizes
enrollment projections that are completed by an outside agency to develop a plan that
“best served the educational needs of the district and made the best use of existing
facilities” (District Literature 15, 1990). From this study, the school district comes to
believe that a 9-12 structure at the high school level is “philosophically and educationally
ideal”. However, the district determines that though it is an educationally appropriate
grade alignment, it is not “economically feasible at that time” (District Literature 15,
1990). The school district does conclude that a 6-8 grade structure best meets the
“emotional, intellectual and social needs of the emerging adolescent.” (District Literature
15, 1990). At the same time, the district reports that a 6-7-8 grade alignment affords the
opportunity to “utilize staff more effectively and facilities more efficiently during a
period of enrollment change (decline)” (District Literature 15, 1990). As a result, the
district reorganizes into a K-5, 6-8, 9-10, 11-12 grade structure. With declining
enrollments, economic instability in the community, and a reluctance to change to a
preferred high school grade alignment due to the associated cost, it is assumed that the
middle school philosophy is ushered into the school district more as a cost effective use

159
of facilities and faculty than on the merits of the associated pedagogical practices.
However, once in the district, the middle school philosophy remains in use for more than
twenty-five years. At the time school fifteen is built, the school district has functioning
middle school programs for more than a decade and is operating two middle school
facilities.
Beginning in the mid 1980s, the county in which school fifteen resides begins
revitalization. With a surplus in housing, low mortgage rates, and a reawakening of
geographic value of the region, the population of the county begins a sudden and
sustained increase (PlanCon 15, 1990). Once again, the area offers an appeal to young
families. As a result, children of the “baby boomers” begin an “in-migration” from cities.
Though industry has experienced a ten year decline, the county never totally loses its
industrial base. As a result of this in-migration, service industries begin to infuse with
the existing industrial base, fueling not only an expansion, but also a diversification of the
county’s economy (U.S. Senate Agricultural Hearings, 1999). In addition to a charged
economy, land in the county is still readily available. Though in the 1950s and 1960s, a
tremendous investment is made in the development of the industrial centers and
surrounding communities, and though in the mid-1980s, these communities contain
nearly one third of the county’s population, they only comprise ten percent of the
county’s land (County Redevelopment Report 15, 2004). The availability of land
provides opportunities for the expansion of an economic base and room for new
residential housing. From 1990 to 2000, the county population grows by 10.43%
(CensusScope, 2006), which makes it one of the fastest growing counties in Pennsylvania
(U.S. Senate Agricultural Hearings, 1999).

160
By the end of the 1980s, the district again faces pressures as a result of student
enrollment. In response to these pressures, the board of school directors form the
“Feasibility Task Force” to study student enrollment and facilities. The Feasibility Task
Force determines that the sudden student population growth which begins in the mid-
1980s is going to be sustained. As a result, they make recommendations to deal with the
size, composition, and needs of the student population through a combination of
construction and redistricting. However, even with a rapid decline in debt service and
reasonable interest rates, when the cost of the plan is determined, the board of school
directors determines that the plan as a whole is not economically feasible.
With many of the recommendations of the Feasibility Task Force discarded and
with “serious elementary enrollment problems” (PlanCon 15, 1990), the district continues
to move ahead with plans to construct a new elementary school. The school district
administration is then charged with the responsibility of taking the recommendations
made by the Feasibility Task Force and the data that the committee gathered in order to
develop a facilities usage plan that is “cost effective” and to “bring stability and
accommodate future growth in the school district” (PlanCon 15, 1990).
In February of 1989, the administration brings forth plans which include twelve to
fifteen million dollars of new construction. The fifteen million dollars was on top of the
cost for the new elementary school. The board of education and response of the
community to the administrations’ recommendations is the same as it is with the
Feasibility Task Force. The sentiments of the board toward the administrative
recommendations are entered into the public record as follows: “The administration’s
Reorganization Committee report will not provide for alternatives that are viable to our

161
school system. One of the plans requires the construction of a 12 to 15 million dollar
middle school and has met with organized community resistance. It is fair to conclude
that everyone in the district agrees on the destination but cannot agree on the course to
get us there.” Even though the administration reaches many of the same conclusions as
the Feasibility Task Force does, debts on existing buildings approach retirement, and debt
service and interest rates are low; the board of school directors, based on economic
concerns, refuse to make the necessary resources available to proceed with any
construction project beyond the new elementary school.
The superintendent of schools is then directed to develop cost options based on
five scenarios: (1) Reorganization and No Construction, (2) Reorganization and
Additions, (3) Reorganization, Additions, and Redistricting, (4) Reorganization and
Construction of a New Middle School, (5) Designation of the Elementary School Project
as a Middle School Project, Use of Modular Classrooms at the Elementary Schools, and
Reorganization. The administration is directed to present the board with five options and
the cost of each of these options by the fall of the 1989/90 school year (PlanCon 15,
1990). In May of 1989, the administrative team reviews the five options with the board
of school directors. The option that the administration recommends is designed to
reorganize the district over a two to three year period through construction of a third
middle school. The old middle school along with the eleventh and twelfth grade building
would be utilized to create a 9-12 campus high school, and relieve over crowding at the
elementary schools through the strategic placement of modular classrooms rather than the
construction of a new elementary school (PlanCon 15, 1990). With this recommendation,
those responsible for the educational facilities of the school district try to make the

162
project more palatable by designating the new elementary school project as a new middle
school project. This saves the school district millions of dollars from the initial
recommendations made by the administration. In addition, it redirects some of the focus
away from the construction proposal and onto the community’s ten year desire to have a
9-12 grade high school program.
When reviewing school district information with regard to deliberations over
solutions to deal with increased student enrollment, it is possible to draw the general
conclusion that there is a great deal of apprehension, frustration, and dissatisfaction
within the school district and community (District Publication 15, 2006, PlanCon, 1990,
Educational Specifications Document 15, 1990, Interview 15-2, 15-6, 15-7, 2006). This
is demonstrated in school board documents placed on file with the Pennsylvania
Department of Education in preparation for the districts Act 34 hearing. The level of
apprehension, frustration, and dissatisfaction is best expressed in a presentation by an
unidentified school director to the board of school directors as a whole. In this
presentation he/she implores the board to follow the administration’s recommendations
and “avoid a crisis management situation” (PlanCon 15, 1990). In frustration with the
board’s unwillingness to act he/she states: “Preparation to anticipated changes must be
based on projected and existing enrollments. Let us be mindful that projections at best are
only estimates of what might occur; however, they should never be used as an excuse of
undue deliberations, failure to develop a plan to address the problem, or make definitive
decisions to move projects forward when validated by live body counts (PlanCon 15,
1990).
In June of 1990, in a split decision, the board of school directors votes, 6 to 2 with

163
one member absent, in favor of moving forward with the administration’s
recommendation to designate the elementary school project as a middle school project,
reorganize the grade structure within the district to create a 9-12 grade high school
campus, and deal with over crowding at the elementary school buildings through the use
of modular classrooms (PlanCon 15, 1990).
Given the fact that from this point forward, the actual planning and construction
of school fifteen takes less than twenty-four months, it may seem odd to begin this
discussion with forty years worth of local history. However, when examining this case it
becomes clear that the history of the school district and community is of critical
importance to understand the apprehension, frustration, and dissatisfaction that manifests
itself in a reluctance to provide additional classroom space. In short, what the educators
and design professionals face as they begin the planning process for school fifteen is a
reflection of the culture, history, and unfolding of events in the community as a whole.
The fact that the school district is located in a planned community that is centered on
America’s industrial strength, built by a generation that survives the Great Depression
and wins World War II, thereby embodying the post-war American Dream was at the
very heart of the matter. Now, less than thirty years later, having had their values
questioned by the cultural and political events of the 1960s, their economic security lost
in the 1970s, and facing change spurred on by a massive in-migration of outsiders in the
1980s, the community that represents security and hope for the parents, now in their
sixties, represents turmoil and transition for their children who are now in their forties.
Based on this history, it is not a surprising revelation that on the quantitative survey in
phase one of this study, when the educators at school fifteen are asked which of the

164
domains of planning have the greatest impact on the final design of the facility, their top
three responses are the domains of: (1) economics, (2) politics, and (3) culture (see table
37).
Unfortunately, even with the majority of the Board of School Directors votes to
proceed with the construction of a new middle school, the quantitative and qualitative
variables within the six domains of planning and the interaction of those variables across
the domains of planning create a daunting task for those responsible for planning,
designing, and constructing school fifteen. The interaction of economic, political, and
social forces at work in the school district and community are contending with the needs
of teachers and students and limiting the resources available to the educators and design
professionals responsible for designing and constructing a facility which is a physical
representation of the school district’s educational visions.
The most severe limitation placed on educators and design professionals occurs
when the Board of School Directors votes to designate their elementary school
construction project as a replacement middle school. With blueprints already drawn for a
new elementary school, rather than lose the investment in architectural fees, those
responsible for planning school fifteen are directed to utilize the same the blueprints and
specify the facility as a middle school. Though the designation of educational spaces can
change and to a minor extent be redesigned, they are to remain virtually unchanged from
the blueprints for the elementary school (Interview 15-1, 15-2, 15-3, 15-7, 15-8, 2006).
One of the teachers interviewed who was on a small committee of approximately ten
teachers “hand selected by the principal at the time” to help plan school fifteen (Interview
15-2) considers himself to be “lucky” to help with the arrangement of work areas and

165
equipment in the two elementary classrooms that are designated to become the industrial
arts area (Interview 15-3, 2006). As another teacher on the core planning team laments,
“We were not allowed to do a lot with design. The design was set. We were limited to
little more than color choices” (Interview 15-1, 2006). The aforementioned teacher
supports the concerns with regard to the shortfall of the building design to explain: “The
initial design was to be an elementary school with a cafetorium (a cafeteria with a stage),
rather than an auditorium. When the building was changed to a middle school, I had to
make recommendations on how to best equip a stage in a cafeteria. What we needed was
an auditorium” (Interview 15-1, 2006). To add to the design problems, community
members, and especially residents with properties adjacent to the construction site, raises
concerns with the project. In an attempt to slow, stop, or redirect the project, issues are
raised with regard to the design of the facility and the layout of the campus, the cost of
the project, and the wisdom of the school board and administration in choosing to
construct a middle school. Property owners adjacent to the site on which school fifteen is
to be built raises concerns with regard to the proposed entrance to the property, an access
road for deliveries which runs between the school building and their properties, and
signage (Interviews 15-1, 15-2, 2006). Many of the issues raised by the community and
reported during structured interviews by educators are confirmed during a review of the
transcripts from the Act 34 Hearing. A review of the transcripts on file with the
Pennsylvania Department of Education record community members that ask questions of
the nature: (1) Can the Board of Education still change its mind about the project? (2)
What happens if the Board of Education wants to stop the project later? (3) How
adaptable is this building? (4) If the Board of Education chooses, can this building still be

166
an elementary school? (5) Can this building ever become a high school? (6) What other
costs are associated with this project? and (7) How much are we spending on furniture
and fixtures? (PlanCon 15, 1990).
With community resistance mounting, as a means to “appease” (Interview 15-2,
15-7, 15-8, 2006) the residents with properties that adjoin the site on which the school is
to be constructed, the blueprints for the school are reversed so that the building is a
mirror image of the original design. With this change, what is on the north side of the
building becomes the south side of the building. As a result, the access road for
deliveries is changed to the side of the campus opposite the concerned neighbors.
Though this change “somewhat appeased” adjacent property owners, it places the gym
and the locker rooms on a different side of the campus than the athletic and playing fields
(Interview 15-2, 15-4, 15-5). This problem is compounded by the fact that the layout of
the campus is not redesigned, therefore the safest and most convenient way to move
students from the locker rooms to the fields is ultimately through the main academic area
of the building (Interview 15-5, 2006, Building Tour 15, 2006).
When driving to school fifteen, flat-faced strip malls with porticos that protect the
shoppers entering and exiting the stores from the rain are common place. The only thing
that makes any twenty-five foot stretch of the face of one of these malls appear
differently than any other twenty five foot stretch are the signs in the windows. Other
than signs, the buildings are symmetrical and unadorned. The sides and backs of these
malls have long windowless stretches of brick or block broken by the employee entrances
which repeat themselves in equal increments. From the road, school fifteen looks
amazingly like one of these malls. Marked only by a low brick sign, the main entrance to

167
the campus and driveway positions arriving drivers at a forty-five degree angle to two
sides of the building. The face of the building that draws your immediate attention has a
one story high brick facade with a portico that protects students from the rain as they
enter and exit the busses. The buses pull-up, nose first and at an angle to the building. A
sign every fifteen feet identifies the number of the bus loading or unloading in that spot.
The other side of the building which faces a driver upon approach is one and a half
stories high and contains the gymnasium. Other than a few windows just below the roof
line, the long stretch of brick on this side of the building is only broken by the occasional
entrance. Overall, there are few architectural details or changes in the type or texture of
the building materials. The building is fairly symmetrical and unadorned. With that
stated, the building is not unpleasant. With minimal architectural detailing, its clean
distinct lines accent the well maintained building and spotless campus. The clean facade,
sidewalks, and well maintained grounds easily demonstrate pride in upkeep. From the
exterior, the building looks efficient and purposeful. However, other than the low sign at
the entrance, that purpose is not immediately evident. This is compounded by the fact
that the main access into the building is created by cutting-off the corner of the building
furthest from the entrance. As a result, the main doors are a forty-five degree angle from
the two adjoining sides. Unfortunately, it is on the side opposite the main entrance to the
campus. The main doors to the facility face directly toward the main exit from campus.
The immediate purpose of the building is most easily recognized in the rearview mirror
of a car driving off of the campus. Had the building been positioned as it is originally
intended by the designers, rather than as a mirrored image to appease the neighbors, the
main doors to the building would face directly toward the main entrance to campus.

168
Upon arrival, this provides a clear focal point that along with the signage and flagpole,
can offer an immediate announcement of the facility’s purpose.
Like the exterior, the interior has a very functional look. The clean lines and
basic design of the well maintained facility convey functionality and pride in upkeep.
Though the majority of the educators are quick to list the faults of the building, they also
demonstrate pride in their school, their programs, and their students through an emphasis
on the positive things that occur at their school (Interviews 15-1, 15-2, 15-4, 15-8, 2006).
Educators are as equally enthusiastic point out ways that the faculty has adapted to the
shortcomings of the facility. For example, one educator who is quick to outline the
problems associated with practicing and performing in the cafetorium, is as equally quick
to explain ways the teachers have “gotten around those issues”. The teachers evidence
their success by noting the “enthusiasm” of the students and “the large turn outs” when
any performances are staged (Interview 15-1, 2006). In another example, after discussing
how the size of the gymnasium, locker rooms, and athletic storage areas are too small for
the size of the student body, another educator, with pride in their accomplishment, points
out how the physical education teachers use the gymnasium, auxiliary gymnasium,
hallways, and parking lot to their advantage, and how they govern the movements of the
children in the crowded space through a PA system and wireless microphone (Interview
15-2, 2006). The physical education teachers, librarian, and a member of the
administrative team all provide examples of the same nature (Interviews 15-4, 15-6, 15-7,
2006).
The contrast between educational concerns that arise from problems with the
design of the facility, a sense of shared purpose, and a focus on what is important for

169
students that is conveyed by educators during structured interviews, is also evident in the
results of the survey conducted during phase one of this study. This contrast
demonstrated quantitatively and qualitatively, is the reason school fifteen is unique from
the other fourteen schools that participate in the research. When the educators at school
fifteen are asked to respond to the statement: “This school has an educational vision”,
their mean response is greater than that of six of the other fourteen schools and above the
mean response of all fifteen schools that participate in the study (see figure 5). At the
same time, out of fifteen schools in the sample, the educators at school fifteen have the
lowest mean responses to the statements: “The design and appearance of this facility
conveys the educational vision of the school” and “This school meets the needs of
faculty, staff, students, and the community” (see table 29). During this investigation no
single domain more than demographics attributed to the contrast between the degree to
which educators at school fifteen believe their school has an educational vision and the
degree to which they believe their building is a not physical representation of that vision.
During structured interviews, 100% of the educators convey dissatisfaction with
the way that the building addresses the size, needs, and composition of the student body
(Interviews 15-1, 15-2, 15-3, 15-4, 15-5, 15-6, 15-7, 15-8, 2006). In the decade that leads
to the formation of the school district, and during the twenty-four years leading up to the
planning and design of school fifteen, the school district constantly struggles with the
size, needs, and composition of the student body. As stated earlier, the primary reason
that the school district is formed is to effectively and efficiently deal with student
demographics. In documentation on file with the Pennsylvania Department of Education,
the school district reports that in the years prior to the planning of school fifteen, they

170
exercise, “extreme caution not to add classroom space unnecessarily or at a prohibitive
cost” (PlanCon 15, 1990). At the same time, a review of district materials and PlanCon
documents indicate that from the mid-1980s to the opening of school fifteen in 1992, the
stance of “extreme caution” leaves the school district continually short of classroom
space. Unfortunately, even with more than twenty-five years worth of lessons learned,
the school district continues to fail to adequately predict and adjust to changes in
demographics. Since the opening of school fifteen in 1992, the school district has made
alterations and additions to five school buildings and has constructed a new elementary
school (PDE Construction Summary, 2003). One building which receives a major
addition is school fifteen. In 1995, just three years after school fifteen opens, a major
addition increases the number of core academic classrooms by a full one third (Building
Tour 15, 2006, Interview 15-2) and raises the total rated capacity of the facility by 200
students. Though it might be assumed that a substantial addition alleviates the concerns
of educators, due to the fact that it is impossible to increase the size of the hallways in the
original portion of the building, and due to the fact that the school district chooses not to
enlarge the common areas which include the lobby, library, cafeteria, and gymnasium,
athletic facilities, and the entrance and exit to the campus, the original design flaws of the
building are exacerbated (Building Tour 15, 2006, Interview 1-15, 2-15, 3-15, 4-15, 5-15,
2006). This set of events is cited by educators during the structured interviews as the
primary reason for overall dissatisfaction with the facility (Interviews 15-1, 15-2, 15-3,
15-4, 15-5, 15-6, 15-7, 15-8, 2006).
In the case of school fifteen, culture economics, politics, and demographics are
four domains of planning that together represent a uniquely dynamic and complicated

171
collection of quantitative and qualitative variables. Emphasis on these domains of
planning does not indicate that the quantitative and qualitative variables within the
domains of architectural acuity and pedagogy are not important in the school district
during the time that school fifteen is designed. The fact that the school district has a
decade worth of experiences in middle level education is reflected in how the educational
spaces are designated within the facility, how teachers are assigned to those spaces in
relationship to educational programs and to one another, and how those programs are
scheduled within the facility (Building Tour 15, 2006). Likewise, architectural acuity is
also evident given the constraints placed on educators and design professionals by the
Board of School Directors. Working with the limited resources allotted to them, it is
apparent that the architect and design professionals work with the principal and teachers
to provide a functional middle school that is as close to a physical representation of the
educational vision as possible (Building Tour 15, Interview 1, 2, 2006). In support of this
observation, interviews with three of educators who work in this school the year that it
opens indicates that the facility functions well as a middle school during its first year of
operations (Interviews 15-1, 15-2, 15-3, 2006). Unfortunately, within a year of the
facility’s opening, accommodations are already being made to deal with changing
demographics. In less than three years from the time it opens, educators and design
professionals find themselves back at school fifteen to plan a major addition.
Findings of School Fifteen
Does School Fifteen have an Articulated Educational Vision?
The school district in which school fifteen resides currently operates three middle
schools. When school fifteen is constructed, the school district has more than a decade

172
worth of experience with middle level education. During structured interviews, the
educators at school fifteen collectively establish that they maintain a shared sense of
purpose and a focus on what is important for students. They evidence their beliefs
through a demonstration of pride in their school, their programs, and their students. Even
when they readily list obstacles to their educational programs due to the design of the
facility, they still emphasize the positive things that occur and the ways that the faculty
has adapted to them.
Quantitatively, the educators at school fifteen mean response to the statement:
“Within this school and community that it serves, there is a shared sense of purpose and a
focus on what is important for students”, is 5.086 out of a possible 6.0 (see table 38,
Statement 4). In addition, when asked to respond to the statement: “This school has an
educational vision”, the mean response is 5.629 on a scale of 7.00 (see table 38, statement
18). These results are consistent with the findings during the qualitative study.
Is School Fifteen a Physical Representation of the School District’s Educational Vision?
From the onset, it proves to be a challenge to plan school fifteen as a facility that
is designed to be a physical representation of an educational vision. With plans already
drawn for a new elementary school, rather than lose the investment in architectural fees,
those responsible for planning school fifteen are directed to utilize the same blue prints
and simply designate the facility as a middle school. Though the designation of
educational spaces change and to a minor extent be redesigned, they are to remain
virtually unchanged from the elementary school blueprint (Interview 15-1, 15-2, 15-3,
15-7, 15-8, 2006). As a result of this action, it is not unexpected when, out of fifteen
schools in the sample, the educators at school fifteen have the lowest mean responses to

173
the statements: “The design and appearance of this facility conveys the educational vision
of the school” and “This school meets the needs of faculty, staff, students, and the
community (see table 38, statement 12). This sentiment is also echoed during structured
interviews, when 100% of the educators convey dissatisfaction with the way that the
building addresses the size, needs, and composition of the student body (Interviews 15-1,
15-2, 15-3, 15-4, 15-5, 15-6, 15-7, 15-8, 2006).
Given the fact that school fifteen is the oldest school to participate in the study, it
stands to argue that after thirteen years of operation, the educators respond to the survey
questions based on current conditions of the facility, and that the lowest degree to which
they indicate the facility meets the needs of faculty, staff, parents and the community are
the result of events that could not have been anticipated even by the most astute facility
planners. To this end then, it is necessary to point out the fact that the design issues which
cause the greatest concerns today, begin almost immediately after the facility is opened.
Three of educators who participate in structured interviews indicate that within two years
of the facility’s opening, teacher planning centers are being converted to additional
classroom spaces, and that the common areas, especially the halls, show they are not
designed to manage the increasing number of students (Building Tour 15, 2006,
Interviews 15-2, 15-3, 15-4, 15-6, 2006). As the elementary schools continue to be
pressed for space, the school district is forced to begin planning a major addition to
school fifteen. The problems that arise and lead up to the construction of the addition,
and the concerns raised with the inadequacy of the addition have been consistent over the
thirteen years since school fifteen opens.

174
Do the Design Professionals and Educators who Plan School Fifteen Manage Variables
within and Across the Six Domains of Planning when they Design the Facility?
Quantitatively, an analysis of the survey reveals that when educators at school
fifteen are asked to respond to the statement: “Those responsible for planning and
constructing this facility understood the interaction of economic, political, and social
forces at work as well as the needs of teachers and students” their mean response is the
lowest of all fifteen schools that participate in the survey. Their mean response is 3.486
out of 7.0 (see table 38, statement 49). In addition, every educator is asked six questions,
one for each of the domains of planning, with regard to the degree at which “those
responsible for planning the facility understood” each domain. Again, of the fifteen
schools, the educators at school fifteen have the lowest mean response when the
responses of all six questions are averaged. The average of the mean responses to the six
questions is 3.233 out of 7 (see table 13).
As evidenced in structured interviews, public documents filed with the
Pennsylvania Department of Education, a tour of the facility, a review of artifacts from
the school district, and a historical examination of the county, those responsible for
planning school fifteen have difficulty managing the six domains of planning as well as
the interaction of those domains. Of particular difficulty for planners are the quantitative
and qualitative variables within the domains of economics, politics, and culture. This is
not to indicate that the domains of pedagogy and architectural acuity are not important.
However, they are over shadowed by the complexity of the qualitative and quantitative
variables in the other four domains. Evidence of these findings, as arranged by domains,

175
is as follows:
Culture. When examining this case, it becomes clear that the history and culture
of the school district and community is of critical importance to understand the
apprehension, frustration, and dissatisfaction that manifests itself in a reluctance to
provide additional classroom space. The history of the county reveals that the school
district is located in a planned community built by the families of men that return home
from World War II. Over the forty years that follow, the community prospers, suffers
economic and population swings, and then prospers once again. Based on this history, it
is not a surprising revelation that, on the quantitative survey in phase one of this study,
when the educators at school fifteen are asked which of the domains of planning have the
greatest impact on the final design of the facility, their top three responses are the
domains of: (1) Economics, (2) Politics, and (3) Culture (see table 37). Although these
responses represent forty years of time that leads up to the planning of school fifteen, the
dynamics of their impact is none the less important to the twenty-four month period that
school fifteen is planned.
Demographics. Leading up to the formation of the school district in 1966 when
enrollments are growing rapidly, and on through the 1970s when student enrollment
declines, and finally, on into the 1980s when a sudden growth in student enrollment
catches the district off-guard, the school district in which school fifteen resides has
difficulty coping with the size, composition, and needs of the student body. Over the two
decades which lead up to the construction of school fifteen, the school district forms task
forces and committees, collects data, and commissions studies to examine issues
associated with changes in student demographics. Although recommendations from

176
these efforts make it clear that additional classroom space is needed, the school district
exercises “extreme caution not to add classroom space unnecessarily or at a prohibitive
cost” (PlanCon 15, 1990). A review of district materials and PlanCon documents
indicate that from the mid 1980s to the opening of school fifteen in 1992, the stance of
“extreme caution” leaves the school district continually short of classroom space.
Unfortunately, even with the opening of school fifteen, the district continues to be short
of classroom space. In the decade that follows the opening of school fifteen, the school
district completes alterations and additions to five school buildings and constructs a new
elementary school (PDE Construction Summary, 2003). One of the buildings that
received a major addition is school fifteen. In 1995, just three years after school fifteen
opens, a major addition increases the number of core academic classrooms by a full one
third (Building Tour 15, 2006, Interview 15-2) and raises the total rated capacity of the
facility by two hundred students. On the quantitative survey in phase one of this study,
the educators at school fifteen indicate that the domain of demographics is least
understood by those responsible for planning their school, and that demographics is the
domain that is least reflected in the final design of the facility.
Economics. Quantitatively and qualitatively, the economics of the school district
and community are a domain of major consideration. From a review of the survey
results, school district documents, PlanCon documents, transcripts from the Act 34
hearing, structured interviews, and history of the county, the economic turmoil and
uncertainty of the late 1970s and 1980s play a critical role in the decision making
process. Even though the debt service on several of the school buildings is nearly retired,
the interest rates are low, and the educational facilities are not adequate for the current

177
student population, let alone the projected student population, the Board of Education
resists in releasing the resources necessary to make permanent, long-term improvements.
As it is known that the capacity of the middle schools cannot handle its student
population enrolled in the elementary schools, elementary students continue to attend
classes in overcrowded classrooms, thereby forcing the school district to enter into a
prolonged decision making process. When the Board of Education does act, the type and
amount of facilities constructed barely meet the needs of the student population enrolled.
Politics. The relationships between educators, elected officials, parents,
community groups, and citizens are clearly strained during the time which leads up to the
planning of school fifteen. A review of school district literature and records, structured
interviews, and documents on file with the Pennsylvania Department of Education
indicates high levels of apprehension, frustration, and dissatisfaction among the
stakeholders of the school district in which school fifteen resides. Transcripts of
meetings and school district documents indicate that school board members, the
administration, parents, and community members are at times combative. The nature of
the relationships within and between these groups, aggravated by the economic situation
of the community, result in a school district which is slow to respond to the problems of
inadequate classroom space.
Pedagogy. Although overshadowed by economics, politics, culture, and
demographics pedagogy is nonetheless important to the school district and its educators.
The fact that the school district has a decade worth of experiences in middle level
education is reflected in how the educational spaces are designated within the facility,
how teachers are assigned to these spaces in relationship to educational programs and to

178
one another, and how these programs are scheduled within the facility (Building Tour 15,
2006).
Architectural acuity. Architectural acuity is evident given the constraints placed
on educators and design professionals by the Board of School Directors. Working with
the limited resources allotted to them, it is apparent that the architect and design
professionals work with the principal and teachers to provide a functional middle school
that is as close to a physical representation of the educational vision as possible (Building
Tour 15, Interview 1, 2, 2006). In support of this observation, three of the educators that
are interviewed and work in that facility the year that it opens indicate that the facility
functions well as a middle school during the first year of operation (Interviews 15-1, 15-
2, 15-3, 2006).
Interaction of domains. This investigation identified and described complicated
social, cultural, political, and economic mechanisms at work when, in a democratic
society, this public school is planned. The interaction of economic, political, and social
forces at work in the school district and community contend with the needs of teachers
and students, and they also limit the resources available to the educators and design
professionals responsible for designing and constructing a facility which is a physical
representation of the school district’s educational visions. The environment in which this
school is planned is complicated and dynamic.
Does School Fifteen meet the Needs of the Stakeholders?
On the quantitative survey in phase one of this study when the educators at school
fifteen are asked to respond to the statement: “This school meets the needs of faculty,
staff, students, and the community”, their mean response is 2.371 out of 6 (see table 38).

179
Qualitatively, as a result of a building tour (2006) and structured interviews with
educators (2006), although Fifteen is a well maintained, functional building it is limited
in the degree to which it meets the needs of faculty, staff, students, and the community.
Table 36
Tier One and Two Selection Data for Fifteen
School 15 Mean of Vision (4) 5.086 Mean of Physical Representation (5) 4.543 Year of Opening 9/1/1992 Count Percent Possible Participants 65 Total Participants 35 53.85% Involved in Planning (1) Yes 6 17.14% No 29 82.86% Total 35 100.00% Years Spent in Facility (2) 0 to 2 2 5.71% 3 to 4 5 14.29% 5 to 6 5 14.29% 7 to 8 5 14.29% 9 to 10 4 11.43% 10+ 14 40.00% Total 35 100.00% Facility Utilized As Designed (3) Yes 13.00 37.14% No 22.00 62.86% Total 35.00 100.00%

180
Table 37
Ranked Responses Mean Responses for Fifteen
School 15
Rank Order of Degree to Which Planning of Facility Required Knowledge of Domains
Mean of Responses
Rank Order of Degree to Which Facility Planners Understood Domain
Mean of Responses
Rank Order of Degree of Impact on Design of Facility
Mean of Responses
Architectural Acuity 5.471 Economics 4.286 Economics 5.200 Demographics 5.457 Politics 3.657 Politics 3.657 Pedagogy 5.429 Interaction 3.486 Culture 3.486 Economics 5.371 Culture 3.314 Interaction 3.400
Interaction 5.229 Pedagogy 3.114 Architectural Acuity. 3.324
Culture 5.176 Architectural Acuity 3.086 Pedagogy 3.257
Politics 5.029 Demographics 2.286 Demographics 2.657

181
Table 38
Summary of Survey Responses from Fifteen
Survey Statement n Mean SD SE 4 35 5.086 0.9194 0.1554 5 35 4.543 1.1966 0.2023 6 34 2.147 1.0483 0.1798 7 35 3.057 1.5328 0.2591 8 35 3.486 1.3799 0.2333 9 35 4.114 1.2549 0.2121
10 35 3.857 1.3093 0.2213 11 34 2.735 1.2627 0.2166 12 35 2.371 1.2853 0.2173 13 35 2.943 1.2113 0.2047 14 35 6.057 0.9983 0.1687 15 35 5.486 1.1973 0.2024 16 34 5.471 0.9609 0.1648 17 35 5.371 0.9420 0.1592 18 35 5.629 1.4770 0.2497 19 35 4.400 1.6306 0.2756 20 35 4.486 1.5024 0.2539 21 35 4.514 1.4219 0.2403 22 35 4.514 1.5787 0.2669 23 35 4.171 1.5046 0.2543 24 35 5.457 2.0771 0.3511 25 35 2.286 1.5257 0.2579 26 35 2.657 1.5135 0.2558 27 35 5.429 1.5394 0.2602 28 35 3.114 1.7619 0.2978 29 35 3.257 1.9755 0.3339 30 34 5.176 1.6044 0.2751 31 35 3.314 1.7451 0.2950 32 35 3.486 1.5787 0.2669 33 35 4.086 1.6156 0.2731 34 35 5.086 1.4627 0.2472 35 35 5.371 1.3303 0.2249 36 35 4.286 1.8562 0.3138 37 35 5.200 1.5301 0.2586 38 35 5.029 1.5809 0.2672 39 35 3.657 1.6439 0.2779 40 35 3.657 1.6259 0.2748 41 34 5.471 1.7621 0.3022 42 35 3.086 1.6693 0.2822 43 34 3.324 1.8541 0.3180 44 35 2.829 1.5809 0.2672 45 35 3.429 1.8034 0.3048 46 35 3.086 1.6337 0.2761 47 34 3.735 1.6933 0.2904 48 35 5.229 1.8001 0.3043 49 35 3.486 1.6337 0.2761 50 35 3.400 1.6485 0.2787

182
School Nine
Qualitative Data
School number 9 (nine) is the only middle school located in a school district
classified as “urban on the fringe of a large city” (NCES, 2004). School nine has a
student population of 451 children served by the full time equivalent of 28 teachers
(Great Schools, 2004). In total, the 2.9 square mile school district educates 1,564
students and serves a community of 15,362 residents (Standard & Poor’s, 2005). School
nine is chosen as one of the four purposefully selected sites for comparative case study
because when evaluated against the other fourteen schools in the sample, the educators at
school nine have a low mean response to the statement: “Within this school and
community that it serves, there is a shared sense of purpose and a focus on what is
important for students”, and a high mean response of the statement: “This facility
contributes to a shared sense of purpose and a focus on what is important for students
(see table 39). Based on these criteria and on an analysis of variance (ANOVA) of the
mean survey responses of the educators at school nine, as a single case, it is significantly
different from the other fourteen schools in the population.
School nine is a 72,000 square foot middle school that opens in 2002. Housing
grades six, seven, and eight, the facility contains 24 academic classrooms, 3 science labs,
1 computer lab, a full gymnasium with two locker rooms, an art room, technology,
family, and consumer science module computer labs, and a library. The facility also
contains accommodations for the administration, counselors, and support staff, work
areas for teachers, and a cafeteria with a seating capacity of 450. Notably missing from
the facility are an auditorium, band, and chorus rooms. In addition, the facility does not

183
have any athletic or playing fields. The building is situated on a 24 acre parcel of land
previously owned by the school district. The tract of land on which the school sits is
outside the boundaries of the school district. The school district purchased the land in
anticipation of a high school construction project that never comes to fruition (PlanCon 9,
2000). In 1997, the school district opens a new elementary school on the northern edge
of the 24 acres. The middle school sits on the southern edge of the same site.
According to PlanCon documents on file with the Pennsylvania Department of
Education, the need for the construction of a new middle school is justified based on four
criteria (PlanCon 9, 2000). First, the district sites the success of the new elementary
school as “attributing to an overcrowding at the kindergarten through sixth grade facility”
(PlanCon 9, 2000). The school district plans, with the construction of a new middle
school, to remove sixth grade from the elementary school to create room for growth.
Second, like the elementary school, the school district’s junior/senior high school is at
capacity. As a result, there is no space for computer or science labs. In addition, the
district projects that increased enrollment at the elementary level will eventually reach the
high school to create an even greater need for additional space. The school district plans,
with the construction of a new middle school, to remove seventh and eighth grades from
the junior/senior school to create space to expand programs for growth. Third, when the
district constructed the new elementary school outside of economically distressed
neighborhoods, educators and district officials recognize that they are better able to
address the health and safety issues of their elementary school students, and better
educate the children. They believe that many of the health and safety issues addressed by
building a new elementary school need to be extended to a middle school. Finally, the

184
district subscribes to a middle school philosophy and attempts to operate middle school
programs in a junior/senior high school setting. The district feels that the needs of young
adolescents can be best met in a separate middle school.
Though the school district provides demographic, pedagogical, and cultural
rationale for the construction of a new middle school, economic justification for a new
middle school is more difficult. A review of local newspaper articles discloses that
school nine is located in a school district with a history of poor fiscal management (Local
Newspaper 9, 2005). In 1988, the school district has a $760,000 deficit and an
unfavorable report from the state Auditor General’s office. The shortage is reported as
being the result of “poor fiscal management” (Local Newspaper 9, 2005). By 1992, the
district asks the state to take over its operation because of continuing economic troubles
(Local Newspaper 9, 2005). By the end of the 1990s, the school district is recognized for
reversing its trend of poor fiscal management. In 1997, the school district opens a new
K-6 elementary building. This is the first new school in the school district in seventy-five
years (District Literature 9, 2006). In addition, that same year, the school district receives
a $1.2 million grant to renovate the school district’s early childhood center (Local
Newspaper 9, 1997). During this time period, the school district receives regular audit
reports that indicate full compliance with applicable state laws and regulations, and that
the school district receives the funds from the state to which it is entitled (State Auditor
General Reports, 1997, 1998, 1999, 2000). It was during this time that the school district
gains enough financial solvency to issue general obligation bonds (PlanCon 9, 2000) for
the purpose of building a new middle school.

185
The economic problems of the school district are a reflection of the larger
community in which school nine resides. The school district includes four federally
funded housing projects which provide housing for low income families (Interview 9-1,
9-2, 9-4, 9-5, 2006). According to Standard and Poor’s (2005), 26% of the households in
the school district have incomes less than $15,000.00, and an additional 26% have
incomes less then $30,000 (Standard & Poor’s. 2005). The median household income is
$44,913.00 and the median home value is only $46,267.00 (Standard & Poor’s. 2005).
However, this is not always the situation in the school district. During the first half of the
twentieth century, the communities around the school district are known for their
extensive iron and steel interests. Also, there are large railroad machine shops and
manufactories of enamel ware, lumber, wall plaster, locomotive and car springs, nuts and
bolts, malleable castings, chains and forgings, freight and passenger cars, tin ware,
concrete, and cigars (Wikipedia, 2006). During the second half of the twentith century,
the communities around school nine witness rapid economic decline. The municipality at
the heart of the small school district peaks in population, with just under 20,000 residents
in the mid-twentith century (Wikipedia, 2006). Less than fifty years later, the 2000
census indicates that the population of the municipality has dropped to 6,622 residents
(U.S. Census Bureau, 2006). Over the last decade, the school district and the county in
which it resides witnesses a 4.10% decrease in its population; only two of Pennsylvania’s
sixty-seven counties see a greater out-migration between the 1990 and 2000 census
(CensusScope, 2006).
The combination of a decrease in population, a decline in property values, and
fixed operating costs drive the per pupil expenditures of the school district well above the

186
state average. As reported by Standard and Poor’s (2004), the school district in which
school nine resides has an average operating expenditure of $11,624.00 per student;
$3,267.00 more than the state average. The $11,624.00 per child represents money spent
on instruction, support services, and non-instructional services, among other day-to-day
purposes, from the general fund, special revenue fund, food services, child care, non-
major fund and other enterprise funds. Operating expenditures include salaries and
benefits, supplies and materials, and purchased services. Operating expenditures exclude
capital and debt-related expenditures, adult education, community service, as well as trust
and agency funds, and internal service funds. Of the $11,624.00 per child operating
expenditures, $8,064.00 is spent on instruction and instructional support (Standard &
Poor’s, 2004). In the same year, the school district carries capital expenditures of
$6,389.00 per student, 480% above the state average (Standard & Poor’s, 2004).
According to the Pennsylvania Department of Education Division of School Facilities
(PDE DSF), the cost of site acquisition, structure, and movable fixtures and equipment
for school nine equals $8,993,485.00 (PDE DSF, 2002). PDE DSF calculates the per
square foot cost of an educational facility by adding the cost of the structure, architects
fee, and sewage disposal, and then divides it by the architectural area in square feet. PDE
DSF calculates the per square foot cost of Nine to be $118.81 (PDE DSF, 2002). The per
square foot cost is well within the average range of middle schools built in 2001 PDE,
DSF, 2001).
Given the economic condition of the school district and community in which
school nine resides, it is not surprising that on the survey in the first phase of this study,
economics is the domain of planning that educators report to have the greatest impact on

187
the final design of the facility (see table 40). Beyond the survey results, structured
interviews reveal that the educators at school nine discuss the economics of the school
district and community in an entirely different manner than the educators in the other
three school districts that participate in the comparative case study. During structured
interviews in the other three school districts, economics is discussed by educators in
terms of the resources that the school district and community provide to teachers and
students (Structured Interviews 15-1, 15-2, 15-6, 15, 7, 12-2, 12-3, 12 5, 2006). At
school nine, economics is always described in terms of the distress of the community and
the problems that poverty causes for families, students, and the school district (Structured
Interviews 9-2, 9-3, 9-4, 2006) Given the fact that the small community in which school
nine resides is economically distressed and has limited resources to commit to
educational facilities, the decision to build an $8 million facility would strain the
relationship between educators, elected officials, parents, community groups, and
citizens. However, there is no indication that the Board of School Directors has any
problems moving the project forward. A review of the transcripts from the Act 34
hearings reveal that during the hearings, only six of nine school board members are
present and there are no members of the community at the hearing (PlanCon documents
9, 2000). On March 9, 2000, the board of school directors, with one member absent, vote
unanimously to proceed with the construction of a new middle school.
Driving on a road along the Ohio River there are points on the way to school nine
that enables one to easily forget where its at. With the river to the immediate left and
mountains rising to the immediate right, one gets a glimpse of what this valley must have
looked like two hundred years ago. However, as one rounds a corner, skeletons of rusted

188
river barges stretch along the shore. Pipes, tanks, and pilings, along with mounds of
twisted metal beams, rusting and wasting, provide a vivid image of the economic distress
that has befallen this community. As bleak as the once thriving river docks now seem, it
is still only a small reflection of the difficulties associated with living in the municipality
in the heart of this very poor school district. Poverty has given rise to four federally
funded low income housing projects that only serve to center the plight of the community
on the front doorsteps of the children. Though the community has been involved with
renovating and revitalizing efforts (Community Literature, 2006), the principal of school
nine reports that during the first semester of the 2005/06 school year, three students are
directly or indirectly involved with gun violence, and that a fourth is alleged to have
committed a murder (Interview 9-2, 2006). On any given day, gangs, violence,
alcoholism, drug addiction, teen pregnancy, and hopelessness can keep students from
attending school.
Given the economic, social, and cultural problems in the school district and
community, it is not surprising that the student demographics of school nine reveal a
student body which is academically struggling and economically disadvantaged. The
student body at school nine is primarily Caucasian, Non-Hispanic, and African American.
The composition of the student body is 61.7% Caucasian, 36.8% African American, 1.0
% Hispanic, and 0.5% Asian/Pacific (Standard & Poor’s, 2004). Although scores have
generally been on the increase, in 2005, the eighth grade students at school nine fail to
attain adequate yearly progress in reading and math as defined by the federal
government’s No Child Left Behind Act of 2002. During the 2004/05 school year, 67.2%
fail to reach grade level proficiency in reading as measured by the standardized

189
Pennsylvania System of Assessment proficiency in reading, and 70.4% of the eighth
grade students fail to make grade level proficiency in math (PDE Report Card 9, 2005).
As a result, the school district is cited by the Pennsylvania Department of Education.
That same year, the school district posts a graduation rate of 87% (PDE Report Card 9,
2005). According to the Pennsylvania Department of Education, 71% of the student
body is from low income households (PDE Stats, 2004).
Perched on a terrace nestled on the side of a hill, school nine makes an immediate
and welcoming impression. Using different textures and colors of block and brick,
enameled trim, varied pitched roofs and architectural details, school nine is a facility that
is easily recognized as a school. In addition, the overall appearance and style of the
building gives the impression that the facility is a school for older children. However, the
scale, colors, and architectural details do not convey that the building is a high school.
Even absent the signage, one would likely guess that school nine is a middle school.
The interior and exterior colors of school nine are muted, earthy, and soothing.
Arriving before sunrise, the interior and exterior lighting give the building an amber
glow. From the main entrance to campus, simple jade-colored geometric ornamentation
can be seen just below the roof line on the exterior of the building as well as on a smaller
scale down the halls inside the building. Carrying colors, patterns, and architectural
details from the exterior to the interior of the building give the facility a warm, friendly,
and inviting look.
As the buses arrive, students in uniforms begin to line up single file in the
vestibule. Watching the students arrive through a large plate glass window that separates
the office from the vestibule and lobby, one never anticipates seeing five to eight teachers

190
and security guards enter the lobby, line-up up folding tables, and begin searching every
back pack, gym bag, and purse as students enter the building. As students wait for their
belongings to be searched, security guards use metal detectors to check every student that
enters the building. Exiting the office from behind the plate glass window, one can hear
conversations which occur in the vestibule and lobby. The conversations, bag search, and
use of metal detectors quickly ground any visitor in the reality of the environment.
Once in the lobby, students are greeted with signs that announce the school is a
“Hands-Off Environment,” that “Respect, Tolerance, and High Expectations” are
important values for the school, and that students are held to a “No Excuses” policy.
These terms, phrases, and associated expectations are explained to parents and guardians
in a letter prior to the opening of school (Summer Mailing 9, 1005), and also to the
students during an assembly on the first day of school (Interview 9-2). These messages
are consistently reinforced by educators (District Literature 9-1, 2005, Interviews 9-2, 9
4, 2006). The stated goal of the educators at school nine is to let the students know they
are welcome, safe, and encouraged to choose a lifestyle free from crime, drugs, gangs,
and violence (District Literature 9-2, 2005). The appearance and layout of the facility,
and the manner in which the facility is utilized, greatly assists the educators to provide
these messages to students. In short, the facility and the way it is utilized greatly
enhances feelings of safety and belongingness for the students (Building Tour 9, 2006).
Once students complete the bag search and pass through metal detectors, they
quickly disperse to the three academic wings. Each academic wing houses a separate
grade level and is easily accessible from the central lobby. The fourth wing of the
building houses the creative arts classrooms, cafeteria, and gymnasium. A tour of the

191
facility and an interview with the principal reveals that building is designed as a series of
wings to better manage the unique needs of different grade levels and the student body as
a whole (Building Tour 9, 2006, Interview 2, 2006). In addition to separating the
children by grade level, the students are also divided into teams, and the teams are
divided into groups. The rooms in each of the wings are arranged so that teachers on a
team are assigned to adjacent rooms, and their students’ lockers are in the halls just
outside those rooms (Building Tour 9, 2006).
Once the academic day begins, students rotate through a very traditional middle
school schedule. However, the educators stagger every grade level’s eight-period
schedule so only one grade level changes classes at a time. This not only reduces noise
and disruptions, it allows the administrators and security guards to focus their attention in
the hall where students are moving. The head security guard believes that those
responsible for planning school nine understand that time between classes is unstructured
and prone to disruptions (Interview 9-1, 2006). The security guard points out the fact that
the corridors at school nine are designed to have long, unobstructed views (Building Tour
9, 2006, Interview 9-1, 2006). Even when students exit a wing, their movements are
easily monitored by the teachers in the wing that they enter. In Nine, it is difficult to find
lines of sight with obstructed views from carefully placed teachers and security. Again, it
is important to recognize how the design of the facility, coupled with how educators are
utilizing that design, combined to manage a difficult student body and help promote
feelings of safety and belongingness.
The building is designed to support traditional pedagogical practices of a middle
school. Beyond academic subjects, children have an opportunity to participate in

192
exploratory and physical education classes. Students rotate through periods of art,
technology education, family and consumer science, physical education, health, and the
library. These spaces, like the academic classrooms, are designed to meet the needs of
the students and educators. The physical education teacher, librarian, and art teacher all
acknowledge satisfaction with their instructional spaces (Structured Interviews 9-5, 9-6,
9-7, 2006)
In the cafeteria, students eat lunch by grade level. The cafeteria is designed to
double as a large group area for the entire school. As a result, the cafeteria is sized to
seat 450 students during assemblies. However, for lunch periods, the total number of
students does not exceed 160. As a result during lunches, the cafeteria is spacious and
flexible. Furniture and fixtures in the cafeteria are kept to only what is needed by
students during lunch. The round cafeteria tables only allow seating for six to eight
students. The small seating size per table combined with the large floor space provides
ease in monitoring a whole grade level of students during lunch. Single fixture
bathrooms adjoin directly to the cafeteria. Lunch monitors and security guards only
allow one student in each restroom at a time. The students entering and exiting the
lavatories are always in plain view of an adult. Again, with forethought in the design, a
cafeteria which is often one of the most difficult to spaces to manage in any school, can
effectively and efficiently be policed by educators, teachers aides, and security personnel.
Given the degree to which school nine assists and complements the social and
academic mission of educators, it is not surprising that during phase one of this study,
when educators are asked to respond to the statement: “The design and appearance of this
facility conveys the educational mission of the school”, their mean response is 6.237 on a

193
scale of out of 7.0 (see table 41, statement 23). This is the fourth highest mean response
of all fifteen schools that participate in the survey and is separated by only five one-
hundredths of a point from the schools ranked second and third (see table 13). Likewise,
when asked to respond to the statement: “This facility meets the needs of faculty, staff
students and the community”, the mean response of educators at school nine is 4.545 on a
scale of six (see table 41, statement 12). Their ranked mean response places school nine
fifth out of the fifteen schools surveyed (see table 41). With responses of this caliber and
observations of this nature, one can speculate that educators play a crucial role in the
planning of school nine. However, this is not the case.
School nine is primarily planned by the lead architect, superintendent of schools,
and a board member (PlanCon 9, 2000, Interview 2-9, 2006). The principal reports that
“Other than being allowed to make some decisions regarding furniture, the school was
built with no input from teachers” (Interview 9-2, 2006). The principal goes on to state
that the planning of this facility is done primarily by “a board member and the architect.”
(Interview 9-2, 2006). The principal states that she does not see the design of the school
until after the educational specifications for the building are determined. The principal
indicates during structured interviews that other than colors, the rest rooms that adjoin the
cafeteria, and her insistence on a particular flooring material, she and her teachers have
nothing to do with the planning or design of the facility (Interview 9-2, 2006). A review
of the PlanCon documents supports the principal’s assertion that very little input is
collected from the building principal and none is collected from teachers (PlanCon 9,
2000). PlanCon documents indicate that the initial program for the building is developed
during meetings attended by central office administration and architects. Using

194
information from that meeting, the architects present a design proposal. Though the
PlanCon documents indicate that at a series of meetings conducted with the middle
school principal, district personnel, and interested board members, the principals
contends that what occurs is very superficial (Interview 9-2, 2006). To support this
assertion, the principal states that she had to “fight for even the littlest change” (Interview
9-2, 2006). The PlanCon documents also record that “all interested district personnel”
tour a school project in a neighboring state that is completed by the architectural firm,
and is of a similar scope and size as the proposal for school nine. Again, the principal
and educators at the building level indicate that they did not participate in the site visit.
As a matter of fact, 100% of the educators who participate in structured interviews
indicate that they have no input on the design of the building (Interviews 9-2, 9-4, 9-5, 9-
6, 9-7, 2006). Finally, PlanCon documents report that the architects tour the school
district’s three year old elementary facility to collect information on that facility. As part
of the tour, they interview the principal and maintenance director to collect feedback on
the positive and negative attributes of the new elementary school.
The question then arises without input from educators: “How did the planning of
Nine result in a facility that is successful at meeting the needs of faculty, staff, students,
and the community?” The answer to this question is likely to be found in the strength of
the architectural firm that is hired to complete the project. The firm has been in
continuous partnership for over eighty-years. With six offices in three states, the firm has
a wealth of experience in the design of public schools. The firm has noted expertise in
facility master planning, space programming, and educational planning (Architectural
Firm Documentation 9, 2006). The firm’s success is supported by the number of award

195
winning educational facilities throughout Pennsylvania, Ohio, and Virginia (Business
Profile 9, 2005). The firm is noted for designing and constructing public and private
schools, hospitals, universities, museums and cultural facilities, as well as significant
projects for local and state governmental institutions (Business Profile 9, 2005,
Architectural Firm Documentation 9, 2006). As a result of a building tour and structured
interviews, it is apparent that the facility is specifically designed to be a middle school for
urban children. Middle school principles and methods of instruction supported by the
National Middle School Association (NMSA, 2006) are embedded in the overall design
of the building and arrangement of spaces within the facility. Being aligned with those
same beliefs, the principal’s assignment of educators within the facility, the policies,
programs, and procedures developed to manage teachers and students during the school
day, and the curriculum, all emphasize a strong belief in the same principles and methods
of instruction supported by the National Middle School Association. Evidence for
consistency in the beliefs of the architect and school district administration can be found
in the fact that on the survey in phase one of this study, 100% of the educators at school
nine indicate that the facility is utilized as it is intended to be by the designers, and they
rate architectural acuity as the domain of planning which has the second greatest impact
on the final design of the facility. The only domain rated higher in terms of its impact on
the final design of the facility is economics. In addition, during structured interviews, all
of the educators that state they have no input on the design of the facility also indicate
satisfaction with their instructional spaces (Interviews 9-2, 9-4, 9-5, 9-6, 9-7, 2006).
At the same time that educators report a high degree to which their school
building contributes to a shared sense of purpose and a focus on what is important for

196
students, they report that within the school and community there is a low degree of shared
sense of purpose and a focus on what is important for students. Out of the fifteen schools
that participate in the study, only three schools report a lower mean on this measure (see
table 13). During structured interviews, it is revealed that this low score is likely due to
events which occur after the facility opens, rather than during the design phase. During
structured interviews, all of the educators who are present in 2002 when the building
opens mark it as a positive year. The principal opens a new school, with a new
curriculum, and with sixteen new teachers that the principal is personally responsible for
hiring. In over half of the structured interviews and in discussions with the head
custodian and cook, the principal is described as the reason for the success of the school,
especially during their first year in operation (Interview s 9-1, 9-3, 9-5, 9-7, 2006). The
mission, vision, and success of the school during its first year in operation wins the
principal and the staff recognition and an award from a well recognized organization of
school administrators (Local Newspaper 9, 2002). The school is touted nationally as an
urban success story. After one year in operation, attendance goes up, test scores are up,
and morale is high. The principal is quoted in the local newspaper to say: “In just a short
period of time with a brand new teaching staff we have had a phenomenal amount of
achievement. Everyone looked at us and said the students couldn't do it, but they can and
we've proven it” (Locale Newspaper 9, 2003).
Unfortunately, only two years after the building opens, fiscal problems resurface
in the school district. In August 2004, the State Auditor General reports that the district
has experienced a $556,000 shortfall three years earlier, and that by June of 2003, it
mushrooms to a $1.9 million deficit (Local Newspaper 9, 2005, State Auditor General

197
Report 9, 2004). The Auditor General reports that the school district starts the 2003/04
school year, with a $1.5 million deficit (Local Newspaper 9, 2004, State Auditor General
Report 9, 2004). The report also states that the school district fails to stay within state
budgetary limitations “in nearly all expenditure categories” (State Auditor General
Report 9, 2004). In particular, the district is cited for budgeted monies that are exceeded
for furniture and fixture. The district also has some state funding partially rescinded for
the placement of four employees on the payroll at professional salaries that are not
properly certified. Finally, the school district is cited due to the fact that the records for
the high school and middle school student accounts are “completely disorganized”.
Compounding the financial problems is a decline in enrollment, a decrease in
property values, and high fixed operating costs. And even though in 2000, the school
district does, in part, justify the need for a new middle school based on enrollment, by
2004, the school district begins to lose students. During the four year period from the
time planning school nine begins until the time fiscal problems surface in 2004, the small
district loses 93 students. This is a 6% decline in enrollment (PDE Projections, 2006).
Two years later, the district loses a total of 167 studnets, which is more than a 10%
decrease in enrollment. By the 2014/2015 school year, PDE (2006) estimates that the
total district enrollment will be down to 940 students K-12, a 58% decrease from current
enrollments (PDE Projections, 2006). During the aforementioned same year, there is
only expected to be 194 students enrolled in the middle school. That is a 40% decrease
from current enrollment and 43% under the rated capacity of the facility (PDE
Projections, 2006).
As a result of poor fiscal management and decreased enrollment, both staff and

198
programs have been cut at school nine. In August of 2005, less than a month before
school opens, the school district directs the middle school principal to release two
creative arts teachers and close the writing lab. The result which ensues follows that
class sizes in art, technology education, family and consuner science, physical education,
and the library increase to over 32 students per class, and, along with the writing lab, the
foreign language program is also cut from the curriculum. In addition, teaching positions
on the core academic teams vacant by retirements are not being filled. To fill in these
gaps, teachers are assigned to teach across the grade levels. This move creates a
substancial disruption in the middle school’s team approach to which the school district
prescribes and that two years earlier helps the school achieve national recognition
(Interview 9-2, 2006).
In both structured interviews and in local newspaper articles, it is evident that
after the operation of the first school year, feelings of success are high. Educators and the
community are proud that an economically distressed school district finds the means to
build their students a brand new middle school that not only increases attendance and
standardized test scores, but also provides a safe and secure place where students can be
encouraged to choose a lifestyle free from crime, drugs, gangs and violence (Structured
Interview 9-2, 2006, Building Tour, 2006, Local Newspaper Article, 2006). Less than
two years later, structured interviews and local newspaper articles evidence frustration
and anger. Poor fiscal management, a decline in enrollment, a decrease in property
values, and high fixed operating costs proceed to quickly erode human resources,
academic programs, teaching matreials, and the morale (Structured Interview 9-1, 9-2, 9-
3 9-5, 9-6, 2006, Building Tour, 2006, Local Newspaper Article, 2006). When the

199
quantitative results are examined in light of the qualitative results, it is surprising that
teachers responses to questions with regard to the educational vision are not lower.
Findings of School Nine
Does School Nine have an Articulated Educational Vision?
On the quantitative survey, educators at school nine indicate a low degree to
which there is a shared sense of purpose and a focus on what is important for students in
the school and community. There are only three schools out of the fifteen that participate
in the study which were lower (see table 13). However, the case study indicates that a far
more complicated set of dynamics are work in the school district where school nine
resides. The low quantitative scores simply cannot be explained by the presence or
absence of an educational vision. Although the planning of school nine involves very
few individuals, with limited input from building level administrators, and no input from
students, parents, or the community, it is designed and constructed in well recognized
middle school philosophy. That same philosophy and a set of instructional practices are
consistent with the vision of the middle school principal and faculty. Once in the facility,
educators quickly learn that the design of their school can be utilized to assist them in the
pursuit of their mission. This is evidenced in structured interviews, the building tour, and
by national recognition that the educators receive for their success. Given the level of
recognition that the school receives after its first year in operation, it is not likely that an
absence of an educational vision is the reason for the low mean scores on the survey.
Stuctured interviews reveal that it is an inability to sustain a well articulated vision that
causes these scores. The survey results from school nine may have been very different if
the survey was conducted in June of 2003, at the end of the first school year in operation.

200
By all indications, school nine has a sound educational vision. Unfortunately, the school
district does not have the financial stability to sustain their vision and it has not yet
reformulated their vision to address the current reality of the environment.
Is School Nine a Physical Representation of the School District’s Educational Vision?
When educators at school nine are asked to respond to the statement: “The design
and appearance of this facility conveys the educational vision of the school”, their mean
response was the fourth highest of the fifteen schools (see table 41, statement 23). At the
same time, when asked to respond to the statement: “Within this school and community
there is a shared sense of purpose and a focus on what is important for students”, they
have the fourth lowest (see table 39). As established earlier, it is not that the school
district does not have an educational vision or that they lack the expertise, experience, or
the facilities to achieve that vision. By all indications, school nine is a physical
representation of a sound educational vision, and by all indications this educational vision
is shared by the architect and central office administrators when the building is designed,
and also by the principal and teachers when the building opens. Unfortunately, the
school district does not have the financial stability to sustain the vision for which school
nine is constructed. In addition, they have not reformulated a new vision to address the
current reality of the environment.
Do the Design Professionals and Educators who Planned School Nine Manage Variables
within and Across the Six Domains of Planning when They Design the Facility?
Quantitatively, an analysis of the survey reveals that when educators at school
nine are asked to respond to the statement: “Those responsible for planning and
constructing this facility understood the interaction of economic, political, and social

201
forces at work as well as the needs of teachers and students”, their mean response is the
third highest of all fifteen schools that participate in the survey (see table 40).
As evidenced in structured interviews, public documents filed with the
Pennsylvania Department of Education, a tour of the facility, and a review of artifacts
from the school district, those responsible for planning school nine have no challenges to
their handling of the design and construction of the new middle school. With the
recognition that the school district receives after the first year the building is in operation,
those responsible for planning school nine does an exceptional job in the management of
architectural acuity, culture, and pedagogy domains. In addition, it appears that the
district does a satisfactory job dealing with the domain of politics and in dealing with the
interaction of the qualitative and quantitative variables across the six domains of
planning. On the other hand, although there were no questions raised at the time of
planning, design, and construction with regard to the domains of demographics and
economics, shortsighted planning results in the school district’s inability to sustain their
educational vision. Evidence of these findings, as arranged by domains, is as follows:
Culture. In a community that is in economic distress where on any given day,
gangs, violence, alcoholism, drug addiction, teen pregnancy, and hopelessness can keep
students from attending school, consideration of culture is critical. By building the new
elementary and middle schools outside of the economically distressed neighborhoods,
educators and district officials are better able to address the health and safety issues of the
children, and as a result, better educate their students. Both the location and design of
school nine promote feelings of safety and belongingness. The educators at school nine

202
develop programs and procedures that, in conjunction with the facility, address the social
and cultural needs of their students while at the same time address academics.
Demographics. The size, composition, and needs of the student body are taken
into consideration during the design of school nine. Beyond the fact that the facility
adequately handles the size of the population, it is designed to assist with the safe and
efficient management of a student population where the threat of violence is a daily
reality. Unfortunately, the district certainly takes a gamble when they project that the
success of the new elementary school will continue to increase in enrollment if they
construct a new middle school. With just the opposite occurring, the school district is not
prepared to deal with the problems associated with a decrease in enrollment. Although
the justification to build school nine is based, in part, on an expected increase in
enrollment, a review of the enrollment figures in the school district indicates to those
responsible for planning school nine that, at best, student enrollment only experiences a
minimal increase. Also as important, there are clear indications that enrollment can
decline.
Economics. Nine is located in a school district with a history of poor fiscal
management (Local Newspaper 9, 2005). In the early 1990s, the district asks the state to
take over its operation because of continued economic troubles (Local Newspaper 9,
2005). By the end of the 1990s, the school district is recognized for reversing its trend of
poor fiscal management. Unfortunately, economic trouble resurfaces in August 2004,
when the State Auditor General reports that the district has a $1.9 million deficit. As a
result of poor fiscal management, a decline in enrollment, a decrease in property values,
and high fixed operating costs, the district finds itself financially incapable of sustaining

203
the school district’s educational vision and mission at the middle school. Given the fact
that the junior/senior high school is crowded and over seventy-five years old makes
modernization and renovations inevitable. However, in hindsight, the decision to
construct a new $8.9 million middle school may not have been the best way to invest the
district’s very limited resources
Politics. The relationships between educators, elected officials, parents,
community groups, and private citizens which lead up to the planning of school nine, do
not present any challenges to those responsible for planning the facility. The architect
and superintendent develop the educational specifications, and along with a board
member, develops the design for school nine. Whether by design or due to the fact that
the community contains a high number of people who are disenfranchised, parents,
students, community groups, and private citizens are not involved in the planning
process. At the hearing of Act 34, only six of the nine members of the board of school
directors are present, and no one from the teaching staff, administration, or community
(outside of those responsible for running the hearing) enter comments into the public
record.
Pedagogy. The facility is specifically designed to be a middle school for urban
children. Middle school principles and methods of instruction supported by the National
Middle School Association (NMSA, 2006) are embedded into the overall design of the
building, the arrangement of spaces within the facility, and reflect in the assignment of
educators within those spaces, the curriculum, and by the policies, programs, and
procedures that are developed to manage teachers and students throughout the school
day. Academically and socially, after the first year in operation, the school is recognized

204
as having met the needs of students. This is evidenced by a rise in student scores on
standardized assessments and by the recognition of the school’s success by a national
organization of school administrators. At the time of the survey, middle school principles
and methods of instruction around which so much is designed are severely limited by a
reduction in staff and a lack of funding for programs.
Architectural acuity. The educator’s mean response to the degree at which school
nine meets the needs of faculty, staff, students and the community is the fifth highest of
the fifteen schools which respond to the question. In addition, the educators at school
nine rate architectural acuity as the second highest domain of planning to impact the final
design of the facility. The reason for these high means is likely to be found in the
strength of the architectural firm that is hired to complete the project. The firm has noted
expertise in school construction, facility master planning, space programming, and
educational planning (Architectural Firm Documentation 9, 2006). Both the architectural
firm and school district administration evidence consistent beliefs in the core principles
and instructional practices that are recommended by the National Middle School
Association. In conjunction with these beliefs, the architectural firm has the experience
and expertise to construct a facility that is a physical representation of these beliefs. As a
result, 100% of the educators indicate on the survey that the facility is being utilized as it
is intended to be by the designers, and also, 100% of the teachers who participate in
structured interviews express satisfaction with the layout of the building and their specific
instructional space. This all includes classroom teachers, a physical education teacher,
the librarian, and teachers working in a lab setting (Interviews 9-1, 9-3, 9-5, 9-7, 2006).

205
Interaction of domains. Quantitatively, an analysis of the survey reveals that
when educators at school nine are asked to respond to the statement: “Those responsible
for planning and constructing this facility understood the interaction of economic,
political, and social forces at work as well as the needs of teachers and students”, their
mean response is the third highest of all fifteen schools that participate in the survey. By
the recognition received after the first year in operation, those responsible for planning
school nine do an exceptional job in the management of architectural acuity, culture, and
pedagogy domains. In addition, it appears that the district does a satisfactory job in
dealing with the domain of politics and with the interaction of the qualitative and
quantitative variables across domains. However, as stated several times earlier, the
district’s shortsighted planning in the domains of economics and demographics leave the
district with a large debt service, a decline in enrollment, a dwindling tax base, and high
fixed operating expenditures.
Does School Nine Meet the Needs of the Stakeholders?
The educators at school nine demonstrate the expertise, experience, and the
facility necessary to achieve their vision. This is evidenced by the national recognition
that is received by the faculty and staff for an increase in attendance and standardized test
scores after only one year in operation. During a tour of the facility and structured
interviews, it was evident that the facility is specifically designed to be a middle school
for urban children. Middle school principles and methods of instruction supported by the
National Middle School Association (NMSA, 2006) are held common by the central
office administration, architectural firm, and the faculty and staff of the facility. These
beliefs are embedded into the overall design of the building and the arrangement of

206
spaces within the facility, and how these spaces are used to academically, socially, and
culturally address the needs of middle school-aged children in the school district.
Beyond the design, the location of the new middle school outside of economically
distressed neighborhoods results in educators being better able to address the health and
safety needs of their students.
On the quantitative survey in phase one of this study, when the educators at
school nine are asked to respond to the statement: “This school meets the needs of
faculty, staff, students, and the community”, their mean response is the fourth highest of
the fifteen schools that participate in the study (see table 13).
Table 39
Tier One and Two Selection Data for Nine
School 9 Mean of Vision (4) 4.636 Mean of Physical Representation (5) 5.091 Year of Opening 9/3/2002 Count Percent Possible Participants 28 Total Participants 11 39.29% Involved in Planning (1) Yes 3 30.00% No 7 70.00% Total 10 100.00% Years Spent in Facility (2) 0 to 2 2 3.64% 3 to 4 8 14.55% 5 to 6 1 1.82% 7 to 8 0 0.00% 9 to 10 0 0.00% 10+ 0 0.00% Total 11 20.00% Facility Utilized As Designed (3) Yes 11.00 100.00% No 0.00 0.00% Total 11.00 100.00%

207
Table 40
Mean Ranked Responses of School Nine
Rank Order of Degree to Which Planning of Facility Required Knowledge of Domains
Mean of Responses
Rank Order of Degree to Which Facility Planners Understood Domain
Mean of Responses
Rank Order of Degree of Impact on Design of Facility
Mean of Responses
Economics 5.636 Economics 5.091 Demographics 5.364 Politics 5.818 Culture 5.182 Culture 5.455
Pedagogy 5.818 Architectural Acuity 5.364 Politics 5.545
Interaction 5.818 Politics 5.455 Pedagogy 5.545 Culture 5.818 Pedagogy 5.455 Interaction 5.636
Demographics 5.909 Interaction 5.545 Architectural Acuity 5.636
Architectural Acuity 5.909 Demographics 5.545 Economics 5.818

208
Table 41
Summary of Mean Responses from Nine
Survey Statement n Mean SD SE 4 11 4.636 1.6293 0.4912 5 11 5.091 1.5136 0.4564 6 11 4.636 0.9244 0.2787 7 11 4.636 1.5015 0.4527 8 11 4.818 1.3280 0.4004 9 11 4.727 1.4206 0.4283
10 11 4.636 1.5015 0.4527 11 11 4.545 1.3685 0.4126 12 11 4.545 0.9342 0.2817 13 11 4.364 1.4334 0.4322 14 11 6.636 0.6742 0.2033 15 11 4.545 2.0181 0.6085 16 11 4.636 1.8586 0.5604 17 11 4.182 1.6624 0.5012 18 11 5.909 1.7003 0.5126 19 11 6.000 1.0954 0.3303 20 11 5.182 1.0787 0.3252 21 11 5.182 0.9816 0.2960 22 11 5.636 1.0269 0.3096 23 11 6.273 0.7862 0.2371 24 11 5.909 0.9439 0.2846 25 11 5.545 1.6348 0.4929 26 11 5.364 1.5015 0.4527 27 11 5.818 0.8739 0.2635 28 11 5.455 1.6348 0.4929 29 11 5.545 1.5076 0.4545 30 11 5.818 0.8739 0.2635 31 11 5.182 1.5374 0.4635 32 11 5.455 1.5076 0.4545 33 11 5.364 1.5015 0.4527 34 11 6.182 0.6030 0.1818 35 11 5.636 0.8090 0.2439 36 11 5.091 1.7581 0.5301 37 11 5.818 0.9816 0.2960 38 11 5.818 0.9816 0.2960 39 11 5.455 1.5076 0.4545 40 11 5.545 1.2933 0.3900 41 11 5.909 0.8312 0.2506 42 11 5.364 1.3618 0.4106 43 11 5.636 0.8090 0.2439 44 11 5.818 1.4709 0.4435 45 11 6.000 1.1832 0.3568 46 11 6.182 0.7508 0.2264 47 11 5.364 1.6293 0.4912 48 11 5.818 0.8739 0.2635 49 11 5.545 1.2933 0.3900 50 11 5.636 1.1201 0.3377

209
School Ten
Qualitative Data
School number 10 (ten) is the only middle school in a school district classified as
“small town” (NCES, 2004). In total, the 123 square mile school district educates 2,218
students and serves a community of 16,540 residents (Standard & Poor’s, 2005). School
ten has a student population of 558 children served by the full time equivalent of 32
teachers (Great Schools, 2004). School ten is chosen as one of the four purposefully
selected sites for a comparative case study from the population of fifteen schools
surveyed as a result for having the lowest mean responses at the degree to which
educators feel that within in school and community there is a shared sense of purpose and
a focus on what is important for students, and also the degree to which the educators
believed that the design of their facility contributes to a shared sense of purpose and a
focus on what is important for students (see table 42).
School ten is a 143,000 square foot middle school that opens in 2002 (PDE
Construction Report, 2002). The facility is constructed on a 101 acre campus adjacent
and connected to the school district’s high school. The 96,000 square foot high school is
constructed in 1968 (PlanCon, 1999). Housing grades six, seven, and eight, the facility is
designed with three sections. The first section contains the following: 20 academic
classrooms, 4 science labs, 3 computer labs, the library, accommodations for the
administration, counselors, and support staff, instructional planning centers for teachers,
and a cafeteria with a seating capacity of 200. The second section of the facility contains
the art, family and consumer science, and general music rooms, an industrial arts area,
and the school’s band and choral rooms. In addition, this section also contains a 1,300

210
seat auditorium. The third section that adjoins to the high school contains the athletic
center which houses a full size competitive gymnasium with seating for 957 spectators, a
wrestling room, weight room, locker room facilities, and offices. Both the athletic center
and performing arts areas are shared by students in both the high school and middle
school.
According to the Pennsylvania Department of Education Division of School
Facilities (PDE DSF), the cost of site acquisition, structure, movable fixtures and
equipment for school ten equals $16,206,428 (PDE DSF, 2002). PDE DSF calculates the
per square foot cost of an educational facility by adding the cost of the structure,
architects fee, and sewage disposal, and then divides this by the architectural area in
square feet. PDE DSF calculates the per square foot cost of school ten to be $94.16 (PDE
DSF, 2002). In the year that this facility is bid upon, $94.16 per square foot is deemed a
highly competitive price. Of the twenty-seven school districts which seek reimbursement
from the Pennsylvania Department of Education in 1999 for the construction or
renovation of educational facilities, only seven have a per square foot cost of less than
$100.00 (PDE Construction Report, 1999).
The student demographics of school ten reveal a student body which is
homogenous, academically borderline, and comes from middle and lower middle class
homes. Slightly over 98.0% of the student body is Caucasian, 1.0 % is African American
and less than 1.0% is Asian/Pacific Islander, Hispanic, and American Indian/Alaskan
National (Standard & Poor’s, 2004). In 2005, while barely attaining adequate yearly
progress in all areas defined by the federal government’s No Child Left Behind Act of
2002, 58.8% of the eighth grade students test proficient in reading and 60% of the eighth

211
grade students test proficient in math (Standard & Poor’s, 2005). In both reading and
math, the school’s standardized test scores are below the state average. That same year,
the school district posts a graduation rate of 89.8% (Standard & Poor’s, 2004). The
median household income in the school district is $57,711.00 and the median home value
is $75,811.00 (Standard & Poor’s, 2004). However, this mean is somewhat misleading.
Seventeen and a half percent of the school district’s population have an annual household
income of less than $15,000 and an additional 22.7% have annual incomes of less than
$30,000 (Standard & Poor’s, 2004). The mean household income in the school district is
increased by 35% of the population making more than $50,000.00 (Standard & Poor’s,
2004). According to the Pennsylvania Department of Education, 27.8% of the student
body is from low income households (PDE Stats, 2004).
As reported by Standard and Poor’s (2004), the school district in which school ten
resides has an average operating expenditure of $7,864.00 per student. The $7,864.00 per
child represents money spent on instruction, support services, and non-instructional
services, among other day-to-day purposes, from the general fund, special revenue fund,
food services, child care, non-major fund, and other enterprise funds. Operating
expenditures include salaries and benefits, supplies and materials, and purchased
services. Operating expenditures exclude capital and debt-related expenditures, adult
education, community service, as well as trust and agency funds, and internal service
funds. Of the $7,864.00 per child operating expenditures, $5,357.00 is spent on
instruction and instructional support (Standard & Poor’s, 2004). In this same year, the
school district carries a debt with expenditures that equal $18.00 per student and capital
expenditures of $194.00 per student (Standard & Poor’s, 2004).

212
The school district in which school ten resides is part of the coal region in the
Appalachian Mountains. The town is located in a narrow valley whose slopes are made
to appear steeper by huge culm banks which spill down from the top of the ridges. Along
Main Street, turn of the century Victorian houses with stain glass windows and old brick
banks with marble steps are reminiscent of the wealth that comes from the anthracite coal
mines. Since the mid 1960s, the mines and mills have been downsizing and closing. The
days of a booming industrial based economy are in the past. The Victorian train station
that once welcomed business men and industrialists to the town has not seen train service
in twenty-five years, and the homes and buildings along Main Street are in various levels
of disrepair. Neighborhood streets which run back and forth against the slope of the
Appalachian ridges begin their ascent one block off of Main Street. As they wind up the
ridges, each block is nearly a full roof top hire than the block before. To gain perspective
on the slope, one need not look further than the school campus. The school sits on a 74.1
acre terrace. The north/south change in slope over the very long and narrow terrace is 25
feet. However, the east/west change in slope over the whole 101 acre campus is 1,100
feet (PlanCon 10, 1999). Standing on top of campus one can see rows of houses which
step down the ridges to Main Street below.
At the time planning for new facilities begin, elementary students attend one of
three K-6 schools. The elementary schools open in 1951, 1959, and 1979. The high
school students attend classes at the school district’s only high school, which is
constructed in 1968 (PlanCon 10, 1999). The seventh and eighth grade students are
housed in a 66,000 square foot junior high school. Originally built as a high school
facility, the building is just short of its seventieth birthday when discussions with regard

213
to a new middle school begin. Though renovations and additions are made to the facility
in 1957 and 1968, it is well understood that the junior high school is short on space and in
need of extensive repair and renovations. Programmatically, the building is over
crowded. Several classrooms, the computer lab, and the library are of insufficient size.
The gym does not meet proper height requirements and two temporary classrooms that
are placed adjacent to the school, have been in use for over twenty-five years. Special
education students are bused out of the school district for classes. Structurally, the
existing roof needs a replacement or to receive an upgrade. The steel framed, non-
insulated windows need replacements. All of the exterior doors need replacements and
due to the fact that the interior doors do not meet the appropriate fire rating, they also
need to be changed. The fire alarm system needs to receive an upgrade. The building
does not meet any of the requirements in the American with Disabilities Act of 1990 for
handicapped accessibility. And all amenities, from the lockers to the kitchen equipment,
need to be repaired, refurbished, or replaced altogether. Mechanically, the HVAC
systems need full replacements. The electric system is wholly inadequate for the needs
of the teachers and students. Aesthetically, the exterior masonry is deteriorating and is in
need of cleaning, repair, and waterproofing. On the interior of the building, walls need
repair and paint; throughout the building, all of the window treatments also need
replacements (PlanCon 10, 1999). Even though the facility is in need of extensive repairs
and renovations, it is important to understand that a deep connection exists between long-
time residents of the community and this school building. This is evidenced during
structured interviews when teachers who worked in the old school discuss building with
an air reverence. One teacher, who has had three generations of her family attend the

214
school, comments that “as old and broken down as it was, it was still part of the family”
(Interview 10-1, 2006). This familial connection is also evident in 2002 when the
building closes it doors for the last time. A last day assembly reported in the local
newspaper (2002) draws generations of townspeople and educators together to reminisce
over all that the nearly seventy-five year old structure has witnessed.
In addition to concerns with the condition of the junior high school, school district
officials also have concerns that at the elementary schools and the high school does not
have adequate facilities to deal with class enrollments and expanding programs. The
district identifies expanding programs in the areas of special education, advanced science
and math classes, computer and technology classes, and for gifted honors classes
(PlanCon 10, 1999). In order to address the condition of the junior high school, district-
wide enrollments, and the need to expand programs, the school district contracted with an
architectural firm to complete a feasibility study. In the spring of 1997, a “project
launch” is held during which representatives of the school district and architectural firm
meet to discuss the school district’s needs (PlanCon 10, 1999). According to PlanCon
documents (1999) on file with the Pennsylvania Department of Education, this meeting
focuses on needs, expectations, and concerns with relation to the school district’s
educational facilities. The group prioritizes needs and establishes a time to meet with
representatives of the faculty for the purpose of collecting direct input from teachers. In
addition, the entire staff (K-12) is given a survey that focuses on the educational program
and facility needs for the district. Concurrent to the staff survey, the administration
collects information from the community with regard to their concerns and beliefs about
educational program and facilities (PlanCon 10, 1999). Using the information gathered,

215
educational specifications are developed and presented to the school board for review.
Based upon these specifications, the school board is presented with four facility options
to consider. The four options include: (1) renovations and additions to the junior high
school along with renovations and additions to the high school, (2) building a new
seventh and eighth grade junior high school on the senior high school site, and to
complete renovations and additions to the high school itself, (3) build a new senior high
school on a different site and move grades six, seven, and eight into the high school to
create a middle school, and (4) realign the elementary schools into K-5 buildings, build a
new sixth, seventh, and eighth grade middle school adjacent to the senior high school,
and complete renovations and additions to the high school.
In December of 1997, the board voted 8-0, with one member absent, to proceed
with plans to build a new sixth, seventh, and eighth grade middle school adjacent to the
senior high school, to realign the elementary schools as K-5, and complete renovations to
the high school. In anticipation of the project and due to a favorable economic climate,
the school district issues two sets of general obligation bonds. The first bonds are issued
at the end of 1997 in the amount of $5 million and the second set of bonds is issued in
1998 for $10 million dollars. This money is deposited into interest-bearing accounts to
await construction of the new facility (Local Newspaper 10, 1999). In February of 1998,
the board votes to move ahead with a design for a new middle school based on the
educational specifications that are developed by school district administrators and the
architect (PlanCon 10, 1999). The educational specifications requires the construction of
a 143,000 square foot building.
During the time the school district considers its options, steady resentment and

216
opposition against the project grows in the community (Structured Interview 9-1, 2006).
When the board begins to consider its options it is reported in the local newspaper that
renovations to the old junior high school will cost up to $8.6 million, while building a
brand new building for grades seven and eight will cost taxpayers up to $9.5 million
(Local Newspaper 10, 1997). However, by the time of the Act 34 hearing in April of
1998, it is well known in the community that the new facility, as designed, may cost up to
$18 million (Local Newspaper, 1998). All of this results in a tremendous amount of
controversy surrounding the project. Although the Board of School Directors votes 8-0
to proceed with the exploration of plans to build a new middle school, the Board of
School Directors and the community are now deeply divided over the project. The
increased cost of the project is described to the public as being the result of the fact that
the facility would house three grades, not two, and also due to the fact that the facility
includes “many amenities” (Local Newspaper 10, 1997). In addition, the project is
upgraded to include more classrooms, a gym bigger than the high school one, and an
auditorium. The building is planned to contain the following: new team and locker
rooms that connect to the high school, four science labs, two art classrooms, large group
instruction rooms, a computer room, science and industrial arts rooms, a three-level
elevator, and a technology education center.
Nearly 250 people attend an Act 34 hearing held in the senior high school
cafeteria to solicit public input on the project. Board members, the administration, and
the architect are questioned on a range of issues which include: reasons for building a
new middle school rather than renovating the junior high school, the impact of taxes on
small businesses and farmers, whether the project will use union workers, what the

217
accrued bill to date for the architectural firm totals, problems with having sixth through
twelfth grade students in the same building, and their rationale for wanting to hire a
construction management company over a clerk of the works. The testimony is heated
and emotional. One woman exclaims to thunderous applause, “How can a town afford an
18 million dollar middle school when we can’t even afford to give our graduates a decent
job!” (Local Newspaper 10, 1997, PlanCon 10, 1999). Another citizen with equal
support from the audience advises the Board of School Directors by saying, “I suggest
you stay away from the frills and look for another architect!'” (Local Newspaper 10,
1997).
Two of the most influential citizens to enter comments into the public record are
the president and CEO of the largest employer in the school district and the local State
Representative. In a letter to the board read into the record from the president and CEO
of the largest employer in the school district, the CEO lashes out against the price tag of
the project and expresses his concern over the tax consequences. The local State
Representative issues a five-page statement that is presented by one of his staff members
which challenges the Board of School Directors to make the “fiscally responsible
decision” by turning away from the project (PlanCon 10, 1999). The Representative who
could not be present due to the fact that he was in the state capital “fighting for tax
reform” wants to let the citizenry know that: “The age of a school building did not play
any role whatsoever in adequately preparing a child for college” (PlanCon 10, 1999). In
addition, the Representative’s aide announces that the Representative will be “drafting
legislation to encourage school districts to renovate existing buildings rather than replace
them” (PlanCon 10, 1999).

218
In all, thirty five people speak out against the Board’s plans for over two hours.
Speakers include bankers, lawyers, elected officials, small business men and individual
citizens. Not one person rises to speak in favor of the project. In the PlanCon file
(1999), the original reviewer for the Pennsylvania Department of Education attaches a
handwritten note to the school district’s initial application for reimbursement which
states: “It seems everybody is against the project.”
A review of the transcripts from the Act 34 hearing make it clear that the major
point of contention within the community and among the school directors is the cost of
the project. As a result, it is not surprising that when educators are asked with regard to
the degree at which each of the six domains of planning impact the final design of the
school, economics is the ranked as highest (see table 43). A further review of the
PlanCon documents indicate that the cost of the facility is not the result of the need for
expensive site work, environmental issues, unique design features, special building
materials, or the economy. The cost is due to the size of the project (PlanCon, 1999).
The 143,000 square foot facility is 2.16 times larger than the old junior high school and
1.48 times larger than the school district’s 96,000 square foot high school building.
Two of the major areas which contribute to the size of the project are the athletic
center and performing arts areas. Both of these spaces are sandwiched between the high
school and middle school, and are joined to both facilities. According to district
literature, the athletic center is a “state-of-the art facility” that includes an 11,200 square
foot, 957-seat gymnasium. Adjacent to the gym is an athletic trainer’s office, wrestling
room, weight room, boys and girls locker rooms, and team rooms (District Literature 10,
2006). District literature boasts that: “Spectators entering the gymnasium entrance will

219
be impressed with the patterned terrazzo foyer, built-in trophy case, the two digital
scoreboards, and the two team logos painted on the hardwood gym floor” (District
Literature 10, 2006). The nearly 15,000 square feet performing arts center includes a
1,300 seat auditorium with a 2,710 square foot stage. Adjacent to the auditorium are
band and chorus rooms, each in excess of 1,800 square feet, a general music classroom,
offices, practice rooms, and instrument storage. Based on the values reported in PlanCon
(1999) and confirmed during a building tour (2006), the halls, vestibules, lobbies,
mechanical areas, and the athletic center and performing arts areas conservatively contain
over 32,000 square feet. This represents forty-two percent of the difference between the
size of the old junior high school and the new middle school. PDE reports that the cost of
per square foot of school ten is $94.16 (PDE Construction Costs 10, 2002). Using these
numbers, the athletic center and performing arts areas are constructed at a cost of over $3
million dollars.
Over the six months that follow the Act 34 hearing, the board and community
remain deeply divided over the project. During this time period, the Board of School
directors, knowing that they are still not obligated to proceed, place the project out on
bid. In the spring of 1999, when the bids open, the project comes in under budget (Local
Newspaper 10, 1999). Regardless of this fact, the final decision to proceed with the
project does not come until the fall of 1999. In June of this same year, the school
district’s budget narrowly passes on a 5-4 vote, with much of the controversy swinging
around the financing of the project (Local Newspaper 10, 1999). Finally, with the threat
of having to re-bid the project looming, the Board of School Directors call a special
meeting in September of 1999 for the sole purpose of making a final decision. After two

220
years and much debate, the board votes 6-3 in favor of proceeding with construction
(Local Newspaper 10, 1999, PlanCon 10, 1999).
Although it is a “rough battle”, everyone in the district hopes that “things would
start to get back to normal” (Interview 4-10, 2006). However, these hopes are dashed
when the Superintendent of Schools, who has been with the district for thirty-six years,
shocks the Board of School Directors and community by announcing that he plans to
retire, even though he still has four years left on his five year contract. The school board
president is quoted in the local paper to say the following: “He dropped a bomb on us. I
fully expected him to stay through the building project then we would gear up to replace
him” (Local Newspaper 10, 1999). By September of this aforementioned school year, the
assistant superintendent is made superintendent, and the newly hired high school
principal becomes the acting assistant superintendent, appointed as the central office
administrator in charge of the project. In addition to central office changes, over the
course of the next five years, the middle school houses three different principals.
Entering onto the campus, the flow of traffic for the middle school goes around
the back and down the length of the complex. Driving behind the facility, tucked
between the back of the building and the slope rising immediately on the opposite side of
the road, one gets a sense of just how big a 234,000 square foot complex really is. The
facility sits on a 74.5 acre terrace. With the football stadium and main drive in front of
the complex and a ridge immediately behind the school, the building at its widest point is
the width of seven classrooms and three hallways. This is less than 250 feet wide.
Conservatively, even with sections of the high school having two floors, the complex is
600 to 750 feet long. Although the roof lines vary due to libraries, athletic facilities, and

221
classroom wings, the best way to imagine the complex is like two shoe boxes end to end.
This is not to indicate that the exterior of the building is esthetically unpleasing. Those
responsible for planning school ten make an attempt to match the style of the 1968 high
school with the 2000 middle school. The brick, block, trim, changes in roof lines, and
matching enameled roofed porticos at major entrances give the appearance that the two
sections of building are closer in age than thirty-two years.
The main entrance of the middle school is on the far end of the building. With
bright colors, a curved portico, and the name of the building prominently displayed, when
one faces the main entrance to the facility one would never realize the length of the
complex behind the brick facade. In interviews with two of the educators, they indicate
that is important to convey the feeling to the students that this was “their middle school”
and “not just an addition to the high school” (Interviews 10-5, 10-6, 2006). Upon
entering the school, distinct architectural features draw the eye across a funnel shaped
lobby and down a hall to the glass face of the 5,000 square foot library. To the right and
with a diagonal face to create one side of this funnel shaped lobby, the school office is
easily recognizable. Halls in the facility are offset so that the line of sight is never more
than six classrooms in length. The use of different materials, colors, and the painting of
stripes above the lockers give the interior of the building a custom appearance. The
interior of the facility is esthetically pleasing, so much so that the facility is showcased in
a national architectural digest (Architectural Firm Literature 10, 2006).
With the pleasing physical attributes of the facility, the question arises as to why
educators’ responses rank their school as the lowest of all fifteen participating schools
when it comes to the degree at which the facility contributes to a shared sense of purpose

222
and focus on what is important for students (see table 43). It may be postulated that the
battle which divides the community over the building of the school contributes to the low
score. However, when the educators are asked to respond to the degree at which the
design and appearance of the facility conveys the educational vision of the school, only
three schools in the sample have a lower mean response (see table 13). In addition, when
educators are asked the degree at which their school meets the needs of faculty, staff,
students, and the community, again, only three schools in the sample have a lower mean
response (see table 13).
In understanding these responses it is important to begin with the second criteria
that results in school ten’s selection for a comparative case study. Of the fifteen schools,
school ten has the lowest mean response when the educators are asked to respond to the
statement: “Within this school and community that it serves, there is a shared sense of
purpose and a focus on what is important for students (see table 13). Again, it is easily
postulated that the divisive nature of the project results in a low sense of shared purpose
and a focus on what is important for students. However, when the educators at school ten
are asked to respond to the statement: “This school has an educational vision”, with no
reference being made to the community, their mean response is the lowest of all fifteen
schools that participate in the study (see table 13).
As a result of structured interviews and the building tour, four themes arise that
likely contribute to the low mean scores outlined above. These four themes include: (1) a
lack of administrative consistency, (2) the facility is called a middle school and
demonstrates the design attributes of a middle school, yet practices outlined by the
National Middle School Association are not being followed, (3) the sixth grade staff

223
from the elementary schools and the seventh and eighth grade staff from the junior high
school do not bond into a single middle school faculty, (4) resentment exists among the
teachers who come from the old junior high school. These educators believe that their
school is treated like more of a wing of the high school rather than as having its own
separate identity.
During four of the six structured interviews, educators reflect on the fact that
since they have been in the old junior high building, they have had a succession of
administrators (Interviews 10-1, 10-2, 10-3, 10-4, 10-5, 2006). In total, from the time
discussions begin with regard to the construction of a new school through its second year
in operation, the faculty has been led by four different building level administrators and
three different central office administrators. The first principal left for a position in a
different district (Local Newspaper 1998). The second principal, who holds the position
during the critical first year of operation, is moved to an assistant elementary position
created by the Board of School Directors (Local Newspaper 10, 2002). The third
principal openly admits that he/she considers the position as a short term assignment
before retirement and then does so (Interview 10-5). And finally, the fourth, though
educators report positive professional growth under most recent principal’s guidance, the
current principal has only been in the position for less than two years. Educators,
especially classroom teachers, perceive the lack of continuity contributing to a lack of
focus and direction (Interviews 10-1, 10-2, 10-3, 10-4, 10-5, 2006).
The educational program at school ten cannot be classified as an elementary,
middle school, or as a junior high school program. School ten is the only school of the
four selected for case study that has had academic classrooms arranged by discipline

224
rather than interdisciplinary teams (Interview 10-1, 2006, Building Tour 6, 20060). In
the other three schools, other than science, teaching equipment and supplies unique to a
discipline, can easily be relocated to other spaces, and teachers are assigned to rooms
based on an interdisciplinary team. In the case of school ten, items such as maps and
graphing boards are more permanently integrated into the classroom design (Building
Tour 10, 2006). The seventh and eighth grade teachers who are interviewed consider this
as a positive attribute, but complain that the all of the subject areas can be grouped except
science. During one interview, a teacher states that one of the things that she likes about
the building is the fact that she is “in an area where the teachers all taught the same
subject” (Interview 10-1, 2006). This teacher’s concern with the building design resides
with the fact that the science rooms are spread throughout the building. A tour of the
building shows that the science rooms are not grouped by discipline, but distributed
throughout the building. A review of a building map makes it clear that the science
rooms are meant to be clustered in a set with four other classrooms. This design feature
is consistent with middle school instructional practices and is standard in the design of
the other four middle schools involved in the comparative case study. The rooms are
grouped this way for the purpose of teaming. If true departmentalization is the goal of
the architect and school district, clustering the science rooms together due to their unique
needs for water, disposal of waste, water, electric, gas, and storage is far easier and less
expensive. On the other hand, while the seventh and eighth grade teachers have a very
subject oriented approach based on their old junior high model, the sixth grade teachers
remain dedicated to an elementary model with an emphasis on teaching reading and math
skills (Structured Interview 10-1, 10-3, 2006, Building Tour, 2006). Beyond the

225
academic classes, all students in grades six, seven, and eight rotate through a collection of
exploratory classes. These classes, as well as the collection of rooms in which they are
taught, separate from the academic classrooms, and closely resemble a traditional middle
school model. Although the school district states the desire in PlanCon to move towards
a middle school philosophy, their efforts have been piecemeal. The fact that the seventh
and eighth grade teachers’ emphasis remains subject-centered, and that the sixth grade
teachers’ emphasis remains elementary-centered, demonstrates a lack of movement
towards a middle school model that is centered on the unique academic needs of young
adolescents.
The difference in philosophies between the teachers that come from the
elementary schools and the teachers that came from the junior high school creates a
distinct rift among the faculty. Though everyone is congenial, the seventh and eighth
grade teachers indicate that they have concerns that the sixth grade teachers are doing
things differently than they are (Interviews 10-1, 10-3, 2006). According to one of the
teachers who is interviewed, this is the first year that, “the sixth grade was made to follow
the same schedule as the seventh and eighth grade teachers “(Interviews 10-3, 2006).
Although the differences are never expressed in an antagonistic fashion, a real “us/them”
mentality is exhibited within the faculty.
Finally, there remains resentment among some of the teachers who come from
the old junior high school. These instructors express frustration due to the fact that they
feel their facility is treated more like a wing of the high school rather than as its own
school. Although everyone acknowledges that the junior high school was in desperate
need of remodeling, renovations, and additions, it is still their school. One teacher states:

226
“Sometimes we are like the poor step children to the high school” (Interview 10-3, 2006).
Another teacher makes the point that the athletic center is “named after the school
district” and not “named Ten’s Athletic Center” with which it was built. This teacher
continues to note that “the same goes for the auditorium” (Interview 10-3, 2006).
While the teachers indicate that there is a lack of a shared sense of purpose and a
focus on what is important for students within the school district and community, this
does not necessarily explain why the facility is rated by its educators as the lowest of all
fifteen schools that participate in the study when they respond to the statement: The
degree to which the facility contributes to a shared sense of purpose and focus on what is
important for students. Given the fact that the facility is designed with input from the
faculty and staff, teachers are allowed to select furnishings and fixtures for their rooms,
that there are distinctive academic, exploratory, and athletic sections, and the aesthetics
of the building are showcased in an architectural digest, a mean score this low may not be
expected when educators are asked to respond to this statement.
Structured interviews and a building tour indicate that the reason for
dissatisfaction with the building focuses on one central issue, the layout of the facility.
On the very first day that the new facility opens, students who are interviewed by a local
reporter state that they find the building to be “confusing” (Local Newspaper 10, 2002).
Although the students are excited and nervous about being in the new school, the initial
observations that the researcher made when first entering the building are almost identical
to the comments made by students when interviewed by the local newspaper reporter
(Local Newspaper, 2002).

227
In order to make an extremely long and narrow building more interesting and
visually appealing, the facility is designed with three distinct offsets. On the interior of
the building these offsets are set alongside the positioning of the 5,000 square foot library
in the middle of the facility, and it creates twelve different halls which are separated from
each other by eleven right angle corners. The ninety degree turns in the halls create
pockets of three to seven rooms. Due to the fact that the seventh and eighth grade rooms
are departmentalized rather than teamed, students are constantly traveling in and out of
these pockets. In the longest stretch of hallway, the line of sight is only the equivalent of
the length of five classrooms. In most cases, the line of sight is only the equivalent to the
length of three or four classrooms. To add to this disjointed feeling, in order to deal with
the change in elevation over the length of the building, stairs and ramps separate the
academic, creative arts, athletic and performing areas. In several cases, middle school
teachers are actually in closer proximity to high school staff than they are their own
faculty or office. This design only serves to further the philosophical rift between the
sixth, seventh, and eighth grades, and also the creative arts teachers. Small pockets of
rooms which are set around corners and out of the line of sight of other rooms, physically
prohibit regular informal interaction between professional staff. During structured
interviews, two teachers indicate that they often feel isolated from their peers (Interviews
10-4, 10-5, 2006). One teacher indicates that if on some days you “get busy in your own
little area, you might not see anyone (outside that area) unless you go to the office or
faculty room” (Interview 10-4, 2006). If the hallways are not offset, the line of sight in
the academic section of the school doubles in all cases. In addition, an absence of off-

228
sets also reduces the number of interior hallways from twelve to six, and the number of
right angle turns from eleven to seven.
In the end, the educators at school ten rank the domain of architectural acuity fifth
out of the seven sets of variables to impact the final design of their facility. This fact by
itself may not support the level of dissatisfaction that educators have with their facility.
However, the only two categories that the educators at school ten rank lower in are
pedagogy and demographics. The fact that the architect’s and design professional’s
ability to understand the needs of the school district and community, principles and
methods of instruction, and how students learn, along with the size, composition and
needs of the student body are ranked as the three sets of variables having the least impact
on the over all design of the facility, may be more revealing about the level of
dissatisfaction with the design of the building than any other measure.
Findings of School Ten
Does School Ten have an Articulated Educational Vision?
School ten is chosen as one of the four purposefully selected sites for a
comparative case study from the population of fifteen schools surveyed as a result having
the lowest mean responses to the degree at which educators feel their school has an
educational vision. During structured interviews and a building tour, the teachers at
school ten are divided in their pedagogical approaches for teaching young adolescents.
Educators attribute this lack of lack of focus and direction to the fact that from the time
discussions begin with regard to the construction of a new school through its second year
in operation, the faculty has been led by four different building level administrators and
three different central office administrators.

229
Is School Ten a Physical Representation of the School District’s Educational Vision?
School ten is chosen as one of the four purposefully selected sites for a
comparative case study from the population of fifteen schools surveyed as a result having
the lowest mean response of the degree at which educators believe that the design of their
facility contributes to a shared sense of purpose and a focus on what is important for
students. Even though the facility has many traditional design attributes of a middle
school, the educational program at school ten cannot be classified as a elementary,
middle school, or a junior high school. The sixth, seventh, and eighth grades, along with
the creative arts teachers are all assigned to instructional spaces and are scheduled with
characteristics of different educational philosophies. At the same time, the overall layout
of the building is disjointed. Students report that the building is confusing while the
faculty report that the building is isolating. The physical separation of faculty contributes
to the pedagogical differences between different groups of teachers.
Do the Design Professionals and Educators who Plan School Ten Manage Variables
within and Across the Six Domains of Planning when They Design the Facility?
Quantitatively, an analysis of the survey reveals that when educators are asked six
questions, one for each of the domains of planning, with regard to the degree at which
those responsible for planning understand each domain, of the fifteen schools, the
educators at school ten mean response rank their school eleventh out of fifteen.
As evidenced in structured interviews, a review of local newspaper articles and
public documents filed with the Pennsylvania Department of Education, a tour of the
facility, and a review of artifacts from the school district, it is demonstrated that those
responsible for planning school ten find it difficult to manage all of the domains of

230
planning. Evidence of this conclusion, as arranged by domains, is as follows:
Demographics. Educators rank the size, composition, and needs of the student
body as the domain which has the least impact on the final design of the facility.
Although the facility easily accommodates the size of student body, the layout and room
assignments cause confusion for the students.
Pedagogy – Even though the facility has many traditional design attributes of a middle
school, the educational program at school ten can not be classified as a elementary,
middle school or a junior high school. The sixth, seventh, and eighth grades, along with
the creative arts teachers are all assigned to instructional spaces and approach the
teaching of young adolescents with different philosophies. Educators attribute a lack of
focus and direction to the fact that, from the time discussions begin with regard to the
construction of a new school in its second year of operation, the faculty has been led by
four different building level administrators and three different central office
administrators.
Culture. Based on the transcripts of the Act 34 hearing, those responsible for
planning school ten do not manage the culture of the school district. With very long-
standing traditions, a strong sense of attachment to the old junior high school, and the
underestimation of the willingness of the community to invest in a new public school
facility that expands the performing arts and athletic facilities, the Board of School
Directors is lambasted over their decisions. Although the district has the resources to
construct the facility, the facility that the Board proposes is not in keeping with the
beliefs of the community. The decision to build a new school deeply divides the
community.

231
Architectural acuity. The overall concern with the facility for teachers and
students resides with the layout and design. Although aesthetically pleasing and
showcased in an architectural journal, the facility is disjointed by the large number of
hallways which are separated from one another by ninety degree turns. The building is
considered to be confusing by the students and isolating by the faculty. When the mean
responses to the degree at which educators report each of the six domains of planning as
having an impact on the final design of their school, the educators at school ten rank the
architect’s and design professional’s ability to understand the needs of the school district
and community, the principles and methods of instruction and how students learn, and the
size, composition, and needs of the student body as the three domains that have the least
impact on the overall design of the facility (see table 43). For reasons across several
domains which relate back to design, educators are dissatisfied with the facility.
Economics. Although the school district does not have any difficulty in the
appropriation of finances for the school, and even though the bids come in under budget,
the size and scope of the project causes a great deal of controversy within the community;
the construction of the project causes divisions on the Board of School Directors and
within the community. The controversy squarely centers on the cost of the project.
Politics. The Board of School Directors are attacked by bankers, lawyers, elected
officials, small business men, and individual citizens. The local State Representative in a
five page statement, along with the CEO of the district’s largest employer, question the
board’s ability to make sound financial decisions. In the end, however, even with a split
board, supporters of the project have the necessary votes to proceed.

232
Interaction of domains. Educators’ mean response ranks school ten eleventh out
of the fifteen schools to the degree at which educators feel that those responsible for
planning their facility understand the interaction of economic, political, and social forces,
as well as the needs of teachers and students. The interaction of variables within the
domains of politics, culture, economics, architectural acuity, and pedagogy are dynamic.
In the end, the Board of School Directors have the financial solvency and votes necessary
to proceed with project. However, the design and cost of the final product creates
divisiveness. In the end, this division may have been worthwhile or necessary if the
facility is ranked as strongly meeting the needs of faculty, staff, students, and the
community. However, on a six point scale, educators mean response to this statement is
3.75 (see table 13). The descriptors on the survey show educators at school ten only
“Somewhat Agree” that the facility meets the needs of faculty, staff, students, and the
community.
Does School Ten Meet the Needs of the Stakeholders?
The response of educators to the statement: “This school meets the needs of
faculty, staff, students, and the community”, ranks school Ten eleventh out of the fifteen
schools. It is clear that the design and layout of the facility, along with the mixed
pedagogical approaches, impact the level of dissatisfaction that educators have with the
facility. Design features which can never be changed will continue to create confusion
for students and create isolation for teachers. Although the facility contains many of the
traditional design features of a middle school, it is utilized, depending on the group of
teachers, with an elementary, junior high, or middle school philosophy. At best, given
the way that school ten is currently utilized, a statement can be made that it marginally

233
meets the needs of teachers and students.
Table 42
Tier One and Two Selection Data for School Ten
School 10 Mean of Vision (4) 4.083 Mean of Physical Representation (5) 4.333 Year of Opening 9/30/2002 Count Percent Possible Participants 32 Total Participants 12 37.50% Involved in Planning (1) Yes 9 81.82% No 2 18.18% Total 11 100.00% Years Spent in Facility (2) 0 to 2 0 0.00% 3 to 4 0 0.00% 5 to 6 12 100.00% 7 to 8 0 0.00% 9 to 10 0 0.00% 10+ 0 0.00% Total 12 100.00% Facility Utilized As Designed (3) Yes 11.00 91.67% No 1.00 8.33% Total 12.00 100.00%

234
Table 43
Ranked Mean Responses of School Ten
School 10
Rank Order of Degree to Which Planning of Facility Required Knowledge of Domains
Mean of Responses
Rank Order of Degree to Which Facility Planners Understood Domain
Mean of Responses
Rank Order of Degree of Impact on Design of Facility
Mean of Responses
Demographics 5.917 Economics 5.167 Economics 5.583 Economics 5.583 Pedagogy 4.917 Culture 4.750 Pedagogy 5.500 Culture 4.833 Interaction 4.750 Politics 5.250 Politics 4.833 Politics 4.667
Culture 5.167 Architectural Acuity 4.583
Architectural Acuity 4.583
Architectural Acuity 5.083 Interaction 4.583 Pedagogy 4.417 Interaction 5.000 Demographics 4.333 Demographics 4.250

235
Table 44
Summary of Mean Survey responses of School Ten
Survey Statement n Mean SD SE 4 12 4.083 1.3114 0.3786 5 12 4.333 1.2309 0.3553 6 12 3.750 1.2881 0.3718 7 12 4.167 1.2673 0.3658 8 12 4.417 1.0836 0.3128 9 12 4.333 1.3707 0.3957 10 12 4.000 1.4142 0.4082 11 12 3.917 1.5050 0.4345 12 12 3.750 1.3568 0.3917 13 12 3.917 1.2401 0.3580 14 12 6.083 0.7930 0.2289 15 12 4.583 0.9962 0.2876 16 12 4.417 1.3114 0.3786 17 12 5.083 0.6686 0.1930 18 12 5.333 1.4355 0.4144 19 12 5.417 1.3114 0.3786 20 12 5.167 1.2673 0.3658 21 12 4.917 1.1645 0.3362 22 12 5.250 0.9653 0.2787 23 12 5.167 1.3371 0.3860 24 12 5.917 1.0836 0.3128 25 12 4.333 1.6143 0.4660 26 12 4.250 1.8647 0.5383 27 12 5.500 1.3143 0.3794 28 12 4.917 1.3114 0.3786 29 12 4.417 1.5643 0.4516 30 12 5.167 1.0299 0.2973 31 12 4.833 1.2673 0.3658 32 12 4.750 1.0553 0.3046 33 12 4.750 1.4222 0.4106 34 12 5.333 1.3707 0.3957 35 12 5.583 0.7930 0.2289 36 12 5.167 0.9374 0.2706 37 12 5.583 0.9962 0.2876 38 12 5.250 0.9653 0.2787 39 12 4.833 1.2673 0.3658 40 12 4.667 1.2309 0.3553 41 12 5.083 0.9003 0.2599 42 12 4.583 1.1645 0.3362 43 12 4.583 1.0836 0.3128 44 12 4.000 1.5374 0.4438 45 12 4.417 1.4434 0.4167 46 12 4.417 1.4434 0.4167 47 12 4.500 1.2432 0.3589 48 12 5.000 1.0445 0.3015 49 12 4.583 1.3114 0.3786 50 12 4.750 1.2881 0.3718

236
CHAPTER V
DISCUSSION AND RECOMENDATIONS
Significance of Problem
Collectively, the cost of the fifteen schools participating in the study to the
taxpayers of Pennsylvania is $267,510,688.00 to construct. When 501 educators who
teach in these facilities are asked to respond to the statement: “This facility meets the
needs of faculty, staff, students, and the community”, their mean response is 4.20 on a
scale of 6.0 (see table 12, survey statement 12). Based on the descriptors given to the
educators on the survey, a mean of 4.20 is best described as slightly above “Somewhat
Agree.” When asked to respond to the statement: “This facility meets the needs of
teachers”, their mean response is best described as slightly below “Somewhat Agree.”
Similarly, when they respond to the statement: “This facility meets the needs of
students”, the response of the 501 educators is the same— slightly below “Somewhat
Agree.” With the cost of financing, the investment in these fifteen facilities alone cost
the taxpayers of Pennsylvania well over a third of a billion dollars. This fact brings this
study full circle to the central research question of the work: If educators and design
professionals have demonstrated the ability to design and construct educational facilities
that meet the needs of children and the communities they serve, what are the variables
that intervene when they fail to do so?
Purpose and Goal of the Study
In pursuit of the answer to aforementioned question, the utilization of a primarily
experiential literature base, a thematic analysis of text and a synthesis of literature from

237
education, educational administration, architecture, and an organizational sociology, a
systems model of public educational facilities is developed. This model represents an
attempt to develop a unifying theoretical construct from which design professionals and
educators can better organize, understand, analyze, communicate, and research complex
cause and effect relationships that occur when educational facilities are designed and
constructed. The Systems Model for Planning of Educational Facilities attempts to: (1)
identify and describe complicated social, cultural, political, and economic mechanisms at
work when public schools are designed and constructed in a pluralistic democratic
society, (2) make understandable the relationships between those mechanisms and
educational facility planning, and (3) formalize causal inferences between social, cultural,
political, and economic mechanisms, educational facility planning, and educational
facilities. The goal of this study is to determine the validity of the Systems Model for
Planning of Educational Facilities.
Research Tradition and Design Parameters
In the pragmatic tradition of research, the truth of a proposition is measured by its
correspondence with experimental results and by its practical outcome (Columbia, 2001).
In this light, pragmatic research is problem-centered and is always conducted in a social,
historical, political context, as well as many others. Central to pragmatic inquiry is the
research problem, not the research methodology. Pragmatic inquiry frees the researcher
to select from methods, techniques, and procedures that maximize the quality of
experimental results and the practical benefits of the study (Creswell, 2003).
A pragmatic view of educational facilities planning, such as the systems model,
assumes that educational facilities which are planned in a democratic society arise out of

238
actions, situations, and consequences, rather than antecedent conditions. For these
reasons, this study and the selection of the research methodology was grounded in
pragmatic tradition.
Based on a pragmatic approach, the research design of this study places the
practical examination of the Systems Model for Educational Facilities Planning at the
heart of the research methodology. In doing so, four important criteria are taken into
account in the selection of a methodology. First, the complex patterns, interactions, and
relationships between the physical, social, pedagogical, cultural, and economic
components described in the Systems Model for Educational Facilities Planning require
an examination of variables that are both quantitative and qualitative. Second, a research
method that requires the exclusive use of quantitative methods will necessitate the use of
latent variables as indicators of underlying qualitative constructs. This is especially true
in the domains of politics, culture, and pedagogy. Quantitative examination of variables
of this nature can raise questions with regard to validity and reliability. Third, a research
method that requires the exclusive use of qualitative methods will allow the synthesis of
ideas for the purpose of delimiting complex underlying qualitative constructs. However,
it excludes numerical descriptors and explanations of causal relationships through
statistical probabilities. In addition, for the domains of demographics and economics,
pure qualitative measures can raise questions with regard to validity and reliability.
Finally, given the fact that the examination of the model as a whole requires concurrent
analysis of variables which are both quantitative and qualitative in nature, a research
design that utilizes a mixed methodological approach is a necessity.

239
Research Method
Based on the four criteria listed above, this study employs a sequential
transformative research design. As defined by Creswell (2003), sequential transformative
research is a mixed methodological approach that utilizes a theoretical lens (in this case,
the systems model) to ground a study. A sequential transformative research design
maximizes leverage over the complexity of the systems model and provides the greatest
opportunity to make generalizations to other contexts and settings.
Maximizing Leverage over the Complexity of the Model
It is recognized that the complexity of the phenomenon being studied, the
difficulty in establishing valid causal inferences in the social research of this nature, and
the need for high generalizability creates a challenge for any research design. Utilizing
the systems model as a lens, research is conducted in two sequential stages. The first
phase of the investigation utilizes quantitative methods to describe the sample and
examine, through multiple regression and univariate analysis, the validity of the core
components of the systems model and the systems model as a whole. The second phase
of the investigation utilizes qualitative methods to complete a comparative analysis of
four purposefully selected case studies. Identical to the first phase, it is done for the
purpose of examining the validity of the core components of the systems model and the
systems model as a whole.
Leverage over the complexity of the systems model is gained through a
comparison and contrast of the results of two distinct methodologies. The research design
provides the greatest opportunity to: (1) describe complicated social, cultural, political,

240
and economic mechanisms at work when public schools are designed and constructed in
a pluralistic democratic society, (2) elaborate on the relationships between those
mechanisms and educational facility planning, and (3) cross-validate through quantitative
and qualitative methods, a systems model which formalizes causal inferences between
social, cultural, political, and economic mechanisms, educational facility planning, and
educational facilities.
Primary Suppositions of the Systems Model
for Educational Facilities Planning
The Systems Model for Educational Facilities Planning is built on two primary
suppositions. The first supposition states that if a school has an educational vision, and if
those responsible for the design and construction of the facility manage the interaction of
economic, political, and social forces, as well as the needs of teachers and students, then
using the resources available, design professionals and educators can design and
construct an educational facility that is a physical representation of an educational vision.
The second supposition states that if an educational facility is a physical representation of
an educational vision it meets the needs of its stakeholders.
In order to examine these two suppositions, five critical research questions are
examined for each individual school and across the data as a whole. These questions,
identical in both quantitative and qualitative phases of the research, directly reflect the
core components of the Systems Model for Educational Facilities Planning and the
systems model as a whole. The five critical research questions are as follows: (1) Do the
schools have an articulated educational vision? (2) Do the design professionals and
educators manage variables within the six domains of planning when they design the

241
facilities? (3) Do the design professionals and educators manage the interaction of
variables across the six domains of planning when they design the facilities? (4) Are the
educational facilities physical representations of their educational visions? and (5) Do the
educational facilities meet the needs of the stakeholders?
Summary of Findings: Supposition I
The data analyzed represents the responses from 501 educators from fifteen
middle schools that are constructed and opened in the Commonwealth of Pennsylvania
between the years of 1992 and 2002. The fifteen schools are built by twelve different
architectural firms in thirteen different counties. Furthermore, the schools reside in five
of the eight different census classifications for municipalities. These five classifications
represent rural, suburban, and urban settings. The schools are built in eight different
years between 1992 and 2002 and range in costs starting from $9.0 million on up to $34.4
million. Collectively, the schools serve 442,913 students. The individual student bodies,
from a wide range of social and economic backgrounds, represent three different types of
middle school grade alignments, and range in size from 451 to 1,056 students. With an
equally wide range, the academic performance on standardized tests of the fifteen student
bodies range from very poor to outstanding.
The Systems Model for Educational Facilities Planning is built on two primary
suppositions. The first supposition states that if a school has an educational vision, and if
those responsible for the design and construction of the facility manage the interaction of
economic, political, and social forces, as well as the needs of teachers and students, then
using the resources available, design professionals and educators can design and
construct an educational facility that is a physical representation of an educational vision.

242
A univariate analysis of the data yields an immediate pattern consistent with this premise.
When the responses of the educators in each school are ranked from high to low
based on the degree to which they believe: (1) their school has an educational vision, (2)
planners understand the variables within the six domains of planning, (3) planners
understand the interaction of the variables across the domains, and (4) the facility is a
physical representation of the educational vision, the data shows that the schools with the
highest rankings on the first three variables also have the highest rankings of the fourth.
Likewise, the schools with the lowest rankings on the first three variables have the lowest
rankings in the fourth. The relevance of these patterns is even greater considering that
amongst the fifteen schools, the difference between the minimum and maximum mean
response for the educational vision sorts the ranking of these schools over a range of
1.485 (see table 18). The difference of the minimum and maximum means for the
average degree to which facility planners understand the six domains of planning rank the
schools over a range of 2.080 (see table 18). The difference in the mean responses for the
degree to which educational facility planners understand the interaction of the domains of
planning is 2.120 (see table 18). Finally, the minimum and maximum mean responses of
the degree to which the educational facility is a physical representation of the educational
vision is rank the fifteen schools over a range of 2.313 (see table 18). Given the fact that
a pattern in the data emerges across four variables amongst the fifteen schools provides
justification for further analysis.
Multiple regression analysis is used to ascertain if: (1) the degree to which the
school has an educational vision, (2) the degree to which facility planners understand the
six domains of planning, and (3) the degree to which facility planners understand the

243
interaction of the variables across the six domains of planning and can explain the degree
to which the educational facility is a physical representation of the educational vision. A
multiple regression analysis is conducted to the degree at which educators report that
their facility is a physical representation of the schools educational vision as the
dependent variable (survey statement 23). The degree to which a school has an
educational vision (survey statement 18), the degree to which facility planners understand
the six domains of planning (the mean of the means of survey statements 6 to 11), and the
degree to which facility planners understand the interaction of the variables across the six
domains (survey statement 13) are entered as the independent variables. These variables
account for a significant percentage of the variance in the model. The coefficient of
determination (R2) is 0.513, which indicates that these variables explain 51% of the
variance to the degree at which an educational facility is a physical representation of the
educational vision. The multiple regression analysis is significant with a confidence
interval of 95%.
Summary of the Findings: Supposition II
The second primary supposition on which the Systems Model for Educational
Facilities Planning is built states that if an educational facility is a physical representation
of the educational vision, it will meet the needs of its stakeholders. As with the first
supposition, a clear pattern in the data emerges when the schools are ranked from highest
to lowest, based on educators mean responses of the degree to which they believe their
school has a physical representation of an educational vision, and the degree to which the
facility meets the needs of faculty, staff, students, and the community. Most notably,
when the ranking is broken into a top, middle, and bottom third, eleven of the fifteen

244
schools remain exclusively in one of the thirds for both variables. Of the four schools not
exclusively in one of the thirds, three of the four are ranked on the cut point between two
of the thirds (see table 20). An examination of the data shows that at no time does a
school with one of the two variables in the top third have a ranking of the other variable
in the bottom third. Likewise, at no time does a school with one of the two variables in
the bottom third have a ranking of the other variable in the top third. The significance of
these observations is even greater considering that amongst the fifteen schools, the range
of the mean responses to the degree at which the educational facility is a physical
representation of educational vision is 2.313, while the range to the degree at which the
facility meets the needs of faculty, staff, students, and the community is 2.962 (see table
18). The fact that a pattern in the data emerges, based on a high to low ranking of the
mean responses of educators at each of the fifteen schools, provides justification for
further analysis.
Multiple regression analysis is used to ascertain if the degree to which an
educational facility is a physical representation of the educational vision, and can explain
the degree to which the educational facility meets the needs of faculty, staff, students, and
the community. A multiple regression analysis is conducted to the degree at which
educators report that their facility meets the needs of faculty, staff, students, and the
community as the dependent variable (survey statement 12). The degree to which
educators report their facility is a physical representation of the educational vision
(survey statement 23) is entered as the independent variable. This single variable
accounts for a significant percentage of the variance in the model. The coefficient of
determination (R2) is 0.392, which indicates that these variables explain 39% of the

245
variance to the degree at which an educational vision meets the needs of faculty, staff,
students, and the community. The multiple regression analysis is significant with a
confidence interval of 95%.
Interpretation of Quantitative Results
In examination of the quantitative results it is important to consider that the
Systems Model for Educational Facilities Planning is developed utilizing a primarily
experiential literature base, a thematic analysis of text, and a synthesis of literature from
education, educational administration, architecture, and organizational sociology. The
model represents a theoretical construct which describes a highly complicated and
dynamic process. The systems model assumes that educational facilities planned in a
democratic society arise out of actions, situations, and consequences, rather than
antecedent conditions. During the development of the model, the literature base has few
references from which to start. After a decade of effort, educators and design
professionals have greatly expanded the body of knowledge that pertains to educational
facilities. This expanded body of knowledge, however, remains largely experiential or
perceptual, and not experimental. There are little comprehensive, research-based
resources and materials which describe the planning process for educational facilities.
It is found that literature on educational facility planning from the past decade,
whether experiential or experimental, addresses one or more of four elements. These
elements are: (1) the structure and nature of the organization for which planning occurs,
(2) the environment in which planning takes place, (3) the purpose and method for
planning, and (4) the architectural product which results from the planning. In order to
define a framework for the Systems Model for Educational Facilities Planning, it is

246
necessary to develop well grounded and defendable assumptions with regard to critical
components of the systems model and the model as a whole. To accomplish this goal, it
is necessary to synthesize literature from educational facilities planning, education,
educational administration, architectural practice, and organizational sociology. Based
on this synthesis, four assumptions are made which are central to the Systems Model for
Educational Facility Planning, and both guided and delimited this study. These
suppositions are the binding that holds the Systems Model for Educational Facilities
Planning together. They are as follows: (1) School districts are open-systems. In other
words, schools as organizations are conceptualized as part of a larger environment;
anything that happens in the larger environment may affect the school and vice versa, (2)
As open-systems, schools are resource dependent. In other words, they are not self-
sufficient; therefore they must engage the outside environment for needed resources. The
flow or exchange of resources creates dependencies and power differentials. These
power differentials have restraining effects on an organizations’ actions (Johnson, 1995),
(3) If school districts are considered open-systems and resource dependant, then one of
the primary purposes of planning is to reduce the restraining effects of resource
dependency. The process of planning involves the management of a multiplicity and
hundreds of variables. These variables can be classified into six domains of planning
which have been termed: pedagogy, demographics, politics, culture, economics, and
architectural acuity. Regardless of the planning process utilized, all facility planners
manage variables within and across the six domains of planning to reduce the restraining
effects of resource dependency, (4) Design professionals, regardless of their school of
thought on pedagogy or architecture, predicate the planning and design of educational

247
facilities on one of the basic premises for twentieth century modern architectural design:
form follows function. In other words, the goal of educators and design professionals is
to construct schools (architectural product) which are a clear, physical representation
(form) of a well-articulated educational vision (function).
In summary, when interpreting the quantitative results, it is imperative to bear in
mind that: (1) little comprehensive, research-based resources and materials exist which
describe the planning process for educational facilities, (2) no previous theoretical
construct for facilities planning of this nature exists, and (3) the theoretical construct on
which the model is built and grounded requires a synthesize of the literature from
educational facilities planning, education, educational administration, architectural
practice, and organizational sociology.
If given these facts alone when entering into the study, it is entirely possible that
as logical or as well grounded as the model seems, it is simply not valid. Further, as
dynamic as the process is that the model represents, measurements of validity may not
possible. Yet, across both the aggregated data of 501 individual participants and
disaggregated of fifteen schools, built by thirteen different architectural firms, diverse in
their physical, social, cultural, and academic characteristics, the critical components of
the Systems Models for Educational Facilities Planning and the model as a whole is
cohesive and demonstrates significance and validity.
Quantitative Conclusion
Quantitatively the critical components of the Systems Models for Educational
Facilities Planning and the model as a whole were cohesive demonstrating significance
and validity.

248
Qualitative Analysis
Qualitative Research Strategies Utilized to Gain Leverage Over the Complexity of the
Model
As stated before, it is recognized that the complexity of the phenomenon being
studied, the difficulty in establishing valid causal inferences in social research of this
nature, and the need for high generalizability creates a daunting challenge for any
research design. Of the challenges for this study, generalizability presents a particularly
difficult obstacle for the qualitative portion of the research. In order to gain leverage over
the model three strategies are employed.
First, replication logic is a premise in qualitative research which states that the
more times qualitative research findings are shown to be true with different sets of people
and/or in different contexts, the more confidence one can place in the findings and in the
conclusion that the finding can be generalized beyond the original study (Jones, 2003;
Smaling, 2003; Tillis, 1997). To this end, four separate sites are selected and a separate
analysis is completed at each site. Each of the four cases are treated as unique and
separate entities, but by holding the methodology constant, leverage over generalizability
is gained through replication logic.
Second, maximum variation sampling is used as a method to select the sites for
case study analysis. For small samples, a great deal of heterogeneity can be problematic
because individual cases are unique. The maximum variation strategy turns that
weakness into a strength through application of the following logic: Any common
patterns that emerge from great variation are of particular interest and value to capture the

249
core experiences, and central, shared dimensions of a setting or phenomenon (Patton,
2002). The four sites selected for case study demonstrate the greatest variation in two
core components of the systems model. The two core components are the degree to
which each school has an educational vision (the educational form) and the degree to
which each school is a physical representation of that vision (the architectural function).
Maximum variation sampling reduces researcher bias, increases internal validity, and
provides a means of replication. Once selected, methods of cross-verification at each site
are utilized to compare what the system model predicts, what the quantitative data yields
about the site, and the analysis of the qualitative data collected.
Finally, Johnson and Christensen believe that the more similar the people and
circumstances in a particular case are to the people and circumstances in another case, the
more defendable a generalization is and the more readily generalizations can be made
(2000). Therefore, while the sites selected for case study demonstrate the greatest
variation to the degree at which each school has an educational vision and the degree to
which each school is a physical representation of this vision, they are all middle schools
built and opened in the Commonwealth of Pennsylvania between the years of 1992 and
2003. At first, this may seem in opposition to the maximum variation sampling strategy.
However, it is the Systems Model for Educational Facilities Planning that is evaluated,
not the participants. Selection of middle schools built and open in the Commonwealth of
Pennsylvania between 1992 and 2003 creates commonalities in the: (1) geographic
region, (2) age of the facilities, (3) statues and regulations under which the facilities are
built, (4) teaching certifications required of the faculty, (5) age range of students, and (6)
fact that curriculum, instructional practices, and programs at the sites are designed to

250
meet the needs of early adolescents. This establishes manageable and consistent
parameters for the data collection and analysis. Consistency in both data collection and
analysis across schools with the widest variance in two critical components of the
systems model reduces researcher bias, increases internal validity, and provides a means
of replication.
Selection of Schools for Comparative Case Study
The four schools selected for comparative analysis are selected based on a
two-tiered process. The two-tiered process ensures that the sites selected demonstrate the
greatest possible variation and are information-rich. On the first tier, schools are sorted
based on two variables. These variables are: (1) The degree to which educators report that
within the school and community that it serves there is a shared sense of purpose and a
focus on what is important for students, and (2) The degree to which the facility
contributes to a shared sense of purpose and a focus on what is important for students.
The selection of the four schools is made over the widest possible continuum of these two
variables. This is consistent with the maximum variation strategy and better helps to
offset concerns of external validity, transferability, and researcher bias which often arises
during qualitative analysis. Based on the first-tier criteria, schools 09, 10, 12, and 15 are
selected for analysis in the second-tier of the selection process.
On the second tier of the selection process, the profiles of the respondents within
each school that are collected through the use of the survey instruments are utilized to
ensure that along with the strategy of greatest variation, the sites selected are information-
rich and provide the greatest opportunity to yield insights and understanding. The
number of faculty that respond to the survey, the percentage of educators in each facility

251
involved with the planning process, and the number of educators employed in the
building since its opening are all evaluated as a means to evaluate the potential quality
and quantity of the data at each site.
Finally, a one way ANOVA and a Post Hoc Analysis (LSD) are performed on the
means of the survey responses from each of the four schools considered for the study.
This is completed to assure that the four schools selected demonstrate the greatest
possible variance from each other and across the variables researched. These tests find
that in using the survey responses as a whole, the four schools under consideration are
significantly different from one another. In addition, a Post Hoc Analysis (LSD) is
performed on the variables being studied. It is determined that the majority of the
variables under investigation are significantly different across the four schools, and that
no other schools within the population can provide a larger spread over the variables
amongst the variables of interest. These are the same variables used to build the
regression models in the quantitative phase of the study.
As a result of the two levels of analysis, schools 09, 10, 12, and 15 are selected
for case analysis. The four schools selected are consistent with the maximum variation
strategy and offer information-rich environments. The selection process is critical in
offsetting concerns of external validity, transferability, and researcher bias. The selection
process helps to show that the end result of the study affords the greatest degree of
generalizability to other contexts and settings.

252
Profile of Schools Selected for Comparative Case Analysis
The four schools are selected based on the facts that they show the greatest
variance over two core components of the systems model, the potential quality and
quantity of qualitative data at each site, and that the usage of a one way ANOVA and
Post Hoc (LSD) are significantly different than the other schools in the sample. School
12 (Twelve) is selected for having the highest mean responses to the degree at which
educators believe that: “Within this school and community that it serves, there is a shared
sense of purpose and a focus on what is important for students”, and “This facility
contributes to a shared sense of purpose and a focus on what is important for students.
School 10 (Ten) is selected for having the lowest mean responses to these same two
statements. School 09 (Nine) is selected for having a low mean response to the
statement: “Within this school and community that it serves, there is a shared sense of
purpose and a focus on what is important for students”, and a high mean response to the
statement: “This facility contributes to a shared sense of purpose and a focus on what is
important for students.” And finally, school 15 (Fifteen) is selected for having a high
mean response to the statement: “Within this school and community that it serves, there
is a shared sense of purpose and a focus on what is important for students”, and a low
mean response to the statement: “This facility contributes to a shared sense of purpose
and a focus on what is important for students.” In addition, although the schools are not
selected based on differences in physical, social, cultural, economic, and academic
characteristics, they are very diverse.

253
Summary of Qualitative Findings
The second phase of the investigation utilizes qualitative methods to complete a
comparative analysis of four purposefully selected case studies. Identical to the first
phase, it is done to examine the validity of the core components of the systems model and
the systems model as a whole. Like the first phase, the second phase examines the five
critical questions set forth in the research design, which again, are as follows: (1) Does
the school have an articulated educational vision? (2) Do the design professionals and
educators manage variables within the six domains of planning when they design the
facility? (3) Do the design professionals and educators manage the interaction of
variables across the six domains of planning when they design the facility? (4) Is the
educational facility a physical representation of the educational visions? and, (5) Does the
educational facility meet the needs of the stakeholders?
Interpretation and Cross-Validation: School 12
Does School Twelve have an Articulated Educational Vision?
Qualitatively, as evidenced in structured interviews, a review of local newspaper
articles and public documents filed with the Pennsylvania Department of Education, a
tour of the facility, and a review of artifacts from the school district, school twelve has a
clearly articulated educational vision. The formation and communication of an
educational vision is part of the established culture in the school district where school
twelve resides.
Quantitatively, the survey reveals that when educators at school twelve are asked
to respond to the statement: “This school has an educational vision”, their mean response
is 6.818 out of a possible 7 (see table 35), which is higher than any of the other fourteen

254
schools in the sample.
Do the Design Professionals and Educators who Planned Twelve Manage Variables
within Six Domains of Planning when They Design the Facility?
As evidenced in structured interviews, a review of local newspaper articles and
public documents filed with the Pennsylvania Department of Education, a tour of the
facility, and a review of artifacts from the school district, those responsible for planning
school twelve understand and manage each of the domains of planning. In each of the six
domains, planners are acutely aware of the variables. Although there are virtually no
problems with economics and limited concerns with politics, those responsible for
planning school twelve do an outstanding job of understanding the culture of the school
district, the pedagogical needs of teachers and students, and the size, composition, and
needs of the student body. In addition, architectural acuity was high. The lead architect
has direct experience with the facility since it was a duplicate of another school that the
architectural firm had already constructed.
Quantitatively, every educator is asked six questions, one for each of the domains
of planning with regard to the degree at which those responsible for planning the facility
understand each domain. Again, of the fifteen schools, the educators at school twelve
have the highest mean response when the responses of all six questions are averaged. The
mean of the mean responses to the six questions is 5.313 out of 7.0 (see table 13).
Do the Design Professionals and Educators Manage the Interaction of Variables across
the Six Domains of Planning when They Design the Facility?
As evidenced in structured interviews, a review of local newspaper articles and
public documents filed with the Pennsylvania Department of Education, a tour of the

255
facility, and a review of artifacts from the school district reveal that those responsible for
planning school twelve understand the interaction of variables across the six domains of
planning. An analysis of the qualitative data yields three themes with regard to the
interaction of the six domains of planning. These themes are: (1) understanding, (2)
modification, and (3) focus. Those responsible for planning school twelve understand the
interaction between economic, political, and social forces at work in the school district,
and also the needs of teachers and students. With an understanding of the economic,
political, and social forces at work, planners strive to create a balance in these forces by
making the appropriate adaptations. However, the planners demonstrate that to make
adaptations does not mean to compromise their mission and vision. They remain focused
on the needs of teachers, students, and the community—especially the students.
Quantitatively, an analysis of the survey reveals that when educators at school
twelve are asked to respond to the statement: “Those responsible for planning and
constructing this facility understood the interaction of economic, political, and social
forces at work as well as the needs of teachers and students”, their mean response is the
highest of all fifteen schools that participate in the survey, 5.063 out of 6.0 (see table 35,
survey statement 12).
Is School Twelve a Physical Representation of the School District’s Educational Vision?
Qualitatively, as evidenced in structured interviews, a review of local newspaper
articles, public documents filed with the Pennsylvania Department of Education, a tour of
the facility, and a review of artifacts from the school district, school twelve is a physical
representation of the school district’s educational vision.
The combination of practical experience and working knowledge of existing

256
facilities gives the principal and lead architect a tremendous advantage in the design and
arrangement of spaces in a manner that facilitates a middle school model consistent with
the educational mission and vision of the school district. The teachers on the core
planning team are equally successful at formulating goals, programs, policies, and
procedures to govern the educational program within the new facility to reflect an
expectation of academic excellence commensurate with the four existing middle schools.
In the end, even with the educational spaces designed to be generic, flexible, and
built for change, it is understood by those involved with the planning that the design and
layout of the facility is necessary and represent the stress of rapid population growth
experienced by educators, school district and township officials, and citizens within the
community.
Quantitatively, the survey reveals that when educators at school twelve are asked
to respond to the statement: “The design and appearance of this facility conveys the
educational vision of the school”, their mean response is 6.485 out of a possible 7 (see
table 35, survey statement 23), and is thereby higher than any of the other fourteen
schools in the sample.
Does School Twelve Meet the Needs of the Stakeholders?
Qualitatively, as evidenced in structured interviews, a review of local newspaper
articles, public documents filed with the Pennsylvania Department of Education, a tour of
the facility, and a review of artifacts from the school district, school twelve meets the
needs of stakeholders.
From the onset, based on a forty year tradition of treating the middle grades as a
unique group within the educational program, the educators who are involved with

257
planning school twelve are charged with the responsibility of making sure that the
academic program is commensurate with the existing middle schools. To this end, the
core planning team’s primary goal is the development, communication, and
implementation of the school district’s and principal’s vision of what the middle school
program can be within the new facility. During the building tour (2006), the structured
interviews with educators, and the times when the researcher is free to move about the
building and interact with faculty and students, everyone readily speaks about how
pleased they are with the facility. Formally and informally educators speak of how the
building meets their needs and the needs of their students.
Although initial concerns are raised with regard to the school district’s proposal to
build the school on an environmentally-sensitive property, an agreement with township
supervisors provide an alternative site, save the school district nearly $500,000, provide
for community-wide use of the campus and adjoining township property during the
school day, and result in the selection of a facility design that allows community use of
athletic and common areas within the school after hours. As a result, both the facility and
the campus better meet the needs of the community.
Quantitatively, the survey reveals that when educators at school twelve are asked
to respond to the statement: “This facility meets the needs of faculty, staff, students, and
the community”, their mean response is 5.813 out of a possible 6.0, which is higher than
any of the other fourteen schools in the sample. The qualitative results are consistent
with the quantitative results.

258
Table 45 Cross-Validation Table: Summary of Critical Research Questions Qualitative and Quantitative Results from School Twelve
Research Question Quantitative Result
Qualitative Result
Does school twelve have an articulated educational vision? YES YES
Do the design professionals and educators who plan school twelve manage variables within six domains of planning when they plan the facility?
YES YES
Do the design professionals and educators who plan school twelve manage the interaction of variables across six domains of planning when they design the facility?
YES YES
Is school twelve a physical representation of the school district’s educational vision? YES YES
Does school twelve meet the needs of the stakeholders? YES YES
Conclusions of Case Study for School Twelve
Twelve is consistent with the prediction made by the Systems Model for
Educational Facilities Planning. The Systems Model for Educational Facility Planning
predicts that if there is an articulated vision and the facility is a physical representation of
that vision, then the facility meets the needs of those it serves if during the planning of
the facility, the physical, social, pedagogical, cultural, and economic components of the
environment are managed. School twelve has an articulated educational vision and the
facility is a physical representation of that vision. The educators and design professionals
responsible for planning school twelve consider each of the six domains of planning and
the interaction of each of these domains during the planning process. School twelve
meets the needs of faculty, staff, students, and the community. This case study, in part,

259
validates the Systems Model for Educational Facility Planning.
Interpretation and Cross-Validation: School 15
Does School Fifteen have an Articulated Educational Vision?
Qualitatively, as evidenced in structured interviews, a review of local newspaper
articles, public documents filed with the Pennsylvania Department of Education, a tour of
the facility, and a review of artifacts from the school district, school fifteen has an
educational vision.
The school district in which school fifteen resides currently operates three middle
schools. When school fifteen is constructed, the school district has more than a decade
worth of experience with middle level education. During structured interviews,
collectively, the educators at school fifteen establish that they maintain a shared sense of
purpose and a focus on what is important for students. The educators evidence their
beliefs through a demonstration of pride in their school, their programs, and their
students. Even when they readily list obstacles to their educational programs due to the
design of the facility, they still emphasize the positive things that occur and the ways that
faculty has adapted.
Quantitatively, the educators’ at school fifteen mean response to the statement:
“Within this school and community that it serves, there is a shared sense of purpose and a
focus on what is important for students” is 5.086 out of a possible 6.0. Additionally,
when asked to respond to the statement: “This school has an educational vision”, the
mean response is 5.629 on a scale of 7.00 (see table 38, survey statement 18). These
results are consistent with the findings during the qualitative study.

260
Do the Design Professionals and Educators who Plan School Fifteen Manage Variables
within Six Domains of Planning when They Design the Facility?
As evidenced in structured interviews, public documents filed with the
Pennsylvania Department of Education, a tour of the facility, a review of artifacts from
the school district, and a historical examination of the county, those responsible for
planning school fifteen experience difficulty in the management of the six domains of
planning. Of particular difficulty for planners are the quantitative and qualitative
variables within the domains of economics, politics, and culture. This is not to indicate
that the domains of pedagogy and architectural acuity are not important. However, they
are overshadowed by the complexity of the qualitative and quantitative variables in the
other four domains.
Quantitatively, every educator is asked six questions, one for each of the domains
of planning with regard to the degree at which those responsible for planning the facility
understand each domain. Of the fifteen schools, the educators at school fifteen have the
lowest mean response when the responses of all six questions were averaged. The mean
of the mean responses to the six questions is 3.23 out of 6.0 (see table 13).
Do the Design Professionals and Educators at School Fifteen Manage the Interaction of
Variables Across the Six Domains of Planning when They Design the Facility?
As evidenced in structured interviews, public documents filed with the
Pennsylvania Department of Education, a tour of the facility, a review of artifacts from
the school district, and a historical examination of the county, those responsible for
planning school fifteen experience difficulty in the management of the interaction of
variables across the six domains of planning. This investigation identifies and describes

261
complicated social, cultural, political, and economic mechanisms at work in the school
district where school fifteen resides. The interaction of economic, political, and social
forces at work in the school district and community contend with the needs of teachers
and students, and they limit the resources available to the educators and design
professionals responsible for the design and construction of a facility which is a physical
representation of the school district’s educational visions.
Quantitatively, an analysis of the survey reveals that when educators at school
fifteen are asked to respond to the statement: “Those responsible for planning and
constructing this facility understood the interaction of economic, political, and social
forces at work as well as the needs of teachers and students” their mean response is the
lowest of all fifteen schools that participate in the survey—2.943 out of 6.0. This is the
lowest mean response of the fifteen schools.
Is School Fifteen a Physical Representation of the School District’s Educational Vision?
Qualitatively, as evidenced in structured interviews, a review of local newspaper
articles, public documents filed with the Pennsylvania Department of Education, a tour of
the facility, and a review of artifacts from the school district, school fifteen is not a
physical representation of the school district’s educational vision.
From the onset, it was a challenge for those responsible in planning school fifteen
to design a facility that was a physical representation of an educational vision. With
plans already drawn for a new elementary school, rather than lose the investment in
architectural fees, those responsible for planning school fifteen are directed to utilize the
same blue prints and simply designate the facility as a middle school. As a result of this
action, it is not unexpected when, out of fifteen schools in the sample, the educators at

262
school fifteen have the lowest mean responses (4.171 out of 7.0) to the statement: “The
design and appearance of this facility conveys the educational vision of the school” (see
table 13). This sentiment is also echoed during structured interviews when 100% of the
educators convey dissatisfaction with the way that the building addresses the size, needs,
and composition of the student body.
Given the fact that school fifteen is the oldest school to participate in the study, it
it is arguable that after thirteen years of operation, the educators respond to the survey
questions based on current conditions of the facility, and that the low degree to which
they indicate that the facility meets the needs of faculty, staff, parents and the community
are the result of events that can not have been anticipated even by the most astute facility
planners. To this end, it is necessary to point out the fact that the design issues which
cause the greatest concerns today, begin almost immediately after the facility is opened.
Three of the educators who participate in structured interviews indicate that within two
years of the facility opening, teacher planning centers are converted into additional
classroom spaces, and the common areas, especially the halls, show that they are not
designed to manage the increasing number of students. As the elementary schools
continued to be pressed for space, the school district is forced to begin planning a major
addition to school fifteen. The problems that arise and lead up to the construction of the
addition, and the concerns raised with the inadequacy of the addition, have been
consistent over the thirteen years since school fifteen has opened
Does School Fifteen Meet the Needs of the Stakeholders?
By all qualitative and quantitative measures, school fifteen does not meet the
needs of the stakeholders. As a result of a building tour (2006) and structured interviews

263
with educators (2006), although school fifteen is a well maintained, functional building, it
is limited in the degree to which it meets the needs of faculty, staff, students, and the
community.
On the quantitative survey in phase one of this study when the educators at school
fifteen are asked to respond to the statement: “This school meets the needs of faculty,
staff, students, and the community”, their mean response is 2.371 out of 6.
Table 46 Cross-Validation Table: Summary of Critical Research Questions Qualitative and Quantitative Results from School Fifteen
Research Question Quantitative Result
Qualitative Result
Does school fifteen have an articulated educational vision? YES YES
Do the design professionals and educators who plan school fifteen manage variables within six domains of planning when they design the facility?
NO NO
Do the design professionals and educators who plan school fifteen manage the interaction of variables across six domains of planning when they design the facility?
NO NO
Is school fifteen a physical representation of the school district’s educational vision? NO NO
Does school fifteen meet the needs of the stakeholders? NO NO
Conclusions of Case Study School Fifteen
Fifteen is consistent with the prediction made by the Systems Model for
Educational Facilities Planning. The Systems Model for Educational Facility Planning
predicts that if there is an articulated vision, but the facility is not a physical

264
representation of that vision, then the facility does not meet the needs of those it serves.
School fifteen has an articulated educational vision, but the facility is not a physical
representation of that vision. The educators and design professionals responsible for
planning school fifteen experience difficulty in the management of variables within the
six domains of planning and the interaction of those domains during the planning process.
This case study, in part, validates the Systems Model for Educational Facility Planning.
Interpretation and Cross-Validation: School 09
Does School Nine have an Articulated Educational Vision?
Qualitatively, as evidenced in structured interviews, a review of local newspaper
articles, public documents filed with the Pennsylvania Department of Education, a tour of
the facility, and a review of artifacts from the school district, school nine has an
educational vision and the facility is constructed to represent that vision. However, due
to an inability to sustain that educational vision and not having reformulated a new
vision, the educators at school nine have a low mean response in response to the
statement: “Within this school and community that it serves, there is a shared sense of
purpose and a focus on what is important for students.” There are only three schools out
of the fifteen that participate in the study that have a lower mean on this statement. The
findings from the case study indicate that a far more complicated set of dynamics are at
work in the school district where school nine resides, and also that this low mean score
can not simply be explained by the presence or absence of an educational vision. Given
the fact that Nine receives national recognition after its first year in operation, it is not
likely that an absence of an educational vision is the reason for the low mean scores on
the survey. The survey results from school nine may have been very different if

265
conducted at the end of the first year its operation (2002/2003).
Do the Design Professionals and Educators who Plan School Nine Manage Variables
Within Six Domains of Planning when They Design the Facility?
As evidenced in structured interviews, public documents filed with the
Pennsylvania Department of Education, a tour of the facility, and a review of artifacts
from the school district, those responsible for planning school nine, with the exception of
limits placed on the school district as a result of having a lower bond rating, have no
challenges to their management of the design and construction of the new middle school.
By the recognition received after its first year in operation, those responsible for planning
school nine do an exceptional job in the management of the domains of architectural
acuity, culture, and pedagogy. In addition, it appears that the district does a satisfactory
job dealing with the domain of politics. However, though there were no questions raised
at the time of planning and construction, in the domains of demographics and economics,
shortsighted planning results in an inability to sustain the school district’s educational
vision.
Quantitatively, when every educator is asked six questions, one for each of the
domains of planning with regard to the degree at which those responsible for planning the
facility understand each domain, the educators at school nine have the fifth highest mean
response when the responses of all six questions are averaged. The mean of the mean
responses to the six questions is 4.667 out of 6.0 (see table 13).

266
Do the Design Professionals and Educators who Plan School Nine Manage the
Interaction of Variables Across the Six Domains of Planning when They Design the
Facility?
Based on the recognition received after its first year in operation, those
responsible for planning school nine do an exceptional job in the management of the
domains of architectural acuity, culture, and pedagogy. In addition, it appears that the
district does a satisfactory job dealing with the domain of politics and with the interaction
of the qualitative and quantitative variables across domains. In the end, those responsible
for planning school nine are able to leverage the resources necessary to construct a new
middle school in an economically distressed school district. However, though there are
no questions raised at the time of planning and construction, in the domains of
Demographics and Economics, shortsighted planning results in an inability to sustain the
school district’s educational vision.
Quantitatively, an analysis of the survey reveals that when educators at school
nine are asked to respond to the statement: “Those responsible for planning and
constructing this facility understood the interaction of economic, political, and social
forces at work as well as the needs of teachers and students” their mean response is the
third highest of all fifteen schools that participate in the survey. Their mean response is
4.364 out of 6.0 (see table 13).
Is School Nine a Physical Representation of the School District’s Educational Vision?
Qualitatively and quantitatively school nine is a physical representation of the
educational vision for which it is built. However, due to financial problems, a decline in
enrollments, a decrease in property values, and high fixed operating costs, the school

267
district can no longer sustain the vision for which school nine is built.
When educators at school nine are asked to respond to the statement: “The design
and appearance of this facility conveys the educational vision of the school”, their mean
response is the fourth highest of the fifteen schools, 6.73 out of 7.0. (see table 13). At the
same time, when asked to respond to the statement: “Within this school and community
there is a shared sense of purpose and a focus on what is important for students”, they
have the fourth lowest mean, 5.909 out of 7.0 (see table 13). As established earlier, it is
not that the school district does not have an educational vision or that they lack the
expertise, experience, or the facilities to achieve that vision. Unfortunately, the school
district does not have the financial stability to sustain their vision within the facility, and
it has not yet reformulated their vision to address the current reality of the environment.
Does School Nine Meet the Needs of the Stakeholders?
The educators at school nine have demonstrated the expertise, experience, and the
facility necessary to achieve their vision. This is evidenced by the national recognition
that is received by the faculty and staff for increased attendance and standardized test
scores after only one year in operation. During a tour of the facility and structured
interviews, it was evident that the facility is specifically designed to be a middle school
for urban children. Middle school principles and methods of instruction that are
supported by the National Middle School Association (NMSA, 2006) and held common
by the school district and architectural firm are embedded in the overall design of
building and arrangement of spaces within the facility. Beyond the design, the location
of the new middle school is outside of economically distressed neighborhoods. This
results in educators being better able to address the health and safety needs of their

268
students.
On the quantitative survey in phase one of this study when the educators at school
nine are asked to respond to the statement: “This school meets the needs of faculty, staff,
students, and the community”, their mean response is 4.362 out of 6 (see table 41, survey
statement 12). This mean response is higher than more than half of the schools in the
study.
Table 47:
Cross-Validation Table: Summary of Critical Research Questions Qualitative and Quantitative Results from School Nine
Research Question Quantitative
Result Qualitative
Result – Currently
Qualitative Result –
After First Year in
Operation Does school nine have an articulated educational vision? NO NO YES
Do the design professionals and educators who plan school nine manage variables within six domains of planning when they design the facility?
YES YES YES
Do the design professionals and educators who plan school nine manage the interaction of variables across six domains of planning when they design the facility?
YES YES YES
Is school nine a physical representation of the school district’s educational vision? YES YES YES
Does school nine meet the needs of the stakeholders? YES YES YES

269
Conclusions of School Nine
The quantitative data indicates that: (1) the school does not have an articulated
educational vision, (2) the facility is a physical representation of an educational vision,
(3) the design professionals and educators manage variables within the six domains of
planning, and (4) the educational facility meets the needs of the stakeholders. This set of
statements does not match what the System Model for Educational Facilities Planning
predicts for a new facility and suggests that the Systems Model for Educational Facilities
planning is not valid in this case. However, in the case of school nine, the qualitative
data indicates that the environment changed so quickly that the timing of the study, in
comparison to events in the school district, shed a different light on the analysis. The
qualitative research indicates that if this study is completed a year after the school opens,
the results are likely to indicate that: (1) the school has an articulated educational vision,
(2) the facility is a physical representation of that vision, (3) the design professionals and
educators manage variables within the six domains of planning, and (4) the educational
facility meets the needs of the stakeholders. This set of statements matches what the
system model predicts and holds the Systems Model for Educational Facilities planning
valid (see table 46). In this light, school nine is consistent with the prediction made by
the Systems Model for Educational Facilities Planning. The Systems Model for
Educational Facility Planning predicts that if there is an articulated vision, the facility is a
physical representation of that vision, and that the facility meets the needs of those it
serves.

270
Interpretation and Cross-Validation: School 10
Does School Ten have an Articulated Educational Vision?
During structured interviews and a building tour, the teachers at school ten are
divided in their pedagogical approaches for teaching young adolescents. Educators
attribute this lack of focus and direction to the fact that from the time discussions begin
with regard to the construction of a new school through its second year of operation, the
faculty has been led by four different building level administrators and three different
central office administrators.
Quantitatively, the survey reveals that when educators at school ten are asked to
respond to the statement: “This school has an educational vision”, their mean response is
5.333 out of a possible 7— the lowest mean of all fifteen schools (see table 13).
Do the Design Professionals and Educators who Plan School Ten Manage Variables
Within Six Domains of Planning when They Design the Facility?
As evidenced in structured interviews, a review of local newspaper articles, public
documents filed with the Pennsylvania Department of Education, a tour of the facility,
and a review of artifacts from the school district it is demonstrated that those responsible
for planning school ten experience difficulty in the management of variables in all of the
domains of planning. Although the Board of School Directors ultimately had the resolve
and financial solvency to proceed with the project, their difficulty in the management of
variables in all six of the domains of planning has had lasting consequences.
Quantitatively, when every educator is asked six questions, one for each of the
domains of planning with regard to the degree at which those responsible for planning the
facility understand each domain, the educators at school ten have the third lowest mean

271
response when the responses of all six questions are averaged. Their mean of the mean
responses to the six questions is 4.097 out of 6.0 (see table 13).
Do the Design Professionals and Educators who Plan School Ten Manage the
Interaction of Variables Across the Six Domains of Planning when They Design the
Facility?
Qualitatively and quantitatively those responsible for planning school ten
experience difficulty in the management of the interaction of variables across the six
domains of planning, especially in the domains of politics, culture, economics,
architectural acuity, and pedagogy. As previously stated, though the Board of School
Directors has the financial solvency and the resolve necessary to proceed with project, the
design and cost of the final product creates divisions on the Board of School Directors
and within the community. Over time, the divisions created may have been worthwhile
had the facility been ranked as strongly meeting the needs of faculty, staff, students, and
the community. However, the educators’ mean response to the statement: “This facility
meets the needs of faculty, staff, students, and the community” is 3.981 on a 6.0 point
scale (see table 41, survey statement 12).
Quantitatively, educators’ mean response rank school ten eleventh out of the
fifteen schools in the degree to which educators feel that those responsible for planning
their facility understand the interaction of economic, political, and social forces, as well
as the needs of teachers and students.
Is School Ten a Physical Representation of the School District’s Educational Vision?
While school ten demonstrates many traditional designs attributes of a middle
school, the educational program at school ten cannot be classified as a elementary,

272
middle, or junior high school. The sixth, seventh, and eighth grade, and also the creative
arts teachers are all assigned to different instructional spaces and scheduled with different
educational philosophies. The overall layout of the building is disjointed. Students
report that the building confuses, while faculty report that the building isolates.
Quantitatively, school ten is chosen as one of the four purposefully selected sites
for a comparative case study from the population of fifteen schools surveyed because it
holds the lowest mean response of the degree to which educators believe that the design
of their facility contributes to a shared sense of purpose and a focus on what is important
for students—4.33 on a scale of 6.0 (see table 13).
Does School Ten Meet the Needs of the Stakeholders?
Qualitatively, it is clear that the design and layout of the facility, along with the
mixed pedagogical approaches, impact the level of dissatisfaction that educators have
with the facility. Design features which are extremely difficult to change will continue to
create confusion for students and isolate teachers. As stated earlier, though the facility
contains many of the traditional design features of a middle school, it is utilized,
depending on the group of teachers, with an elementary, junior high, or middle school
philosophy. At best, the statement could be made that given the way school ten is
currently utilized, it marginally meets the needs of teachers and students.
Quantitatively, the response of educators to the statement: “This school meets the
needs of faculty, staff, students, and the community” rank school ten eleventh out of the
fifteen, with a mean score of 3.981 out of 6.0 (see table 13).

273
Table 48 Cross-Validation Table: Summary of Critical Research Questions Qualitative and Quantitative Results from School Ten
Research Question Quantitative
Result
Qualitative
Result
Does school ten have an articulated educational vision?
NO NO
Do the design professionals and educators who plan school ten manage variables within six domains of planning when they design the facility?
NO NO
Do the design professionals and educators who plan school ten manage the interaction of variables across six domains of planning when they design the facility?
NO NO
Is school ten a physical representation of the school district’s educational vision?
NO NO
Does school ten meet the needs of the stakeholders?
NO NO
Conclusions of Case Study for School Ten
School ten is consistent with the prediction made by the Systems Model for
Educational Facilities Planning. The Systems Model for Educational Facility Planning
predicts that if there is not an articulated vision and/or the facility is not a physical
representation an articulated educational vision, then the facility does not meet the needs
of those it serves. School ten does not has an articulated educational vision, and the
facility is not a physical representation of a clearly articulated educational vision. The
educators and design professionals responsible for planning school ten experience
difficulty in the management of variables within the six domains of planning and the

274
interaction of these domains during the planning process. This is especially true for the
domains of economics, politics, and culture. School ten is limited in the way it meets the
needs of faculty, staff, students, and the community. This case study, in part, validates
the Systems Model for Educational Facility Planning.
Conclusions of Study
The Systems Model for Educational Facilities Planning is a theoretical construct
which delimits and explains, in a systematic way, complex patterns, interactions, and
relationships between the physical, social, pedagogical, cultural, and economic
components of educational facilities planning. The pragmatic model assumes that
educational facilities planning in a democratic society arises out of actions, situations,
and consequences rather than antecedent conditions. As a result, by its nature, the
Systems Model for Educational Facilities Planning has applications regardless of the
school of thought on pedagogical practices, educational facilities planning, or
architecture.
As this study begins, it is entirely possible that as logical and well grounded as the
model seems, it simply is not valid. In addition, due to the complexity of the model, even
if it is valid, to determine its degree of validity is a challenge. However, through the
utilization of a research design that is creative, multi-layered, and grounded in sound
methodological practices, leverage is gained over the complexity of the system and the
Systems Models for Educational Facilities Planning demonstrates that it is cohesive,
significant, and valid.

275
Model Revisions Based on Research
Throughout the thematic analysis of text, synthesis of literature from education,
educational administration, architecture, organizational sociology, and discussions with
nationally recognized experts in educational facility planning, the Systems Model for
Educational Facilities Planning is refined and gains sophistication. The version of the
model that culminates from those efforts is shown in chapter 1, figure 2.
During the case studies it becomes apparent that there is a facet of educational
facilities planning for which the model does not account. In each case study, the
development, implementation, and maintenance of policies, programs, procedures, and
schedules to organize the educational program within the facility enhances the degree to
which the building meets the needs of faculty, staff, students, and the community. From
the most basic operating procedures, such as which staircase students utilize to move to
lunch, to more complicated decisions on how teachers and facilities can be effectively
and efficiently scheduled, all impact the level of satisfaction that educators have with the
facility.
Take for example, the case of school twelve; the core planning team of teachers
has little impact on the overall design of the facility. However, their primary
responsibility is to refine and fashion goals, programs, policies, and procedures to govern
the educational program within the new facility. During structured interviews, it is
evident that their efforts enhance educators’ satisfaction with the facility.
In the case of school ten, the facility is designed with many of the characteristics
of a traditional middle school. Particularly, the rooms are arranged so that they are
assigned to interdisciplinary teams of teachers. This is consistent with the middle school

276
philosophy to which the school district subscribes to in PlanCon documents (PlanCon 10,
1999). However, in practice, the seventh and eighth grade rooms are assigned in
departmental groups rather than in an interdisciplinary team, the sixth grade rooms are
utilized with an elementary school approach, and the creative arts rooms are utilized with
a middle school approach. Structured interviews indicate that this lack of focus and
purpose in the organization of the educational program within the facility increases the
level of dissatisfaction with the facility.
In the case of school fifteen, the facility is originally designed to be an elementary
school. Compounding that problem, a large addition increases the size of the student
body by one third, yet common spaces like the halls, library, gymnasium, and cafeteria
are not enlarged. Although during structured interviews educators readily list obstacles
to their educational programs due to the design of the facility, they still emphasize the
positive things that are occurring and the ways that faculty has adapted. The educators at
school fifteen find creative and successful methods to organize educational programs
within the facility in order to better meet the needs of their students.
In the case of school nine, educators develop policies, programs, procedures, and
schedules to utilize the facility in a manner that enhances movement toward their
educational vision. However, due to financial problems, a decline in enrollment, a
decrease in property values, and high fixed operating costs, the school district no longer
maintains the policies, programs, procedures, and schedules that are developed,
implemented, and made successful for the organization of the educational program within
the facility. This leads to a loss of focus, drop in morale, and decline in the belief that the
together, the educators and the facility make a positive impact on the lives of urban

277
youth.
It is important to note that in all these cases, it is not suggested that the vision or
the facility be changed. What is suggested is that the building can better meet the needs
of faculty, staff, students, and community through reorganization of goals, programs,
policies, and procedures that are used to govern the educational program within a facility.
The Systems Model for Educational Facilities planning assumes that change is
inevitable. The change may come slowly or it may come quickly, but change is
inevitable. Inevitable change is assured by the simple fact that all facilities age. It is
change that creates an imbalance between the educational vision and the ability of the
educational facility to meet the educational vision. It is the need to again achieve balance
that drives the model. In some situations during the research, it becomes evident that
change is addressed by a reorganization of goals, programs, policies, and procedures that
are used to govern the educational program within a facility. In this manner, neither the
educational vision nor the facility is changed, yet balance is achieved and the facility is a
better utilized as a physical representation of the educational vision.
As a result of the study, it is recommended that “Reorganization” be added as a
heading in the box just prior to “Architectural Form”. This indicates that in order to
maintain the balance between architectural form and architectural function educators can
exercise this option (see figure 6).

278
Figure 6. Revised Systems Model for Educational Facilities Planning
EDUCATIONAL VISION
EDUCATIONAL FACILITY
External Environment in Which Educational
Facility is Planned
Internal Environment in Which Educational Facility is Planned
PLANNING MODEL
BureaucraticPlanning
orLong Range/
Master Planning
orCommunity
Based Planning
orVision Based
Planningor
Sustainable Planning
AR
CH
ITECTU
RAL FO
RM
RESOURCE DEPENDENCY
PLANNING MODEL
BureaucraticPlanning
orLong Range/
Master Planning
orCommunity
Based Planning
orVision Based
Planningor
Sustainable Planning
ARC
HITEC
TUR
AL FUN
CTIO
N
100% of the Necessary
Resources Flow from the External
to the Internal Environment
0% of Necessary Resources Flow
From the External to the
Internal Environment
The Educational Vision may precede the planning model or the Educational
Vision may be a product of the planning model
A facility will stress the balance between form and function as the needs of the stakeholders change and because all facilities age. With enough stress the
process begins again.
Demographics Economics
Politics
Culture
Pedagogy
ArchitecturalAcuity
STAGNATION
REORGANIZATION
RENOVATION
CONSTRUCTION
DECOMMISSION
DEMOLITION
PLANNING PROPOSAL

279
Recommendations for Further Research
This study results in the conception and development of a Systems Model for
Educational Facilities Planning. The investigation finds the model to be cohesive,
significant, and valid. However, the model is extremely complex and continued research
is clearly needed. As a result of the study, five recommendations for continued research
are clear. They are as follows: (1) Research needs to be conducted on the model which
utilizes the planning of elementary, high schools, and non-traditional schools. (2) The
planning of schools in the Commonwealth of Pennsylvania has regulations that, to a
certain extent, govern the planning process. Research on the model needs to be
conducted with schools that are planned in different states or in settings ungoverned by
these regulations. (3) The study reveals that the survey instrument may have value
beyond this study. Further research and refinements of the survey instrument are a
worthwhile endeavor. (4) The study reveals that the development, implementation, and
maintenance of policies, programs, procedures, and schedules to organize an educational
program within an educational facility enhances the degree to which the building meets
the needs of faculty, staff, students, and the community. Research into educational
leadership under these conditions is warranted. (5) The model is built on the architectural
premise that “form follows function”. There are movements within educational facilities
planning to design and construct facilities which follow the architectural premise that
“function follows form”. The model needs to be evaluated against such a planning
process.

280
Recommendations for Practice
Early in the development of this study, it becomes evident that in order to address
the void in the research base, the complexity of the environment in which public schools
are planned, and concerns with regard to the empirical assessment of schools as
organizations that a unify theoretical construct is needed. However, such a construct
does not exist, nor does a broad empirical research base on which such a construct can be
built.
The Systems Model for Educational Facilities Planning is developed as a
theoretical construct to delimit and explain, in a systematic way, complex patterns,
interactions, and relationships between the physical, social, pedagogical, cultural, and
economic components of educational facilities planning.
The model represents a theoretical construct from which design professionals and
educators can better organize, understand, analyze, communicate, and research complex
cause and effect relationships that occur when educational facilities are designed and
constructed. The Systems Model for Planning of Educational Facilities: (1) identifies and
describes complicated social, cultural, political, and economic mechanisms at work when
public schools are designed and constructed in a pluralistic democratic society, (2) makes
understandable the relationships between those mechanisms and educational facility
planning, and (3) formalizes causal inferences between social, cultural, political, and
economic mechanisms, educational facility planning, and educational facilities.
This research study found that the Systems Models for Educational Facilities
Planning is cohesive, significant, and valid. Even so, based on the fact that the model is
pragmatic, its true worth is not measured by the analytical results of this study. Its true

281
value is measured by its application. The Systems Model for Educational Facilities
Planning needs to be utilized as a practical structure against which the planning of
educational facilities can take place. The model must be transitioned from the theoretical
to real world applications.

282
References
Abramson, P. (2003). 7th Annual School Construction Report. School Planning And
Management.
Abramson, P. (2004). 8th Annual School Construction Report. School Planning and
Management.
Agresti, A., & Finlay, B. (1997). Statistical Methods for the Social Sciences (Third ed.).
Upper Saddle River, NJ: Prentice Hall.
Argon, J. (2001). 27th Annual School Construction Report. American School and
University.
Argon, J. (2001). 27th Annual School Construction Report. Amaerican School and
University.
Bartos, R. (2000). Educational Research. Shippensburg University: Bartos.
Bernhardt, V. (1998). Data Analysis for Comprehensive School Improvement.
Larchmont, NY: Eye On Education.
Bolman, L., & Deal, T. (1997). Reframing Organizations. San Francisco: Jossey-Bass.
Building for the Future. (2005, October). American School Board Journal, 192-198.
Castaldi, B. (1994). Educational Facilities Planning Modernization and Management.
Boston MA: Allyn and Bacon.
Carey, D. (October, 1999). Best-Laid Plans. American School Board Journal, 36-38.
Chan, T., & Ledbetter, D. (1998, June). Do Planning Ideas Work? A Look Back. School
Business Affairs.

283
Chase, R. (2000 April). Modernizing Our Schools What Will It Cost. School Planning
and Management. October 1999, (36-38)
Construction Report. (1992). Harrisburg, PA: Pennsylvania Department of Education.
Construction Report. (1993). Harrisburg, PA: Pennsylvania Department of Education.
Construction Report. (1993). Harrisburg, PA: Pennsylvania Department of Education.
Construction Report. (1994). Harrisburg, PA: Pennsylvania Department of Education.
Construction Report. (1995). Harrisburg, PA: Pennsylvania Department of Education.
Construction Report. (1996). Harrisburg, PA: Pennsylvania Department of Education.
Construction Report. (1997). Harrisburg, PA: Pennsylvania Department of Education.
Construction Report. (1998). Harrisburg, PA: Pennsylvania Department of Education.
Construction Report. (1999). Harrisburg, PA: Pennsylvania Department of Education.
Construction Report. (2000). Harrisburg, PA: Pennsylvania Department of Education.
Construction Report. (2001). Harrisburg, PA: Pennsylvania Department of Education.
Construction Report. (2002). Harrisburg, PA: Pennsylvania Department of Education.
Council of Educational Facility Planners International. (1991). Guide for Planning
Educational Facilities (2nd edition). Scottsdale, Az: Author
Creswell J.W. (1998). Research Design. Thousand Oaks, CA: Sage Publications
Creswell, J. (2003). Research Design Qualitative, Quantitative, and Mixed Methods
Approaches (Second ed.). Thousand Oaks, CA: Sage Publications.
Creswell J.W. (1997). Qualitative Inquiry and Research Design Choosing Among Five
Traditions. Thousand Oaks, CA: Sage Publications.
DeJong, W. & Staskiewicz, C. (2003, February). Creating a Successful Facility Master
Plan. School Planning and Management, 42-54

284
Downing, D. (1995). Dictionary of Mathematic Terms. New York: Barrons.
Earthman, G. & Lemasters, K. (1997). Can Research Findings Help School Systems
Obtain the Most Bang From the Constructions Bucks?. Council of Educational
Facility Planners International.
General Accounting Office. (1995). School Facilities: Condition of America’s Schools, A
Report to Congress. (HEHS Publication No. 95-61) Washington, DC: U.S.
General Accounting Office.
George, D., & Mallery, P. (2000). SPSS for Windows Step by Step. Boston MA: Allyn
and Bacon.
Gerald, D., & Hussar, W. (2001) Projections of Education Statistics to 2011 August
2001 Publication #: NCES 2002083 SOURCE: U.S. Department of Education,
National Center for Education:
http://nces.ed.gov/pubsearch/pubsinfo.asp?pubid=2001083
Hamaty & Lines (1999). Planning for Schools of the Future: A Building Program is a
Golden Opportunity to Restructure Schools to Better Meet the Needs of Students
and Educational Programs. School Planning and Management, May 1999, (1-4).
Hollerman, F. (December, 2002). Our Children Should Not Have to Attend Rundown
Schools. US Department of Education.
Hoy, W., & Miskel, C. (1996). Educational Administration Theory, Research, and
Practice. New York: McGraw Hill.
Huck, S. (2004). Reading Statistics and Research. Boston MA: Allyn and Bacon.

285
Jilk, B. & Copa, G. (1997). The Design-Down Process: An Alternative to the Traditional
Education Specification Process for Defining Learning Environments. Council of
Educational Facilities Planners, CEFPI Issue Track,
http://www.cefpi/issue/issue6.htlm.
Johnson, B, & Christen, L. (2000). Educational Research Quantitative and Qualitative
Approaches. Boston MA: Allyn and Bacon.
King, G., Keohane, R. Verba, S. (1994). Designing Social Inquiry. Princeton, NJ:
Princeton University Press.
Little, D. (February 2002). Social Kinds of Comparative Research. University of
Michigan-Dearborn.
Lutz Group. (1999). Rebuild America Infrastructure Survey. Retrieved April 14, 2003,
from http://rebuildingamerica.org:
Meloy, J. (1994). Writing the Qualitative Dissertation. Hillsdale, NJ: Erlbaum Assoc.
Miles, M., & Huberman, A. (1994). Qualitative Data Analysis. Thousand Oaks, CA:
Sage Publications.
Modernizing Our Schools: What Will It Cost? (2000). Washington, D.C.: NEA.
Murray, T. (2003). Blending Qualitative and Quantitative Research Methods in Thesis
and Dissertations. Thousand Oaks, CA: Corwin Press.
Nardi, P. (2003). Doing Survey Research. Boston MA: Pearson Education.
New School Construction Report. (2004). Harrisburg, PA: Pennsylvania Department of
Education.
NMSA. (January, 2003). NMSA Research Summary #4; Exemplary Middle Schools.
NMSA.

286
Orr, D. (April, 2002). Loving Children: A Design Problem. Design Share.
Ornstein, A.C. (1994). School Finance and the Condition of Schools. Theory Into
Practice 33:118-125.
Patton, M.Q. (2002). Qualitative Evaluation and Research (Third ed.). Thousand Oaks,
CA: Sage Publications.
Public Schools of North Carolina. (January 2000). Making Current Trends in School
Design Feasible. Retrieved from
http://www.schoolclearinghouse.org/pubs/small.PDF
Publication Manual of the American Psychological Association (Fifth ed.). (2002).
Washington, DC: American Psychological Association.
Ragin, C. & Becker, D. (2000). What is Case. Cambridge UK: Cambridge University
Press.
Ragin, C. (1987). The Comparative Method. Berkley, CA: University of California Press.
Rowland, C. (1999). How Old Are America’s Schools? Education Statistics Quarterly
Sanoff, H. (January 2000). A Visioning Process for Designing Responsive Schools. North
Carolina State University: National Clearing House for Educational Facilities.
School 09. (2004). Enrollment Report. Harrisburg, PA: Pennsylvania Department of
Education.
School 15. (1990). Plan Con. Harrisburg, PA: Pennsylvania Department of Education.
School 10. (1999). PlanCon. Harrisburg, PA: Pennsylvania Department of Education.
School 12. (2000). PlanCon. Harrisburg, PA: Pennsylvania Department of Education.
School 9. (1999). Plan Con. Harrisburg, PA: Pennsylvania Department of Education.

287
School Construction Policies and Procedures. (2003). Harrisburg, PA: Pennsylvania
Department of Education.
School Construction Policies and Procedures. (1994). Harrisburg, PA: Pennsylvania
Department of Education.
School Construction Policies and Procedures. (2003). Harrisburg, PA: Pennsylvania
Department of Education.
Scott, R. (1998). Organizations: Rational, Natural, and Open Systems (Fourth ed.).
Upper Saddle River, NJ: Prentice Hall.
Simon, S. (February, 2003). Measurement as a Transformative Tool: The Culture
Assessment. Assessment. 14-18
Stevenson, K. (2002, September). Ten Educational Trends Shaping School Planning and
Design. National Clearinghouse for Educational Facilities.
Sustainable Schools. (December 2000). Sustainable Design for Schools Practical
Applications. Retrieved December 27, 2002, from
http://www.pprc/pubs/topics/schools/apply.html:
Taylor, A. (December 2002). Programming and Design of Schools Within the Context of
Community. Retrieved September 25, 2003, from
http://www.designshare.com/index.php/articles/taylor-program-design/:
Thomas, R.M. (2003). Blending Qualitative & Quantitative Research Methods in Thesis
and Dissertations. Thousand Oaks CA: Corwin Press.
Trochim, W. (2001). The Research Methods Knowledge Base. Cincinnati, OH: Atomic
Dog.

288
U.S. Dept of Ed. (2000) Growing Pains: The Challenge of Overcrowded Schools Is Here
to Stay A Back to School Special Report on the Baby Boom Echo: Growing Pains
(August 21, 2000) SOURCE: U.S. Department of Education, National Center for
Education...http://www.ed.gov/pubs/bbecho00/figure10.html
U.S. Department of Education, National Center for Educational Statistics. Condition of
America’s Public School Facilities: 1999. NCES 2000-032, Lewis, Snow, Farris,
Smerdon, Cronen, and Kaplan. Washington, DC: 2000
U.S. Department of Education. (2000). Schools as Centers of Community: A Citizens
Guide for Planning and Design. Washington, DC: Author
Whole Building Design Guide (2002). Design Objectives: Overview. Section 1, para. 1
Retrieved from
http://www.wbdg.org/DesignPrinciples.asp?Principles=1&Introduction=1
Zakariya, S. (April 1988). Construction is a Hot, New Board Game with Complex Rules
and Gigantic Stakes. American School Board Journal, 27-30.

289
APPENDIX A
Systems Model Survey

290
Survey Instructions Building Level Administrator Reads: You are being asked to participate in a doctoral study that seeks to: (1) describe complicated social, cultural, political, and economic mechanisms at work when public schools are designed and constructed, (2) elaborate on the relationships between those mechanisms and educational facility planning, and (3) cross-validate, through quantitative and qualitative methods, a systems model which formalizes causal inferences between social, cultural, political, and economic mechanisms, educational facility planning, and educational facilities. Permission to conduct this study has been granted by the superintendent of schools and your building principal. However, you are under no obligation to participate. If you choose to participate, you are free to withdraw your consent at any time. Your name will never appear on any survey or research instruments. No identity will be made in the data analysis. All written materials and consent forms will be stored in a locked file in the researcher's home. Your response(s) will only appear in statistical data summaries. All materials will be destroyed at the completion of the research. A summary of the results of this research will be supplied to you, at no cost, upon request. Information on how to request a summary of the results is on your copy of the Voluntary Consent form. I am now providing you with two copies of the Voluntary Consent form and the survey. If you agree to participate please sign one of the Voluntary Consent forms and return it to me. Please retain the other for your records. (Please place the Voluntary Consent forms in the envelope marked “Voluntary Consent Forms). All Voluntary Consent forms will be kept separate from the surveys. In a minute, I am going to ask you to complete the survey. However, before you do you may now complete the survey. Please do sign or place your name anywhere on the survey form.

291
Survey Questions 1. What best describes how you currently serve the student population of this building?
(A) Teacher (B) Administrator/Counselor/ (C) Other Nurse/Librarian/Or Other PA Certified Professional
2. How many years have you been employed by the district?
(A) 0-5 (B) 6-10 (C) 11-15 (D) 16-20 (E) 20+ 3. How many years have you taught in this building?
(A) 0-3 (B) 4-6 (C) 7-9 (D) 10-12 4. Did you move into the building the year it opened? (1) Yes (2) No 5. Were you involved in the planning process for this facility? (1) Yes (2) No Strongly Somewhat Somewhat Strongly Disagree Disagree Disagree Agree Agree Agree 6. This school has a shared sense 1 2 3 4 5 6 of purpose and a focus on what is most important for students. 7. This facility (building) contributes 1 2 3 4 5 6 to a shared sense of purpose and a focus on what is most important for students. 8. Those responsible for planning 1 2 3 4 5 6 this building understood the size, composition, and needs of the student body. 9. Those responsible for planning 1 2 3 4 5 6 this building understood principles and methods of instruction. 10. Those responsible for planning 1 2 3 4 5 6 this building understood values, attitudes, beliefs, standards, traditions, and customs of the school district and community. 11. Those responsible for planning 1 2 3 4 5 6 this building understood the economics of the school district and community.

292
Strongly Somewhat Somewhat Strongly Disagree Disagree Disagree Agree Agree Agree 12. Those responsible for planning 1 2 3 4 5 6 this building understood the relationships between educators, elected officials, parents, community groups, and citizens within the community. 13. The architect and design 1 2 3 4 5 6 professionals who designed and built this building understood the needs of the school district and community. 14. Overall those responsible 1 2 3 4 5 6 for planning this building understood the physical, social, cultural, economic, and instructional needs of the school district and community. 15. This building meets the needs of 1 2 3 4 5 6 faculty, staff, students, and the community. Strongly Somewhat Somewhat Strongly Disagree Disagree Disagree Neither Agree Agree Agree 16. There is a shared sense of 1 2 3 4 5 6 7 purpose among educators in this school. 17. There is a shared sense of 1 2 3 4 5 6 7 purpose among parents in this school. 18. There is a shared sense of 1 2 3 4 5 6 7 purpose among students in this school. 19. There is a shared sense of 1 2 3 4 5 6 7 purpose within the community regarding this school. 20. There is a focus on what is 1 2 3 4 5 6 7 most important for students among educators in this school. 21. There is a focus on what is 1 2 3 4 5 6 7 most important for students among parents/guardians of this school.

293
Strongly Somewhat Somewhat Strongly Disagree Disagree Disagree Neither Agree Agree Agree 22. There is a focus on what is 1 2 3 4 5 6 7 most important for students within the community of this school. 23. Students in this school 1 2 3 4 5 6 7 understand their importance in the learning process. 24. Educators, parents, students, 1 2 3 4 5 6 7 and members of the community have a share sense of responsibility for student learning. 25. Our school building helps 1 2 3 4 5 6 7 promote a sense of shared purpose among educators. 26. Our school building helps 1 2 3 4 5 6 7 promote a sense of shared purpose among parents. 27. Our school building helps 1 2 3 4 5 6 7 promote a sense of shared purpose within the community. 28. Our school building promotes 1 2 3 4 5 6 7 focus on what is important for students. 29. Our school building helps 1 2 3 4 5 6 7 students become active learners. 30. Our school building helps 1 2 3 4 5 6 7 teachers meet the needs of students. 31. Planning this facility 1 2 3 4 5 6 7 required a detailed understanding of teaching and learning.
32. Those responsible for 1 2 3 4 5 6 7 planning and constructing this facility understood teaching and learning. 33. Teaching and learning 1 2 3 4 5 6 7 impacted the final design of this facility.

294
Strongly Somewhat Somewhat Strongly Disagree Disagree Disagree Neither Agree Agree Agree 34. Planning this facility 1 2 3 4 5 6 7 required a detailed understanding of size, composition, and needs of the student body.
35. Those responsible for 1 2 3 4 5 6 7 planning and constructing this facility understood the size, composition, and needs of the student body. 36. The composition and needs 1 2 3 4 5 6 7 of the student body impacted the final design of this facility. 37. Planning this facility 1 2 3 4 5 6 7 required a detailed understanding of economics of the community. 38. Those responsible for 1 2 3 4 5 6 7 planning and constructing this facility understood the economics of the community.
39. The economics of the 1 2 3 4 5 6 7 community impacted on the final design of this facility. 40. Planning this facility 1 2 3 4 5 6 7 required a detailed understanding of the relationships between educators, elected officials, parents, community groups, and citizens within the community. 41. Those responsible for 1 2 3 4 5 6 7 planning and constructing this facility understood the relationships between educators, elected officials, parents, community groups, and citizens within the community.

295
Strongly Somewhat Somewhat Strongly Disagree Disagree Disagree Neither Agree Agree Agree 42. The relationships between 1 2 3 4 5 6 7 educators, elected officials, parents, community groups, and citizens within the community impacted the final design of this building. 43. Planning this facility 1 2 3 4 5 6 7 required a detailed understanding of the values, beliefs, attitudes, standards, traditions, customs of the school district and community. 44. Those responsible for 1 2 3 4 5 6 7 planning and constructing this facility understood the values, beliefs, attitudes, standards, traditions, customs of the school district and community. 45. The values, beliefs, attitudes, 1 2 3 4 5 6 7 standards, traditions, customs of the school district and community impacted on the final design of this facility. 46. This school building helps 1 2 3 4 5 6 7 promote a sense of community. 47. This building helps promote 1 2 3 4 5 6 7 promote a sense of school pride. 48. Planning this facility required 1 2 3 4 5 6 7 the architects and design professionals to have a detailed understanding of the needs of the school district and community. 49. The architect and design 1 2 3 4 5 6 7 professionals responsible for planning and constructing this facility understood the needs of the school district and community.

296
Strongly Somewhat Somewhat Strongly Disagree Disagree Disagree Neither Agree Agree Agree 50. The architect and design 1 2 3 4 5 6 7 professionals understanding the needs of the school district and community impacted the final design of this facility. 51. Planning this facility 1 2 3 4 5 6 7 4required a detailed understanding of the interaction between educational, economic, political, and social forces at work in this school district and community. 52. Those responsible for 1 2 3 4 5 6 7 planning and constructing this facility understood the interaction between educational, economic, political, and social forces at work in this school district. 53. Those responsible for 1 2 3 4 5 6 7 planning and constructing this facility understood the interaction between educational, economic, political, and social forces at work in this school and reflected those relationships in the design of the facility. 54. Our facility meets the needs 1 2 3 4 5 6 7 of teachers. 55. This facility meets the needs 1 2 3 4 5 6 7 of students. 56. This facility meets the needs 1 2 3 4 5 6 7 of the community. 57. This school has an educational 1 2 3 4 5 6 7 vision.
58. This school building is a 1 2 3 4 5 6 7 physical representation of the school’s vision.

297
Strongly Somewhat Somewhat Strongly Disagree Disagree Disagree Neither Agree Agree Agree 59. Those responsible for 1 2 3 4 5 6 7 planning this facility managed the physical, social, pedagogical, cultural, and economic components of the school district and community. 60. Since the opening of this building, has it been used as intended by the designers?
(1) Yes (2) No 61. Since the opening of this building have there been any sudden changes in the teaching practices? (1) Yes (2) No 62. Since the opening of this building have there been any sudden changes in the size, composition, and/or needs of the student body? (1) Yes (2) No 63. Since the opening of this building have there been any sudden changes in the economics of the community? (1) Yes (2) No 64. Since the opening of this building have there been any sudden changes in the relationships between educators, elected officials, parents, community groups, and citizens within the community? (1) Yes (2) No 65. Since the opening of this building have there been any sudden changes in the values, beliefs, attitudes,
standards, traditions, customs the school district and community? (1) Yes (2) No

298
APPENDIX B Standardized Open Ended Interview

299
Interview Instructions Principal Researcher Reads: You are being asked to participate in a doctoral study that seeks to: (1) describe complicated social, cultural, political, and economic mechanisms at work when public schools are designed and constructed, (2) elaborate on the relationships between those mechanisms and educational facility planning, and (3) cross-validate, through quantitative and qualitative methods, a systems model which formalizes causal inferences between social, cultural, political, and economic mechanisms, educational facility planning, and educational facilities. The significance of this… Permission to conduct this study has been granted by the superintendent of schools and your building principal. However, you are under no obligation to participate. If you choose to participate, you are free to withdraw your consent at any time. Your name will never appear on any survey or research instruments. No identity will be made in the data analysis. All written materials and consent forms will be stored in a locked file in the researcher's home. Your response(s) will only appear in statistical data summaries. All materials will be destroyed at the completion of the research. The interview will be taped. Once taping begins please refrain from using your name or the names of other individuals. If by accident a name is used, it will be stricken form the record. Again, no identity will be made in the data analysis. The consent forms will be stored in a locked file in the researcher's home separate from the transcript of this interview. All materials will be destroyed at the completion of the research A summary of the results of this research will be supplied to you, at no cost, upon request. Information on how to request a summary of the results is on your copy of the Voluntary Consent form. I am now providing you with two copies of the Voluntary Consent form. If you agree to participate please sign one form and return it to me. Please retain the other for your records. Assuming Consent, Principal Researcher Reads: I am beginning to tape our conversation: “Now” (Tape player on). Today’s date is (Month, Day, Year). This is an interview is being conducted by Fred S. Withum III as partial fulfillment of the requirements for the doctoral degree in educational leadership at Duquesne University. I am going to ask you 12 questions. These are the same 12 questions asked of all participants in the study. The first five questions are followed by choices. The remaining seven questions are open-ended. However, I may use a prompt

300
in order for you to expand an answer or to seek further clarification for my benefit. Again, you are under no obligation to participate in this study. You are free to withdraw your consent to participate at any time. And please refrain from using your name or the name of any other individual during this interview. I will now begin a series of 12 questions. Remember, for the first five questions please wait for the choices. Interview Questions 1. What best describes how you currently serve the student population of this building?
(A) Teacher (B) Administrator/Counselor/ (C) Other Nurse/Librarian/Or Other PA Certified Professional
2. How many years have you been employed by the school district?
(A) 0-5 (B) 6-10 (C) 11-15 (D) 16-20 (E) 20+ 3. How many years have you taught in this building?
(A) 0-3 (B) 4-6 (C) 7-9 (D) 10-12 4. Did you move into the building the year it opened? (1) Yes (2) No 5. Were you involved in the planning process for this facility? (1) Yes (2) No 1. Do you believe that this school has a shared sense of purpose and a focus on what is most important for students?
a. Can you provide any examples to illustrate your beliefs? 2. Can what you described be considered the educational vision of this school?
a. If yes, why? b. If not, can you describe what you believe the educational vision of this
school is? 3. Do you think that this facility (building) contributes to a shared sense of purpose
and a focus on what is most important for students?
a. Can you provide any examples to illustrate your beliefs? b. Do you think this building physically represents the educational vision you
described in question six? Why?

301
4. Overall do you believe that this building meets the needs of those who use it?
a. Does the building meet the needs of educators? b. Does the building meet the needs of students? c. Does the building meet the needs of parents? d. Does the building meet the needs of the community?
5. What type of factors, both in the school district and/or community, influenced the final design of this building?
a. Do you believe the size, composition, and needs of the student body
impacted the final design of the building? b. Do you believe instructional methods and strategies employed by
educators in this school impacted the final design of the building? c. Do you believe that the values, attitudes, beliefs, standards, traditions, and
customs of the school district and community impacted the final design of this building?
d. Do you believe that the relationships between educators, elected officials, parents, community groups, and citizens within the community influenced the final design of this building?
e. Do you believe the economy of the school district and community impacted the final design of the building?
f. Do you believe the degree to which the architect and design professionals understood the needs of the school district and community impacted on the final design of the building?
g. Can you think of any other factors that influenced the final design of this building?
6. Do you believe that overall those responsible for planning this building understood
the physical, social, cultural, economic, instructional needs of the school district and community?
7. In the end the resources and materials needed to build this facility came from
outside the school district, in your opinion, did the community provide the school district enough materials and resources to construct a facility that meets the needs of educators, students, and the community.
a. If yes, why? b. If not, why? c. Can you provide any examples to illustrate your beliefs?