Eddy Current Testing of Thick Aluminum Plates with Hidden Cracks...
8
EDDY CURRENT TESTING OF THICK ALUMINUM PLATES WITH HIDDEN CRACKS R. Sikora 1 ' 2 , T. Chady 1 , S. Gratkowski 1 , M. Komorowski 1 , and K. Stawicki 1 Electrical Engineering Faculty, Technical University of Szczecin, ul. Sikorskiego 37, 70-313 Szczecin, Poland 2 Institute of Electrical Engineering, ul. Pozaryskiego 28, 04-703 Warsaw, Poland ABSTRACT. In this paper we present theoretical analysis which gives the possibility to determine optimum excitation frequencies in eddy current examination of thick aluminum plates. A computer controlled non-destructive testing system and a probe with a magnetoresistive sensor were utilized in laboratory tests. Experiments with specimens containing hidden cracks were carried out for a wide spectrum of frequencies. The optimum operating frequencies achieved from the experiments are in a very good agreement with those obtained by using theoretical analysis. Application of the optimum frequencies makes it possible to detect shallow cracks located on the reverse side of the specimens. Detection of a 15 % crack in a 10 mm thick plate made of aluminum and a 20 % crack in a 20 mm thick plate has been confirmed. INTRODUCTION Eddy current testing is one of the main techniques that are used for the non- destructive examination of metallic plates for defects such as hidden cracks and corrosion. The practice of eddy current testing consists of exciting an alternating current at a given frequency through a coil located near to the electrically conducting object being tested, and thus to induce eddy currents in the latter. As a result of the presence of defects, changes take place in the components of the associated magnetic field, which can be detected, e.g., as in our case, by a magnetoresistive (MR) sensor. Interpretation of magnetic field data in terms of flaw size, shape and position is dependent upon having a theoretical understanding of how the defects affect the induced current and hence perturb the associated magnetic field. The induced eddy currents are not uniformly distributed throughout the material. The skin effect causes the currents to be concentrated near the surface adjacent to the excitation coil. The effect increases with increasing excitation frequency. Generally speaking, the eddy current probes are more useful for surface testing, and for subsurface testing, lower frequencies are necessary, and in consequence this leads to multi-frequency measurements. In this paper we present theoretical analysis which gives the possibility to determine optimum excitation frequencies in eddy current examination of thick aluminum plates. A computer controlled non-destructive testing system and a probe with a MR sensor were utilized in laboratory tests. Experiments with specimens containing hidden cracks were carried out for a wide spectrum of frequencies. The optimum frequencies achieved from the experiments are in a very good agreement with those obtained by using theoretical analysis. CP657, Review of Quantitative Nondestructive Evaluation Vol. 22, ed. by D. O. Thompson and D. E. Chimenti © 2003 American Institute of Physics 0-7354-0117-9/03/$20.00 427
Transcript of Eddy Current Testing of Thick Aluminum Plates with Hidden Cracks...
EDDY CURRENT TESTING OF THICK ALUMINUM PLATES WITHHIDDEN CRACKS
R. Sikora1'2, T. Chady1, S. Gratkowski1, M. Komorowski1, and K. Stawicki1
Electrical Engineering Faculty, Technical University of Szczecin, ul. Sikorskiego 37,70-313 Szczecin, Poland
2Institute of Electrical Engineering, ul. Pozaryskiego 28, 04-703 Warsaw, Poland
ABSTRACT. In this paper we present theoretical analysis which gives the possibility to determineoptimum excitation frequencies in eddy current examination of thick aluminum plates. A computercontrolled non-destructive testing system and a probe with a magnetoresistive sensor were utilized inlaboratory tests. Experiments with specimens containing hidden cracks were carried out for a widespectrum of frequencies. The optimum operating frequencies achieved from the experiments are in avery good agreement with those obtained by using theoretical analysis. Application of the optimumfrequencies makes it possible to detect shallow cracks located on the reverse side of the specimens.Detection of a 15 % crack in a 10 mm thick plate made of aluminum and a 20 % crack in a 20 mmthick plate has been confirmed.
INTRODUCTION
Eddy current testing is one of the main techniques that are used for the non-destructive examination of metallic plates for defects such as hidden cracks and corrosion.The practice of eddy current testing consists of exciting an alternating current at a givenfrequency through a coil located near to the electrically conducting object being tested, andthus to induce eddy currents in the latter. As a result of the presence of defects, changestake place in the components of the associated magnetic field, which can be detected, e.g.,as in our case, by a magnetoresistive (MR) sensor. Interpretation of magnetic field data interms of flaw size, shape and position is dependent upon having a theoretical understandingof how the defects affect the induced current and hence perturb the associated magneticfield. The induced eddy currents are not uniformly distributed throughout the material. Theskin effect causes the currents to be concentrated near the surface adjacent to the excitationcoil. The effect increases with increasing excitation frequency. Generally speaking, theeddy current probes are more useful for surface testing, and for subsurface testing, lowerfrequencies are necessary, and in consequence this leads to multi-frequency measurements.
In this paper we present theoretical analysis which gives the possibility to determineoptimum excitation frequencies in eddy current examination of thick aluminum plates. Acomputer controlled non-destructive testing system and a probe with a MR sensor wereutilized in laboratory tests. Experiments with specimens containing hidden cracks werecarried out for a wide spectrum of frequencies. The optimum frequencies achieved from theexperiments are in a very good agreement with those obtained by using theoretical analysis.
CP657, Review of Quantitative Nondestructive Evaluation Vol. 22, ed. by D. O. Thompson and D. E. Chimenti© 2003 American Institute of Physics 0-7354-0117-9/03/$20.00
427

EDDY-CURRENT PROBE AND MEASUREMENT SYSTEM
Figure la shows a cross section of the probe considered in this paper [1]. The probeincludes an exciting coil (1) wound around a hollow cylindrical ferrite core (2), andsupplied with an alternating current. The MR sensor (3) is placed inside the core directlyover a surface of the tested conducting plate (4) having a defect (5). Such a location of theMR sensor protects the sensor from the working magnetic field and results in highersensitivity to small changes in the magnetic field caused by surface and subsurface defects.The whole is covered with an electromagnetic aluminum screen (6). The exciting coil isseparated from the electromagnetic screen by an insulating sheath (7). Lead-in wires (8) arebrought out through a hole in the electromagnetic screen. Simple construction of the probeenables its miniaturization, thereby enhancing the spatial resolution of measurements.
Figure Ib presents a block diagram of the measurement system. The system wasconstructed at the Chair of Theoretical Electrotechnics & Computer Science, TechnicalUniversity of Szczecin, Poland. Function synthesizer (Agilent 3120A) supply the excitationcoil. The MR sensor is energized by a DC voltage from a power supply. The output of theMR sensor is connected with an instrumentation amplifier (CA-251F4 manufactured byNF). The amplified signal is converted into digital form by an A/D converter (DA4020,manufactured by Computer Boards). The computer further precedes the resulting discretesignal. In order to remove the interference of noises and to extract the amplitude of therequired frequency components, the FFT algorithm is utilized. The resulting signals areused to create spectrograms. The spectrogram is a two-dimensional display of the relativeamplitude of the output signal frequency components versus the sensor position [2]. Theprobe is scanned over a surface of the specimen in x and y directions by using an x, yscanner coupled with a personal computer. Computer programs are used to set the scan areaand velocity of the probe and to collect data.
FIGURE 1. Measuring system: a) cross section of the probe (not in scale), b) block diagram of themeasurement system
428
OPTIMUM EXCITATION FREQUENCIES
In eddy-current nondestructive testing, time varying magnetic fields are producedby excitation coils located close to a conducting specimen being tested. Induced eddycurrents have the advantage of penetrating into subsurface regions and therefore beingsensitive to their condition. The presence of flaws can be determined by monitoring thechange in magnetic field over a surface of the specimen. However, the penetration of an acmagnetic field into the specimen is approximately exponentially attenuated with acharacteristic decay distance given by the well-known formula for skin depth:
(1)
where a is the conductivity, co = 2nf is the angular frequency, and ju, is the magneticpermeability. It is obvious that in order to detect deep flaws, low excitation frequencies arerequired to achieve a sufficient penetration depth. Thus, one would feel intuitively that byperforming surface magnetic field measurements at many excitation frequencies it could bepossible to acquire wide-bandwidth information that can quantitatively characterize thewhole specimen. High frequency measurements would respond to the regions near thesurface, whereas low frequency measurements would respond to the regions at greaterdepth.
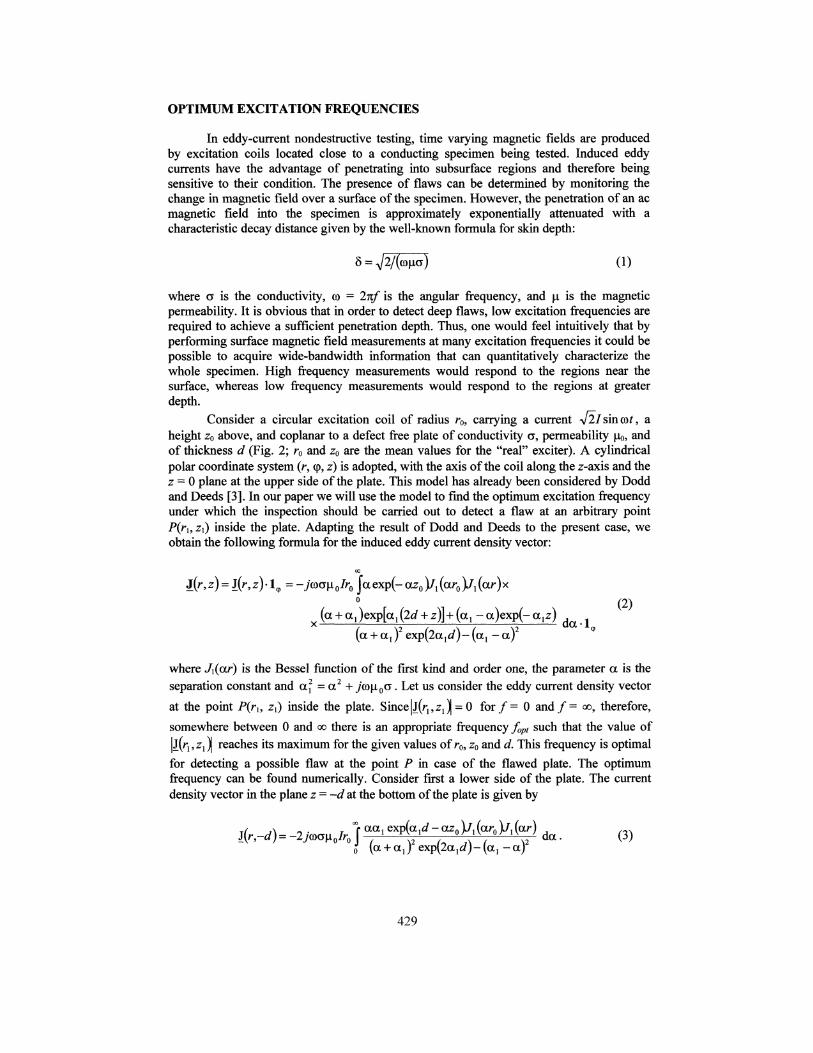
Consider a circular excitation coil of radius r0, carrying a current Vl/ sin oof, aheight z0 above, and coplanar to a defect free plate of conductivity a, permeability Uo, andof thickness d (Fig. 2; r0 and z0 are the mean values for the "real" exciter). A cylindricalpolar coordinate system (r, (p, z) is adopted, with the axis of the coil along the z-axis and thez = 0 plane at the upper side of the plate. This model has already been considered by Doddand Deeds [3]. In our paper we will use the model to find the optimum excitation frequencyunder which the inspection should be carried out to detect a flaw at an arbitrary pointP(rl9 zO inside the plate. Adapting the result of Dodd and Deeds to the present case, weobtain the following formula for the induced eddy current density vector:
j(r, z) = j(r, z) • 19 = -yttajj, 0/r0 Ja exp(- az0 X (ar0 ]jl (ar ) x(2)
(a + a{ )2 &xp(2ald)- (a! - a)2
where J\(ar) is the Bessel function of the first kind and order one, the parameter a is theseparation constant and a2 = a2 + 7'o|i0a - Let us consider the eddy current density vectorat the point P(rb Zi) inside the plate. Since | j(r1? zl )| = 0 for/= 0 and/= oo, therefore,somewhere between 0 and oo there is an appropriate frequency fopt such that the value ofiJ^Zj)! reaches its maximum for the given values of r0, z0 and d. This frequency is optimalfor detecting a possible flaw at the point P in case of the flawed plate. The optimumfrequency can be found numerically. Consider first a lower side of the plate. The currentdensity vector in the plane z = -d at the bottom of the plate is given by
r !•0/r0 JJ
, exp(a,d-ozft i n i ,l PV * da 'x /0J (a + a, ) exp(2aj d)- (o^ - a)
429

FIGURE 2. Circular excitation coil above a conducting plate
For the excitation coil with radius r0 = 10 mm, placed at height z0 = 8 mm above the plate,having 200 turns and supplied by an alternating current of rms value equal to 60 mA, themodule of the eddy current density vector at the bottom of the 20 mm thick plate made ofaluminum (conductivity a = 35 MS/m) depends on the excitation frequency / and thedistance from the axis z as in Fig. 3. The module of the eddy current density vector reachesits global maximum forfopt = 68 Hz and r = 16 mm, and the conclusion is that under such afrequency the inspection of the bottom of the plate should be carried out. The optimumfrequency/ip, corresponds to the optimum skin depth8opt = l/Jnfoptii0G , and we havefound that §opt is an approximate linear function of the aluminum plate thickness d (Fig. 4).
0.04 10000,02
r (m)0 0 Frequency, /(Hi)
FIGURE 3. Module of the eddy current density vector at the bottom of the plate as a function of frequencyand distance from the axis z ~ 0
430

12
101
0
/0,,-38Hz
0 5 10 15 20 25 30Thickness of the aluminum plate, d (mm)
FIGURE 4. Optimum skin depth for the inspection of the bottom of the plate as a function of plate thickness
Multi-frequency eddy current method gives the possibility to detect flaws in the wholeinterior of a conducting plate without the need to change the testing parameters. One canfind the frequency band necessary to reconstruct the interior of the plate by using (2). Forgiven values of r0, z0, r, d and 0 > z > -d we look for/ for which the module of the currentdensity vector reaches its maximum at the chosen value of z. The result is shown in Fig. 5.
*
300-
250 H
200 H
J 150 H
1004 6
-z, (mm)10
FIGURE 5. Optimum frequencies to detect flaws in the whole interior of the aluminum plate (the frequencyband: 132^-298 Hz), d= 10 mm, r0 = 10 mm, z0 = 8 mm, r = 15 mm
431
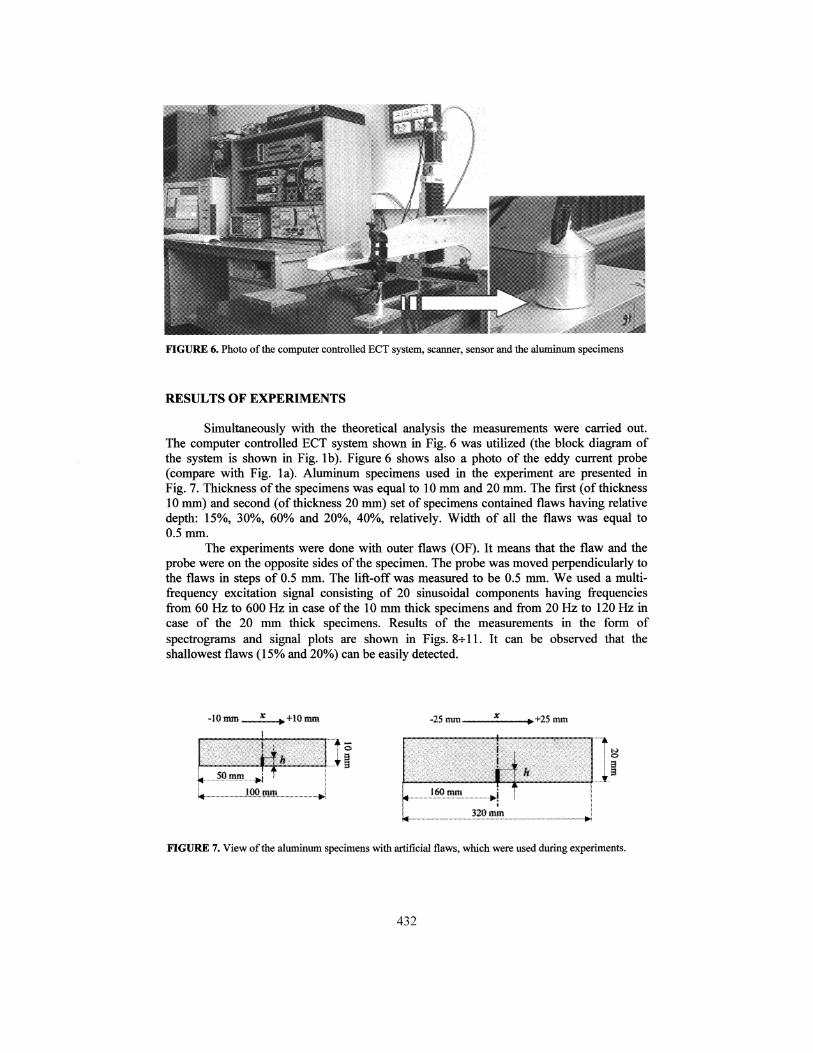
FIGURE 6. Photo of the computer controlled ECT system, scanner, sensor and the aluminum specimens
RESULTS OF EXPERIMENTS
Simultaneously with the theoretical analysis the measurements were carried out.The computer controlled ECT system shown in Fig. 6 was utilized (the block diagram ofthe system is shown in Fig. Ib). Figure 6 shows also a photo of the eddy current probe(compare with Fig. la). Aluminum specimens used in the experiment are presented inFig. 7. Thickness of the specimens was equal to 10 mm and 20 mm. The first (of thickness10 mm) and second (of thickness 20 mm) set of specimens contained flaws having relativedepth: 15%, 30%, 60% and 20%, 40%, relatively. Width of all the flaws was equal to0.5 mm.
The experiments were done with outer flaws (OF). It means that the flaw and theprobe were on the opposite sides of the specimen. The probe was moved perpendicularly tothe flaws in steps of 0.5 mm. The lift-off was measured to be 0.5 mm. We used a multi-frequency excitation signal consisting of 20 sinusoidal components having frequenciesfrom 60 Hz to 600 Hz in case of the 10 mm thick specimens and from 20 Hz to 120 Hz incase of the 20 mm thick specimens. Results of the measurements in the form ofspectrograms and signal plots are shown in Figs. 8-rll. It can be observed that theshallowest flaws (15% and 20%) can be easily detected.
-10 mm ......,.,....* fc*io tarnI
-25 mm———£———*+2S mm
!^^«^^^^^^^^^^^tf
*.............JM.!»«L...................J
::;SOT«5?W
i
11j .....,...J:Q.iMiL....,.jpj
l ._............,.,..........lii.rom,,.,.,TO.......,,,.....,,...J
L 320 mmi?q.——,—.———„..,————
FIGURE 7. View of the aluminum specimens with artificial flaws, which were used during experiments.
432

OF3i% Ofii%
i (MM) i iFIGURE 8. Spectrograms: plots of the signal module as a function of frequency and the sensor position(aluminum specimen, thickness 10 mm, outer flaws having width of 0.5 mm).
0.7
0.6
£T 0.5& 0.4
| 0.3
'"ft 0.2
< 0.1
-0.10 5
x(mm)10 15
0.7
0.6
0-50.4
0.3
0.20.1
0
-0.1100 500 600200 300 400
Frequency (Hz)FIGURE 9. Plot of the signal module as a function the sensor position (measured for the optimal frequency)and frequency characteristics obtained for the flaw having different depth (aluminum specimen, thickness10 mm, outer flaws having width of 0.5 mm).
% %
:t (MM) ;& (MM)FIGURE 10. Spectrograms: plots of the signal module as a function of frequency and the sensor position(aluminum specimen, thickness 20 mm, outer flaws having width of 0.5 mm)
0.3
0.25
0.2
0.15
0.05
0
.........
-£
r. ........
.....yf
.
..........
•—"•*
—— OF 20%-.. OF 40% -
\........*
•—-••ii
.......
-\*<
3 20 40 60 80 100 12Frequency (Hz)
FIGURE 11. Plot of the signal module as a function the sensor position (measured for the optimal frequency)and frequency characteristics obtained for the flaw having different depth (aluminum specimen, thickness10 mm, outer flaws having width of 0.5 mm).
433

100 200 300Frequency (Hz)
400 500
FIGURE 12. Comparison of the curve representing maximal module of the calculated eddy current densityat the bottom of the plate and the frequency characteristic obtained as a result of measurements (aluminumspecimen, thickness 20 mm, outer flaw having width of 0.5 mm and relative depth of 20%). All plotsnormalized to maximal values.
Figure 12 shows the dependence on frequency of the maximal module of the eddycurrent density vector at the bottom of the plate obtained from equation (2) and themeasured output signal caused by the outer flaw having depth of 20% in case of the 20 mmthick aluminum plate. Both the curves are normalized to the maximal values. As apparentlyseen in Fig. 12, there is a strong coincidence between results of theoretical analysis andmeasurements.
CONCLUSIONS
Compared to traditional eddy current methods, multi-frequency eddy-currenttechnique offers a considerable advantage. This is the ability to detect flaws in the wholeinterior of a conducting body without the need to change the probe. Experiments withspecimens containing hidden cracks were carried out for a wide spectrum of frequencies.The optimum operating frequencies achieved from the experiments are in a very goodagreement with those obtained by using theoretical analysis.
ACKNOWLEDGEMENTS
This work is supported in part by the State Committee for Scientific Research,Poland, under the Grant no: 8T10A 020 20.
REFERENCES
1. Sikora, R., Gratkowski, S., Komorowski, M., Pacuk, J., Enokizono, M., Chady, T. andKliem, H., in Review of Progress in QNDE, Vol. 20A, eds. D. O. Thompson and D. E.Chimenti, AIP Conference Proceedings 557, Melville, New York, 2001, pp. 977-984.
2. Chady T., Enokizono M., Todaka T., Tsuchida Y., Sikora R. in IEEE Transactions onMagnetics, Vol. MAG-35, No.5, pp. 3655-3657,1999.
3. Dodd, C. V. and Deeds, W. E., J. Appl. Phys. 39, 2829 (1968).
434