EdData II Task Order 7 Early Grade Reading and Mathematics in Rwanda · EdData II TO 7—Early...
57
EdData II Task Order 7 Early Grade Reading and Mathematics in Rwanda FINAL REPORT EdData II Technical and Managerial Assistance, Task Number 7 Contract Number EHC-E-07-04-00004-00Strategic Objective 3 RTI Project No. 0209354.007.006.006 February 2012 This publication was produced for review by the United States Agency for International Development. It was prepared by RTI International.
Transcript of EdData II Task Order 7 Early Grade Reading and Mathematics in Rwanda · EdData II TO 7—Early...
EdData II
Task Order 7 Early Grade Reading and Mathematics in Rwanda
FINAL REPORT
EdData II Technical and Managerial Assistance, Task Number 7 Contract Number EHC-E-07-04-00004-00Strategic Objective 3 RTI Project No. 0209354.007.006.006
February 2012
This publication was produced for review by the United States Agency for International
Development. It was prepared by RTI International.
Task Order 7 Early Grade Reading and Mathematics in Rwanda
Prepared for Bureau for Economic Growth, Agriculture, and Trade (EGAT/ED), United States Agency for International Development (USAID); and USAID/Rwanda Prepared by Joseph DeStefano, Wendi Ralaingita, Michael Costello, Alexander Sax, and Abigail Frank RTI International 3040 Cornwallis Road Post Office Box 12194 Research Triangle Park, NC 27709-2194 RTI International is a trade name of Research Triangle Institute.
The authors’ views expressed in this publication do not necessarily reflect the views of the United States Agency for International Development or the United States Government.

EdData II TO 7—Early Grade Reading and Mathematics in Rwanda iii
Table of Contents Page
List of Figures ............................................................................................................................ iv
List of Tables .............................................................................................................................. iv
Abbreviations ............................................................................................................................. vi
Acknowledgments ..................................................................................................................... vii
Introduction ................................................................................................................................. 1
How Well Are Students Learning to Read in Kinyarwanda? ........................................................ 3
Oral Reading Fluency and Comprehension ........................................................................... 3
Literacy Skill Areas in Kinyarwanda ....................................................................................... 5
How Well Are Students Learning to Read in English? ................................................................. 7
Oral English Language Comprehension in P4 ....................................................................... 9
Literacy Skill Areas in English ............................................................................................. 10
How Well Are Students Learning Mathematics? ........................................................................ 11
What Is Happening in Rwandan Primary Schools? ................................................................... 14
Which Factors Are Most Strongly Associated with Better Student Performance? ...................... 17
School Environment ............................................................................................................ 20
Home Environment ............................................................................................................. 20
Socioeconomic Status ......................................................................................................... 20
Conclusions .............................................................................................................................. 21
Annex A. Further Discussion of the Students and Schools Included in the Sample .............. A-1
Annex B. Reliability of EGRA/EGMA Instruments ................................................................ B-1
Annex C. Sample Items from EGRA and EGMA Instruments ............................................... C-1
Annex D. Detailed Statistical Results from EGRA and EGMA Instruments ........................... D-1
iv EdData II TO 7—Early Grade Reading and Mathematics in Rwanda
List of Figures Figure 1. Kinyarwanda Oral Reading Fluency (ORF) – P4 and P6 (Beginning of
Academic Year) ....................................................................................................... 4
Figure 2. Kinyarwanda Reading Comprehension Levels – P4 and P6 (Beginning of Academic Year) – Percent Correct / Attempted ....................................................... 5
Figure 3. English Oral Reading Fluency (ORF) – P6 (Beginning of Academic Year)............... 8
Figure 4. English Comprehension – P6 (Beginning of Academic Year) .................................. 9
Figure 5. Relative Impact on Kinyarwanda Oral Reading Fluency of the Listed Factors ........19
Figure 6. SES and Reading Performance ..............................................................................21
Figure B-1. Screeplot of Eigenvalues for Principal Components 1, “English early grade reading skill,” and Other Potential Principal Components ..................................... B-5
Figure B-2. Screeplot of Eigenvalues for Principal Components 1, “Kinyarwanda early grade reading skill,” and Other Potential Principal Components, All of Which Have Eigenvalues of Less Than 1 ........................................................................ B-6
Figure B-3. Screeplot of Eigenvalues for Principal Components 1, “P4 early grade mathematics skill,” and Other Potential Principal Components, All of Which Have Eigenvalues of Less Than 1 ........................................................................ B-6
Figure B-4. Screeplot of Eigenvalues for Principal Components 1, “P6 Early Grade Mathematics Skill,” and Other Potential Principal Components, All of Which Have Eigenvalues of Less Than 1 ........................................................................ B-7
List of Tables Table 1. Summary of the Survey Sample .............................................................................. 2
Table 2. Average Student Performance in Kinyarwanda Literacy Skill Areas, by Grade ........ 6
Table 3. Average Student Performance in English Literacy Skill Areas, P6 ..........................10
Table 4. Mean Scores for P4 and P6 EGMA Subtasks That Assessed Automaticity ............12
Table 5. Mean Scores for Untimed P4 and P6 EGMA Subtasks ...........................................13
Table 6. Content of “Reading” Lessons ................................................................................15
Table 7. Additional Materials ................................................................................................16
Table 8. Characteristics of Nonreaders and Good Readers ..................................................18
Table A-1. Schools and Students in the Sample, by District ...................................................... 1
Table A-2. Students in the Sample, by Gender ......................................................................... 2
Table A-3. Student Support at Home ........................................................................................ 3
Table B-1. Reliability Analysis of P6 English EGRA .................................................................. 1
Table B-2. Reliability Analysis of P6 EGRA: Fluency Measures ................................................ 2
EdData II TO 7—Early Grade Reading and Mathematics in Rwanda v
Table B-3. Reliability Analysis of Kinyarwanda EGRA............................................................... 2
Table B-4. Reliability Analysis of P4 EGMA .............................................................................. 3
Table B-5. Reliability analysis of P6 EGMA ............................................................................... 3
Table B-6. Principal Components Analyses: EGRA .................................................................. 4
Table B-7. Principal Component Analyses: EGMA .................................................................... 4
Table D-1. Detailed Results – English EGRA P4 – Overall Results and Results by Gender .................................................................................................................... 1
Table D-2. Detailed Results – English EGRA P6 – Overall Results and Results by Gender .................................................................................................................... 2
Table D-3. Detailed Results – Kinyarwanda EGRA P4 – Overall Results and Results by Gender .................................................................................................................... 3
Table D-4. Detailed Results – Kinyarwanda EGRA P6 – Overall Results and Results by Gender .................................................................................................................... 4
Table D-5. Detailed Results – EGMA P4 – Overall Results and Results by Gender .................. 5
Table D-6. Detailed Results - EGMA P6 – Overall Results and Results by Gender ................... 6
Table D-7. Detailed Results – Factors Showing Correlation with Kinyarwanda Oral Reading Fluency...................................................................................................... 7
vi EdData II TO 7—Early Grade Reading and Mathematics in Rwanda
Abbreviations EGAT/ED USAID’s Office of Education in the Bureau of Economic Growth, Agriculture,
and Trade
EGMA Early Grade Mathematics Assessment
EGRA Early Grade Reading Assessment
GDP gross domestic product
ORF oral reading fluency
RTI RTI International (trade name of Research Triangle Institute]
SES socioeconomic status
SSME Snapshot of School Management Effectiveness
USAID United States Agency for International Development
wpm words per minute
EdData II TO 7—Early Grade Reading and Mathematics in Rwanda vii
Acknowledgments The authors wish to acknowledge the important contributions of the numerous people
who made this study possible. Brian Frantz, Molly Brostrom, Liliane Niyubahwe, Carrie
Antal, and David Rurangirwa, of USAID/Rwanda, provided valuable guidance and
support during preparation, implementation, and presentation of this study. Many
departments and staff from the Ministry of Education also provided important
contributions to the development and implementation of this study and helped assure that
the instruments and methodologies were appropriately aligned to the Rwandan context. In
particular, we wish to thank Narcisse Musabayezu, the former Inspector General; and
Janvier Gasana, the Rwanda Education Board Deputy Director General in charge of
Education Quality and Standard Department, for their support. Several people helped
adapt our methodologies for use in Rwanda. Felix Hagenimana provided linguistic
expertise in Kinyarwanda, and Catherine Howard and Pauline Quinn, both working for
Volunteer Service Overseas in Rwanda, also helped out tremendously during the
adaptation and training workshops. Sandra Hollingsworth and Annie Savard consulted on
the development of the reading and math instruments. Field data collection and data entry
were only possible thanks to Christian Uvugukuli and the fine staff of Outreach
Development Solutions. Most importantly, this work could not have succeeded without
the cooperation and contributions of the principals, teachers, students, and communities
included in the study who, for obvious reasons, must remain anonymous.

EdData II TO 7—Early Grade Reading and Mathematics in Rwanda 1
Introduction The Economist magazine
1 includes Rwanda among the world’s top 10 fastest growing
economies for the period from 2001 to 2010. During the past 10 years, the education
system in Rwanda has benefited from the country’s strong economic growth. Rwanda
increased the share of its gross domestic product (GDP) expended on education from
3.2% in 1996 to over 5% in 2009, fueling a rapid expansion of basic education.
Rwandans are rightfully proud of the success they have had in developing their country
and expanding basic education to achieve near universal access. The quality of education
has also improved over the past decade, with increases in teacher qualifications, higher
rates of primary school completion, and greater transition from primary to lower
secondary school.2
However, Rwandans are far from satisfied. Vision 2020 states that
Rwanda aspires to become a modern, strong, and united nation with a middle-income,
knowledge-based economy.3 Rwanda is also positioning itself as a beacon for investment
in East Africa. That strategy includes switching from French to English as the official
medium of instruction in school, as well as building a sound base of human capital. This
places great emphasis on literacy in Kinyarwanda and English and on strong numeracy as
the foundations for the higher-order math, science, technology, and critical-thinking skills
that Rwanda sees as essential to its future.
Rwanda recognizes that education for all has to mean more than children enrolling in
school. Access to education must lead to learning. Education systems around the world
may emphasize different learning objectives and different aspects of children’s social,
emotional, and cognitive development, but all educators would agree that children should
acquire basic reading and math skills in primary school.
When measuring an education system’s quality or effectiveness, we can pose some basic
questions: Are children learning to read? Are they learning basic math skills? Are they
acquiring those skills early enough in primary school to secure the foundation for further
learning? In Rwanda, like in many countries, more than one language is used in school.
Therefore, students are expected to learn to read and must understand and express basic
math concepts in at least two languages: Kinyarwanda and English. Thus, when
measuring the effectiveness of Rwandan primary schools, these two languages must also
be taken into account. English replaced French as an official language of instruction in
2008, so expectations for what children (and teachers) can do in English at this point in
time should be limited. In 2011, Kinyarwanda became the official language of instruction
in the first three years of primary school. However, children must learn English well
enough in the early grades of primary school to use it as the medium of their continued
education.
1 The lion kings?. (2011, January 6). The Economist, 39(2), 21.
2 Lynd, Mark. (2010). Assessment report and proposal for an education strategy. Prepared for U.S. Agency for
International Development/Rwanda. Kigali, Rwanda. 3 Ministry of Finance and Economic Planning. (2000) Rwanda Vision 2020. Kigali, Rwanda.
2 EdData II TO 7—Early Grade Reading and Mathematics in Rwanda
It is one thing to measure whether students are learning to read and master basic math
skills. Also of interest is understanding why students may learn more or learn faster in
some schools than in others. Therefore, in addition to assessing learning outcomes, we
want to measure which schools create environments that support learning. We want to
ask questions such as: Do students and teachers have the materials they need? Do
students and teachers spend enough time engaged in activities that support learning? And,
what instructional practices are teachers using?
To answer these questions about learning and the factors influencing it in Rwanda, the
USAID-funded Education Data for Decision Making (EdData II) Project partnered with
USAID/Rwanda and the Rwandan Ministry of Education to conduct a study of reading
and math skills and the learning environments that support them in a nationally
representative sample of 42 primary schools. Table 1 below summarizes the sample, and
additional details are provided in Annex A.
Table 1. Summary of the Survey Sample
Total % Female
Schools 42
Head Teachers 42 17%
Teachers 203 32%
Students 840 53%
Parents 82 39%
In March 2011, a research team evaluated the skills of 420 P4 and 420 P64 students with
an Early Grade Mathematics Assessment (EGMA) instrument adapted to the Rwandan
curriculum and context. An English-language Early Grade Reading Assessment (EGRA)
instrument was adapted to the Rwandan context, while a Kinyarwanda-language
instrument was developed based on the linguistic structure of the Kinyarwanda
language.5 We gathered a diverse range of information using the Snapshot of School
Management Effectiveness (SSME) instruments developed by the EdData II project and
customized for the Rwandan context. A random selection of districts and non-private
schools in Rwanda were included in the survey, and therefore students from a range of
socioeconomic backgrounds are represented. The majority of students in this survey were
at the lower end of the socioeconomic distribution, based on analysis of the kinds of
possessions which their families had. For example, only 11% of students reported having
electricity and 4% reported having water from a tap.
4 P4 and P6 are equivalent to primary school Grade 4 and primary school Grade 6.
5 Details on the sample of students and schools are provided in Annex A of this report.
EdData II TO 7—Early Grade Reading and Mathematics in Rwanda 3
The findings of the EGRA, EGMA and SSME surveys are presented and discussed in this
report.
How Well Are Students Learning to Read in Kinyarwanda?
Oral Reading Fluency and Comprehension
The Kinyarwanda reading skills of P4 students were evaluated using an instrument
geared towards a P2–P3 expected level of reading.6 Students at the P6 level were
evaluated using the same instrument, permitting easy comparison of any differences in
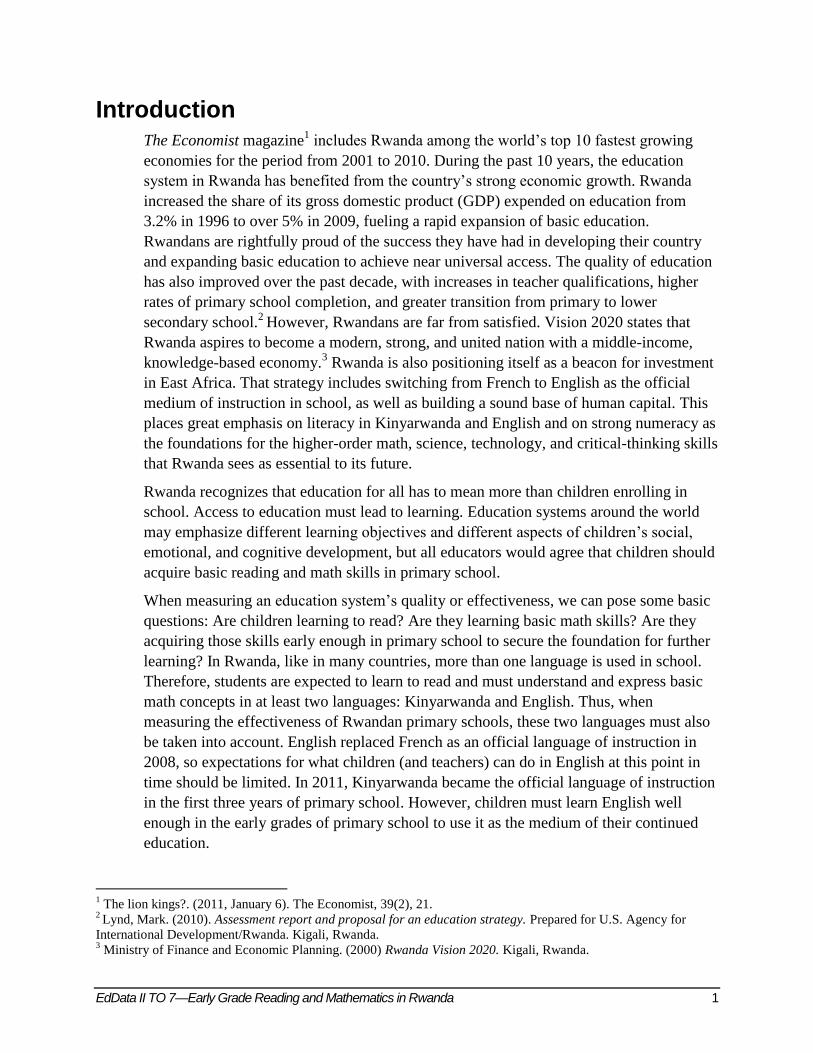
the levels of skill acquisition between the two grades. Figure 1 below shows the oral
reading fluency demonstrated by P4 and P6 students. The following conclusions can be
drawn:
Students in P6 could read simple text more fluently than students in P4. Average
oral reading fluency was 26 words read correctly per minute for P4 students and
48 words read correctly per minute for P6 students.
Girls in P6 had a higher reading fluency, averaging 51 words per minute (wpm),
compared to 46 wpm for boys in the same grade.
Even after three full years of instruction, 13% of students in P4 could not read a
single word of a P2–P3-level text. Another 13% were reading less than 15 wpm.
Most students in P6 could read more than 31 wpm of P2–P3-level text, although
only 32% could read more than 50 words per minute.7
Oral reading fluency appeared to be low for Rwandan students overall, given that
Kinyarwanda was the mother tongue for 98% of them and that a very basic level
text was used in the EGRA assessment.
6 Because the study was conducted at the start of the academic year, it was deemed appropriate to evaluate students
at the start of P4 using P2–P3-level content. 7 Between 45 and 60 wpm is considered the minimum required level of fluency for solid comprehension for
beginning English language readers. It is likely that the minimum level for Kinyarwanda is somewhat lower given
the difference in word length from English. However, it would be desirable for P6 students to well surpass the
minimum level on a P2–P3 level text.
4 EdData II TO 7—Early Grade Reading and Mathematics in Rwanda
Figure 1. Kinyarwanda Oral Reading Fluency (ORF) – P4 and P6 (Beginning of Academic Year)
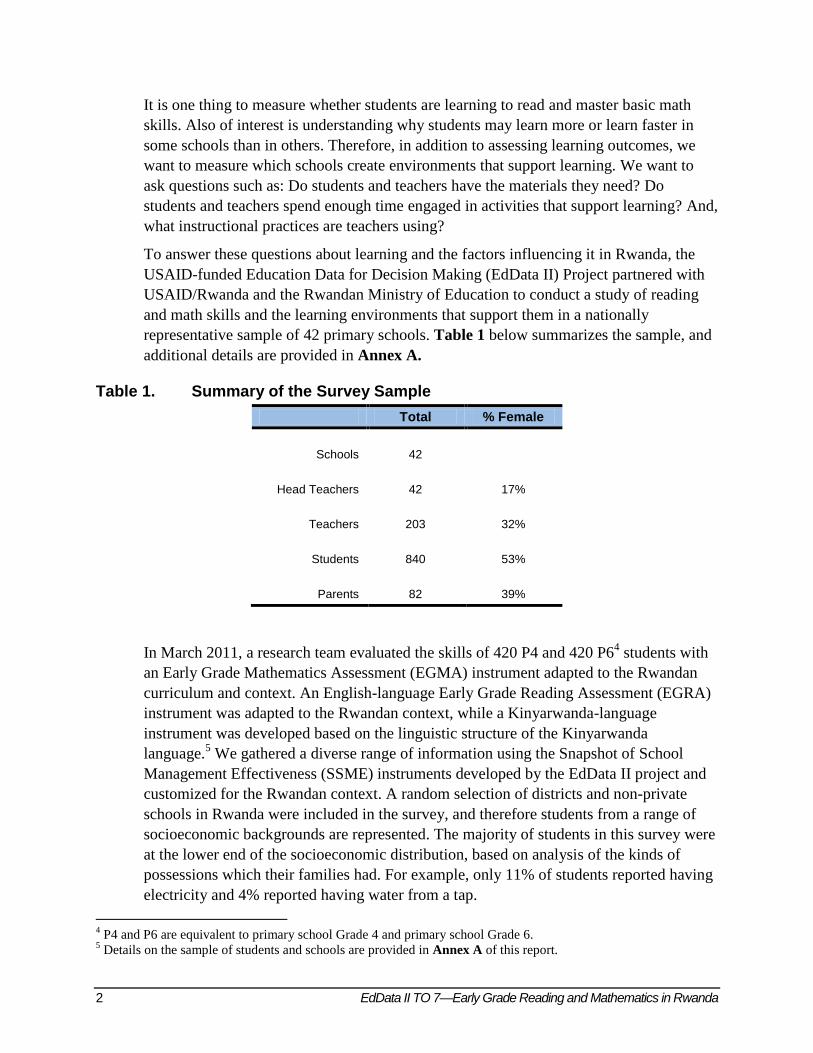
More important than how fluently students can read a text is whether or not they
understand what they have read. The passage text reading subtask of the Kinyarwanda
EGRA included a reading comprehension section where students were asked questions
about the text they had read. This section included both literal and inferential questions.
Comprehension was examined by calculating the percent of comprehension questions
correct out of those posed to the student, since students reading more slowly may not
have finished the entire text. Figure 2 shows the percentage of students for each range of
comprehension scores (correct/attempted). This figure shows improvement from P4 to
P6. It indicates that almost half of the P6 students were able to answer 80% of the
questions they were asked on a P2–P3-level text. Still, almost 40% of P4 students are not
able to answer even 50% of the questions posed based on a P2–P3-level text.
0
20
40
60
80
100
0 1-15 16-30 31-45 46-60 61-75 >75
Pe
rce
nta
ge o
f St
ud
en
ts
ORF Ranges (wpm)
P4
P6

EdData II TO 7—Early Grade Reading and Mathematics in Rwanda 5
Figure 2. Kinyarwanda Reading Comprehension Levels – P4 and P6 (Beginning of Academic Year) – Percent Correct / Attempted
It would appear that students are learning some of the mechanics of reading in
Kinyarwanda, but many are not reading with sufficient comprehension to use text to
support their learning of subject area content (some even after five years of schooling).
Literacy Skill Areas in Kinyarwanda
In addition to evaluating how well students can read a short example of P2–P3-level
connected text, the EGRA instrument used in Rwanda also assessed students’ ability in
five other literacy skill areas. These include:
Phonemic awareness (understanding the sounds letters make in words—e.g.,
naming the beginning sound of a word);
Letter sound knowledge (saying the sound that a letter makes);
Reading syllables (a consonant and a vowel together—e.g., ba);
Reading short, familiar words; and
Reading invented words (a way to assess decoding skills).
EGRA assesses whether students have the above skills, but by also timing how quickly
students perform these tasks, EGRA evaluates whether students have achieved a desired
level of automaticity in these skill areas. For example, when children first learn their
letters, they may take some time to recognize and distinguish each letter in the alphabet.
However, as they progress in their skill development, we fully expect that they will
quickly and easily recognize letters and the sounds they make, as well as easily recognize
familiar words and decode simple, short, unfamiliar words. In fact, the skill of decoding
27%
9%
10%
14%
30%
30%
32%
47%
0%
10%
20%
30%
40%
50%
60%
70%
80%
90%
100%
Kinyarwanda P4 Kinyarwanda P6
% o
f S
tud
ents
80-100%
<80%
<50%
0
6 EdData II TO 7—Early Grade Reading and Mathematics in Rwanda
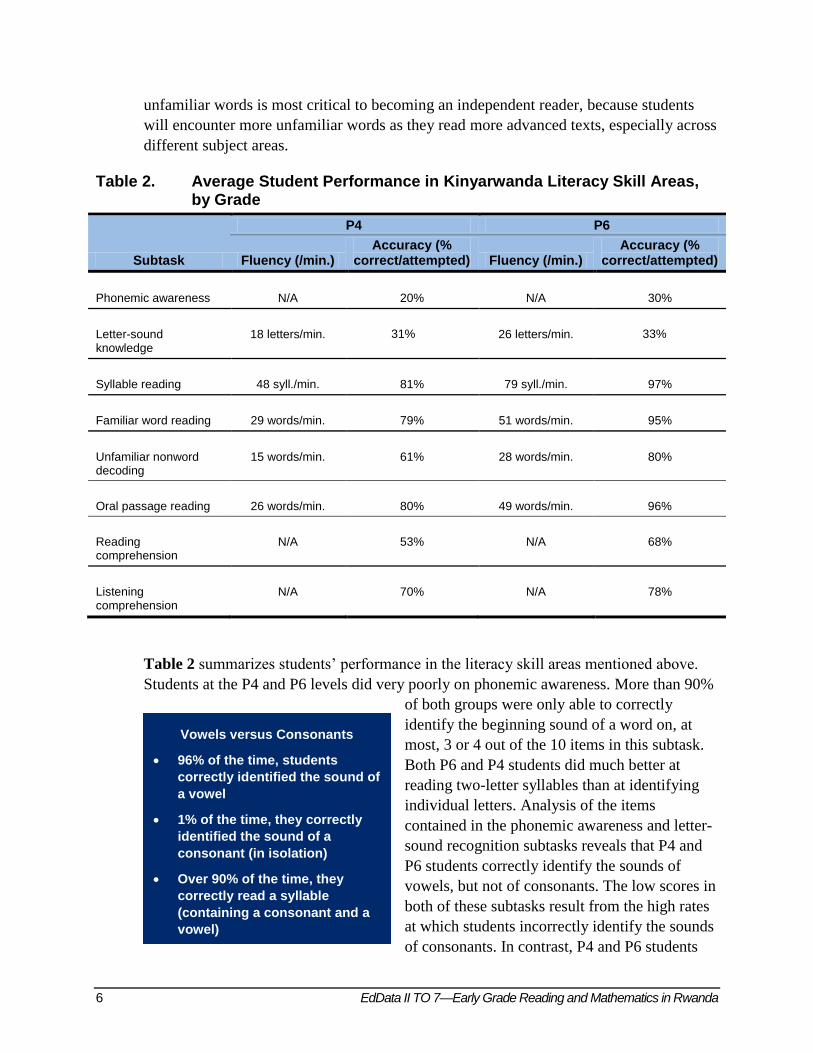
unfamiliar words is most critical to becoming an independent reader, because students
will encounter more unfamiliar words as they read more advanced texts, especially across
different subject areas.
Table 2. Average Student Performance in Kinyarwanda Literacy Skill Areas, by Grade
Subtask
P4 P6
Fluency (/min.) Accuracy (%
correct/attempted) Fluency (/min.) Accuracy (%
correct/attempted)
Phonemic awareness N/A 20% N/A 30%
Letter-sound knowledge
18 letters/min. 31%1% 26 letters/min. 33%%
Syllable reading 48 syll./min. 81% 79 syll./min. 97%
Familiar word reading 29 words/min. 79% 51 words/min. 95%
Unfamiliar nonword decoding
15 words/min. 61% 28 words/min. 80%
Oral passage reading 26 words/min. 80% 49 words/min. 96%
Reading comprehension
N/A 53% N/A 68%
Listening comprehension
N/A 70% N/A 78%
Table 2 summarizes students’ performance in the literacy skill areas mentioned above.
Students at the P4 and P6 levels did very poorly on phonemic awareness. More than 90%
of both groups were only able to correctly
identify the beginning sound of a word on, at
most, 3 or 4 out of the 10 items in this subtask.
Both P6 and P4 students did much better at
reading two-letter syllables than at identifying
individual letters. Analysis of the items
contained in the phonemic awareness and letter-
sound recognition subtasks reveals that P4 and
P6 students correctly identify the sounds of
vowels, but not of consonants. The low scores in
both of these subtasks result from the high rates
at which students incorrectly identify the sounds
of consonants. In contrast, P4 and P6 students
Vowels versus Consonants
96% of the time, students
correctly identified the sound of
a vowel
1% of the time, they correctly
identified the sound of a
consonant (in isolation)
Over 90% of the time, they
correctly read a syllable
(containing a consonant and a
vowel)
EdData II TO 7—Early Grade Reading and Mathematics in Rwanda 7
read syllables at a high rate of accuracy. Clearly, students are not learning the sounds of
consonants in isolation. Consonants are only introduced as elements of a syllable
(combining a consonant and vowel sound). This could explain why both groups read
familiar words with greater automaticity than they read unfamiliar (invented) words,
which require letter by letter decoding to read. Student who are unable to read unfamiliar
words will be disadvantaged when they attempt to read higher level text.
Students at the P4 and P6 levels are able to accurately decode a P2–P3-level text. Both
groups read the text presented to them with an 80% or higher accuracy (80% on average
in P4, 96% in P6). However, both groups are also reading much slower than should be
expected of students in those grades. On average, P4 students were able to progress only
halfway through the short text, and P6 students, on average, also did not finish reading
the simple text. Learning to read means being able to accurately identify words, but
students must also identify those words and extract meaning from the text they read at a
much quicker pace, especially by the time they reach the end of primary school.
How Well Are Students Learning to Read in English?
Oral Reading Fluency and Comprehension
Assessment of students’ ability in English has to recognize that English became the
official language of instruction only in 2008. Students in P4 and P6 in the 2010/11 school
year have only had limited instruction in English and any instruction they have received
is from teachers who themselves have limited English.8 As a result of the policy adopted
in 2011, students now begin their primary schooling being instructed in Kinyarwanda, are
expected to learn English during the first three years of school, and then transition in P4
into classrooms where English is used as the medium of instruction. Acquisition of strong
literacy skills in English is, therefore, required for success in upper primary school and
beyond.
8 A survey conducted by the British Council in 2009 found that 85% of primary teachers only have beginner level
English.
8 EdData II TO 7—Early Grade Reading and Mathematics in Rwanda
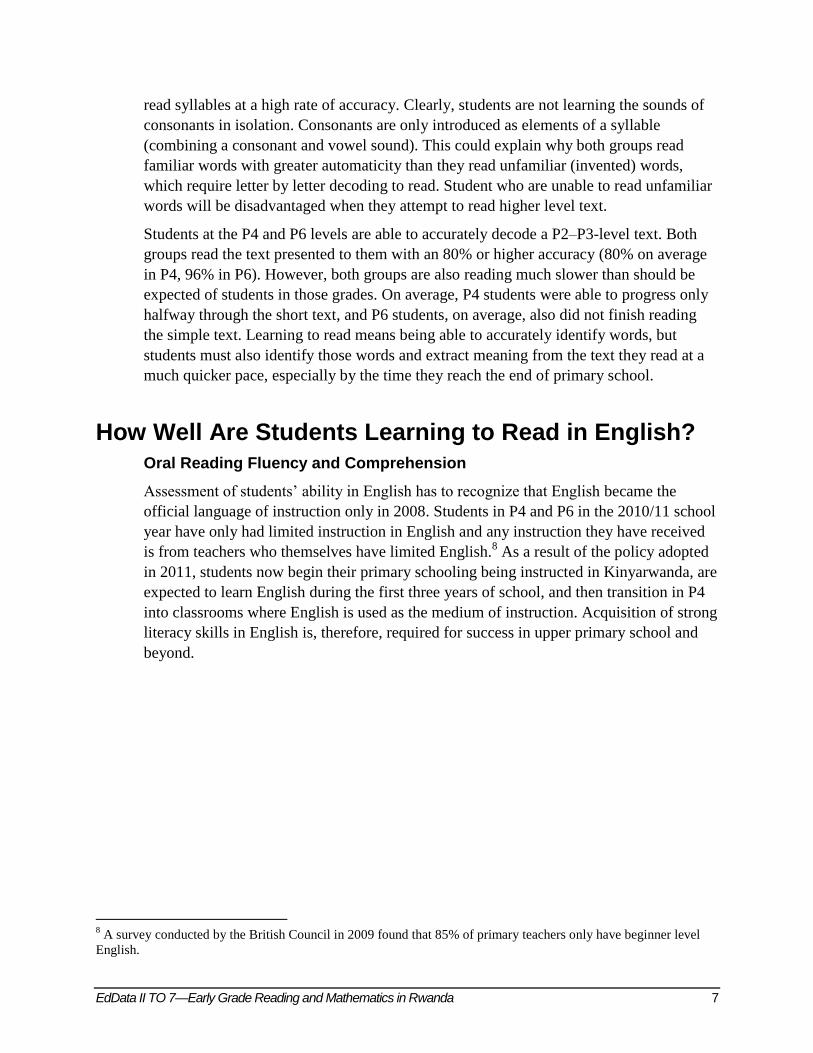
Figure 3. English Oral Reading Fluency (ORF) – P6 (Beginning of Academic Year)
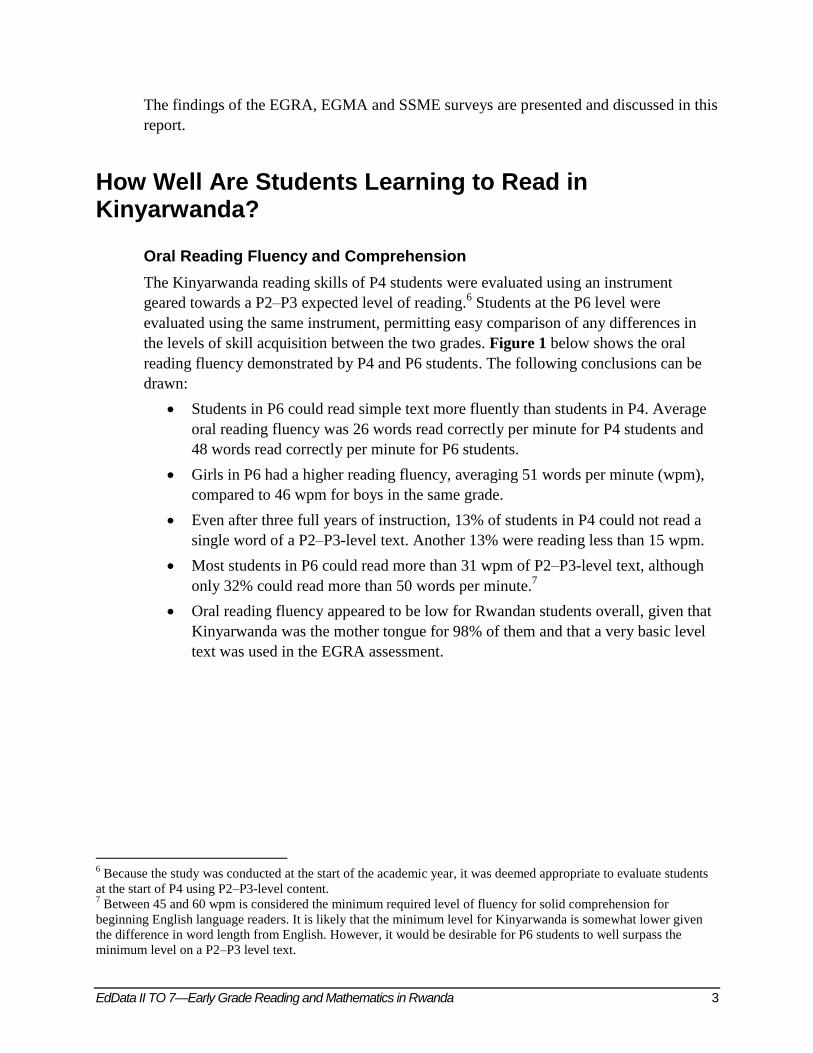
Figure 3 above shows the results for the P6
English-language EGRA instrument. Although
English was a second language for all students,
there were few zero scores for oral reading
fluency in P6. On average, P6 students read 43
wpm in English and approximately 35% of the
P6 students were reading above 45 wpm. Recall
that the text used (shown in the adjacent text
box) was at a P2–P3 level.9 P6 students appear
to have been transferring to English the
decoding skills that they were gaining in their
first language. However, only 21% of P6
students reached a reading speed of 60 words or more per minute. By U.S. standards, a
student reading below 82 wpm at the beginning of P6 is considered ―at risk‖ of failure in
school.
There were no differences in the performance of boys and girls on any of the English
language reading subtasks.
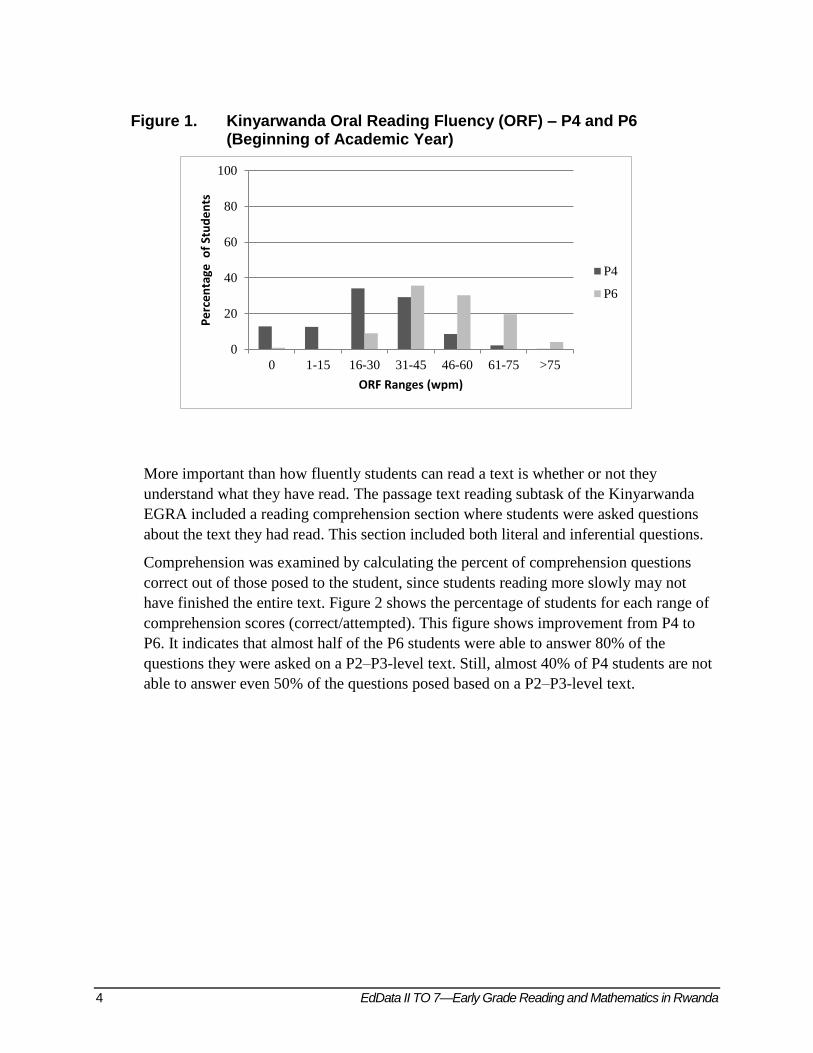
Figure 4 below, however, shows that students’ reading comprehension in English was
extremely poor, which is not surprising given that instruction in English was only
introduced three years prior to this survey. Research shows that children can learn the
sounds of a second language and learn to decode words, but they will have great
9 Additional examples of EGRA subtasks are provided in Annex 2.
0
20
40
60
80
100
0 1-15 16-30 31-45 46-60 61-75 >75
Pe
rce
nta
ge o
f St
ud
en
ts
ORF Ranges (wpm)
Text Used on the English EGRA:
“My name is Senga. I live on a farm
with my mother, father, and sister
Ana. Every year, the land gets very
dry before the rains come. We
watch the sky and wait. One
afternoon as I sat outside, I saw
dark clouds. Then something hit
my head, lightly at first and then
harder. I jumped up and ran
towards the house. The rains had
come at last.”

EdData II TO 7—Early Grade Reading and Mathematics in Rwanda 9
difficulty comprehending what they read if they have not achieved a sufficient level of
functionality in that language.10
The great majority of P6 students (98%) could not respond to more than half of the
comprehension questions, with 62% unable to respond to even a single question
correctly. No students demonstrated comprehension of at least 80%. Again, these P6
comprehension results are not surprising given the recent shift to the English language as
the medium of instruction. However, it is important to note that P6 students were not
gaining enough understanding of the language to be able to comprehend a basic P2–P3-
level text, let alone read grade-level subject matter in English.
Figure 4. English Comprehension – P6 (Beginning of Academic Year)
Oral English Language Comprehension in P4
Students’ poor comprehension results were echoed in the P4 English language
assessment. The P4 instrument included only oral English tasks, and focused on
vocabulary and listening comprehension. Here students were tested to see if they could
identify common vocabulary. For example, 27% of students were not able to point to the
appropriate body part when asked, and 57% were not able to follow simple spatial
instructions (such as ―on‖ and ―in front‖). Given the limited amount of instruction they
had had and the likely low level of English proficiency of their teachers, P4 students had
not yet been able to build even a basic vocabulary in English.
10
See, for example, Lesaux, N. & Siegel, L. (2003). The development of reading in children who speak English as a
second language. Developmental Psychology, 39, 1005–1019.
0
20
40
60
80
100
NoComprehension
<50% 50-80% 80% or more
Pe
rce
nta
ge o
f St
ud
en
ts
Comprehension (% Correct)
10 EdData II TO 7—Early Grade Reading and Mathematics in Rwanda
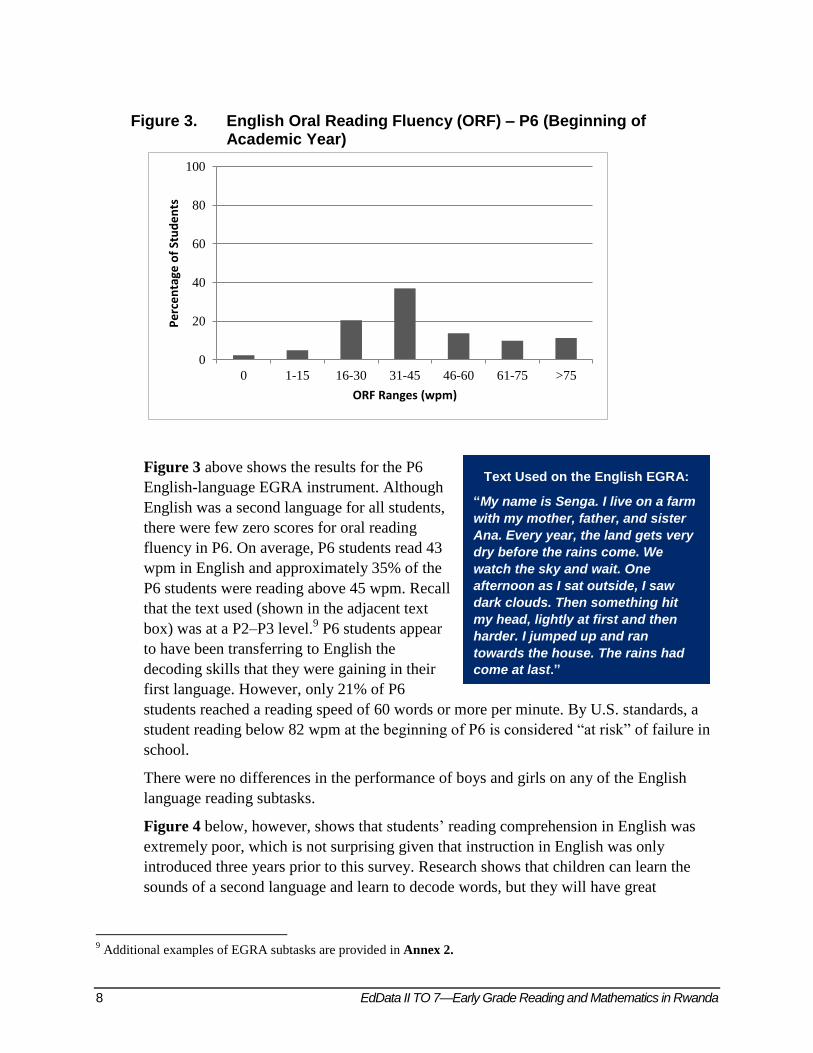
Literacy Skill Areas in English
As in Kinyarwanda, we assessed several specific literacy skills in English, but only for P6
students. The English EGRA evaluated students’ phonemic awareness, letter recognition,
and familiar and unfamiliar (invented) word reading.11
Students’ phonemic awareness in
English was much worse than in Kinyarwanda; 76% of P6 students could not identify the
initial sound in a single word presented to them. Also, P6 students’ letter recognition and
familiar word reading were less automatic in English than in Kinyarwanda.
Table 3. Average Student Performance in English Literacy Skill Areas, P6
Subtask
P6
Fluency (/min.) Accuracy (%
correct/attempted)
Phonemic awareness N/A <1 out of 10 correct
Letter-sound knowledge
22 37%
Familiar word reading 37 68%
Unfamiliar nonword decoding
32 66%
Oral passage reading 43 70%
Reading comprehension
N/A 11%
Listening comprehension
N/A 16%
As was the case in Kinyarwanda, P6 students could identify the sounds of vowels much
more accurately than they could identify the sounds of consonants in isolation. Clearly,
there is an issue with how Rwandan teachers introduce letter sounds and how they help
students develop the skill of sounding out letters in words. In neither Kinyarwanda nor
English do students adequately learn how to use the sounds of consonants to decode
words. Although teaching reading at the syllable-level may work to some degree for
Kinyarwanda, it is not an effective approach for English, where students need to be able
to recognize individual letter sounds to decode unfamiliar words.
11
The syllable subtask was included for Kinyarwanda because it is an agglutinating language and, as such, there
may be a tendency to teach reading at the syllabic level. The English language does not share this trait, so no
syllable subset was included in the English version of the EGRA.
EdData II TO 7—Early Grade Reading and Mathematics in Rwanda 11
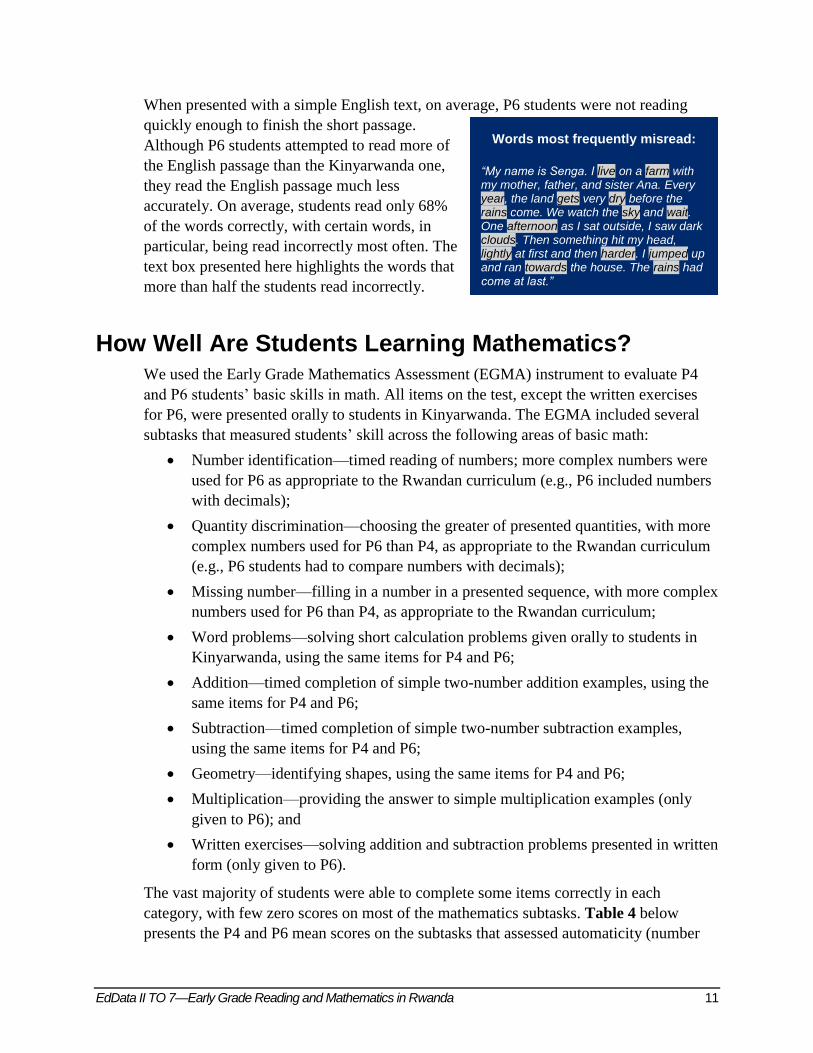
When presented with a simple English text, on average, P6 students were not reading
quickly enough to finish the short passage.
Although P6 students attempted to read more of
the English passage than the Kinyarwanda one,
they read the English passage much less
accurately. On average, students read only 68%
of the words correctly, with certain words, in
particular, being read incorrectly most often. The
text box presented here highlights the words that
more than half the students read incorrectly.
How Well Are Students Learning Mathematics? We used the Early Grade Mathematics Assessment (EGMA) instrument to evaluate P4
and P6 students’ basic skills in math. All items on the test, except the written exercises
for P6, were presented orally to students in Kinyarwanda. The EGMA included several
subtasks that measured students’ skill across the following areas of basic math:
Number identification—timed reading of numbers; more complex numbers were
used for P6 as appropriate to the Rwandan curriculum (e.g., P6 included numbers
with decimals);
Quantity discrimination—choosing the greater of presented quantities, with more
complex numbers used for P6 than P4, as appropriate to the Rwandan curriculum
(e.g., P6 students had to compare numbers with decimals);
Missing number—filling in a number in a presented sequence, with more complex
numbers used for P6 than P4, as appropriate to the Rwandan curriculum;
Word problems—solving short calculation problems given orally to students in
Kinyarwanda, using the same items for P4 and P6;
Addition—timed completion of simple two-number addition examples, using the
same items for P4 and P6;
Subtraction—timed completion of simple two-number subtraction examples,
using the same items for P4 and P6;
Geometry—identifying shapes, using the same items for P4 and P6;
Multiplication—providing the answer to simple multiplication examples (only
given to P6); and
Written exercises—solving addition and subtraction problems presented in written
form (only given to P6).
The vast majority of students were able to complete some items correctly in each
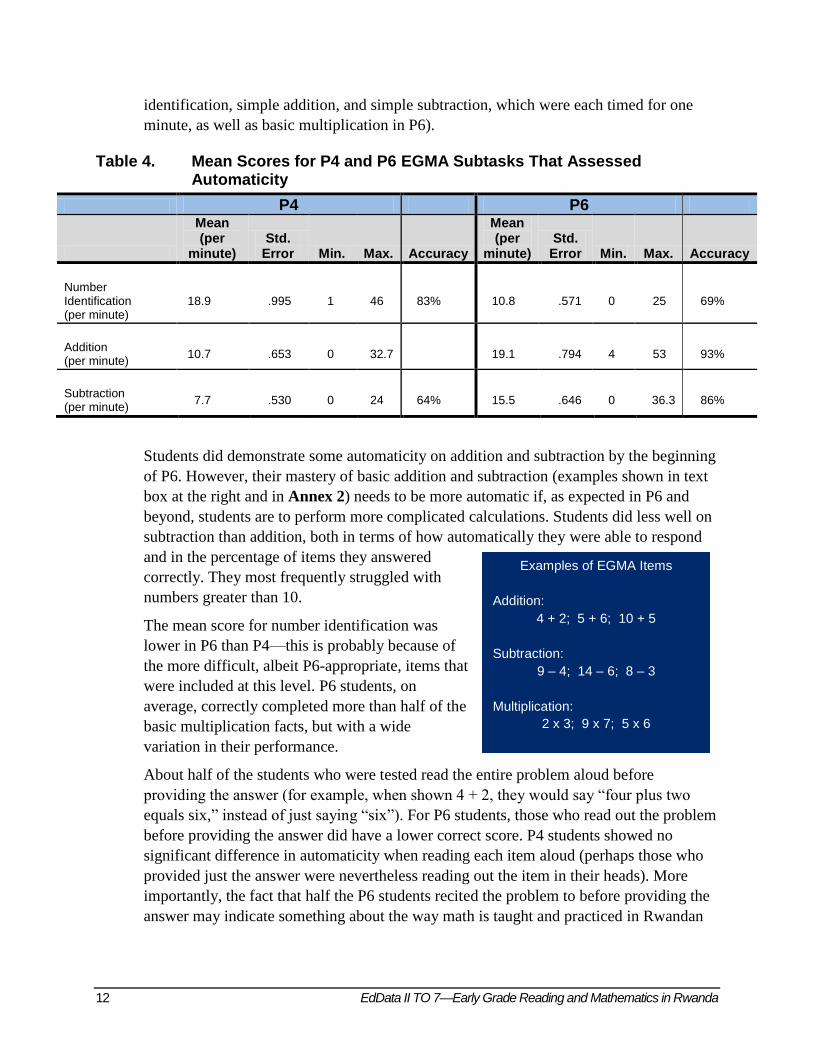
category, with few zero scores on most of the mathematics subtasks. Table 4 below
presents the P4 and P6 mean scores on the subtasks that assessed automaticity (number
Words most frequently misread:
“My name is Senga. I live on a farm with my mother, father, and sister Ana. Every year, the land gets very dry before the rains come. We watch the sky and wait. One afternoon as I sat outside, I saw dark clouds. Then something hit my head, lightly at first and then harder. I jumped up and ran towards the house. The rains had come at last.”
12 EdData II TO 7—Early Grade Reading and Mathematics in Rwanda
identification, simple addition, and simple subtraction, which were each timed for one
minute, as well as basic multiplication in P6).
Table 4. Mean Scores for P4 and P6 EGMA Subtasks That Assessed Automaticity
P4 P6
Mean (per
minute) Std.
Error Min. Max. Accuracy
Mean (per
minute) Std.
Error Min. Max. Accuracy
Number Identification (per minute)
18.9 .995 1 46 83% 10.8 .571 0 25 69%
Addition (per minute)
10.7 .653 0 32.7 78%8% 19.1 .794 4 53 93%
Subtraction (per minute)
7.7 .530 0 24 64% 15.5 .646 0 36.3 86%
Students did demonstrate some automaticity on addition and subtraction by the beginning
of P6. However, their mastery of basic addition and subtraction (examples shown in text
box at the right and in Annex 2) needs to be more automatic if, as expected in P6 and
beyond, students are to perform more complicated calculations. Students did less well on
subtraction than addition, both in terms of how automatically they were able to respond
and in the percentage of items they answered
correctly. They most frequently struggled with
numbers greater than 10.
The mean score for number identification was
lower in P6 than P4—this is probably because of
the more difficult, albeit P6-appropriate, items that
were included at this level. P6 students, on
average, correctly completed more than half of the
basic multiplication facts, but with a wide
variation in their performance.
About half of the students who were tested read the entire problem aloud before
providing the answer (for example, when shown 4 + 2, they would say ―four plus two
equals six,‖ instead of just saying ―six‖). For P6 students, those who read out the problem
before providing the answer did have a lower correct score. P4 students showed no
significant difference in automaticity when reading each item aloud (perhaps those who
provided just the answer were nevertheless reading out the item in their heads). More
importantly, the fact that half the P6 students recited the problem to before providing the
answer may indicate something about the way math is taught and practiced in Rwandan
Examples of EGMA Items
Addition:
4 + 2; 5 + 6; 10 + 5
Subtraction:
9 – 4; 14 – 6; 8 – 3
Multiplication:
2 x 3; 9 x 7; 5 x 6
EdData II TO 7—Early Grade Reading and Mathematics in Rwanda 13
classrooms. Such simple math facts should be practiced for automatic recognition and
calculation, not repeated verbatim.
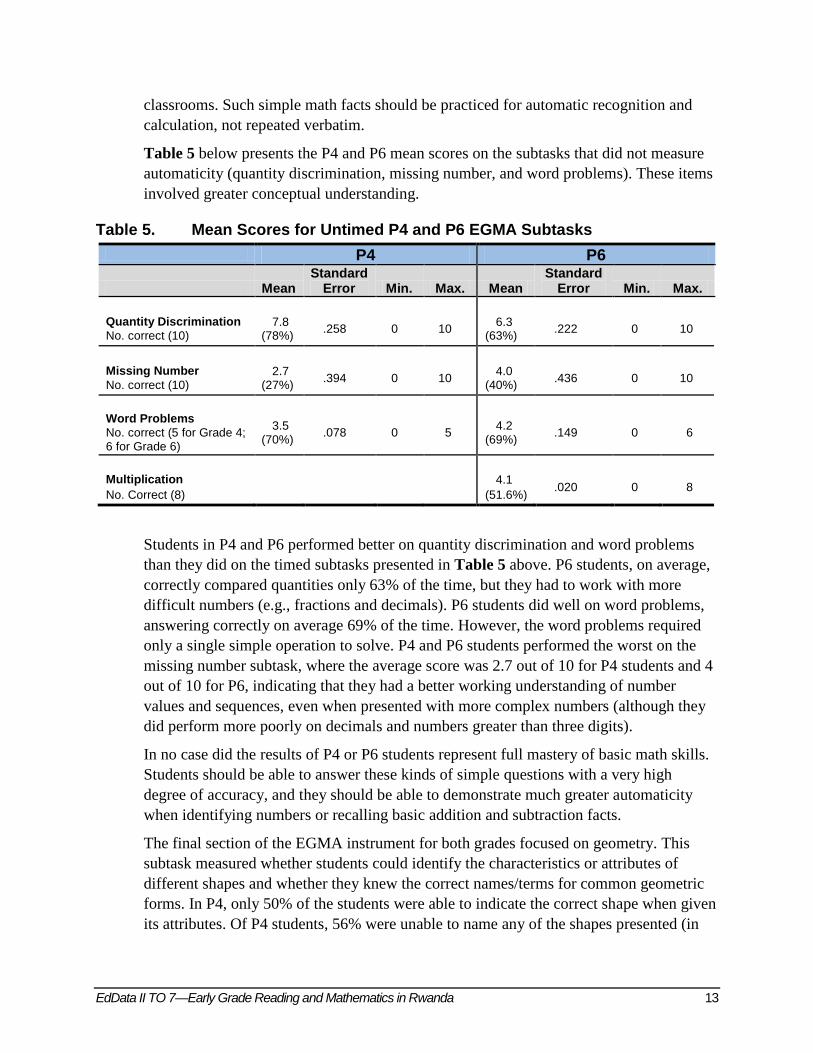
Table 5 below presents the P4 and P6 mean scores on the subtasks that did not measure
automaticity (quantity discrimination, missing number, and word problems). These items
involved greater conceptual understanding.
Table 5. Mean Scores for Untimed P4 and P6 EGMA Subtasks
P4 P6
Mean Standard
Error Min. Max. Mean Standard
Error Min. Max.
Quantity Discrimination
No. correct (10) 7.8
(78%) .258 0 10
6.3 (63%)
.222 0 10
Missing Number
No. correct (10) 2.7
(27%) .394 0 10
4.0 (40%)
.436 0 10
Word Problems
No. correct (5 for Grade 4; 6 for Grade 6)
3.5 (70%)
.078 0 5 4.2
(69%) .149 0 6
Multiplication
No. Correct (8)
4.1
(51.6%) .020 0 8
Students in P4 and P6 performed better on quantity discrimination and word problems
than they did on the timed subtasks presented in Table 5 above. P6 students, on average,
correctly compared quantities only 63% of the time, but they had to work with more
difficult numbers (e.g., fractions and decimals). P6 students did well on word problems,
answering correctly on average 69% of the time. However, the word problems required
only a single simple operation to solve. P4 and P6 students performed the worst on the
missing number subtask, where the average score was 2.7 out of 10 for P4 students and 4
out of 10 for P6, indicating that they had a better working understanding of number
values and sequences, even when presented with more complex numbers (although they
did perform more poorly on decimals and numbers greater than three digits).
In no case did the results of P4 or P6 students represent full mastery of basic math skills.
Students should be able to answer these kinds of simple questions with a very high
degree of accuracy, and they should be able to demonstrate much greater automaticity
when identifying numbers or recalling basic addition and subtraction facts.
The final section of the EGMA instrument for both grades focused on geometry. This
subtask measured whether students could identify the characteristics or attributes of
different shapes and whether they knew the correct names/terms for common geometric
forms. In P4, only 50% of the students were able to indicate the correct shape when given
its attributes. Of P4 students, 56% were unable to name any of the shapes presented (in
14 EdData II TO 7—Early Grade Reading and Mathematics in Rwanda
either English or Kinyarwanda). In P6, the majority of students could indicate the correct
shape based on its attributes, but 38% could name only one of the shapes.
On all the subtasks in math, P6 boys outperformed P6 girls. They scored between 10%
and 20% higher on almost all the subtasks, with the biggest difference being in
identifying missing numbers and shape attributes. P4 boys outperformed P4 girls on
subtraction and word problems.
What Is Happening in Rwandan Primary Schools? Student performance in reading and math depends on whether they have received
adequate instruction in the skill areas assessed by the EGRA and EGMA. We, therefore,
present here the findings from classroom observations and interviews with teachers and
students. Our team observed P4 and P6 lessons during Kinyarwanda, English, and math
classes at every school visited, using a detailed observation protocol to record at timed
intervals throughout a lesson the actions of teachers and students, as well as the content
being covered and the materials used. We observed the following:
Instruction across subjects and grades was almost exclusively whole class;
The most frequently observed teacher action was writing on the blackboard and
student action was writing in their notebooks;
Although 60% of teachers reported always using ministry textbooks in their
classrooms, textbooks were observed actually being used only during some
Kinyarwanda lessons. We noted textbooks being used on average during:
1% of observations in a math class
4% of observations in an English class
22% of observations in a Kinyarwanda class;
In many observed lessons, textbooks were not used at any time:
90% of the English and math lessons involved no textbook use at any time
49% of the Kinyarwanda classes involved no textbook use at any time;
Other materials, such as flashcards or posters in language classes, or pictures or
objects in math, were essentially never used.
When visiting a school, the field data collection team asked to see ―reading‖ lessons in
Kinyarwanda and English for P4 and P6 levels, as summarized in Table 6 below. What
the team observed during those ―reading‖ lessons was content primarily focused on
language, dealing mostly with grammar (especially in English) rather than also on the
instruction activities needed to develop and reinforce foundational literacy skills.12
Any
12
See, for example, Blair, T. R., Rupley, W. H., and Nichols, W. D. (2007). The effective teacher of reading:
Considering the ―what‖ and ―how‖ of instruction. The Reading Teacher 60, pp. 432-439; or Saunders, W. M.,
Foorman, B. R., Carlson, C. D. (2006, November). Do we need a separate block of time for oral English language
development in programs for English learners? Elementary School Journal, 107(2), 181-198.
EdData II TO 7—Early Grade Reading and Mathematics in Rwanda 15
reasonable amount of reading instruction occurred most often during the Kinyarwanda
classes.
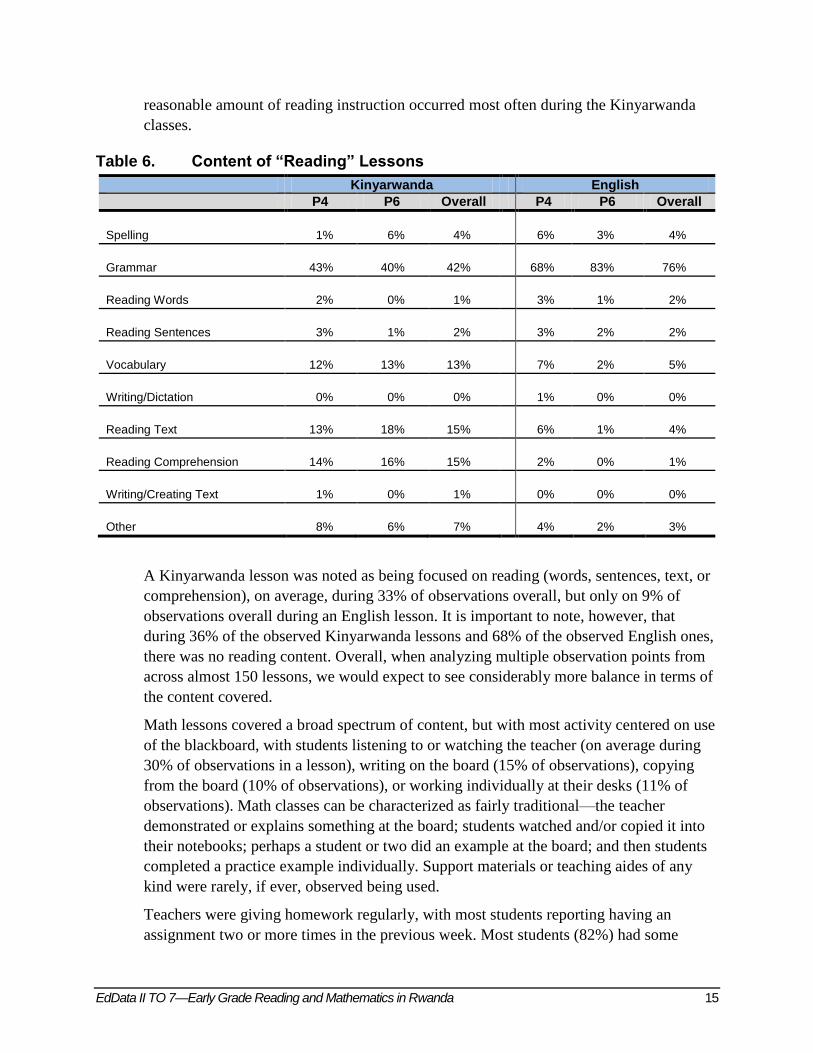
Table 6. Content of “Reading” Lessons
Kinyarwanda English
P4 P6 Overall P4 P6 Overall
Spelling 1% 6% 4% 6% 3% 4%
Grammar 43% 40% 42% 68% 83% 76%
Reading Words 2% 0% 1% 3% 1% 2%
Reading Sentences 3% 1% 2% 3% 2% 2%
Vocabulary 12% 13% 13% 7% 2% 5%
Writing/Dictation 0% 0% 0% 1% 0% 0%
Reading Text 13% 18% 15% 6% 1% 4%
Reading Comprehension 14% 16% 15% 2% 0% 1%
Writing/Creating Text 1% 0% 1% 0% 0% 0%
Other 8% 6% 7% 4% 2% 3%
A Kinyarwanda lesson was noted as being focused on reading (words, sentences, text, or
comprehension), on average, during 33% of observations overall, but only on 9% of
observations overall during an English lesson. It is important to note, however, that
during 36% of the observed Kinyarwanda lessons and 68% of the observed English ones,
there was no reading content. Overall, when analyzing multiple observation points from
across almost 150 lessons, we would expect to see considerably more balance in terms of
the content covered.
Math lessons covered a broad spectrum of content, but with most activity centered on use
of the blackboard, with students listening to or watching the teacher (on average during
30% of observations in a lesson), writing on the board (15% of observations), copying
from the board (10% of observations), or working individually at their desks (11% of
observations). Math classes can be characterized as fairly traditional—the teacher
demonstrated or explains something at the board; students watched and/or copied it into
their notebooks; perhaps a student or two did an example at the board; and then students
completed a practice example individually. Support materials or teaching aides of any
kind were rarely, if ever, observed being used.
Teachers were giving homework regularly, with most students reporting having an
assignment two or more times in the previous week. Most students (82%) had some
16 EdData II TO 7—Early Grade Reading and Mathematics in Rwanda
evidence of their teachers marking their exercise books, but in the majority of exercise
books (54%), teachers had not made any written comments. In almost all exercise books
(97%), there were no examples of original writing that children themselves had
composed.
It is interesting to note that standard ―chalk and talk‖ pedagogy, which is clearly the
predominant teaching approach in Rwandan primary schools, in a math lesson does
include some opportunity for students to practice their math skills. In reading lessons, this
is not the case. Students are not getting enough opportunities to practice reading, or to
practice any of the important subskills associated with becoming independent readers.
This may, in part, be explained by the fact that 84% of teachers reported not having
received pre-service training in teaching reading, and 73% reported not having had any
related in-service training.
What teachers and students spend time doing is a function of teacher training, but it is
also influenced by the nature of the classroom and school environment within which they
find themselves each day.
One factor influencing almost all primary schools is the workload that teachers must bear.
Of the 42 schools, 40 (95%) in the sample were functioning on a double shift. In those
schools, teachers had responsibility for at least two sets of students, and about 70% of
teachers were teaching more than one grade and more than one subject. A total of 51% of
teachers were responsible for four or more preparations each day, with some having more
than six.
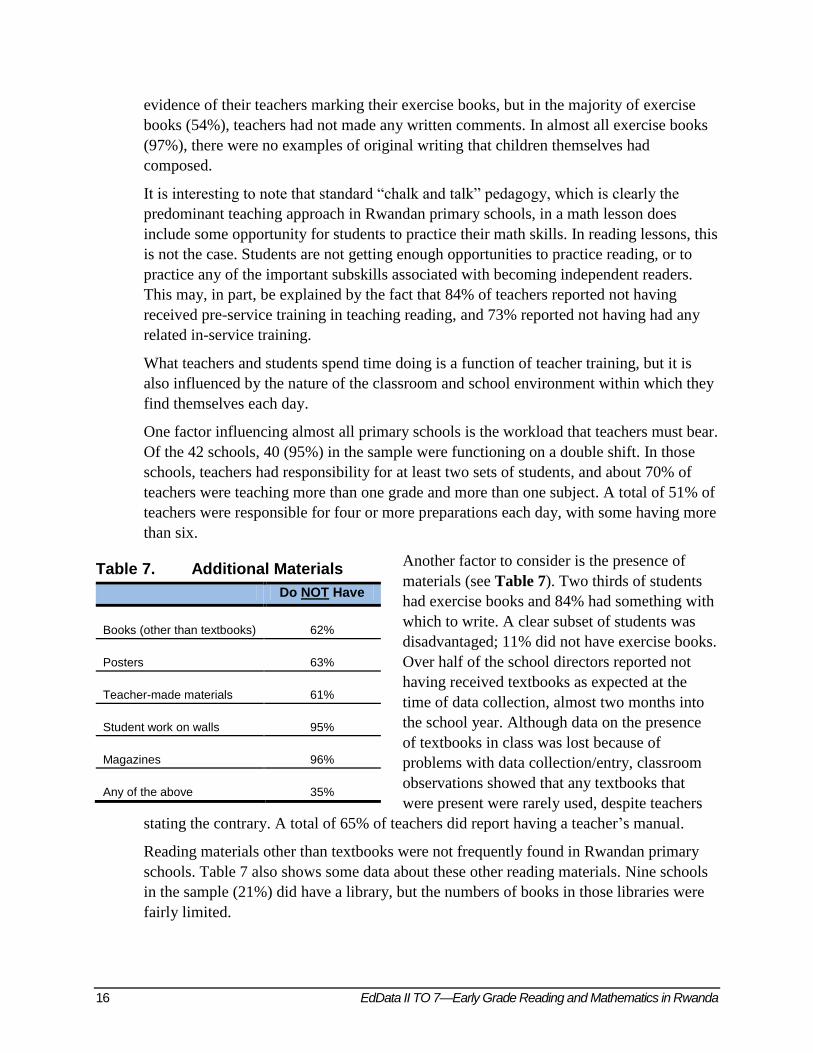
Another factor to consider is the presence of
materials (see Table 7). Two thirds of students
had exercise books and 84% had something with
which to write. A clear subset of students was
disadvantaged; 11% did not have exercise books.
Over half of the school directors reported not
having received textbooks as expected at the
time of data collection, almost two months into
the school year. Although data on the presence
of textbooks in class was lost because of
problems with data collection/entry, classroom
observations showed that any textbooks that
were present were rarely used, despite teachers
stating the contrary. A total of 65% of teachers did report having a teacher’s manual.
Reading materials other than textbooks were not frequently found in Rwandan primary
schools. Table 7 also shows some data about these other reading materials. Nine schools
in the sample (21%) did have a library, but the numbers of books in those libraries were
fairly limited.
Table 7. Additional Materials
Do NOT Have
Books (other than textbooks) 62%
Posters 63%
Teacher-made materials 61%
Student work on walls 95%
Magazines 96%
Any of the above 35%

EdData II TO 7—Early Grade Reading and Mathematics in Rwanda 17
In terms of the quality of the physical environment, most classrooms (80%) had a good
blackboard and had adequate lighting (80%). Many classrooms (41%) did not have
enough desks, but in 98% of classrooms the team observed no students sitting on the
floor. Students simply crowded onto the available benches. In almost all cases, desks
were arranged in traditional rows, but in 5% of classrooms, desks were arranged in small
groupings.
Lastly, how frequently teachers or students miss school can also impact the learning
process. None of the schools reported having been closed other than on official holidays.
It was noted that 71% of principals reported that one or more teachers were absent on the
previous day (usually due to illness). Also, 20% of students reported having been absent
the previous week, most frequently because they had been sick. Over 40% of students
reported having been tardy, almost always because they had other work to do at home.
Which Factors Are Most Strongly Associated with Better Student Performance?
This section of the report presents the results of several analyses conducted to determine
how much of the variation in student performance on the reading assessment can be
explained by the kinds of factors discussed in the previous section. We analyzed the data
gathered from student, teacher, and head teacher interviews, as well as the data from
school and classroom observations, to isolate the variables that correlated significantly
with variation in reading assessment results. We focused our analysis on reading in
Kinyarwanda, as the variation in student performance and the fact that both grades were
able to take the same test lent themselves better to analysis of correlations.
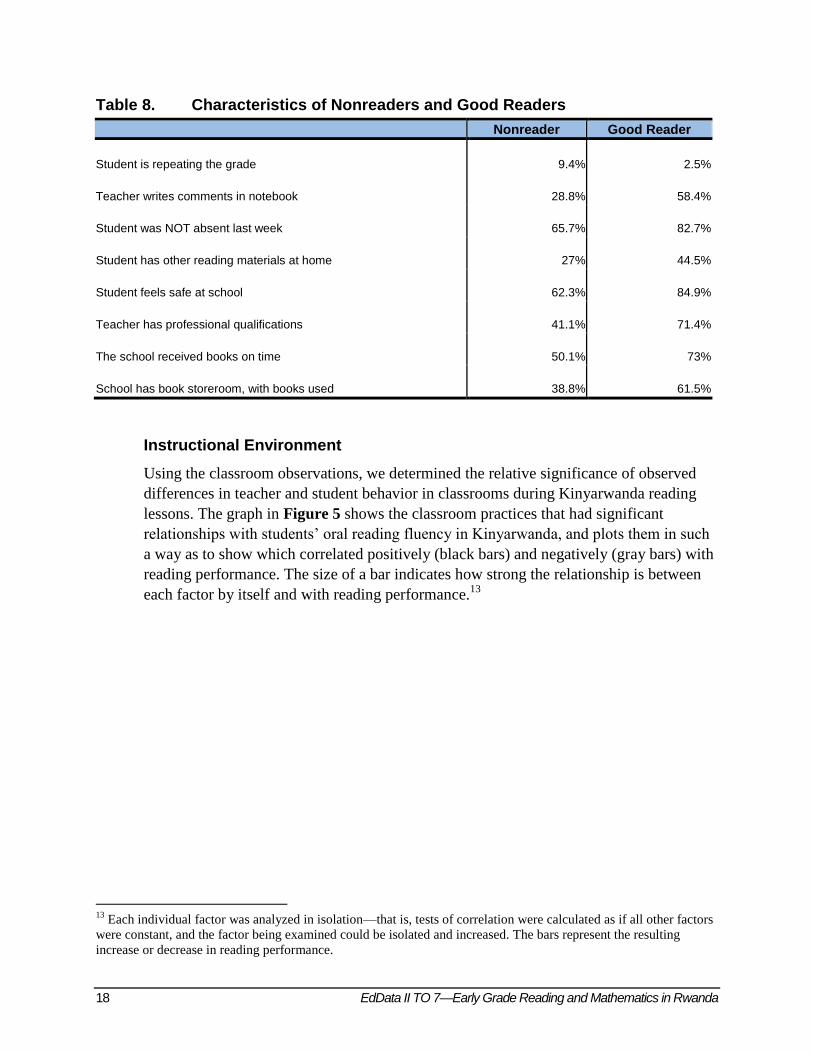
We found many factors that correlated with student performance in reading. These can be
organized into four broad categories: (1) the instructional environment, (2) the school
environment, (3) the home reading culture, and (4) the socioeconomic status (SES) of
students’ families. As an overview of these factors, we examined the characteristics of
good readers (at least 80% comprehension in Kinyarwanda) and nonreaders (not able to
read one word) across factors that correlated with student performance. Table 8
summarizes these factors and how these student groups differ across them. The factors
are discussed in more detail below.
18 EdData II TO 7—Early Grade Reading and Mathematics in Rwanda
Table 8. Characteristics of Nonreaders and Good Readers
Nonreader Good Reader
Student is repeating the grade 9.4% 2.5%
Teacher writes comments in notebook 28.8% 58.4%
Student was NOT absent last week 65.7% 82.7%
Student has other reading materials at home 27% 44.5%
Student feels safe at school 62.3% 84.9%
Teacher has professional qualifications 41.1% 71.4%
The school received books on time 50.1% 73%
School has book storeroom, with books used 38.8% 61.5%
Instructional Environment
Using the classroom observations, we determined the relative significance of observed
differences in teacher and student behavior in classrooms during Kinyarwanda reading
lessons. The graph in Figure 5 shows the classroom practices that had significant
relationships with students’ oral reading fluency in Kinyarwanda, and plots them in such
a way as to show which correlated positively (black bars) and negatively (gray bars) with
reading performance. The size of a bar indicates how strong the relationship is between
each factor by itself and with reading performance.13
13
Each individual factor was analyzed in isolation—that is, tests of correlation were calculated as if all other factors
were constant, and the factor being examined could be isolated and increased. The bars represent the resulting
increase or decrease in reading performance.
EdData II TO 7—Early Grade Reading and Mathematics in Rwanda 19
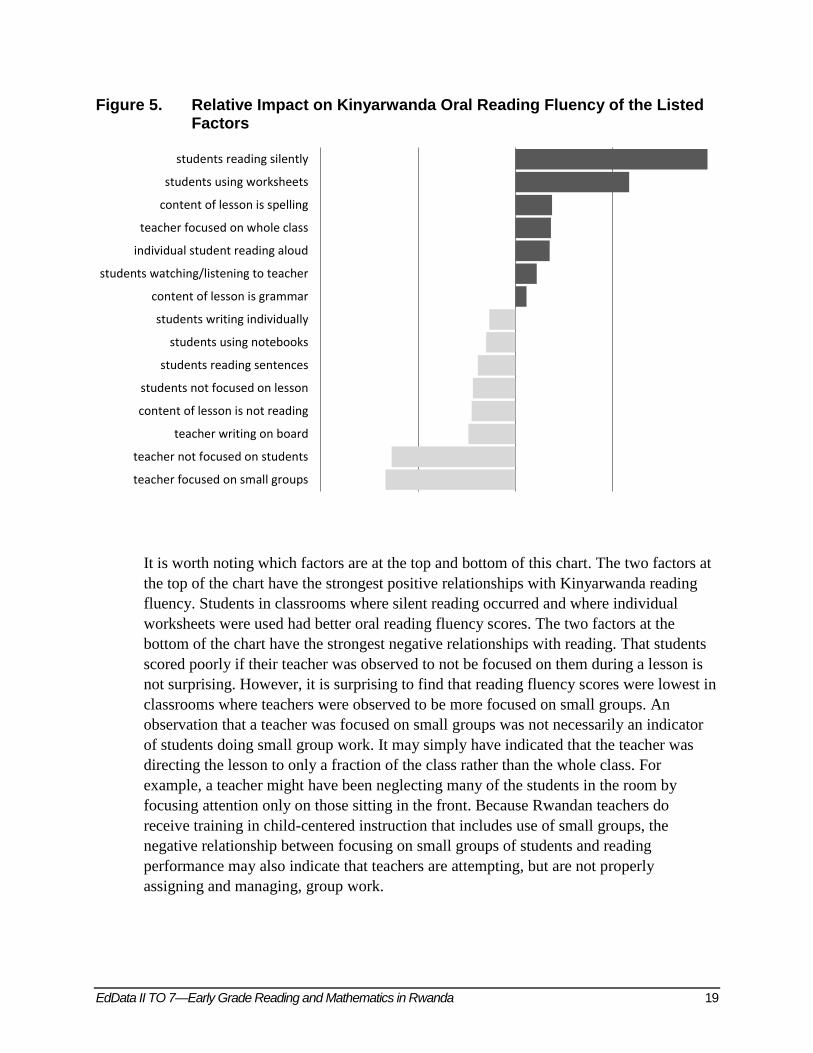
Figure 5. Relative Impact on Kinyarwanda Oral Reading Fluency of the Listed Factors
It is worth noting which factors are at the top and bottom of this chart. The two factors at
the top of the chart have the strongest positive relationships with Kinyarwanda reading
fluency. Students in classrooms where silent reading occurred and where individual
worksheets were used had better oral reading fluency scores. The two factors at the
bottom of the chart have the strongest negative relationships with reading. That students
scored poorly if their teacher was observed to not be focused on them during a lesson is
not surprising. However, it is surprising to find that reading fluency scores were lowest in
classrooms where teachers were observed to be more focused on small groups. An
observation that a teacher was focused on small groups was not necessarily an indicator
of students doing small group work. It may simply have indicated that the teacher was
directing the lesson to only a fraction of the class rather than the whole class. For
example, a teacher might have been neglecting many of the students in the room by
focusing attention only on those sitting in the front. Because Rwandan teachers do
receive training in child-centered instruction that includes use of small groups, the
negative relationship between focusing on small groups of students and reading
performance may also indicate that teachers are attempting, but are not properly
assigning and managing, group work.
teacher focused on small groups
teacher not focused on students
teacher writing on board
content of lesson is not reading
students not focused on lesson
students reading sentences
students using notebooks
students writing individually
content of lesson is grammar
students watching/listening to teacher
individual student reading aloud
teacher focused on whole class
content of lesson is spelling
students using worksheets
students reading silently
20 EdData II TO 7—Early Grade Reading and Mathematics in Rwanda
School Environment
Students in schools that were better equipped (that had electricity or water from a tap)
had better Kinyarwanda oral reading fluency scores. Students in schools that made use of
learning materials also performed better. For example, we found that students performed
slightly better in reading if their school had a storeroom with books that showed obvious
evidence of being used regularly. How teachers evaluated student work was also a
determining factor. Students who had regular written comments in their exercise book,
whose teachers reported using written tests to evaluate their performance, and whose
teachers discussed their school work with them, had better reading performance. The
strongest school environment factor associated with reading performance was having a
teacher with professional qualifications.
Home Environment
Students from families in which no one could read had lower reading outcomes than
those who were from families in which the mother or father, or another relative at home,
could read. Students from families in which someone could read also performed better in
math. Having books other than school books available at home also showed up as a factor
associated with higher performance in reading.
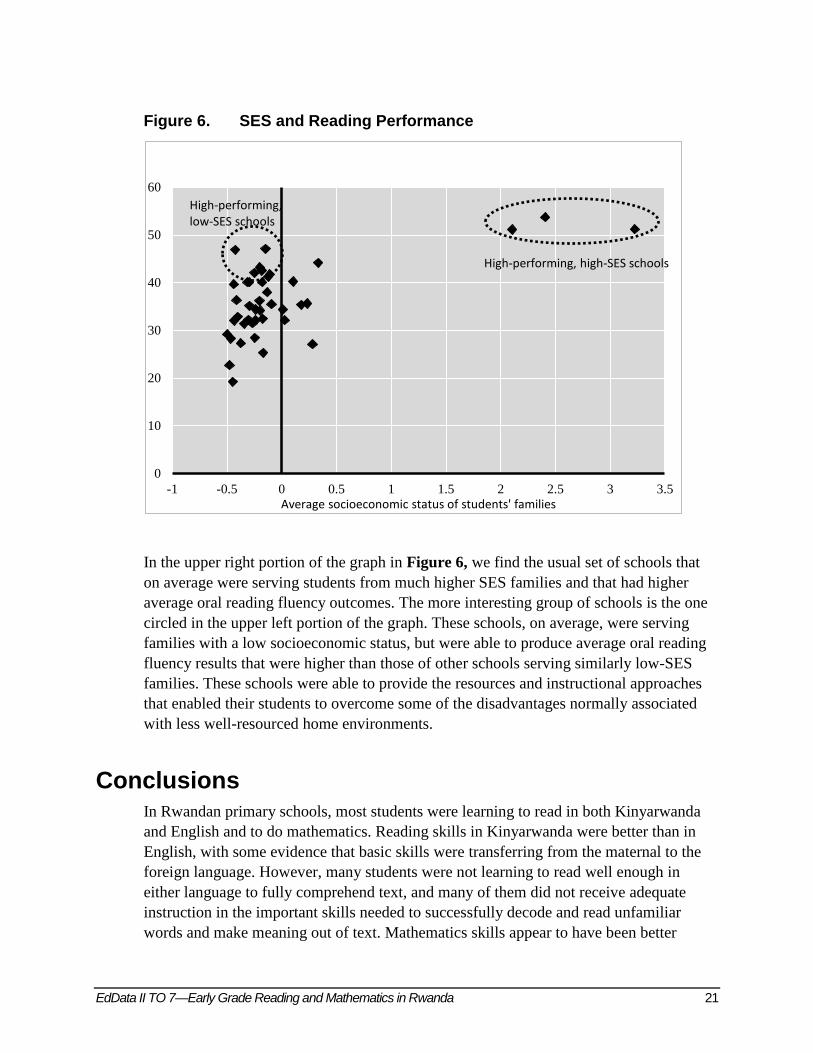
Socioeconomic Status14
As would be expected, students from families with higher SES had higher reading
performance. For example, students who reported that their families had electricity, piped
water, or a television, performed better than those who did not have these things.
However, we did try to determine if schools could help students overcome the typical
learning advantages that accrue to students from higher-SES families. Figure 6 below
shows students’ average oral reading fluency in Kinyarwanda and the average
socioeconomic status of the families served by each school.
14
An SES proxy was created by asking students a series of questions about possessions in the household. Factor
analysis was then used to create a composite SES variable.
EdData II TO 7—Early Grade Reading and Mathematics in Rwanda 21
Figure 6. SES and Reading Performance
In the upper right portion of the graph in Figure 6, we find the usual set of schools that
on average were serving students from much higher SES families and that had higher
average oral reading fluency outcomes. The more interesting group of schools is the one
circled in the upper left portion of the graph. These schools, on average, were serving
families with a low socioeconomic status, but were able to produce average oral reading
fluency results that were higher than those of other schools serving similarly low-SES
families. These schools were able to provide the resources and instructional approaches
that enabled their students to overcome some of the disadvantages normally associated
with less well-resourced home environments.
Conclusions
In Rwandan primary schools, most students were learning to read in both Kinyarwanda
and English and to do mathematics. Reading skills in Kinyarwanda were better than in
English, with some evidence that basic skills were transferring from the maternal to the
foreign language. However, many students were not learning to read well enough in
either language to fully comprehend text, and many of them did not receive adequate
instruction in the important skills needed to successfully decode and read unfamiliar
words and make meaning out of text. Mathematics skills appear to have been better
0
10
20
30
40
50
60
-1 -0.5 0 0.5 1 1.5 2 2.5 3 3.5Average socioeconomic status of students' families
High-performing, high-SES schools
High-performing, low-SES schools
22 EdData II TO 7—Early Grade Reading and Mathematics in Rwanda
taught than reading, although students were not learning to automatically perform the
basic calculations that underpin further work in mathematics and the sciences. Some
important number concepts also appear to not have been fully developed.
A recent study conducted by Uwezo in Kenya, Tanzania, and Uganda evaluated students’
reading of Standard II level English text.15
Very few Standard IV students in Tanzania
and Uganda demonstrated Standard II level competency, and disappointing percentages
of Standard VI students in those two countries were able to adequately read English at the
Standard II level. Kenya had much better results. Although the EGRA used in Rwanda
was different from the instruments used in the Uwezo study, we do see comparable levels
of performance among P6 students and the Standard VI students in Tanzania and Uganda,
all of which were well below what students in those grades should be able to do in
education systems that expect them to be learning in English. As in Rwanda, the results
in Tanzania and Uganda were better for mathematics than for reading, but again with not
all Standard VI (or P6) students mastering Standard II (P2) level material.
This study of reading and math performance draws our attention to the classroom
practices that are needed to support improved acquisition of basic skills in Rwandan
primary schools.
First, teachers need to receive adequate training in classroom practices that support the
development of their students’ foundational reading and math skills. As mentioned in
discussing the classroom observation results, classroom time is spent mostly on the
language instruction—e.g., grammar, syntax, and punctuation—to the detriment of
instruction in the basic features of literacy acquisition. To learn to read in alphabetic
languages, students need to be taught the sound each letter makes; must learn to
recognize those sounds at the beginning, middle, and ends of words; and must learn to
blend sounds together to form words. They must learn how to and spend time practicing
decoding unfamiliar words. Teachers will need to learn how to incorporate these kinds of
activities into their daily lessons.16
Second, emphasis needs to be placed on using classroom time as productively as
possible, giving students ample practice in reading (which also means making sure more
reading materials are available in school) and doing math (which will require teachers
making better use of pictures and objects to reinforce number concepts, quantity
differentiation, and mathematical applications). While we observed some practicing of
basic math skills, what was being done is far from adequate. Teachers need to learn the
techniques for managing classroom time to ensure adequate practice in basic math and
reading skills. Teachers should learn why it is important to provide daily practice (in
class and in students’ assignments) in math and in oral reading (the only way to develop
fluency). Research has shown that the amount of time spent learning basic skills is a
15
Hoogeveen, H. and D. Andrew. (June 2011) Are our children learning? Numeracy and literacy across East
Africa. Report prepared by the Uwezo Unit, Kenya; based at Twaweza East Africa, Tanzania. 16
See for example, Gove, A. and Cvelich, P. (2010). Early reading: Igniting education for all. A report by the Early
Grade Reading Community of Practice. Research Triangle Park, North Carolina: RTI International.
EdData II TO 7—Early Grade Reading and Mathematics in Rwanda 23
critical determinant of students’ levels of achievement, especially for students who come
to school with less than the desired level of language development. Given the language
transition issues in Rwanda, students are trying to learn to read (and do math) in
languages for which their vocabularies are underdeveloped, so therefore more time is
needed to make up for that language deficiency and to build requisite basic skills.17
The issues of instructional content and allocation and use of adequate time for developing
and practicing basic skills are further compounded by the recent switch to English as a
medium of instruction. If more time and instructional technique are devoted to
developing solid foundations of reading and math skills in Kinyarwanda, students will be
better positioned to switch to English. However, introduction of English and development
of sufficient oral vocabulary (something this survey revealed is not happening) needs to
be targeted as a specific area of intervention. The success Rwanda has had providing
English language training to teachers needs to be build on and reinforced; teachers need
to build strong enough English skills themselves to be able to promote the development
of their students’ language skills.
Once they have acquired sufficient knowledge of and working vocabularies in English,
students will then need good instruction in the basic phonetics of the English language so
that they can learn to easily decode words. And they need abundant practice reading
increasingly challenging English text so that they can build fluency and comprehension.
Students need to develop much stronger reading and comprehension skills than those
these assessments revealed, before they can be expected to encounter and understand
subject matter taught in English in upper primary and post-primary grades.
Once the above improvements have been made, it will be important to utilize instruments
like EGRA and EGMA in order to examine whether, and how quickly, proficiency is
improving. In the Rwandan context, the results presented here show that the
EGRA/EGMA instruments are most appropriate at the earlier grade levels (P1–P3 for
Kinyarwanda, and P4 for English). That is, while students at the end of P3 and P5 (or
beginning of P4 and P6, as targeted in this study) showed areas of need for improvement,
the results were positive enough to indicate that with targeted support, as described
above, there is potential for moving students to mastery and beyond relatively quickly. It
will be important, then, to assess students in the earlier grades in order to ensure they
learn to read with fluency and comprehension before they are expected to use their
mastery of reading skills in order to learn across the subjects.
17
See for example, Brown, B., & Saks, D. (1986). Measuring the effects of instructional time on student learning:
Evidence from the beginning teacher evaluation study. American Journal of Education, 94(4): 480-500.

EdData II TO 7—Early Grade Reading and Mathematics in Rwanda A-1
Annex A. Further Discussion of the Students and Schools Included in the Sample
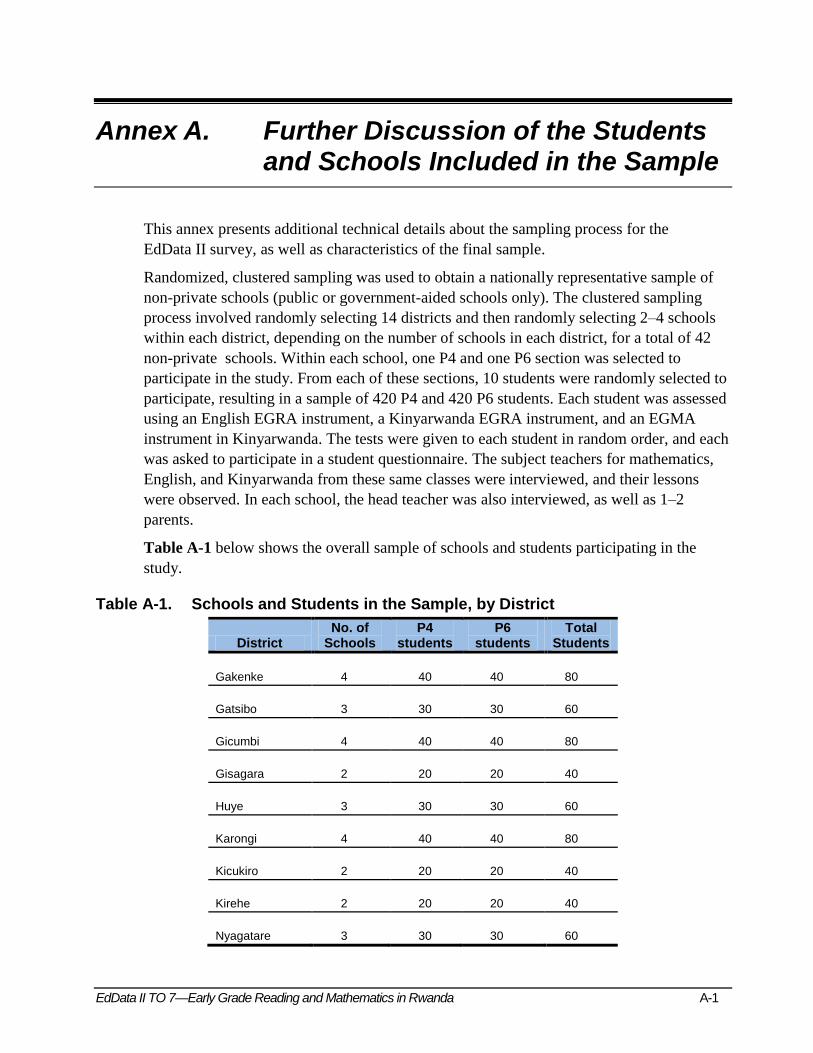
This annex presents additional technical details about the sampling process for the
EdData II survey, as well as characteristics of the final sample.
Randomized, clustered sampling was used to obtain a nationally representative sample of
non-private schools (public or government-aided schools only). The clustered sampling
process involved randomly selecting 14 districts and then randomly selecting 2–4 schools
within each district, depending on the number of schools in each district, for a total of 42
non-private schools. Within each school, one P4 and one P6 section was selected to
participate in the study. From each of these sections, 10 students were randomly selected to
participate, resulting in a sample of 420 P4 and 420 P6 students. Each student was assessed
using an English EGRA instrument, a Kinyarwanda EGRA instrument, and an EGMA
instrument in Kinyarwanda. The tests were given to each student in random order, and each
was asked to participate in a student questionnaire. The subject teachers for mathematics,
English, and Kinyarwanda from these same classes were interviewed, and their lessons
were observed. In each school, the head teacher was also interviewed, as well as 1–2
parents.
Table A-1 below shows the overall sample of schools and students participating in the
study.
Table A-1. Schools and Students in the Sample, by District
District No. of
Schools P4
students P6
students Total
Students
Gakenke 4 40 40 80
Gatsibo 3 30 30 60
Gicumbi 4 40 40 80
Gisagara 2 20 20 40
Huye 3 30 30 60
Karongi 4 40 40 80
Kicukiro 2 20 20 40
Kirehe 2 20 20 40
Nyagatare 3 30 30 60

A-2 EdData II TO 7—Early Grade Reading and Mathematics in Rwanda
District No. of
Schools P4
students P6
students Total
Students
Nyamagabe 3 30 30 60
Nyaruguru 4 40 40 80
Rubavu 3 30 30 60
Rusizi 2 20 20 40
Rutsiro 3 30 30 60
TOTAL 42 420 420 840
Student Characteristics
The gender of participating students
is shown in Table A-2, with girls
representing slightly more than half
of the student sample.
The average age of P4 students, as
reported in the class register, was
12.4 years, but with a wide range
(from 6 years to 20 years). The average age of P6 students was 14.6 years, ranging from 10
to 19. If the appropriate age for P4 could be generously considered to be from 7 to 11 years
of age, then 65% of P4 students were over age. Similarly, if for P6 we allow the
appropriate age to be considered from 9 to 13 years, then 73.6% of P6 students were over
age. In addition, 13% of the P4 students reported having been in P4 last year (they were
repeating the year), while only 2% of P6 students reported repeating the grade. When asked
to identify their own absence or tardiness during the previous week of school, 20.2% of
students stated that they had been absent, while 46.7% said they had been tardy. Illness and
other work to do at home were the primary reasons reported for both absence and tardiness.
The students were also asked which language they primarily use at home. From the study
sample, 98% of children reported that they mostly speak the Kinyarwanda language at
home—only one child reported speaking in English at home. In addition, students were
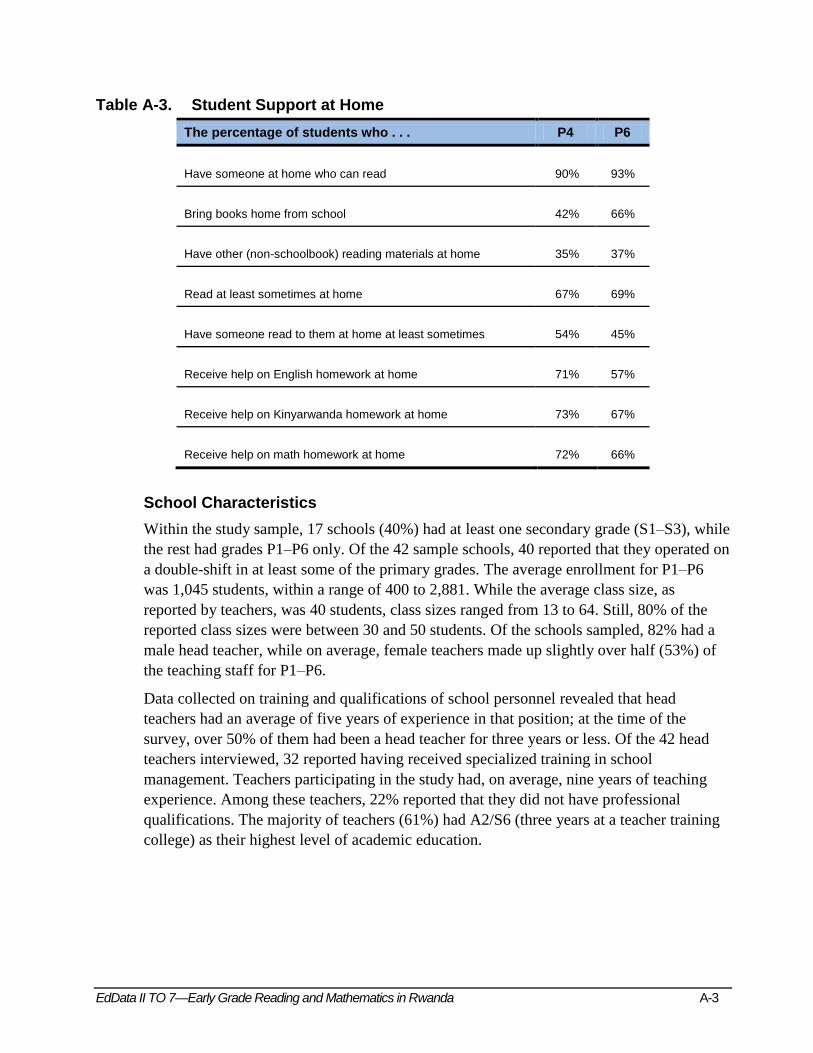
asked a number of questions about the support they received at home. This information is
presented in Table A-3 below.
Table A-2. Students in the Sample, by Gender
P4 P6
Male 195 (46%) 197 (47%)
Female 225 (54%) 223 (53%)
EdData II TO 7—Early Grade Reading and Mathematics in Rwanda A-3
Table A-3. Student Support at Home
The percentage of students who . . . P4 P6
Have someone at home who can read 90% 93%
Bring books home from school 42% 66%
Have other (non-schoolbook) reading materials at home 35% 37%
Read at least sometimes at home 67% 69%
Have someone read to them at home at least sometimes 54% 45%
Receive help on English homework at home 71% 57%
Receive help on Kinyarwanda homework at home 73% 67%
Receive help on math homework at home 72% 66%
School Characteristics
Within the study sample, 17 schools (40%) had at least one secondary grade (S1–S3), while
the rest had grades P1–P6 only. Of the 42 sample schools, 40 reported that they operated on
a double-shift in at least some of the primary grades. The average enrollment for P1–P6
was 1,045 students, within a range of 400 to 2,881. While the average class size, as
reported by teachers, was 40 students, class sizes ranged from 13 to 64. Still, 80% of the
reported class sizes were between 30 and 50 students. Of the schools sampled, 82% had a
male head teacher, while on average, female teachers made up slightly over half (53%) of
the teaching staff for P1–P6.
Data collected on training and qualifications of school personnel revealed that head
teachers had an average of five years of experience in that position; at the time of the
survey, over 50% of them had been a head teacher for three years or less. Of the 42 head
teachers interviewed, 32 reported having received specialized training in school
management. Teachers participating in the study had, on average, nine years of teaching
experience. Among these teachers, 22% reported that they did not have professional
qualifications. The majority of teachers (61%) had A2/S6 (three years at a teacher training
college) as their highest level of academic education.
A-4 EdData II TO 7—Early Grade Reading and Mathematics in Rwanda
Data collected on class visits, in-service training, and parental involvement showed that
79% of teachers interviewed reported being visited or observed in their classes at least once
a month. Of the study sample teachers, 78% reported being visited or observed in their
class by an education officer (external to the school) at most once a year, and 55% of head
teachers reported that their schools were visited by an education officer at most once a
year. As for training, 64% of English and Kinyarwanda teachers reported having neither
pre-service nor in-service training in methods for teaching reading, and 58% of math
teachers reported having had neither pre-service nor in-service training related to math
instruction.
EdData II TO 7—Early Grade Reading and Mathematics in Rwanda B-1
Annex B. Reliability of EGRA/EGMA Instruments
We undertook a number of tests in order to determine whether and how the various
subtasks on the EGRA and EGMA assessments used in Rwanda were reliable, and
whether they were testing an underlying skill, presumably early grade reading and math
skills. For the English EGRA, we focused on P6, as the P4 assessment was an
abbreviated form of the core EGRA assessment and focused only on oral language and
pre-reading skills.
In order to examine reliability, we first performed a Cronbach’s alpha reliability test, the
results of which are presented in Tables B-1 through B-5.
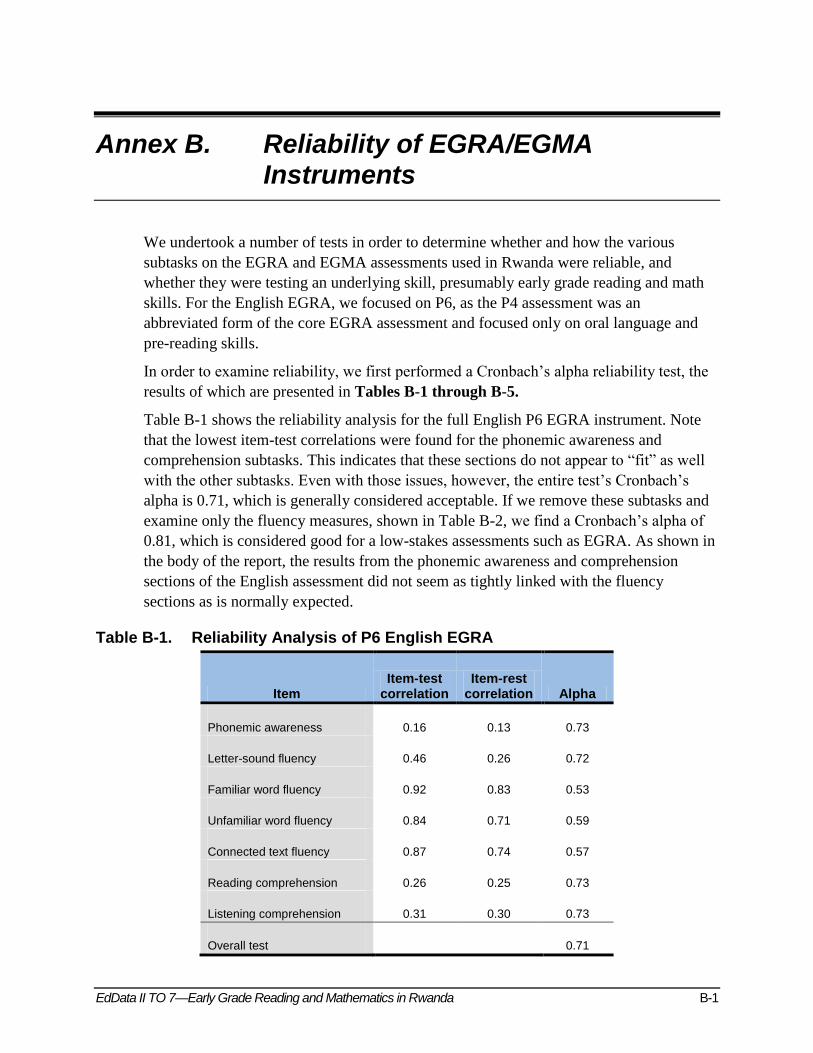
Table B-1 shows the reliability analysis for the full English P6 EGRA instrument. Note
that the lowest item-test correlations were found for the phonemic awareness and
comprehension subtasks. This indicates that these sections do not appear to ―fit‖ as well
with the other subtasks. Even with those issues, however, the entire test’s Cronbach’s
alpha is 0.71, which is generally considered acceptable. If we remove these subtasks and
examine only the fluency measures, shown in Table B-2, we find a Cronbach’s alpha of
0.81, which is considered good for a low-stakes assessments such as EGRA. As shown in
the body of the report, the results from the phonemic awareness and comprehension
sections of the English assessment did not seem as tightly linked with the fluency
sections as is normally expected.
Table B-1. Reliability Analysis of P6 English EGRA
Item Item-test
correlation Item-rest
correlation Alpha
Phonemic awareness 0.16 0.13 0.73
Letter-sound fluency 0.46 0.26 0.72
Familiar word fluency 0.92 0.83 0.53
Unfamiliar word fluency 0.84 0.71 0.59
Connected text fluency 0.87 0.74 0.57
Reading comprehension 0.26 0.25 0.73
Listening comprehension 0.31 0.30 0.73
Overall test 0.71

B-2 EdData II TO 7—Early Grade Reading and Mathematics in Rwanda
Table B-2. Reliability Analysis of P6 EGRA: Fluency Measures
Item Item-test
correlation Item-rest
correlation Alpha
Letter-sound fluency 0.46 0.26 0.89
Familiar word fluency 0.92 0.83 0.64
Unfamiliar word fluency 0.84 0.71 0.72
Connected text fluency 0.87 0.74 0.70
Overall test 0.81
Table B-3 shows the reliability analysis for the Kinyarwanda EGRA instrument. The
item-test correlations for phonemic awareness and listening comprehension were lower
than for the other subtasks; however, the entire test’s Cronbach’s alpha is 0.84, which is
generally considered good for a low-stakes assessments such as EGRA.
Table B-3. Reliability Analysis of Kinyarwanda EGRA
Item Item-test
correlation Item-rest
correlation Alpha
Phonemic awareness 0.22 0.20 0.86
Letter-sound fluency 0.73 0.67 0.82
Syllable reading fluency 0.95 0.88 0.80
Familiar word fluency 0.96 0.93 0.76
Unfamiliar word fluency 0.89 0.85 0.79
Connected text fluency 0.92 0.87 0.77
Reading comprehension 0.65 0.65 0.85
Listening comprehension 0.32 0.31 0.86
Overall test 0.84
Both of the EGMA instruments show good Cronbach’s alphas, 0.81 and 0.80
respectively, with no particularly low subtask correlations (Tables B-4 and B-5).
EdData II TO 7—Early Grade Reading and Mathematics in Rwanda B-3
Table B-4. Reliability Analysis of P4 EGMA
Item Item-test
correlation Item-rest
correlation Alpha
Number identification 0.72 0.61 0.77
Quantity discrimination 0.70 0.54 0.78
Missing number 0.63 0.42 0.82
Word problems 0.69 0.54 0.79
Addition 0.77 0.66 0.76
Subtraction 0.82 0.70 0.75
Overall test 0.81
Table B-5. Reliability analysis of P6 EGMA
Item Item-test
correlation Item-rest
Correlation Alpha
Number identification 0.73 0.62 0.77
Quantity discrimination 0.63 0.46 0.79
Missing number 0.74 0.56 0.78
Word problems 0.72 0.58 0.77
Addition 0.67 0.61 0.79
Subtraction 0.72 0.64 0.77
Multiplication
Overall test 0.80
Next, we performed principal components analyses18
to investigate whether there was an
underlying construct that all of the EGRA subtasks and EGMA subtasks were evaluating.
The results from these tests are presented in Tables B-6 through B-7.
18
Principal components analysis is another means of determining whether the components of this particular
assessment measure an underlying skill, and how much of the variation in the sub-task achievement this particular
underlying component measures.

B-4 EdData II TO 7—Early Grade Reading and Mathematics in Rwanda
Table B-6. Principal Components Analyses: EGRA
English P6 EGRA Kinyarwanda EGRA
Phonemic awareness 0.14 Phonemic awareness 0.10
Letter-sound fluency 0.22 Letter-sound fluency 0.31
Syllable reading fluency 0.42
Familiar word fluency 0.54 Familiar word fluency 0.45
Unfamiliar word fluency 0.47 Unfamiliar word fluency 0.41
Connected text fluency 0.52 Connected text fluency 0.44
Reading comprehension 0.27 Reading comprehension 0.37
Listening comprehension 0.30 Listening comprehension 0.16
Table B-7. Principal Component Analyses: EGMA
P4 EGMA P6 EGMA
Number identification 0.43 Number identification 0.39
Quantity discrimination 0.40 Quantity discrimination 0.32
Missing number 0.31 Missing number 0.37
Word problems 0.39 Word problems 0.40
Addition 0.45 Addition 0.41
Subtraction 0.46 Subtraction 0.37
Multiplication
The resultant principal component 1 loads at or above .32 on the majority of subtasks on
the Kinyarwanda EGRA and on all the fluency measures on the English EGRA. The
principal component 1 for both EGMA instruments is near or above .32 for all subtasks.19
19
See Tabachnick, B. G., & Fidell, L. S. (1996). Using multivariate statistics (3rd ed.). New York: HarperCollins,
which recommends .32 as a minimum loading level.
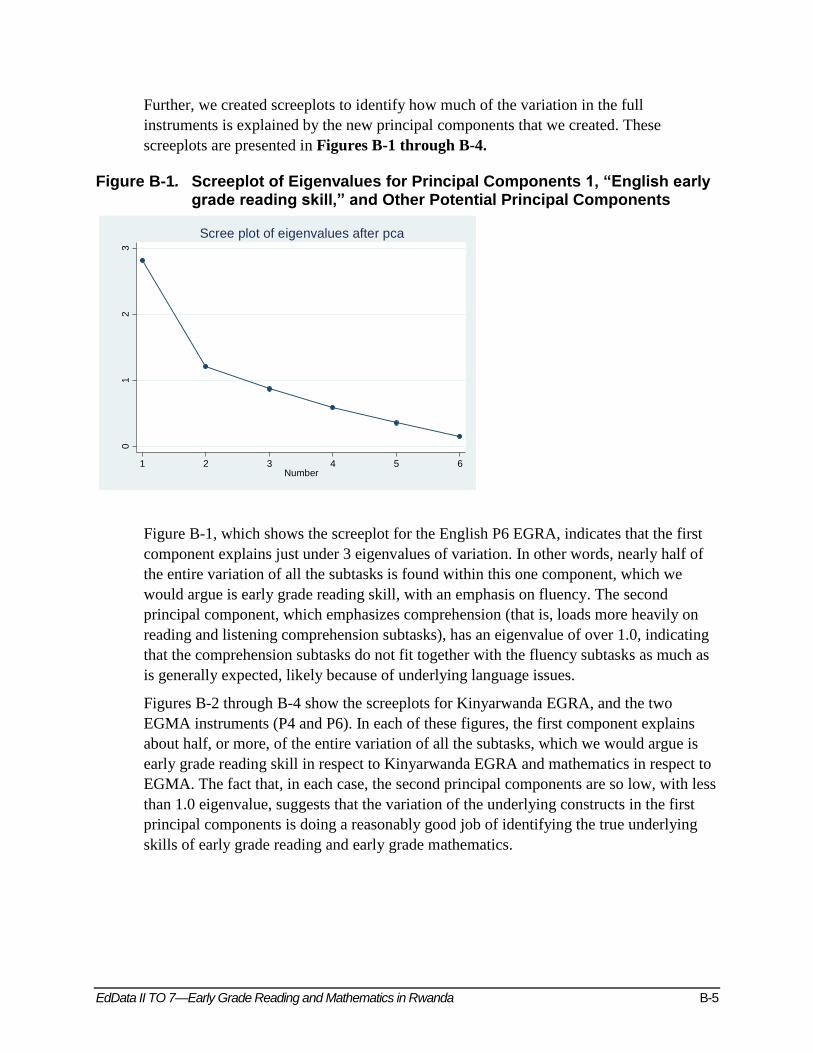
EdData II TO 7—Early Grade Reading and Mathematics in Rwanda B-5
Further, we created screeplots to identify how much of the variation in the full
instruments is explained by the new principal components that we created. These
screeplots are presented in Figures B-1 through B-4.
Figure B-1. Screeplot of Eigenvalues for Principal Components 1, “English early grade reading skill,” and Other Potential Principal Components
Figure B-1, which shows the screeplot for the English P6 EGRA, indicates that the first
component explains just under 3 eigenvalues of variation. In other words, nearly half of
the entire variation of all the subtasks is found within this one component, which we
would argue is early grade reading skill, with an emphasis on fluency. The second
principal component, which emphasizes comprehension (that is, loads more heavily on
reading and listening comprehension subtasks), has an eigenvalue of over 1.0, indicating
that the comprehension subtasks do not fit together with the fluency subtasks as much as
is generally expected, likely because of underlying language issues.
Figures B-2 through B-4 show the screeplots for Kinyarwanda EGRA, and the two
EGMA instruments (P4 and P6). In each of these figures, the first component explains
about half, or more, of the entire variation of all the subtasks, which we would argue is
early grade reading skill in respect to Kinyarwanda EGRA and mathematics in respect to
EGMA. The fact that, in each case, the second principal components are so low, with less
than 1.0 eigenvalue, suggests that the variation of the underlying constructs in the first
principal components is doing a reasonably good job of identifying the true underlying
skills of early grade reading and early grade mathematics.
01
23
Eig
en
valu
es
1 2 3 4 5 6Number
Scree plot of eigenvalues after pca
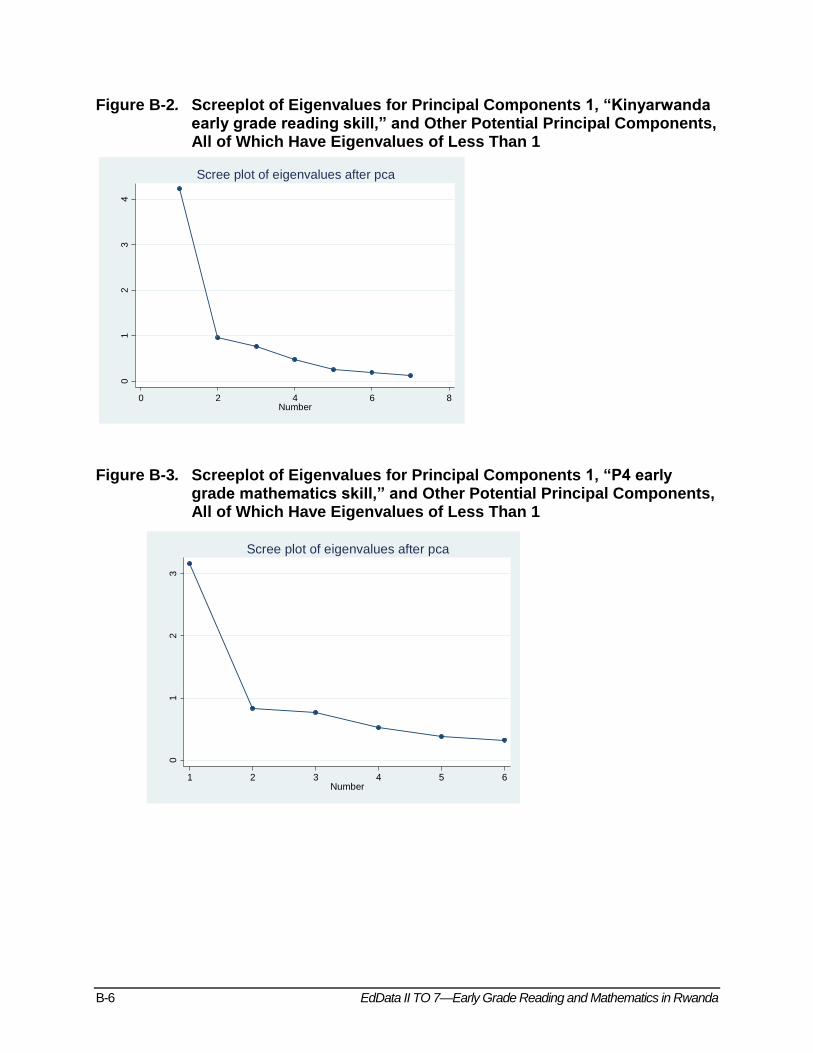
B-6 EdData II TO 7—Early Grade Reading and Mathematics in Rwanda
Figure B-2. Screeplot of Eigenvalues for Principal Components 1, “Kinyarwanda early grade reading skill,” and Other Potential Principal Components, All of Which Have Eigenvalues of Less Than 1
Figure B-3. Screeplot of Eigenvalues for Principal Components 1, “P4 early grade mathematics skill,” and Other Potential Principal Components, All of Which Have Eigenvalues of Less Than 1
01
23
4
Eig
en
valu
es
0 2 4 6 8Number
Scree plot of eigenvalues after pca0
12
3
Eig
en
valu
es
1 2 3 4 5 6Number
Scree plot of eigenvalues after pca
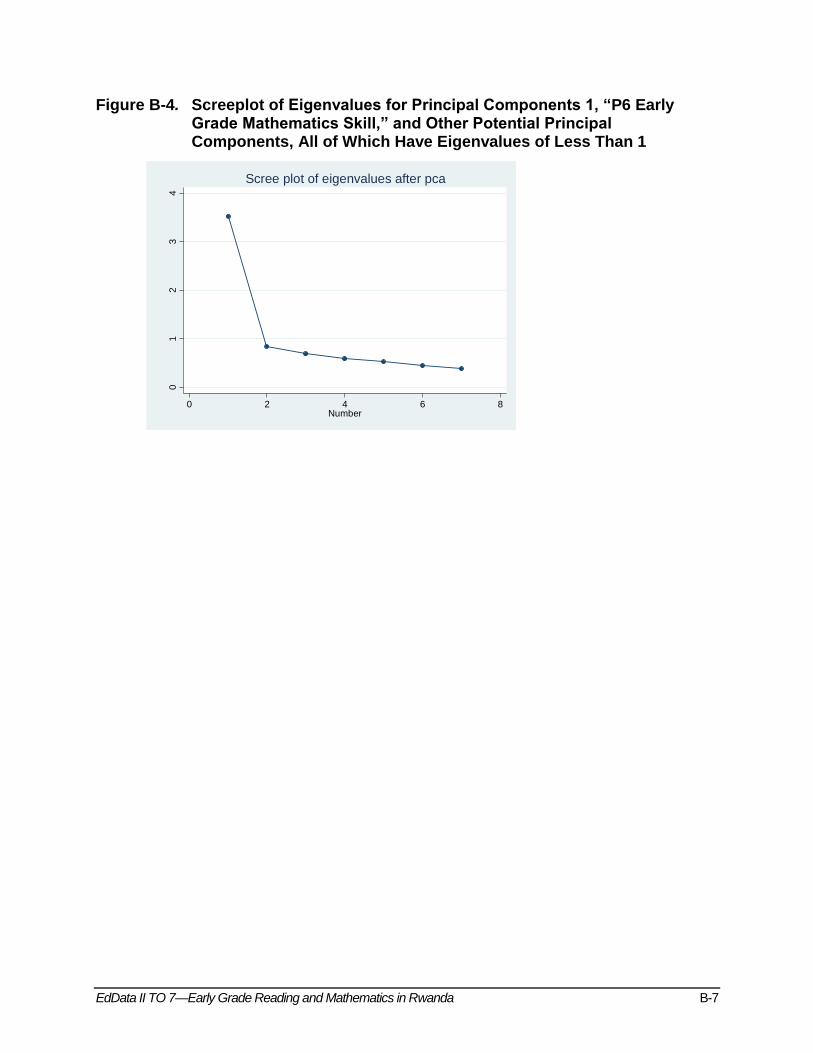
EdData II TO 7—Early Grade Reading and Mathematics in Rwanda B-7
Figure B-4. Screeplot of Eigenvalues for Principal Components 1, “P6 Early Grade Mathematics Skill,” and Other Potential Principal Components, All of Which Have Eigenvalues of Less Than 1
01
23
4
Eig
en
valu
es
0 2 4 6 8Number
Scree plot of eigenvalues after pca

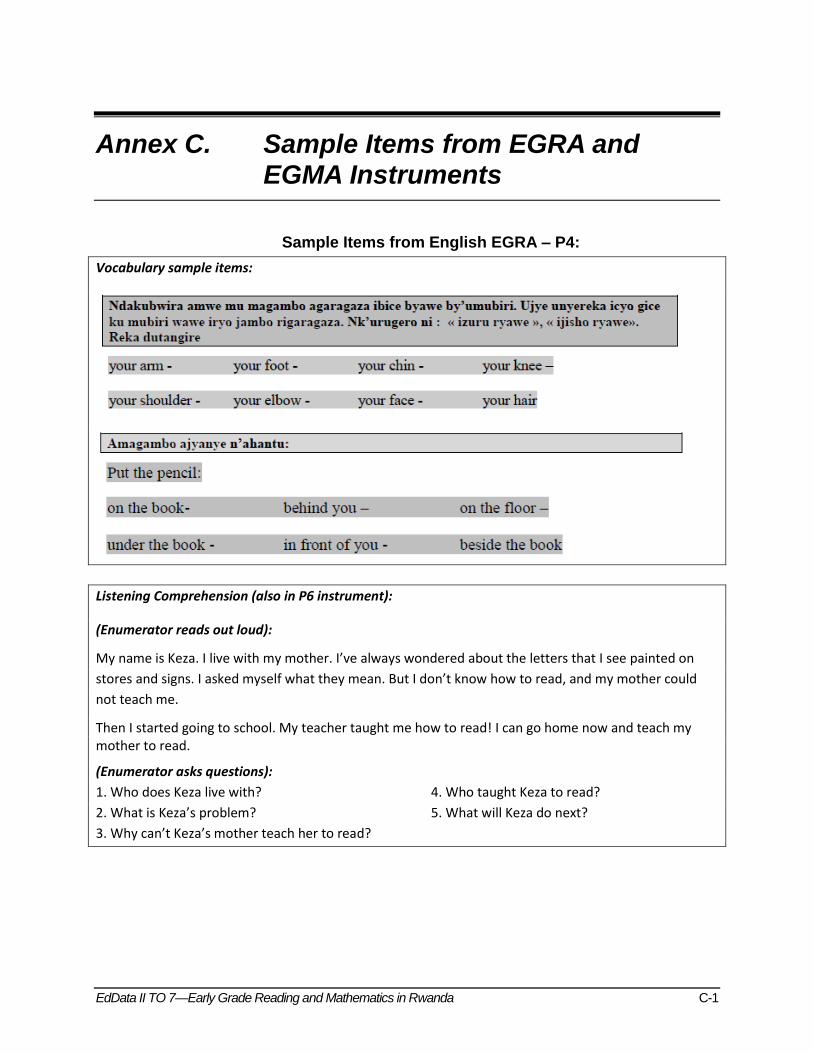
EdData II TO 7—Early Grade Reading and Mathematics in Rwanda C-1
Annex C. Sample Items from EGRA and EGMA Instruments
Sample Items from English EGRA – P4:
Vocabulary sample items:
Listening Comprehension (also in P6 instrument):
(Enumerator reads out loud):
My name is Keza. I live with my mother. I’ve always wondered about the letters that I see painted on
stores and signs. I asked myself what they mean. But I don’t know how to read, and my mother could
not teach me.
Then I started going to school. My teacher taught me how to read! I can go home now and teach my mother to read.
(Enumerator asks questions):
1. Who does Keza live with? 4. Who taught Keza to read?
2. What is Keza’s problem? 5. What will Keza do next?
3. Why can’t Keza’s mother teach her to read?
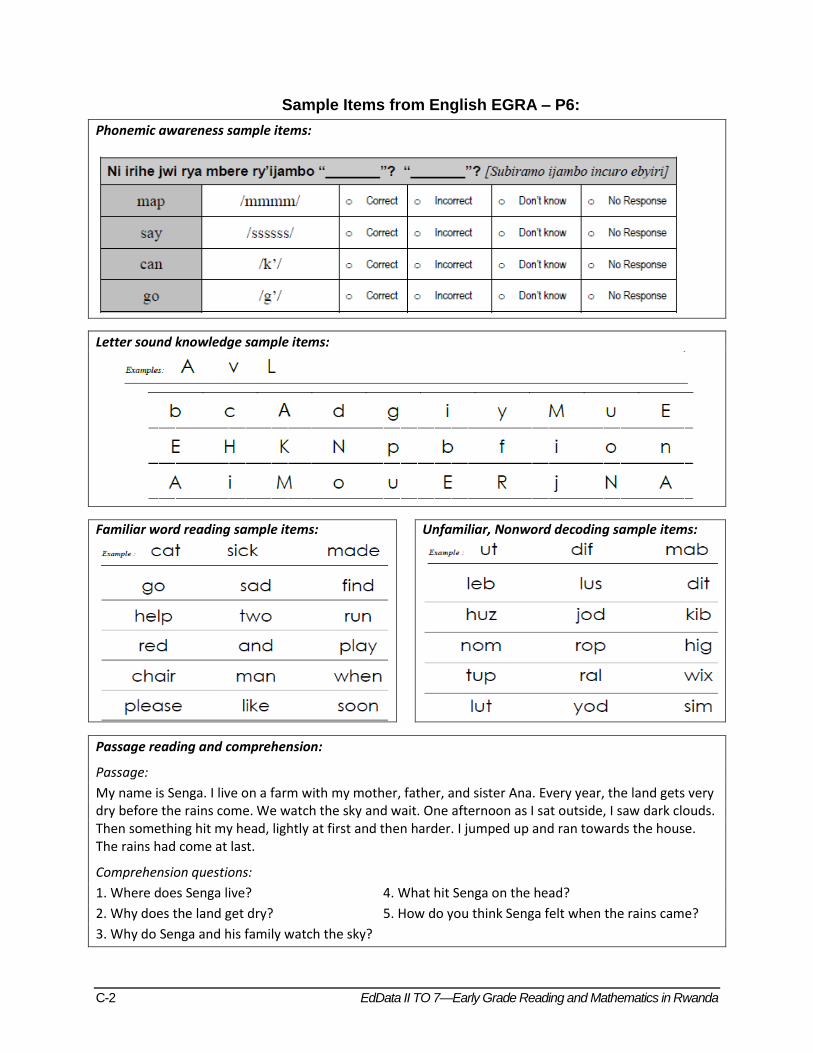
C-2 EdData II TO 7—Early Grade Reading and Mathematics in Rwanda
Sample Items from English EGRA – P6:
Phonemic awareness sample items:
Letter sound knowledge sample items:
Familiar word reading sample items:
Unfamiliar, Nonword decoding sample items:
Passage reading and comprehension:
Passage:
My name is Senga. I live on a farm with my mother, father, and sister Ana. Every year, the land gets very dry before the rains come. We watch the sky and wait. One afternoon as I sat outside, I saw dark clouds. Then something hit my head, lightly at first and then harder. I jumped up and ran towards the house. The rains had come at last.
Comprehension questions:
1. Where does Senga live? 4. What hit Senga on the head?
2. Why does the land get dry? 5. How do you think Senga felt when the rains came?
3. Why do Senga and his family watch the sky?
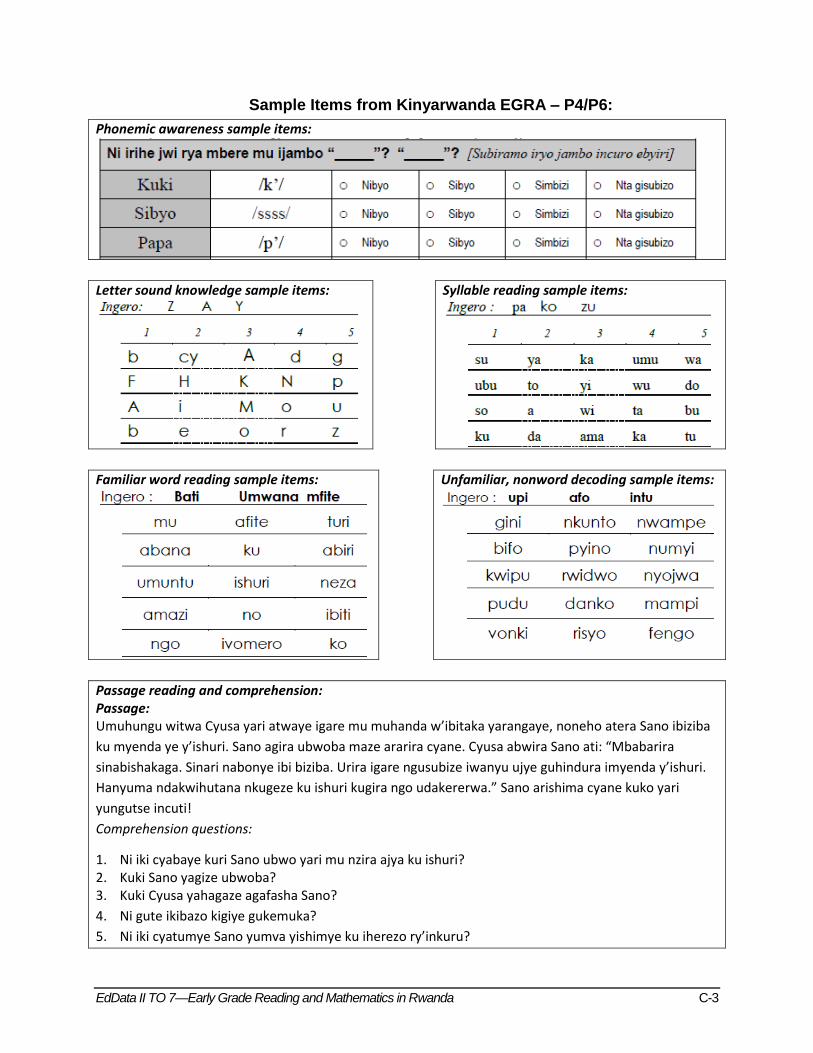
EdData II TO 7—Early Grade Reading and Mathematics in Rwanda C-3
Sample Items from Kinyarwanda EGRA – P4/P6:
Phonemic awareness sample items:
Letter sound knowledge sample items:
Syllable reading sample items:
Familiar word reading sample items:
Unfamiliar, nonword decoding sample items:
Passage reading and comprehension: Passage: Umuhungu witwa Cyusa yari atwaye igare mu muhanda w’ibitaka yarangaye, noneho atera Sano ibiziba
ku myenda ye y’ishuri. Sano agira ubwoba maze ararira cyane. Cyusa abwira Sano ati: “Mbabarira
sinabishakaga. Sinari nabonye ibi biziba. Urira igare ngusubize iwanyu ujye guhindura imyenda y’ishuri.
Hanyuma ndakwihutana nkugeze ku ishuri kugira ngo udakererwa.” Sano arishima cyane kuko yari
yungutse incuti!
Comprehension questions:
1. Ni iki cyabaye kuri Sano ubwo yari mu nzira ajya ku ishuri? 2. Kuki Sano yagize ubwoba? 3. Kuki Cyusa yahagaze agafasha Sano?
4. Ni gute ikibazo kigiye gukemuka?
5. Ni iki cyatumye Sano yumva yishimye ku iherezo ry’inkuru?
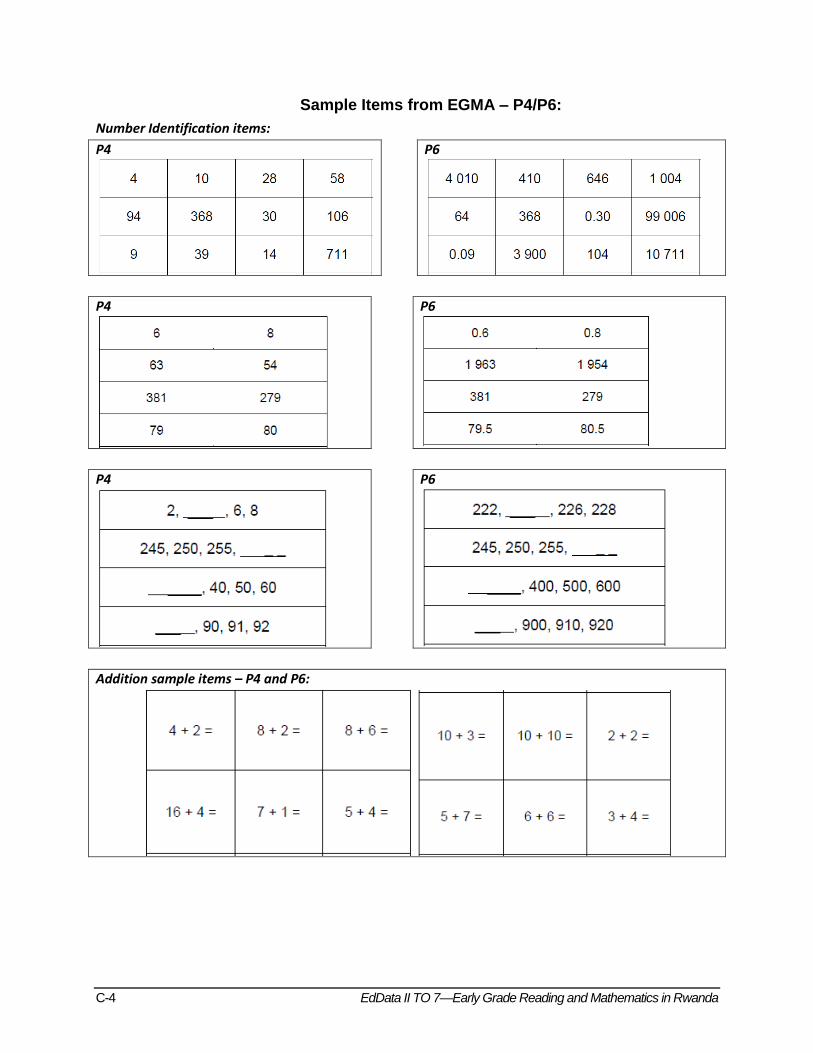
C-4 EdData II TO 7—Early Grade Reading and Mathematics in Rwanda
Sample Items from EGMA – P4/P6:
Number Identification items:
P4
P6
P4
P6
P4
P6
Addition sample items – P4 and P6:
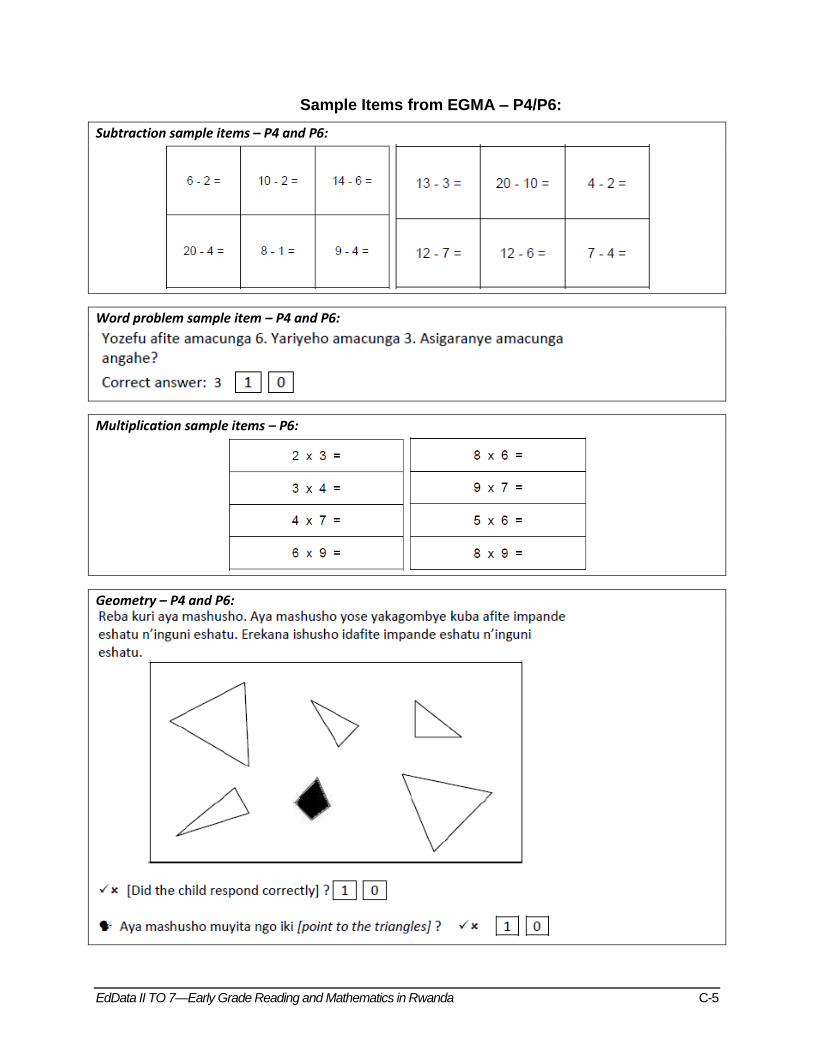
EdData II TO 7—Early Grade Reading and Mathematics in Rwanda C-5
Sample Items from EGMA – P4/P6:
Subtraction sample items – P4 and P6:
Word problem sample item – P4 and P6:
Multiplication sample items – P6:
Geometry – P4 and P6:

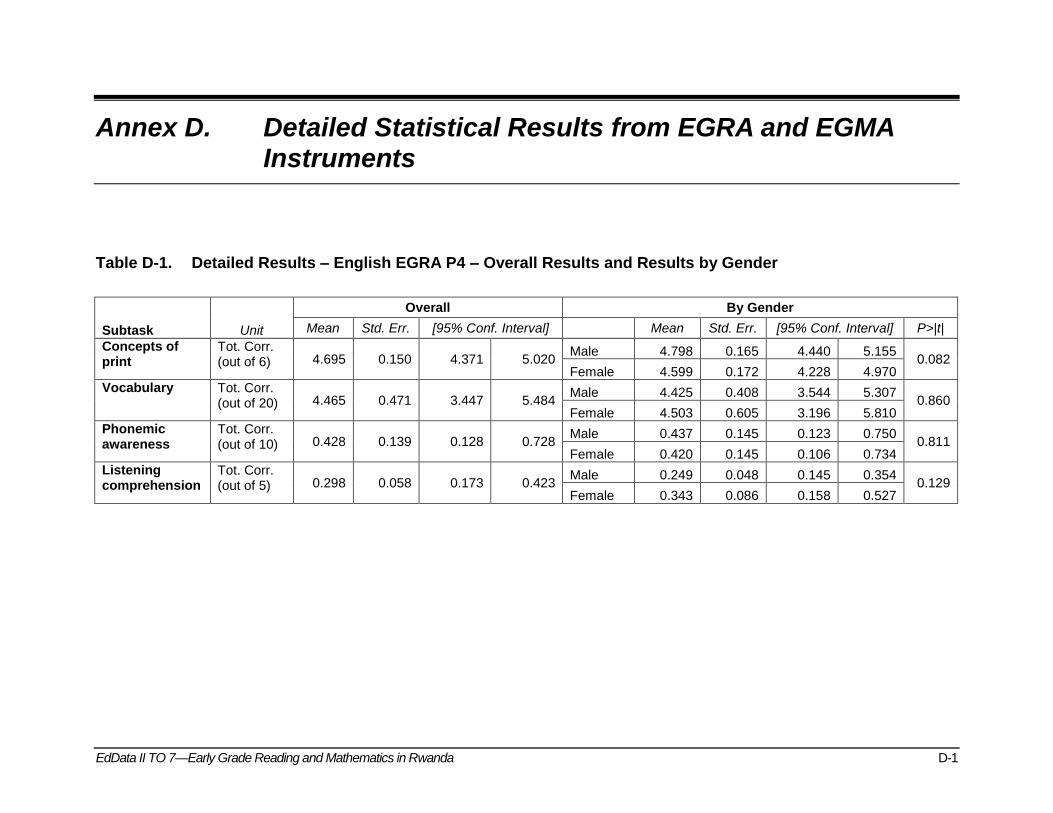
EdData II TO 7—Early Grade Reading and Mathematics in Rwanda D-1
Annex D. Detailed Statistical Results from EGRA and EGMA Instruments
Table D-1. Detailed Results – English EGRA P4 – Overall Results and Results by Gender
Subtask Unit
Overall By Gender
Mean Std. Err. [95% Conf. Interval]
Mean Std. Err. [95% Conf. Interval] P>|t|
Concepts of print
Tot. Corr. (out of 6) 4.695 0.150 4.371 5.020
Male 4.798 0.165 4.440 5.155 0.082
Female 4.599 0.172 4.228 4.970
Vocabulary Tot. Corr. (out of 20) 4.465 0.471 3.447 5.484
Male 4.425 0.408 3.544 5.307 0.860
Female 4.503 0.605 3.196 5.810
Phonemic awareness
Tot. Corr. (out of 10) 0.428 0.139 0.128 0.728
Male 0.437 0.145 0.123 0.750 0.811
Female 0.420 0.145 0.106 0.734
Listening comprehension
Tot. Corr. (out of 5) 0.298 0.058 0.173 0.423
Male 0.249 0.048 0.145 0.354 0.129
Female 0.343 0.086 0.158 0.527
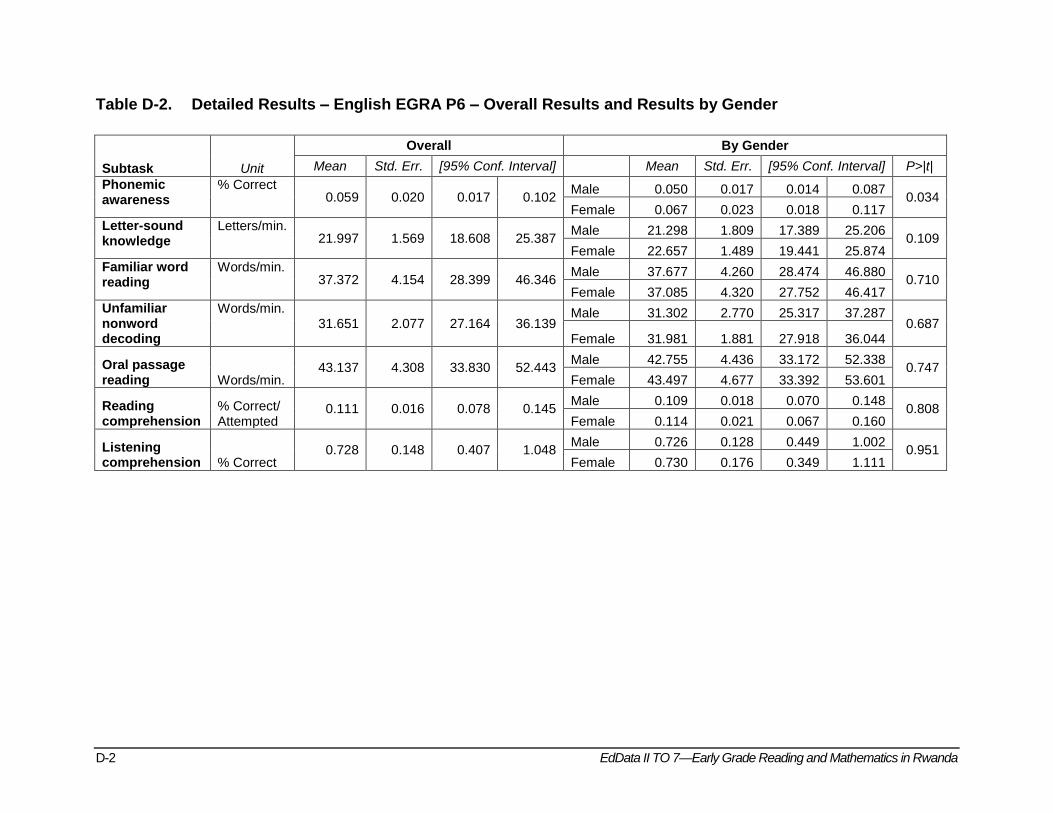
D-2 EdData II TO 7—Early Grade Reading and Mathematics in Rwanda
Table D-2. Detailed Results – English EGRA P6 – Overall Results and Results by Gender
Subtask Unit
Overall By Gender
Mean Std. Err. [95% Conf. Interval]
Mean Std. Err. [95% Conf. Interval] P>|t|
Phonemic awareness
% Correct 0.059 0.020 0.017 0.102
Male 0.050 0.017 0.014 0.087 0.034
Female 0.067 0.023 0.018 0.117
Letter-sound knowledge
Letters/min. 21.997 1.569 18.608 25.387
Male 21.298 1.809 17.389 25.206 0.109
Female 22.657 1.489 19.441 25.874
Familiar word reading
Words/min. 37.372 4.154 28.399 46.346
Male 37.677 4.260 28.474 46.880 0.710
Female 37.085 4.320 27.752 46.417
Unfamiliar nonword decoding
Words/min. 31.651 2.077 27.164 36.139
Male 31.302 2.770 25.317 37.287 0.687
Female 31.981 1.881 27.918 36.044
Oral passage reading Words/min.
43.137 4.308 33.830 52.443 Male 42.755 4.436 33.172 52.338
0.747 Female 43.497 4.677 33.392 53.601
Reading comprehension
% Correct/ Attempted
0.111 0.016 0.078 0.145 Male 0.109 0.018 0.070 0.148
0.808 Female 0.114 0.021 0.067 0.160
Listening comprehension % Correct
0.728 0.148 0.407 1.048 Male 0.726 0.128 0.449 1.002
0.951 Female 0.730 0.176 0.349 1.111
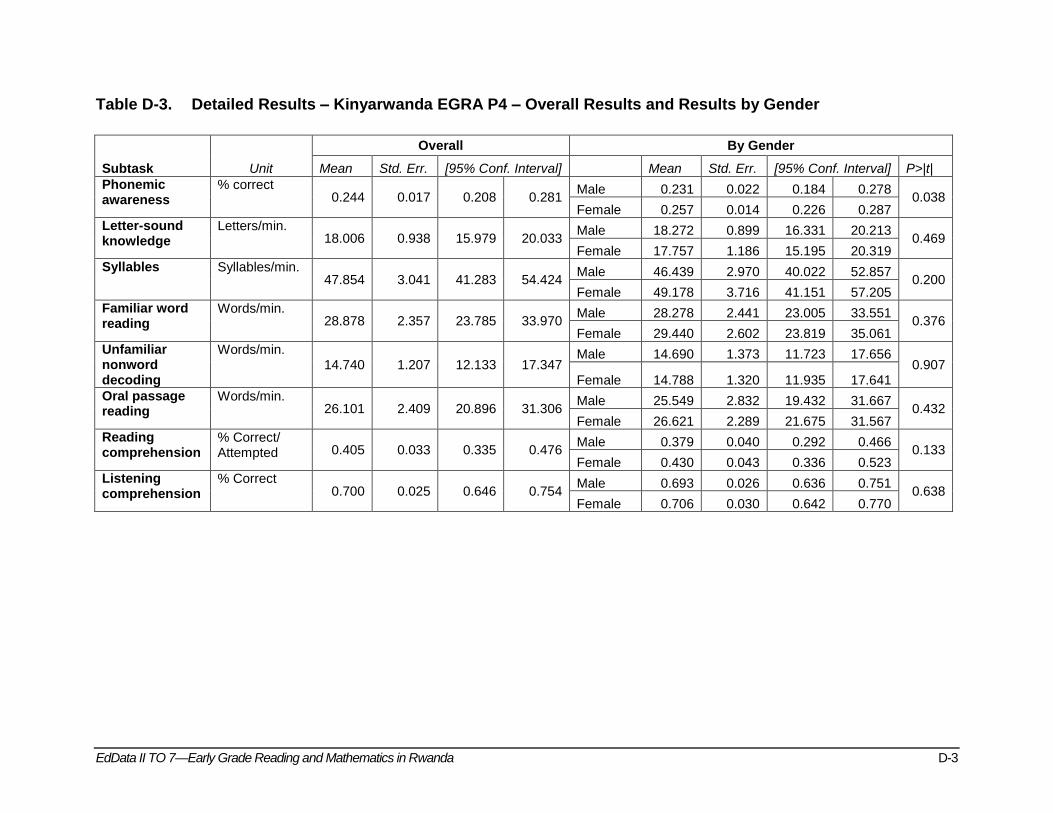
EdData II TO 7—Early Grade Reading and Mathematics in Rwanda D-3
Table D-3. Detailed Results – Kinyarwanda EGRA P4 – Overall Results and Results by Gender
Subtask Unit
Overall By Gender
Mean Std. Err. [95% Conf. Interval]
Mean Std. Err. [95% Conf. Interval] P>|t|
Phonemic awareness
% correct 0.244 0.017 0.208 0.281
Male 0.231 0.022 0.184 0.278 0.038
Female 0.257 0.014 0.226 0.287
Letter-sound knowledge
Letters/min. 18.006 0.938 15.979 20.033
Male 18.272 0.899 16.331 20.213 0.469
Female 17.757 1.186 15.195 20.319
Syllables Syllables/min. 47.854 3.041 41.283 54.424
Male 46.439 2.970 40.022 52.857 0.200
Female 49.178 3.716 41.151 57.205
Familiar word reading
Words/min. 28.878 2.357 23.785 33.970
Male 28.278 2.441 23.005 33.551 0.376
Female 29.440 2.602 23.819 35.061
Unfamiliar nonword decoding
Words/min. 14.740 1.207 12.133 17.347
Male 14.690 1.373 11.723 17.656 0.907
Female 14.788 1.320 11.935 17.641
Oral passage reading
Words/min. 26.101 2.409 20.896 31.306
Male 25.549 2.832 19.432 31.667 0.432
Female 26.621 2.289 21.675 31.567
Reading comprehension
% Correct/ Attempted 0.405 0.033 0.335 0.476
Male 0.379 0.040 0.292 0.466 0.133
Female 0.430 0.043 0.336 0.523
Listening comprehension
% Correct 0.700 0.025 0.646 0.754
Male 0.693 0.026 0.636 0.751 0.638
Female 0.706 0.030 0.642 0.770
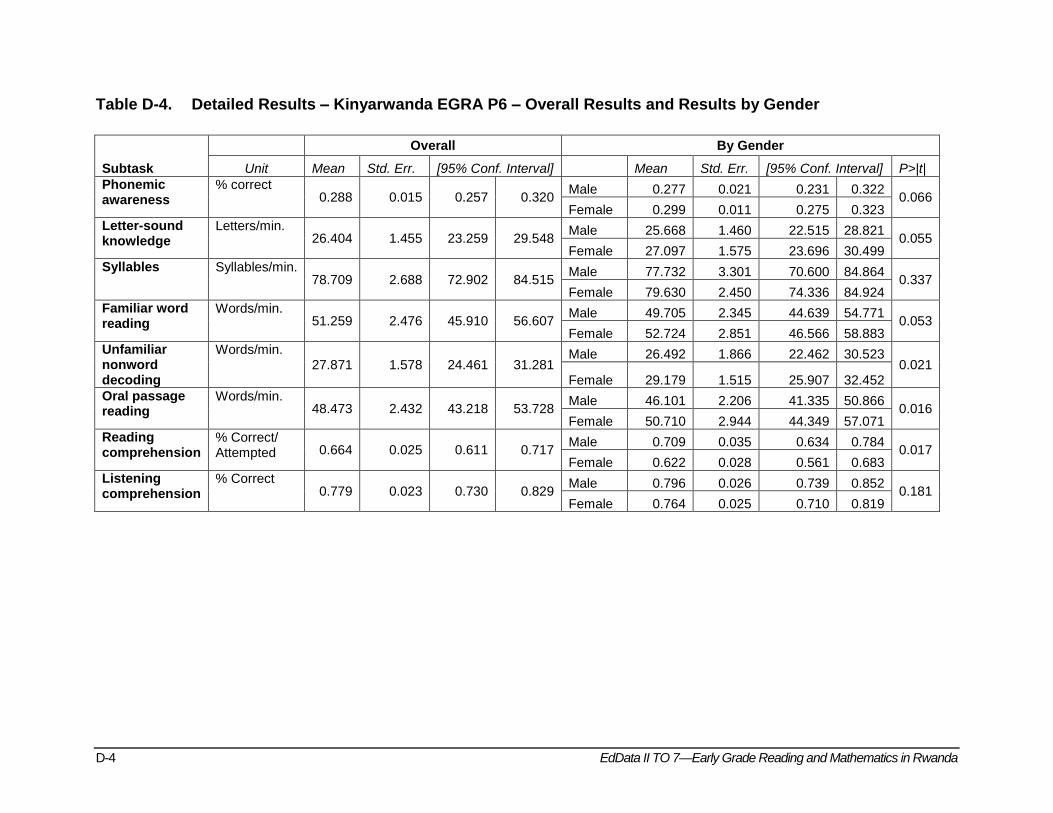
D-4 EdData II TO 7—Early Grade Reading and Mathematics in Rwanda
Table D-4. Detailed Results – Kinyarwanda EGRA P6 – Overall Results and Results by Gender
Subtask
Overall By Gender
Unit Mean Std. Err. [95% Conf. Interval]
Mean Std. Err. [95% Conf. Interval] P>|t|
Phonemic awareness
% correct 0.288 0.015 0.257 0.320
Male 0.277 0.021 0.231 0.322 0.066
Female 0.299 0.011 0.275 0.323
Letter-sound knowledge
Letters/min. 26.404 1.455 23.259 29.548
Male 25.668 1.460 22.515 28.821 0.055
Female 27.097 1.575 23.696 30.499
Syllables Syllables/min. 78.709 2.688 72.902 84.515
Male 77.732 3.301 70.600 84.864 0.337
Female 79.630 2.450 74.336 84.924
Familiar word reading
Words/min. 51.259 2.476 45.910 56.607
Male 49.705 2.345 44.639 54.771 0.053
Female 52.724 2.851 46.566 58.883
Unfamiliar nonword decoding
Words/min. 27.871 1.578 24.461 31.281
Male 26.492 1.866 22.462 30.523 0.021
Female 29.179 1.515 25.907 32.452
Oral passage reading
Words/min. 48.473 2.432 43.218 53.728
Male 46.101 2.206 41.335 50.866 0.016
Female 50.710 2.944 44.349 57.071
Reading comprehension
% Correct/ Attempted 0.664 0.025 0.611 0.717
Male 0.709 0.035 0.634 0.784 0.017
Female 0.622 0.028 0.561 0.683
Listening comprehension
% Correct 0.779 0.023 0.730 0.829
Male 0.796 0.026 0.739 0.852 0.181
Female 0.764 0.025 0.710 0.819
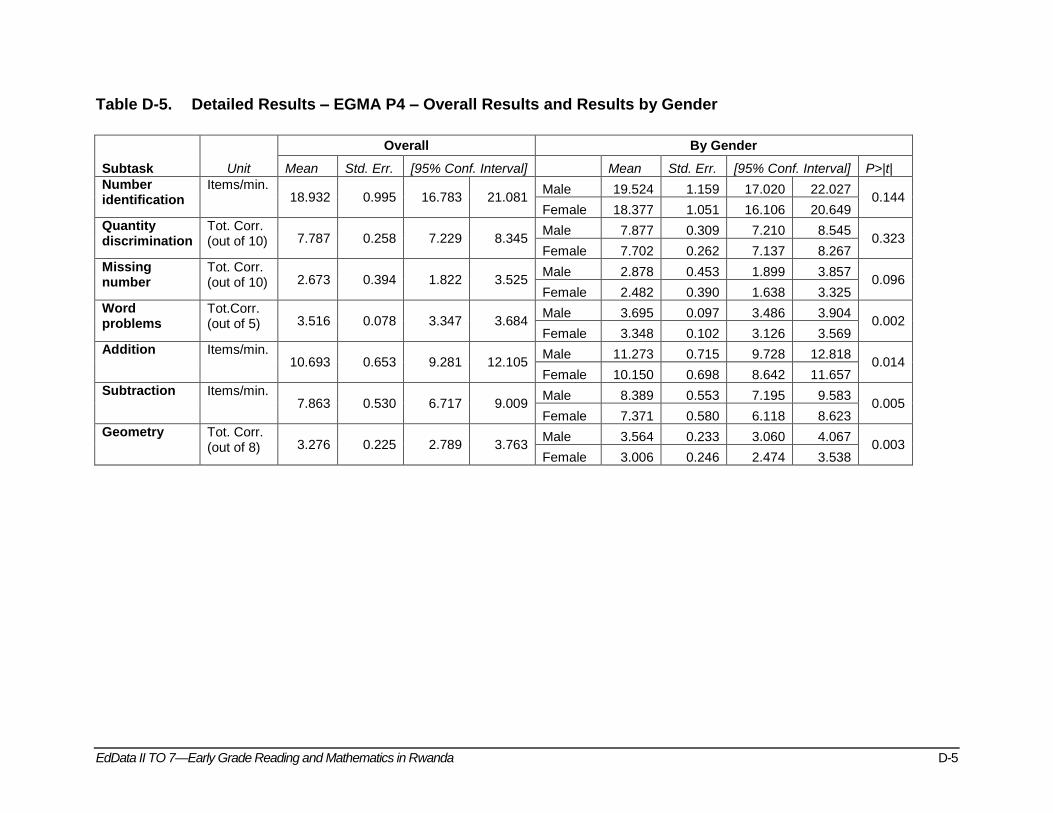
EdData II TO 7—Early Grade Reading and Mathematics in Rwanda D-5
Table D-5. Detailed Results – EGMA P4 – Overall Results and Results by Gender
Subtask Unit
Overall By Gender
Mean Std. Err. [95% Conf. Interval]
Mean Std. Err. [95% Conf. Interval] P>|t|
Number identification
Items/min. 18.932 0.995 16.783 21.081
Male 19.524 1.159 17.020 22.027 0.144
Female 18.377 1.051 16.106 20.649
Quantity discrimination
Tot. Corr. (out of 10) 7.787 0.258 7.229 8.345
Male 7.877 0.309 7.210 8.545 0.323
Female 7.702 0.262 7.137 8.267
Missing number
Tot. Corr. (out of 10) 2.673 0.394 1.822 3.525
Male 2.878 0.453 1.899 3.857 0.096
Female 2.482 0.390 1.638 3.325
Word problems
Tot.Corr. (out of 5) 3.516 0.078 3.347 3.684
Male 3.695 0.097 3.486 3.904 0.002
Female 3.348 0.102 3.126 3.569
Addition Items/min. 10.693 0.653 9.281 12.105
Male 11.273 0.715 9.728 12.818 0.014
Female 10.150 0.698 8.642 11.657
Subtraction Items/min. 7.863 0.530 6.717 9.009
Male 8.389 0.553 7.195 9.583 0.005
Female 7.371 0.580 6.118 8.623
Geometry Tot. Corr. (out of 8) 3.276 0.225 2.789 3.763
Male 3.564 0.233 3.060 4.067 0.003
Female 3.006 0.246 2.474 3.538
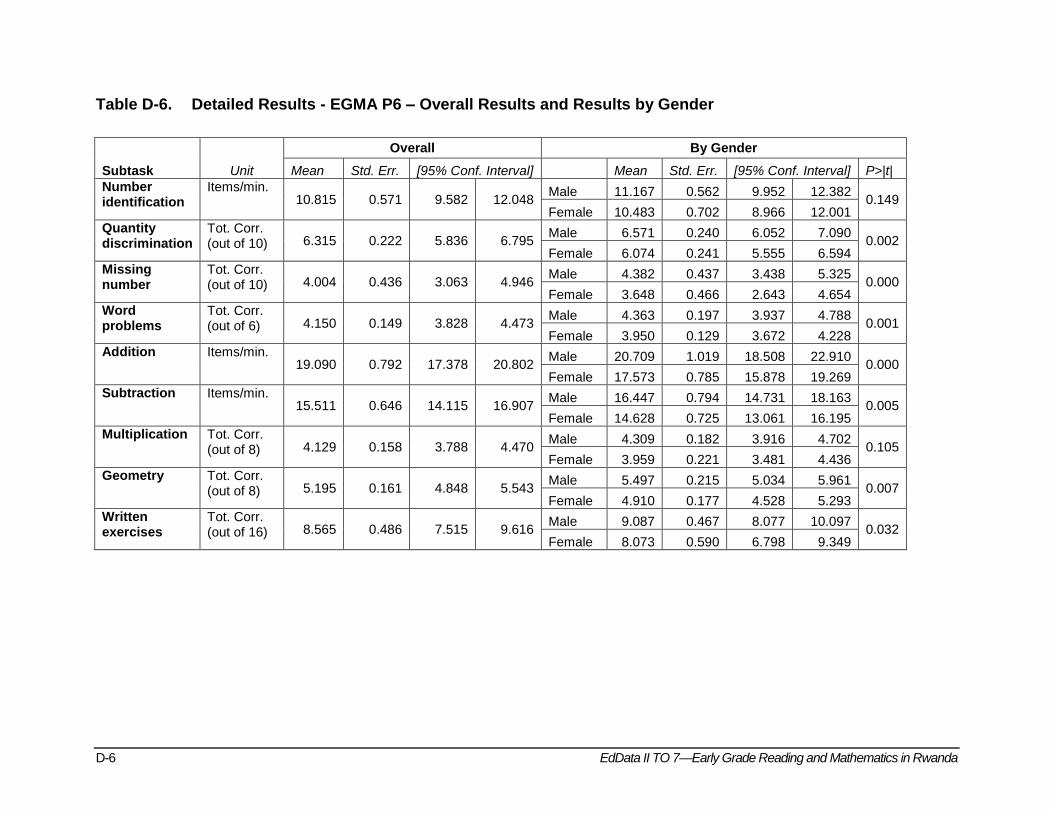
D-6 EdData II TO 7—Early Grade Reading and Mathematics in Rwanda
Table D-6. Detailed Results - EGMA P6 – Overall Results and Results by Gender
Subtask Unit
Overall By Gender
Mean Std. Err. [95% Conf. Interval]
Mean Std. Err. [95% Conf. Interval] P>|t|
Number identification
Items/min. 10.815 0.571 9.582 12.048
Male 11.167 0.562 9.952 12.382 0.149
Female 10.483 0.702 8.966 12.001
Quantity discrimination
Tot. Corr. (out of 10) 6.315 0.222 5.836 6.795
Male 6.571 0.240 6.052 7.090 0.002
Female 6.074 0.241 5.555 6.594
Missing number
Tot. Corr. (out of 10) 4.004 0.436 3.063 4.946
Male 4.382 0.437 3.438 5.325 0.000
Female 3.648 0.466 2.643 4.654
Word problems
Tot. Corr. (out of 6) 4.150 0.149 3.828 4.473
Male 4.363 0.197 3.937 4.788 0.001
Female 3.950 0.129 3.672 4.228
Addition Items/min. 19.090 0.792 17.378 20.802
Male 20.709 1.019 18.508 22.910 0.000
Female 17.573 0.785 15.878 19.269
Subtraction Items/min. 15.511 0.646 14.115 16.907
Male 16.447 0.794 14.731 18.163 0.005
Female 14.628 0.725 13.061 16.195
Multiplication Tot. Corr. (out of 8) 4.129 0.158 3.788 4.470
Male 4.309 0.182 3.916 4.702 0.105
Female 3.959 0.221 3.481 4.436
Geometry Tot. Corr. (out of 8) 5.195 0.161 4.848 5.543
Male 5.497 0.215 5.034 5.961 0.007
Female 4.910 0.177 4.528 5.293
Written exercises
Tot. Corr. (out of 16) 8.565 0.486 7.515 9.616
Male 9.087 0.467 8.077 10.097 0.032
Female 8.073 0.590 6.798 9.349
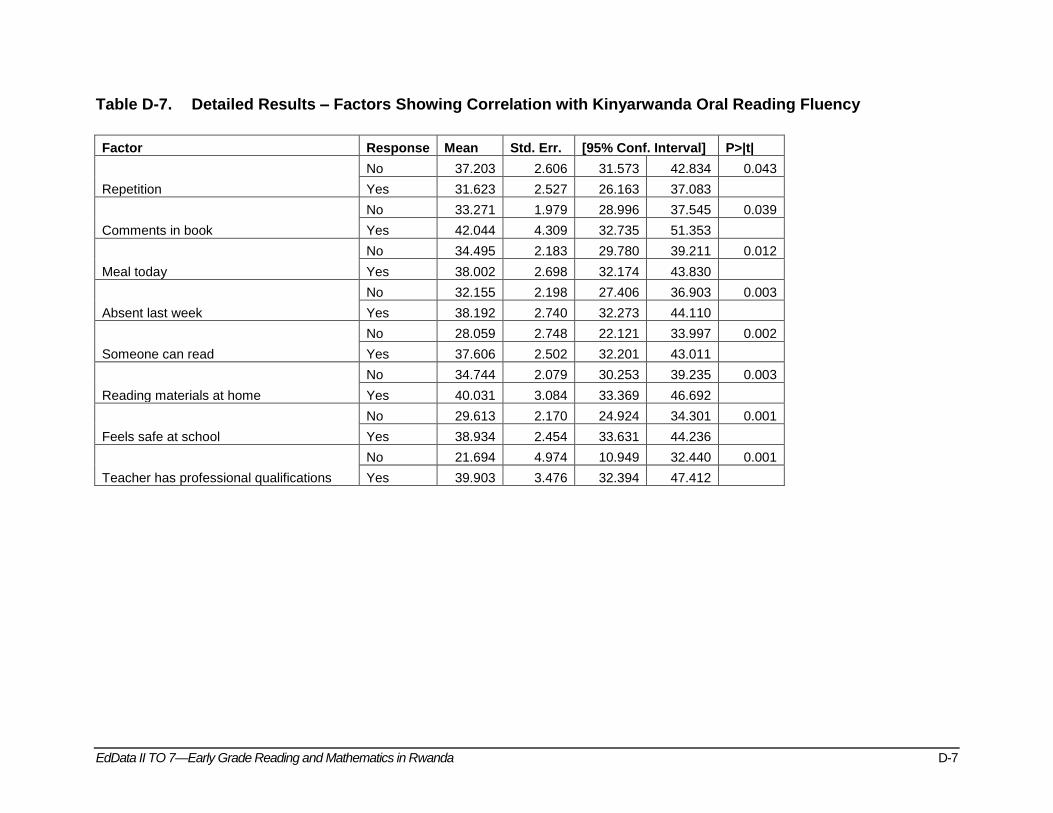
EdData II TO 7—Early Grade Reading and Mathematics in Rwanda D-7
Table D-7. Detailed Results – Factors Showing Correlation with Kinyarwanda Oral Reading Fluency
Factor Response Mean Std. Err. [95% Conf. Interval] P>|t|
Repetition
No 37.203 2.606 31.573 42.834 0.043
Yes 31.623 2.527 26.163 37.083
Comments in book
No 33.271 1.979 28.996 37.545 0.039
Yes 42.044 4.309 32.735 51.353
Meal today
No 34.495 2.183 29.780 39.211 0.012
Yes 38.002 2.698 32.174 43.830
Absent last week
No 32.155 2.198 27.406 36.903 0.003
Yes 38.192 2.740 32.273 44.110
Someone can read
No 28.059 2.748 22.121 33.997 0.002
Yes 37.606 2.502 32.201 43.011
Reading materials at home
No 34.744 2.079 30.253 39.235 0.003
Yes 40.031 3.084 33.369 46.692
Feels safe at school
No 29.613 2.170 24.924 34.301 0.001
Yes 38.934 2.454 33.631 44.236
Teacher has professional qualifications
No 21.694 4.974 10.949 32.440 0.001
Yes 39.903 3.476 32.394 47.412