EDUCATION DATA FOR DECISION MAKING (EdData … · Lessons Learned from EdData II ... for their...
57
EDUCATION DATA FOR DECISION MAKING (EdData II): KEY ACHIEVEMENTS AND LESSONS LEARNED FINAL REPORT DECEMBER 2016 This publication was produced for review by the United States Agency for International Development. It was prepared by RTI International.
-
Upload
trinhduong -
Category
Documents
-
view
221 -
download
0
Transcript of EDUCATION DATA FOR DECISION MAKING (EdData … · Lessons Learned from EdData II ... for their...

EDUCATION DATA FOR DECISION MAKING (EdData II): KEY ACHIEVEMENTS AND LESSONS LEARNED FINAL REPORT
DECEMBER 2016
This publication was produced for review by the United States Agency for International Development. It was prepared by RTI International.

EDUCATION DATA FOR DECISION MAKING (EDDATA II): KEY ACHIEVEMENTS AND LESSONS LEARNED FINAL REPORT Education Data for Decision Making (EdData II) Task Order No. AID-OAA-BC-12-00003 RTI Task 20 (Project No. 0209354.020) Prepared for Office of Education Bureau for Economic Growth, Education, and Environment (E3) United States Agency for International Development (USAID) Alina Menicucci, Contracting Officer Penelope Bender, Contracting Officer’s Representative Prepared by Amy Mulcahy-Dunn, Anna Dick, Luis Crouch, and Erin Newton RTI International 3040 East Cornwallis Road P.O. Box 12194 Research Triangle Park, NC 27709-2194 USA
DISCLAIMER The authors’ views expressed in this report do not necessarily reflect the views of the United States Agency for International Development or the United States Government. Cover photo: Drake Warrick, classroom teaching and learning, Nigeria Reading and Access Research Activity (RARA).

EdData II Final Report iii
Table of Contents
List of Figures ............................................................................................................................ iv
Acknowledgments ....................................................................................................................... v
Abbreviations ............................................................................................................................. vi
Executive Summary ................................................................................................................. viii
1. Overview of EdData II ......................................................................................................... 1
1.1 Purpose and Operating Principles .............................................................................. 1 1.2 Products and Approaches .......................................................................................... 1 1.3 Summary of Impacts .................................................................................................. 1
2. Summary of Task Orders under EdData II .......................................................................... 2
3. Key Focus Areas ................................................................................................................. 2
3.1 Tools and Data Collection and Analysis Methods for Measurement of Education Quality ....................................................................................................... 3 3.1.1 Early Grade Reading Assessment (EGRA) .................................................... 3 3.1.2 Early Grade Mathematics Assessment (EGMA) ............................................. 4 3.1.3 Snapshot of School Management Effectiveness (SSME) ............................... 5 3.1.4 Lot Quality Assurance Sampling (LQAS) / Local Education Monitoring
Approach (LEMA) ........................................................................................... 6 3.1.5 Household Surveys ........................................................................................ 8 3.1.6 Impact of Technology Developments on Data Collection During
EdData II .......................................................................................................11 3.2 Pilot Early Grade Intervention Programs ...................................................................13
3.2.1 Purpose of the Interventions ..........................................................................13 3.2.2 Conclusions from Pilot Activities ....................................................................14
3.3 Illustrations of Recent Discrete Research Studies .....................................................17 3.4 Dissemination ...........................................................................................................18
3.4.1 Local Key-Findings Workshops and Benchmarking Activities ........................19 3.4.2 Online Dissemination ....................................................................................20 3.4.3 Conference Presentations .............................................................................22 3.4.4 Early Grade Reading Barometer ...................................................................22
4. Lessons Learned from EdData II ........................................................................................23
4.1 Learning from Pre-Project Assumptions ....................................................................24 4.1.1 Review of Assumption 1 – The constraint is a weak supply of data ...............24 4.1.2 Review of Assumption 2 – There exists an unmet demand for data ..............26
4.2 Cautionary Tales from EdData II ...............................................................................27 4.3 Conclusions Gleaned from EdData II ........................................................................28
References ...............................................................................................................................31
Annex A: Summary of EdData II Task Orders ...........................................................................33
Annex B: List of RTI Peer-Reviewed Publications Involving EdData II Research ......................37
Annex C: List of EGRA, EGMA, and SSME Surveys Conducted Under EdData II ....................41
Annex D: List of Pilot Reading Intervention Activities Conducted Through EdData II ................45

iv EdData II Final Report
List of Figures Figure 1. Net and gross enrollment rates by income quintile, 2010 and 2015 Nigeria
Education Data Surveys .......................................................................................... 9 Figure 2. Percentage of children able to read, by income quintile, 2010 and 2015
Nigeria Education Data Surveys .............................................................................11
EdData II Final Report v
Acknowledgments The authors wish to acknowledge the important contributions of many people who guided and supported the EdData II project, in particular:
• USAID staff, those in the United States and abroad, for their drive to improve the quality of education through the creation and better use of education data in decision making. Their guidance and support made this important work possible. In particular, we would like to mention John Hatch, Sandra Bertoli, Jim Hoxeng, Penelope Bender, Catherine Miles Powell, and Mitch Kirby for their long-term engagement.
• Ministry staff throughout the world who worked closely with us in the design, development, and implementation of all our work in the field. This work would not have been conceivable or implementable without their insights, collaboration, and support.
• Our local partners who collaborated on so many of our efforts, from organizing workshops, to overseeing the critical data collection process of the studies, to working with us on analysis. Our approach to fieldwork was anchored on these partnerships and the work would not have been possible without them.
• Our international partners, who provided essential technical, logistical, and managerial support throughout this contract.
• Academic and other technical experts and practitioners who guided and contributed to our work.
• All the schoolchildren, parents, head teachers/principals, and teachers who generously participated in EdData II pilot studies and assessments. They were the inspiration for our work.
• Finally, to all of the 307 past and present RTI staff whose blood, sweat, and tears made this work happen: Thank you!
Thanks also are due to those who reviewed and contributed to this report. In alphabetical order, they are: Kellie Betts, Aarnout Brombacher, Jennae Bulat, Joe DeStefano, Peggy Dubeck, Amber Gove, Emily Kochetkova, Julianne Norman, Ben Piper, Alastair Rodd, Carmen Strigel, and Melinda Taylor.
Finally, we wish to point out that we adapted summary and background material in this final report as needed from the extensive body of technical and progress reports generated over the course of this 12-year project. We used these materials as a jumping-off point to evaluate, analyze, find common themes, and draw lessons learned regarding the research and pilot interventions carried out under the program’s many task orders.
vi EdData II Final Report
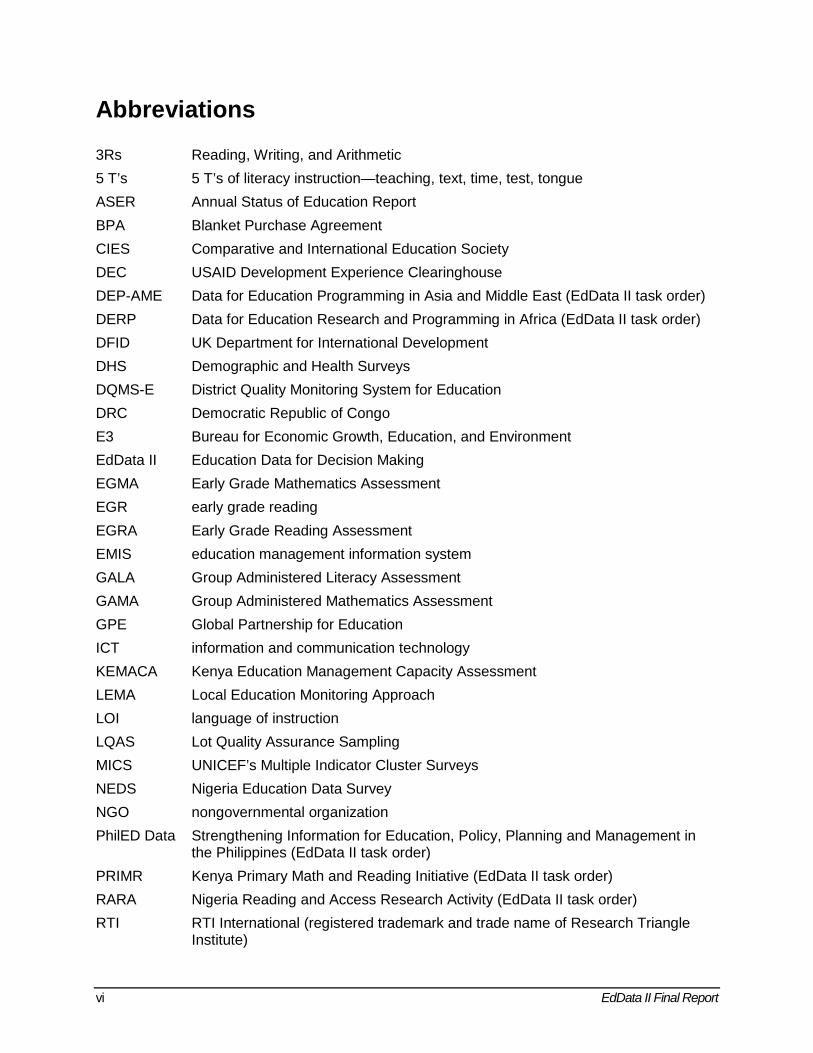
Abbreviations 3Rs Reading, Writing, and Arithmetic 5 T’s 5 T’s of literacy instruction—teaching, text, time, test, tongue ASER Annual Status of Education Report BPA Blanket Purchase Agreement CIES Comparative and International Education Society DEC USAID Development Experience Clearinghouse DEP-AME Data for Education Programming in Asia and Middle East (EdData II task order) DERP Data for Education Research and Programming in Africa (EdData II task order) DFID UK Department for International Development DHS Demographic and Health Surveys DQMS-E District Quality Monitoring System for Education DRC Democratic Republic of Congo E3 Bureau for Economic Growth, Education, and Environment EdData II Education Data for Decision Making EGMA Early Grade Mathematics Assessment EGR early grade reading EGRA Early Grade Reading Assessment EMIS education management information system GALA Group Administered Literacy Assessment GAMA Group Administered Mathematics Assessment GPE Global Partnership for Education ICT information and communication technology KEMACA Kenya Education Management Capacity Assessment LEMA Local Education Monitoring Approach LOI language of instruction LQAS Lot Quality Assurance Sampling MICS UNICEF’s Multiple Indicator Cluster Surveys NEDS Nigeria Education Data Survey NGO nongovernmental organization PhilED Data Strengthening Information for Education, Policy, Planning and Management in
the Philippines (EdData II task order) PRIMR Kenya Primary Math and Reading Initiative (EdData II task order) RARA Nigeria Reading and Access Research Activity (EdData II task order) RTI RTI International (registered trademark and trade name of Research Triangle
Institute)
EdData II Final Report vii
SBCC social and behavior change communication SDG Sustainable Development Goal SSME Snapshot of School Management Effectiveness ToTAL Haiti Tout Timoun Ap Li Applied Research Activity (EdData II task order) UNICEF United Nations Children’s Fund USAID United States Agency for International Development

viii EdData II Final Report
Executive Summary The United States Agency for International Development’s Education Data for Decision Making (EdData II) project was awarded to RTI International in 2004 and implemented over a 12-year period. EdData II had at its core the goal of improving access to data for USAID Missions and host-country ministries, to use for making informed policy decisions. Designed in the context of ever-increasing demand for education data following the adoption of the Millennium Development Goals (2000), the project became a flexible proving ground in many countries for innovative data and assessment tools, experimental research and implementation, and measurement. The tools and research developed under EdData II would help to inform the development of learning metrics under the Sustainable Development Goals (2015); provide evidence to support the design and monitor the implementation of USAID’s 2011–2017 Education Strategy; and, most critically, provide actionable, high-quality data to inform policy and practice in around 35 countries.
This report is intended to serve as a reflection on the EdData II project and its impact. It does not seek to catalog the scope of the 20+ data collection instruments and tools, or the hundreds of documents and reports developed and disseminated. Instead this report provides a summary of the most salient and impactful project activities and seeks to draw key lessons from their development and implementation.
The report is divided into four sections, as follows. In Sections 1 and 2, we begin with an overview of the background and key accomplishments of the EdData II contract and objectives, followed by a synopsis of EdData II task orders and their scope. Section 3, the main body of the report, delineates the key technical achievements of the program, including data collection tools, analysis, and measurement; pilot intervention programs; original and secondary research; and dissemination activities, as well as the implications of each. Section 4 reflects on the lessons learned from this work. In addition, several annexes provide further details about various aspects of the program.
We hope that this report will serve as a useful guide to USAID officers reflecting on both the successes and challenges of the EdData II program, with an eye to informing the development of the next generation of tools and resources for improving education data for decision-making. Overall, the accomplishments of the EdData II project reflect strong communication and collaboration among USAID and RTI International, ministry counterparts from the EdData II countries, and dozens of partners globally; as well as strong innovation and dedication to improving educational outcomes.
EdData II Final Report 1
1. Overview of EdData II
1.1 Purpose and Operating Principles Awarded in 2004, the focus of EdData II was to increase the use of education data in decision making by addressing policy makers’ and stakeholders’ unmet demands for education data at the local, national, and international levels. More broadly, EdData II provided survey expertise to national and local governments as well as to the donor community to assess their education systems.
Throughout the contract, project teams from lead implementer RTI International collaborated with staff from ministries of education and other counterpart institutions, USAID Missions, and other development partners and stakeholders to find innovative, useful, and cost-effective ways to gather and analyze education data. These groups worked together to successfully raise awareness around key education issues, chief among these being the lack of learning occurring in the early grades of primary school. The project helped governments measure learning outcomes and establish student performance benchmarks to guide efforts to improve learning in the early grades. School-based pilot programs were implemented and evaluated. These activities effected change in local education practice and contributed to research both on instructional practice and on pilot program scale-up and sustainability.
1.2 Products and Approaches Assessment and evaluation approaches ranging from individual and group student assessment instruments (Early Grade Reading Assessment [EGRA], Early Grade Mathematics Assessment [EGMA], Group Administered Literacy Assessment [GALA]), to sector capacity evaluations (Kenya Education Management Capacity Assessment [KEMACA]) and data gap assessments, to local monitoring approaches (Lot Quality Assurance Sampling/Local Education Monitoring Approach [LQAS/LEMA]), to multifaceted school management diagnoses (Snapshot of School Management Effectiveness [SSME]) were developed, piloted, and refined over the course of the contract. The introduction of electronic data collection (using RTI’s Tangerine® software as well as a Prodigy Systems program) greatly increased quality control measures and data collection efficiency.
1.3 Summary of Impacts The technical impact of EdData II went well beyond the impact that is typical of most projects, as instruments and approaches were shared and adopted broadly, and raised interest in better understanding and monitoring education quality. This resulted in other donors, donor-funded contractors, and private foundations adopting and adapting EdData II-funded tools and approaches.
As a primary example of the impact of this project, EGRAs were conducted in 23 countries and 38 different languages under EdData II. When we add in EGRAs that were
2 EdData II Final Report
conducted independently of the project, the numbers increase to more than 70 countries and 120 languages. These assessments were nationally or subnationally representative, and in some cases, also assessed math through the use of EGMA. As a result of this work, the availability of information on the status of learning in the early grades changed dramatically over the course of the last decade, with findings from EdData II-funded research making its way into the peer-reviewed literature, impacting project design, and, importantly, influencing government policies as well as donor strategy and focus.
Another area of major impact was building the capacity of local partners. The success of the EdData II project was the result of strong partnerships with USAID Missions and USAID/Washington, as well as with key stakeholders and ministry officials in each of the countries where work was conducted through this contract. In addition, more than 62 subcontractors, including U.S. and international small businesses, but primarily local organizations. As a goal of the project was to develop local capacity to collect, analyze, and disseminate data, 51 different local subcontractors were engaged to support in-country work. Many of the subcontractors learned enough through their work to be true partners, able to carry out school assessments and evaluations with little need for outside technical input.
2. Summary of Task Orders under EdData II The EdData II contract was a Blanket Purchase Agreement (BPA) that functioned in the manner of an indefinite delivery/indefinite quantity contract, with a total of 32 task orders. Task orders were contracted through USAID in Washington and in partnership with Missions around the world, including the Democratic Republic of Congo, Ethiopia, Ghana, Haiti, Honduras, Iraq, Jordan, Kenya, Liberia, Mali, Morocco, the Philippines, and Zambia. A table of the full list of task orders and a brief summary of each is available in Annex A.
3. Key Focus Areas The EdData II project focused on four technical areas, all geared to providing information for decision makers in the USAID-funded country context. These were:
1. Development of data collection tools, analysis methods, and measurement. A subset of this category was small-scale survey and assessment instruments, among them the EGRA, EGMA, SSME, and LQAS/LEMA. Another subset was household-based surveys—which originally were anticipated to be the primary focus of this contract.
2. Early grade pilot interventions designed to research the effectiveness of programs geared to address weaknesses in early grade instruction.
3. Discrete original and secondary research studies designed to explore specific topics at the global, regional, or country level.
4. Dissemination of findings and resources, whether locally or internationally.
On this last point, research findings as well as tools and methods were disseminated broadly via the EdData II website (www.EdDataGlobal.com); conference, workshop, and
EdData II Final Report 3
webinar presentations; briefs; technical reports; and peer-reviewed publications (see illustrative list of peer-reviewed articles, books, and chapters in Annex B). This technical work, and its dissemination, contributed to a greater understanding of factors influencing reading outcomes in developing countries. This understanding also significantly impacted how donors and contractors supported and evaluated efforts to improve the effectiveness of early grade education.
The subsections that follow elaborate on important outcomes and achievements in these four technical areas.
3.1 Tools and Data Collection and Analysis Methods for Measurement of Education Quality At the start of the EdData II project, the options available for low-cost assessment tools with applicability in low-income countries were limited. Through this project, tools were developed to quickly collect, analyze, and disseminate information about education quality, measured at the school, individual, and household levels. A table listing all EGRA, EGMA, and SSME surveys conducted through the EdData II project is attached in Annex C.
3.1.1 Early Grade Reading Assessment (EGRA) Historically, there had been very little information about student learning in the early grades in low-income countries. The EGRA, which was originally developed in 2006, was designed as a quick and reliable method to inform ministries and the donor community about the acquisition of basic reading skills in the early grades. EGRA also was intended to aid education officials in setting standards and benchmarks for reading, as well as in planning curricula and teacher training to best facilitate children’s reading achievement.
The ultimate goal of learning to read is comprehension. Competent readers read and understand text with such speed and ease that they are not conscious of the process of comprehension itself. However, comprehension is actually a complex skill or a composite behavior (Snow & the RAND Reading Study Group, 2002) made possible from the mastery and simultaneous use of a wide array of subskills.
The EGRA, which is an individually and orally administered student assessment, measures reading fluency, accuracy, and comprehension as well as the basic skills that a child must possess to eventually be able to read fluently and with comprehension—the ultimate goal of reading. These skills include letter sound knowledge, decoding, fluency, and reading comprehension. The higher-order skills (e.g., fluency and comprehension) build on lower-order skills (e.g., letter sound knowledge, and decoding), and the lower-order skills have been shown to be predictive of later reading achievement. Therefore, even if children cannot yet read a passage with comprehension, EGRA can nonetheless measure their progress toward acquiring the lower-order skills that are steps along the path to that end.
4 EdData II Final Report
Since early pilots of EGRA in The Gambia1 and Nicaragua, the instrument, its administration, and analysis of its results have continued to be refined to reflect lessons learned through its numerous applications. Refinements of EGRA are anticipated to continue past the life of the EdData II project.
Documentation and training were also a substantial part of the EGRA-related efforts under the project. An EGRA manual was first prepared in 2009 with World Bank co-funding, to walk users through all of the steps needed to conduct an EGRA. A significantly updated version of the manual, the EGRA Toolkit, Second Edition (RTI International, 2016), is now available from the website of the Global Reading Network (https://globalreadingnetwork.net).
Several EGRA trainings were conducted through the EdData II contract for implementers, USAID and other donor education staff, and other stakeholders in the United States and elsewhere. To describe two examples, in 2014, RTI compiled materials regarding EGRA-related experiences, best practices, and lessons learned from across all EdData II task orders. These materials were transformed into an EGRA training workshop titled “Designing and Implementing Early Grade Reading Assessments: Understanding the Basics.” The content was delivered over the course of three days in Bethesda, Maryland, in March 2015 to a range of participants including donors, researchers, and implementers from a variety of different organizations. Shortly afterward in April 2015, an “EGRA Bootcamp” was conducted in Mozambique for local stakeholders. In addition, each time an EGRA was conducted, local ministry officials were engaged about the approach of EGRA and participated in a findings workshop; local firms and their assessors were trained on conducting data collection.
The toolkit, along with the trainings, facilitated the adoption of this assessment method. Annex C provides details about assessments conducted solely through the EdData II contract. The availability of the guidance on how to conduct an EGRA, as well as its broad application since its development, demonstrates the capacity built globally to conduct an EGRA.
EGRA has facilitated the availability of data for local stakeholders to better understand what the early grade literacy challenges in their country are, and how to use the data to make informed policy decisions. To this end, a number of countries have responded to the data collected by redesigning their early grade teacher training and curriculum approach to include a stronger focus on reading. Some have also incorporated EGRA into their regular system-level assessment and monitoring activities.
3.1.2 Early Grade Mathematics Assessment (EGMA) The development of the EGMA tool began in 2008. Similar to the EGRA, the EGMA was designed to provide ministries and donors with information regarding students’ basic math skills and thus the general quality of mathematics instruction in the early grades. EGMA gathers information about basic competencies—those competencies which should typically be mastered in the very early grades, and without which pupils will struggle in school.
1 Piloting in The Gambia was funded by the World Bank.
EdData II Final Report 5
Subtasks selected for EGMA were drawn from extensive research on early mathematics learning and assessment and were constructed by a panel of experts on mathematics education and cognition. The conceptual framework for mathematical development was grounded in extensive research conducted over the past 60 years (for example, Baroody, Lai, & Mix, 2006; Chard et al., 2005; Clements & Samara, 2007). To develop the EGMA protocol, developers systematically sampled early numeracy skills, particularly those underlying number sense. These abilities and skills are key in the progression toward the ability to solve more advanced problems and the acquisition of more advanced mathematics skills (Baroody et al., 2006; Clements & Samara, 2007; Foegen, Jiban, & Deno, 2007).
The EGMA is an individually administered oral test, which allows for the targeted skills to be assessed independently of students’ problems with language or writing that might otherwise impede performance. By administering the test orally, administrators can better ensure that pupils understand instructions provided in a language they know. As the EGMA was refined, interest in the tool grew, particularly in countries where an EGRA had already been conducted. RTI leveraged its own funding to produce a toolkit (EGMA Toolkit, RTI International, 2014a) to serve as a resource for those interested in adapting and conducting an EGMA in their local context.
By 2012, the EGMA had been applied in more than 10 countries, including Zambia, Morocco, Jordan, Rwanda and Kenya (Ralaingita, 2012). Annex C details the range of countries in which the EGMA was administered under EdData II. In the majority of these EGMA applications, children performed better on the items that assessed more procedural mathematics (which can be completed using memorized facts) than they performed on the more conceptual items, which rely on children applying their procedural knowledge with understanding. These findings reflect how the children were taught mathematics and not the children’s innate ability.
In many of the EGMA contexts, governments responded to the results by reflecting on how teaching practices need to shift to include a greater focus on children experiencing mathematics as a meaningful activity with real-world applications.
3.1.3 Snapshot of School Management Effectiveness (SSME) While EGRA and EGMA documented how students were performing in school, additional information was needed to explain student results and to identify steps that could be taken to address any failings. In 2006, EdData II staff developed a new school-based survey instrument called the Snapshot of School Management Effectiveness, or SSME. The SSME consists of a range of instruments that yields a quick, but rigorous and multifaceted picture of school management and pedagogical practice in a country or region. The SSME was designed to capture indicators of effective schools that past research had shown to affect student learning. The resulting data are designed to enable school, district, provincial, or national administrators and donors to learn what is currently occurring in their schools and classrooms and to assess how to make these schools more effective.
Building on a framework for the analysis of effective schools described by Heneveld and Craig (1996), the SSME collects a variety of information: student and household
6 EdData II Final Report
characteristics, basic school inputs (e.g., school infrastructure, pedagogical materials, teacher and head teacher characteristics), and classroom teaching and learning processes (e.g., instructional content, student teacher interaction, and assessment techniques). In addition, as noted above, selected EGRA and EGMA components are often combined with the SSME to produce information on learning outcomes in reading, writing, and arithmetic.
Typically, a four-person team administers the SSME during a single school day. Each of the SSME’s components (listed below) is designed to elicit information from a different perspective: Student Questionnaire, Head Teacher Questionnaire, Teacher Questionnaire, Classroom Inventory, Classroom Observation (Reading), Classroom Observation (Mathematics).
The design of the SSME aims to balance the need to include a broad mix of variables with the competing need to create a tool that is as undisruptive to the school day as possible. When combined, the components of the assessment produce a comprehensive picture of a school’s learning environment.
It is important to note that for each application, the SSME is carefully revised to reflect the local education system and issues that are of particular importance to that setting. However, unlike the EGRA and EGMA, the majority of the SSME indicators (such as attendance rates and presence of textbooks in the classroom) are comparable across countries (RTI International, 2012).
Development of the SSME tool began with an in-depth study of existing school assessment instruments, and the development of a draft question bank inspired or derived from these instruments. The proposed questions were reviewed by a panel of experts in November 2006. After additional refinements, the SSME instruments and protocols were successfully piloted in Jamaica and Peru in the second half of 2007.
During the course of EdData II, SSME surveys were conducted more than 20 times, in countries in the Caribbean, Africa, Asia, and the Middle East.2 SSME findings paired with EGRA/EGMA findings generated a clear picture of both student performance and their experience at school. The exercises also produced actionable information about school-level factors that may be barriers to stronger student performance. In policy dialogue workshops after the surveys, high-level/local stakeholders worked in small teams to develop concrete recommendations based on the findings.
3.1.4 Lot Quality Assurance Sampling (LQAS)/Local Education Monitoring Approach (LEMA)
Research under EdData II highlighted that in many places, literacy intervention programs have not had the positive impact on student performance that had been anticipated and hoped for. Additionally, research revealed that ministry-run monitoring or inspection programs frequently were not being implemented faithfully. Similarly, programs originally developed with donor funding were at times abandoned once donor funding ended.
2 This reckoning includes SSMEs conducted outside of the EdData II contract.
EdData II Final Report 7
Effective routine and systematic program monitoring can help track fidelity of implementation and also can identify program reforms needed to increase effectiveness. Unfortunately, the promise of monitoring systems to improve education program implementation fidelity and effectiveness often goes unfulfilled because such systems are cumbersome, take too long to produce actionable results, and do not generate data with the frequency or level of disaggregation needed at local levels. Ministry inspectorate systems often aim to monitor performance in all schools, but in reality, struggle to achieve the goal of comprehensive coverage. In addition, ministry inspections tend to focus on school inputs rather than school quality, and data are not collected systematically.
In an effort to address this lack of effective and sustainable school monitoring systems within the confines of local resources, discussions were held with USAID in February 2011 about the possibility of adapting the LQAS approach to monitor early grade programs (Crouch, 2011). For both project and ongoing ministerial program monitoring, LQAS is a sampling technique that can produce relatively low-cost, routine, and quick monitoring to provide representative, disaggregated, and actionable data needed to flag implementation challenges and to target needy areas in a timely manner.
The LQAS technique was first developed in the 1920s in the manufacturing industry as a way to monitor the quality of production. Application of this classification method has since spread far beyond manufacturing into other domains, including the social sciences. For example, the LQAS concept has been adapted for use in the health sector and has been gaining popularity as a way to efficiently monitor health programs over time. EdData II helped to adapt the LQAS method for use in the education sector.
This low-cost approach relies on small random samples of districts, schools, and students and the collection of certain binary indicators to classify districts as meeting or not meeting minimum performance standards. While not meant to replace the need to monitor all schools in an area, this sample-based classification approach allows local and national decision makers to identify districts that are most in need of assistance while, at the same time, identifying any recurring issues with program fidelity or design. Locally collected data are easily tabulated and are available almost immediately for use. Local results may be aggregated to the regional or national levels to generate point estimates of the collected indicators (Mulcahy-Dunn, Valadez, Cummiskey, & Hartwell, 2013). Specific assessment and observation instruments were developed to evaluate the quality of early grade reading instruction. In order to separate the sampling methodology and the analysis from the overall monitoring approach and associated instruments, RTI developed a new name, the Local Education Monitoring Approach (LEMA), to encompass the total package.
EdData II funded a series of pilot applications that helped to further refine the LEMA instruments and protocols. These refinements included the development of group-administered literacy and mathematics assessments (GALA and GAMA). Local inspectors involved in these pilots found that this approach allowed them to quickly, easily, and accurately classify schools, identify challenges they face, and identify geographic areas most in need of assistance. In addition, the Greater Accra Region began implementing LEMA (known there as the District Quality Monitoring System for

8 EdData II Final Report
Education, or DQMS-E) as a way to routinely monitor school quality. This broader application of LEMA in Ghana flagged the need for capacity building in the use of data in decision-making. Although all the selected districts successfully applied LEMA, only some districts acted on these findings—that is, formulating plans to address problems identified. As of the writing of this report, only Jordan had applied LEMA on a national scale. As with EGRA and EGMA, the LEMA approach and protocols likely will continue to be updated as its applications become more widespread.
A training manual of step-by-step instructions to guide trainers who are conducting a pilot application of the approach was created and piloted alongside the overall approach in both Tanzania and Ethiopia. The manual was further developed into a toolkit encompassing the trainer’s guide as well as other resources from the various pilot applications of the approach in the education sector (Betts, Mulcahy-Dunn, & Valadez, 2016). Lastly, a brief was prepared to provide guidance on the appropriateness and overall rational for applying the LQAS/LEMA methodology to education programs (Mulcahy-Dunn, Jukes, & Stern, 2016). These documents help individuals decide when and how to apply LEMA as part of new and existing projects.
3.1.5 Household Surveys The application of household surveys that focused on education access issues and linked to Demographic and Health Surveys (DHS) were originally planned to be the primary focus of the EdData II contract. However, despite extensive outreach by USAID/Washington, there was almost no Mission demand for these surveys. In fact, over the 12 years of EdData II, only the Nigerian Mission supported the application of DHS-linked household surveys. A possible reason is that other surveys, such as UNICEF’s Multiple Indicator Cluster Surveys (MICS), were supplying data on issues related to access to education based on household surveys.
Household surveys were conducted in Nigeria in 2010 and 2015. Funding from the UK Department for International Development (DFID) was leveraged for the 2010 application, while the 2015 application was funded entirely by USAID. RTI, in collaboration with the National Population Commission of Nigeria, implemented these two nationally representative education household surveys. To summarize what the researchers were seeking, the National Education Data Survey (NEDS) 2015 provided information on schooling status and parental attitudes for a nationally and state representative sample of children aged 4–16 years. This age range included all children eligible for enrollment in primary (aged 6–11 years) and junior secondary (aged 12–14 years) education. In addition, NEDS 2015 included children aged 4–6 years, to identify underage enrollment in primary school as well as participation in early childhood education, and also children aged 14–16 years to identify overage enrollment in junior secondary school. Both the 2010 and 2015 surveys identified the households from within the Nigeria DHS. Based on previous surveys and to ensure statistical representation for key indicators at the state level, a sample of about 2,000 eligible children per state was required. The final survey results were based on 84,832 completed interviews taken from 31,199 households. This is an extremely large survey by any standard.

EdData II Final Report 9
Household-based information on schooling collected from the NEDS served several purposes. First, it provided an alternative assessment of enrollment data to complement the annual school census exercises across states and highlighted geographic areas of persistent low enrollment. Second, it provided demand-side information to assess whether the significant reforms and investments by the federal and state governments were targeting the key constraints to access and quality, based on evidence from the beneficiaries. Third, it produced evidence of parental choice in schooling selection by highlighting participation in private schools and household investment in schooling, and by tracking household expenditures per student. Fourth, it indicated reasons why children had not enrolled in school, or why they dropped out. Fifth, by sampling at the state level, NEDS provided precise state-based comparisons of inequalities in access and quality across Nigeria. Finally, because the sample methodology and questionnaires remained consistent, comparison of the NEDS 2010 and NEDS 2015 permitted comparison of equity in access and quality over time (see Figure 1).
Figure 1. Net and gross enrollment rates by income quintile, 2010 and 2015 Nigeria Education Data Surveys
Data from 2015 NEDS, with comparison against 2010 NEDS for net attendance ratio and gross attendance ratio
Despite the apparent lack of demand for this type of effort under EdData II, household-based surveys can provide vital information not available at the school level. For example, household surveys allow researchers to reach and account for marginalized youth who still struggle with school access (those who are poor, disabled, nomadic, displaced, etc.). Directly reaching such populations draws out information needed to

10 EdData II Final Report
design programs specifically targeted to getting these children into school and helping them to succeed once there. Over time, household data can allow ministries and donors to track the impact that these programs are having. Household surveys also provide an opportunity to collect sensitive information. For example, students may feel more comfortable speaking in their own homes about school experiences with bullying, corporal punishment, or gender-based violence.
The cost per child of household-based surveys can be higher than for school-based surveys, especially when regionally representative data are required. Small, targeted, or exploratory studies require smaller sample sizes and could provide invaluable information about specific issues. The Sustainable Development Goals (SDGs),3 which emphasize quality education for all children, will need to include some indicators collected at the household level in order to track both the participation rates and experience of traditionally marginalized children in society.
NEDS underscored the power of household-based surveys. The two surveys demonstrated that the household survey approach was particularly useful for looking at the impact of poverty on schooling status, persistence in school, and learning outcomes. For example, nationally, 58% of children in the lowest wealth quintile had never attended school, compared with 15% in the highest quintile (see Figure 2). In the highest quintile, 68% of children attended a private primary school, compared to 11% of children in the lowest quintile. As a result, household expenditure per pupil in the highest quintile was 38 times as much as in the lowest quintile.
In Nigeria, participation in private school further exacerbated learning differences.
Using a simple measure of literacy, 50% of children in private school were able to read by end of Primary 2 (grade 2), compared to just under 10% in government schools. Irrespective of their grade, 80% of children in the highest quintile were able to read. In contrast, only 10% of those children in the lowest quintile who were in school were able to read, regardless of their grade.
In short, household surveys can provide vital information not available with school-based surveys. Judicious application of these surveys can help guide decisions regarding reforms needed to support marginalized populations, to collect information on sensitive issues, and to track progress being made against the SDGs. However, because this type
3 The Sustainable Development Goals are available from the website of the United Nations Development Programme, http://www.undp.org/content/undp/en/home/sustainable-development-goals.html.
Data collector for the 2010 Nigeria Education Data Survey (NEDS) conducts an interview

EdData II Final Report 11
of survey can be expensive, development partners should coordinate with each other so that they are not repeated too often, or do not duplicate each other.
Figure 2. Percentage of children able to read, by income quintile, 2010 and 2015 Nigeria Education Data Surveys
Source: Gove (2016).
3.1.6 Impact of Technology Developments on Data Collection During EdData II The EdData II contract focused on making high-quality data available to key stakeholders efficiently. The status of technology in 2004, at the beginning of EdData II, was far different from that in late 2016. During the contract, advances in technology, from increased diffusion and affordability of tablets and smartphones, to development of data collection and sharing applications, contributed to a greater accessibility and availability of education data to stakeholders globally.
Most notably, the work under the EdData II contract benefited from the use of electronic data collection tools. RTI’s open-source Tangerine® software platform (www.tangerinecentral.org) has been central to many EdData II data collection efforts. Tangerine is electronic data collection software designed for use on tablet devices and smartphones. Its primary use is to enable recording of students’ responses in oral early grade reading and mathematics skills assessments, specifically EGRA and EGMA, and SSME.
Tangerine’s development was initially done using RTI’s own internal research and development funding, and was further developed over dozens of applications on activities and projects, including under EdData II. The tool was piloted for EGRA data collection on the Kenya Primary Math and Reading (PRIMR) Initiative task order in early 2012 (Pouezevara, 2012). Since then, the platform has evolved to meet the needs of a wide range of student assessment, survey data collection, and monitoring and
12 EdData II Final Report
evaluation efforts under the IDIQ. Automatic skip patterns, range checks, and field validations can help to significantly reduce missing data and data errors. Most important, Tangerine allows daily synchronization and data upload—directly from the data collectors—for rapid quality assurance analysis by statisticians. This functionality permits for issues in data collections to be quickly identified and addressed already during field work. In general, the amount of time required between the completion of data collection and analysis of data is reduced, as Tangerine-derived data generally require less cleaning and does not require manual entry of the paper-based data following data collection.
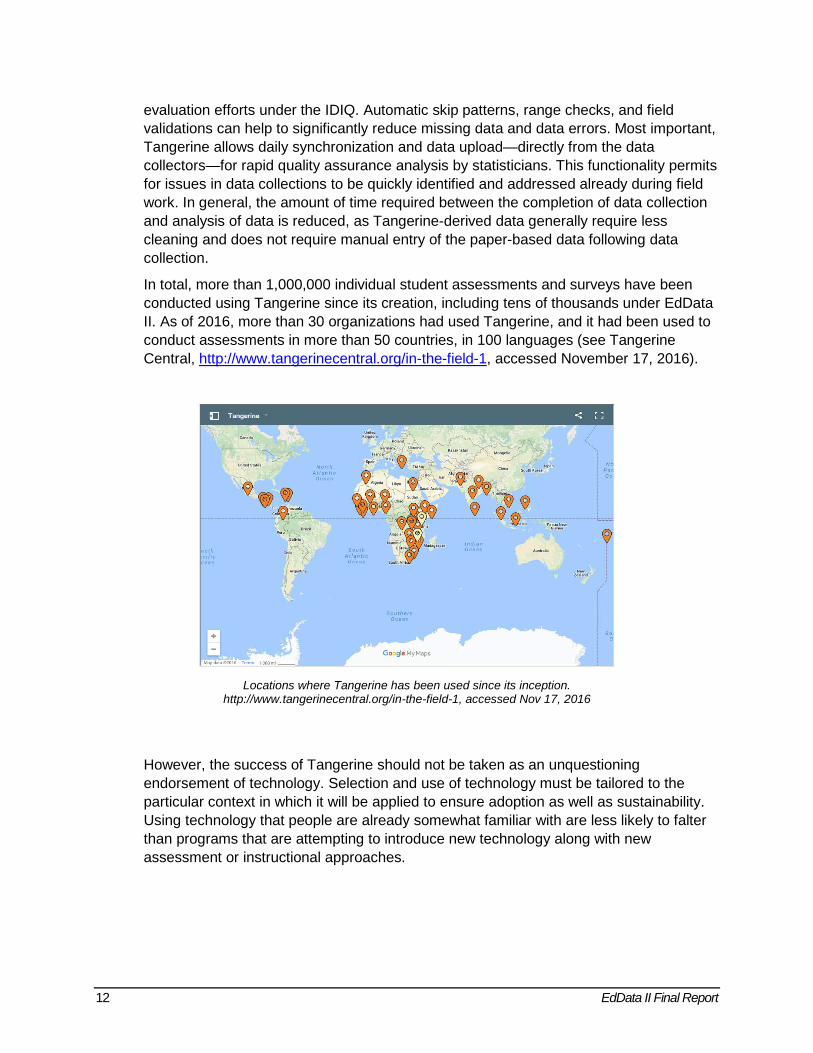
In total, more than 1,000,000 individual student assessments and surveys have been conducted using Tangerine since its creation, including tens of thousands under EdData II. As of 2016, more than 30 organizations had used Tangerine, and it had been used to conduct assessments in more than 50 countries, in 100 languages (see Tangerine Central, http://www.tangerinecentral.org/in-the-field-1, accessed November 17, 2016).
Locations where Tangerine has been used since its inception.
http://www.tangerinecentral.org/in-the-field-1, accessed Nov 17, 2016
However, the success of Tangerine should not be taken as an unquestioning endorsement of technology. Selection and use of technology must be tailored to the particular context in which it will be applied to ensure adoption as well as sustainability. Using technology that people are already somewhat familiar with are less likely to falter than programs that are attempting to introduce new technology along with new assessment or instructional approaches.
EdData II Final Report 13
3.2 Pilot Early Grade Intervention Programs
3.2.1 Purpose of the Interventions EGRA, EGMA, and SSME findings under EdData II demonstrated that large portions of children in the early grades simply were not learning; countries where as many as 80% of children were unable to read a single word were, unfortunately, not unusual. In general, EdData II researchers found that instructional time was severely limited, and focused primarily on choral and rote learning; teachers in many cases were ill prepared, having never received training in how to teach students to read; the supply of instructional materials was lacking, and what was available frequently was not conducive to explicit reading or mathematics instruction, was not graded appropriately, and/or was not used at all or not used at intended; and supplemental reading materials in the classroom and in children’s homes were very limited. Clearly, a different instructional approach was needed. In response to these findings, under EdData II, early grade intervention programs were designed and piloted in an effort to see if a different instructional approach could positively impact student performance. These program designs were based on findings from fieldwork and were grounded in current research on reading development, early mathematical concept development, inclusive education practices, effective instructional approaches, and learning theories. These intervention pilots were evaluated via randomized controlled trials.
Although each pilot was tailored to and developed in collaboration with the ministry, five core elements (the “5 T’s”) were found to be critical in improving early grade literacy instruction and learner outcomes. These five elements are as follows:
1. the approach to teaching (Teach),
2. the availability of high-quality, relevant learner materials (Text),
3. the effective use of instructional time (Time),
4. the use of formative assessment, or checks for understanding, to guide instruction (Test), and
5. provision of instruction in the most effective language (Tongue).
Placing sufficient emphasis on each of these components of instruction helps to make literacy instruction as effective as possible. Although changes in instructional practice typically take years even in developed countries such as the United States, comparison of baseline and endline scores for treatment and control trials indicated that the majority of intervention pilots enjoyed positive and significant increases in student performance. The lessons and techniques learned from these pilot interventions and the elements of the 5 T’s approach are now commonly applied in reading intervention programs. In some cases, these approaches have been adopted by ministries of education and have been brought to national scale. A listing of the intervention pilots funded under EdData II may be found in Annex D.

14 EdData II Final Report
3.2.2 Conclusions from Pilot Activities Although each of the pilot activities conducted through EdData II was unique, some broader key findings were identified. Because of the significance of this research to EdData II overall, in addition to other USAID programming (as mentioned in Section 1.1), these findings are described at some length below.
• Close collaboration with Ministry counterparts is essential. Close collaboration with local ministry of education counterparts is essential to ensure programs are tailored to the needs, capacity, and resources of the country. Collaboration with the ministry also ensures that materials align with the local curriculum. Perhaps most importantly, this collaboration in both the design and implementation of intervention programs ensures local ownership of the program and increases its sustainability. For example, in Kenya, key ministry stakeholders contributed to all aspects of the PRIMR activities, from materials development, to training of the coaches and teachers, to disseminating results and launching PRIMR Initiative subprograms (RTI International, 2014b). Or as was the case in Jordan, the ministry staff worked closely with the implementer to develop the supplementary reading and math materials that were to form the foundation of the intervention program.
• Rollout of programs should be gradual, and should include capacity development within the ministry. Frequently there is pressure to take education reforms and programs to national scale without first piloting them. EdData II intervention pilots provided an opportunity to carefully refine and evaluate the effectiveness of pilot programs before expanding them to additional regions. Needed adjustments in program materials or approaches could be made before the program was taken to scale. Evidence of successful pilots can create political buy-in and support for program expansion.
• Materials development and revision should be an ongoing process, and should be tied to the country’s curriculum. Pilot programs included an initial material development phase, piloting phase, and rollout, with subsequent revisions based on educator feedback, experience in the classrooms, and practical evidence using teachers’ existing strengths as an embarkation point. Our findings suggest that larger programs should embed revision time into their program design, as our pilot programs showed that the initial design of the materials was never done perfectly, and responding to classroom-based feedback was absolutely essential to improving the quality of the materials.
Intervention classroom in the EGRA Plus: Liberia activity
EdData II Final Report 15
• Regular monitoring and evaluation of programs is essential. Program evaluations using instruments such as the EGRA, EGMA, and SSME are needed to measure and maximize program effectiveness. These large-scale assessments, combined with local routine monitoring (collected via coaches and or/via district-level LEMA applications) can provide information on fidelity of implementation and program effectiveness. These in turn, help to identify needed changes in program design or implementation. Programs should not be static but should be adjusted over time based on findings from evaluation and monitoring data. In fact, our pilot results showed that when we created programs that were structured to systematically respond to ongoing monitoring data, they were able to more effectively react to classroom-based challenges than were programs that had to wait for an end-of-year, large-scale EGRA or EGMA.
• Language of instruction (LOI) is important. Other things being equal, the interventions saw greater success where the language spoken at home matched the language of instruction in the classroom. In Nigeria, for example, children who reported speaking Hausa (the language of the intervention) at home showed more improvement on literacy skills than students who reported not speaking Hausa at home. However, EdData II research also identified real challenges in the effective implementation of mother-tongue instruction—in particular, in countries with complex multilingual environments within a small geographic space. In these environments, it can be difficult to identify a language of instruction that is common among the majority of students; teachers lack fluency or training in the LOI in the school to which they are assigned; and obtaining printed reading materials in the LOI is a challenge in resource-constrained countries. Our research results therefore raised awareness about problems surrounding the choices of LOI solutions that are appropriate for countries, as the final policy answer should be driven by the sociopolitical language environment, teacher deployment policies, community demand for particular languages, and the relative homogeneity of local language communities.
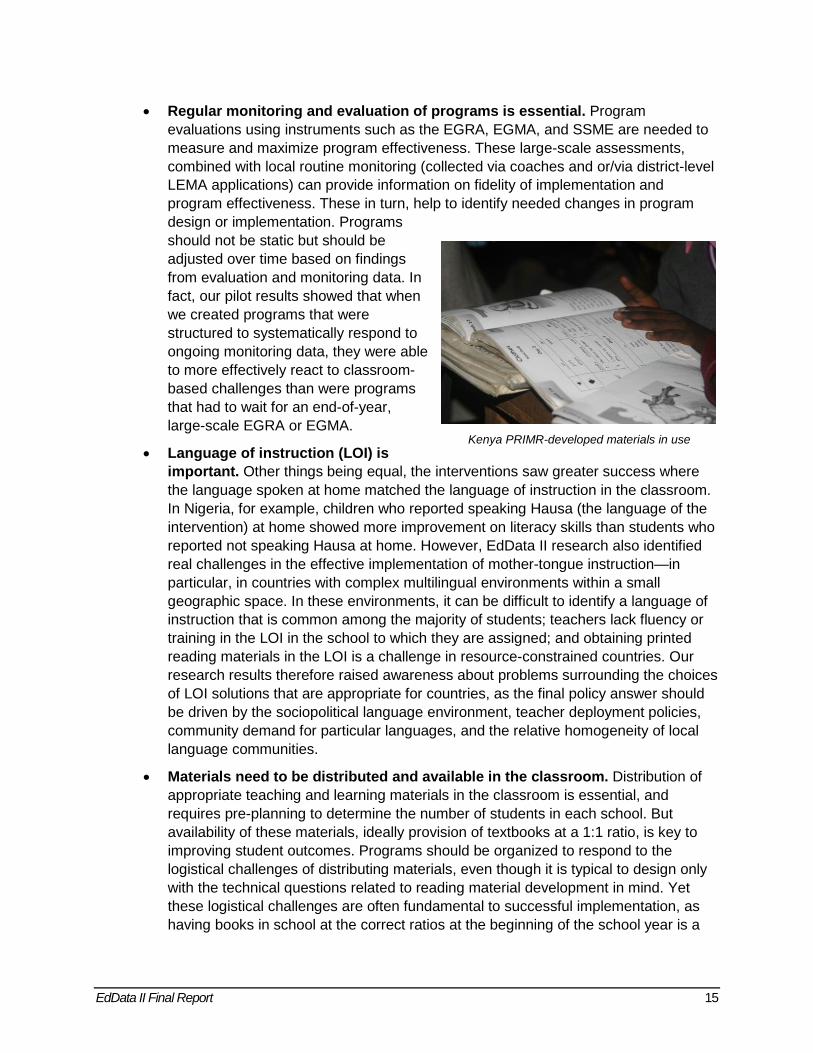
• Materials need to be distributed and available in the classroom. Distribution of appropriate teaching and learning materials in the classroom is essential, and requires pre-planning to determine the number of students in each school. But availability of these materials, ideally provision of textbooks at a 1:1 ratio, is key to improving student outcomes. Programs should be organized to respond to the logistical challenges of distributing materials, even though it is typical to design only with the technical questions related to reading material development in mind. Yet these logistical challenges are often fundamental to successful implementation, as having books in school at the correct ratios at the beginning of the school year is a
Kenya PRIMR-developed materials in use

16 EdData II Final Report
logistical challenge that has a significant impact on the technical implementation of the program.
• Provision of direct and frequent in-classroom support to teachers is important. In classroom coaching visits—such as those in Kenya PRIMR, with government-managed Curriculum Support Officers and instructional coaches serving the nonformal settlements; and in Jordan, with supervisor visits, proved very successful. For these dyads to be productive requires training in key instructional and teacher feedback methods. The results in Jordan highlighted that the frequency of visits by a supervisor or coach was associated with improved student performance. Specifically, 93% of teachers with frequent supervisor visits had top-performing classrooms. The use of coaches should, ideally, reflect a model that would be sustainable once the project has ended. Use of ministry staff as coaches better ensures a trained local cohort of coaches and increases the sustainability of the approach. Considering the practical implications for the transport needs of these coaches is also essential, and working with governments to design low-cost, sustainable methods to reimburse transport costs in a way that incentivizes visits is a critical part of long-term program success.
• In-service teacher training helps teachers improve their instructional approach and improves learning outcomes. For example, in Jordan, 63% of teachers who attended both of the available training sessions were in top-performing classrooms for mathematics, as compared to only 11% of those teachers in classrooms who did not attend both trainings. Overall, teachers who attended more of the training had a greater proportion of readers and mathematicians in their classes than teachers who attended less training. This is important to consider for future intervention projects; examining and mitigating the factors that prevent teachers from attending the training as expected could help to increase attendance. In addition, the design of the training program matters. In particular, the duration of trainings, the frequency, and the selection of trainers (ideally those who will be following up in classrooms), are all points that require careful consideration in program design.
• Providing teachers with a structured approach and materials can change instructional practice. One of the research questions explored by the Nigeria Reading and Access Research Activity (RARA) was whether providing teachers with a structured approach and materials to teach foundational literacy skills would lead to changes in their instructional practice, including the amount of time they actually spent teaching. The research affirmed that such an approach did substantially increase the amount of time spent teaching key literacy skills. Data from a classroom observation instrument administered in both control and treatment schools before and after the intervention indicated that the amount of time teachers spent teaching increased in the treatment schools, whereas the teachers in control schools actually decreased the amount of time they taught. The structured approach to instruction not only helped teachers increase the amount of time taught but also helped to counter what appeared to be an “end-of-the-year” slump among the control group of teachers. These results suggest that supporting teachers’ instruction with defined lesson plans and materials can help them increase the amount of time they teach

EdData II Final Report 17
and focus their instruction on key literacy skills. Research from PRIMR showed that giving teachers structured teachers’ guides improved learning outcomes more than simply providing improved student books, as the teachers’ guide was a key resource to improve instruction.
• Pilot programs are an important means for researching the best approaches for improving reading and math skills. USAID should continue to invest in examining how pilot interventions can address complex issues such as improving reading and math achievement at scale, in complex multilingual environments, with different incentives for teachers and education officers. These pilot activities reviewed the impact of improving reading interventions—including revising trainings for teachers, improving materials available for teachers and students, providing in-service support to teachers, and initiating other aspects such as involving the community and adding mathematics instructional approaches. The data collected and analyzed through this work has helped to refine the global understanding of how to implement a successful early grade literacy or mathematics program.
More specifically, data-based findings from evaluations of EdData II pilot interventions have influenced the design of other programs, both within EdData II task orders and in USAID education programming in general. For example, the EdData II EGRA Plus: Liberia task order was a randomized controlled trial to address literacy and numeracy; it piloted components such as instructional coaching, provision of teaching and learning materials, school report cards, and community mobilization efforts. Assessments at multiple time points measured changes in pupil performance, and the various treatment and control groups allowed for comparisons of treatment effectiveness. Lessons learned from this trial were incorporated into the design of the Primary Math and Reading (PRIMR) Initiative in Kenya, itself a medium-scale pilot and another randomized controlled trial. Evaluation results from PRIMR in turn fed into the design of a DFID-funded PRIMR Rural Expansion program, which then supported the design of the national, USAID-supported scale-up of literacy and numeracy programs in that country, as well as ongoing education programs in other contexts.
3.3 Illustrations of Recent Discrete Research Studies A number of discrete research studies were carried out under the EdData II contract in an effort to increase understanding about the functioning of the education sector. Some studies focused on the current state of affairs; others explored potential new approaches to increase student learning or to better understand barriers to better student performance. Findings from this research were made available through EdData II and the USAID Development Experience Clearinghouse (DEC), and were used to inform Washington-based and field-based USAID education staff. The research ranged from desk studies to short-term intervention pilots. Illustrative research studies are listed below.
• Desk studies:
− Research and Tools to Support Improved Inclusion and Girls’ Education

18 EdData II Final Report
− Incentives and Accountability Literature Review
− Teacher Effectiveness Literature Review
− School-Related Gender-Based Violence Literature Review and Conceptual Framework
− Guide for Strengthening Gender Equality and Inclusiveness in Teaching and Learning Materials (Gender and Inclusion Guide)
− The Planning for Language Use in Education: Best Practices and Practical Steps to Improve Learning Outcomes
− Scale-Up, Sustainability, and Reform Support
− Boys’ Underachievement in Education
• Surveys and sector reviews:
− Situation and Needs Assessment for Inclusion of Students Who Are Blind/Low Vision or Deaf/Hard of Hearing in Morocco
− Survey of Children’s Reading Materials in African Languages in Eleven Countries
− Research on Reading in Morocco: Analysis of Textbook Procurement Chain and Market for Supplemental Reading Materials
− Data Gap Assessments in Ghana, Mozambique, and the Philippines
− LQAS pilots in Tanzania, Ghana, and Ethiopia
− Cambodia Sector Assessment
− Arabic Reading Instruction
− Asia Higher Education Study
Mekong Value Chain Study
• Discrete intervention pilot studies:
− Social and Behavior Change Communication (SBCC) Research in Senegal and Malawi
− Incentives Pilot in Primary Schools in Jordan
− Remedial Education Pilot for Grades 1,2, and 3 in Jordan
3.4 Dissemination As indicated earlier, dissemination of the work conducted through the EdData II project was critical to the project’s success. Dissemination efforts involved messaging on online outlets and social media, presentations at conferences, publication in the literature, and sharing of findings locally where assessments were conducted in person with key stakeholders.

EdData II Final Report 19
3.4.1 Local Key-Findings Workshops and Benchmarking Activities For all assessments conducted through the EdData II task order, an important part of the activity was local dissemination efforts with ministry counterparts and key stakeholders, such as representatives from the donor community and from nongovernmental organizations (NGOs) working in the field of early grade education.
Typically, a dissemination workshop would be held after the findings report had been prepared, to engage local ministry counterparts, and discuss next steps for how to use the findings of the data to further improve early grade reading and math outcomes. In locations where an assessment occurred—e.g., an EGRA, EGMA, and/or SSME—
without an accompanying intervention activity, these discussions often focused on appropriate next steps to improve outcomes. And, where intervention pilot activities were tested, discussion at the dissemination workshop included sharing key findings from the intervention activity, such as discussing next steps to expand upon the best practices identified through the intervention. These meetings gave stakeholders an opportunity to thoroughly review the findings from
data collected, as well as to make plans to address identified issues. The main outcomes from these dissemination workshops were incorporated into final activity reports or other reports, as appropriate.
In addition to the findings discussions, efforts were made in some countries to work with major ministry stakeholders to develop country- and language-specific benchmarks for reading and/or math proficiency. Throughout the project, benchmarking activities were conducted in Egypt, Ethiopia, Ghana, Jordan, Kenya, Liberia, Malawi, Pakistan, Philippines, Tanzania, West Bank, and Zambia.
The goal of the benchmarking exercises was to determine a benchmark value for the indicators of identified EGRA or EGMA subtasks. Through careful review of EGRA and EGMA results, ministry officials and stakeholders would determine the level of performance on the selected subtask that could be considered the benchmark for an acceptable level of skill development. For example, stakeholders in each country would set a level of oral reading fluency that the data showed was necessary for students to achieve an acceptable level of comprehension. Debate and discussion would center on whether the given level of oral reading fluency (or any other subtask indicator) was being set high enough to demonstrate true mastery of the skill, versus whether it was being set too high, given students’ current levels of performance.
During benchmarking workshops, ministry staff and stakeholders would also determine five-year targets for the percentage of pupils who would be meeting the selected benchmarks, as well as the percentage of pupils who would be scoring zero on the
Benchmarking activity in Malawi, 2014
20 EdData II Final Report
indicator. A facilitator worked with the group to discuss the important aspects of a good benchmark (e.g., that it is indicative of comprehension, is achievable—particularly as compared to the current performance level—and is something that all stakeholders believe is important to achieve). In countries with multilingual education systems, benchmarks were set for skill areas in reading in each language (for example, different reading fluency benchmarks were set for seven languages in Ethiopia). The benchmarks developed with EdData II support were made “official” in about half of the benchmark countries. The process for officially adopting benchmarks is often distinct from the process of drafting them. If senior-level ministry officials were not present during the benchmark drafting meetings, and no separate benchmark adoption meeting was held, the benchmarks frequently were not adopted. In the future, we would recommend working with the ministry to schedule a meeting with senior-level officials to help facilitate the adoption of the benchmarks.
These benchmarking exercises, as well as the policy dialogue workshops, gave local stakeholders hands-on experience in how study findings could be used to inform their decisions.
3.4.2 Online Dissemination Online dissemination efforts played a large role in successfully sharing the research conducted through the EdData II contract. As part of the EdData II Core activity, the EdData II website (www.eddataglobal.org) was created, and was operational as of January 2005. Initially, the website was populated with documents from DHS-EdData (“EdData I”), as well as with data sets and revised data codebooks. Throughout the life of the project, reports and data sets from the various task orders were added, and as of the closing of the EdData II contract, more than 950 documents and 24 data sets were posted to the site, such that they were readily available and accessible to the wider community of practice.

EdData II Final Report 21
Website analytics speak to the popularity of the site and the use of the resources contained within. In its first year of operation, the site received 33,600 hits from various global users. As the site expanded in terms of the types and amount of resources it offered, its use continued to increase. Research activity reports, news articles, toolkits and manuals, survey instruments, and presentation materials were continuously added to the site as they were completed. In 2015, the site received over 1,000,000 hits, averaging about 80,000 hits per month. At the close of the EdData II contract, the resources available on the website were transferred to the Global Reading Network (https://globalreadingnetwork.net/).
Additional dissemination efforts were made through other online avenues, reaching audiences outside of those who navigated to the EdData II webpage. For example, blog posts were prepared to promote and disseminate activities under the Data for Education Research and Programming (DERP) in Africa task order in particular:
• In July 2016, the guidance document titled Planning for Language Use in Education: Best Practices and Practical Steps to Improve Learning Outcomes was posted to the World Education blog (see https://gemreportunesco.wordpress.com/2016/07/27/ planning-for-language-use-in-education-best-practices-and-practical-steps-for-improving-learning). The post was shared more than 97 times on Facebook and 112 times on LinkedIn.
• In August 2016, a blog about the desk study titled Teacher Effectiveness in Selected Sub-Saharan African Countries was posted to the Global Partnership for Education’s (GPE’s) website (see http://www.globalpartnership.org/ blog/improve-quality-education-reconsider-true-definition-good-teacher).
• On October 21, 2016, a blog about the Guide for Gender Equality and Inclusiveness was posted on USAID’s Education in Crisis and Conflict Network website (see http://eccnetwork.net/equality-educational-materials).
• On October 25, 2016, a blog about the Reading Materials Survey (Survey of Children’s Reading Materials in African Languages in 11 Countries) report was posted to the Global Reading Network’s Web site (see
EdData II homepage
22 EdData II Final Report
https://globalreadingnetwork.net/news-and-events/blog/discovering-more-about-early-grade-reading-material-availability-sub-saharan).
Each of the blogs was posted on a different site to help reach a broad group of stakeholders and to help ensure the best targeted audience for the subject matter.
3.4.3 Conference Presentations Dissemination activities throughout the EdData II project also included presentations at conferences on key findings from the research. In particular, activities were often presented at the Comparative and International Education Society (CIES) conference, held annually in early March. The conference is a forum to connect and share research findings with the society’s more than 2,500 members who are academics, practitioners, and students from around the world. Dozens of presentations were made at CIES during the project, from 2007 through 2016. In addition, many workshops were conducted at CIES as well, on topics ranging from the development and rationale of EGRA and EGMA to the development of the Guide for Strengthening Gender Equality and Inclusiveness in Teaching and Learning Materials.
In addition, in the final year of the project, a reception was held at the 2016 CIES conference to celebrate and share resources from across the EdData II task orders, particularly the USAID/Washington-based task orders. The attendees of the 2016 EdData II event were given USB flash drives with the documents loaded onto them so that the attendees could easily keep files of final deliverables without having to hand-carry large amounts of printed materials from the CIES conference. The reception was well received, with approximately 100 people participating throughout the evening.
Sharing research findings throughout the project was an important driver of EdData II’s success. Engaging local, regional, and global stakeholders to share findings helped to ensure that the research had an impact on policy at the local level, and was quickly leveraged to further improve early grade reading and math outcomes. In addition, ensuring that dissemination plans were developed as part of the activities’ overall design was key to ensuring that the findings from the work were shared broadly.
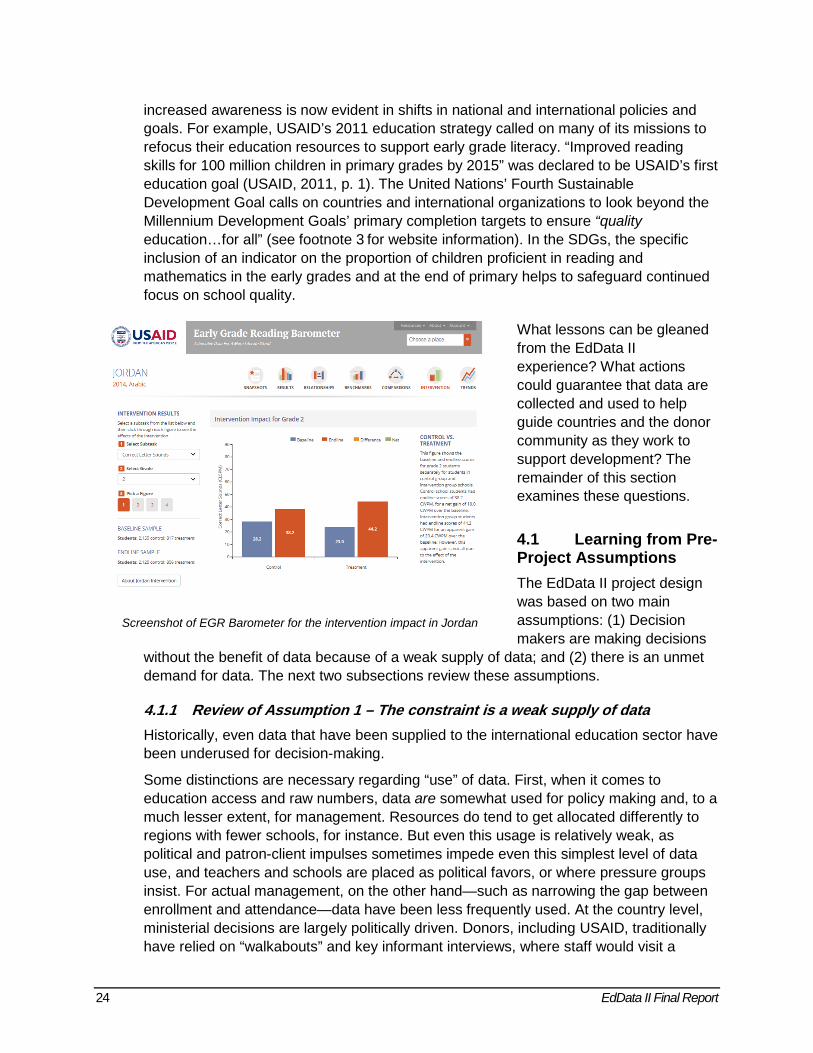
3.4.4 Early Grade Reading Barometer As a result of the EGRA, EGMA, and SSME, developing countries and their partners are now emphasizing improved reading outcomes in primary school in their national goals, plans, and sector investment strategies; and funding agencies are supporting those goals in their programs of assistance.
However, as the use of EGRA and similar reading assessments grew globally, there emerged a need to develop tools to help users (key stakeholders, ministry officials and donors) interpret and better use reading performance data to inform program design and implementation. The appropriate use of data generated by EGRA depends on the way the assessment is used and on whether a country is conducting a baseline, evaluating a pilot effort, or preparing to launch a national reading program, among just a few examples.
EdData II Final Report 23
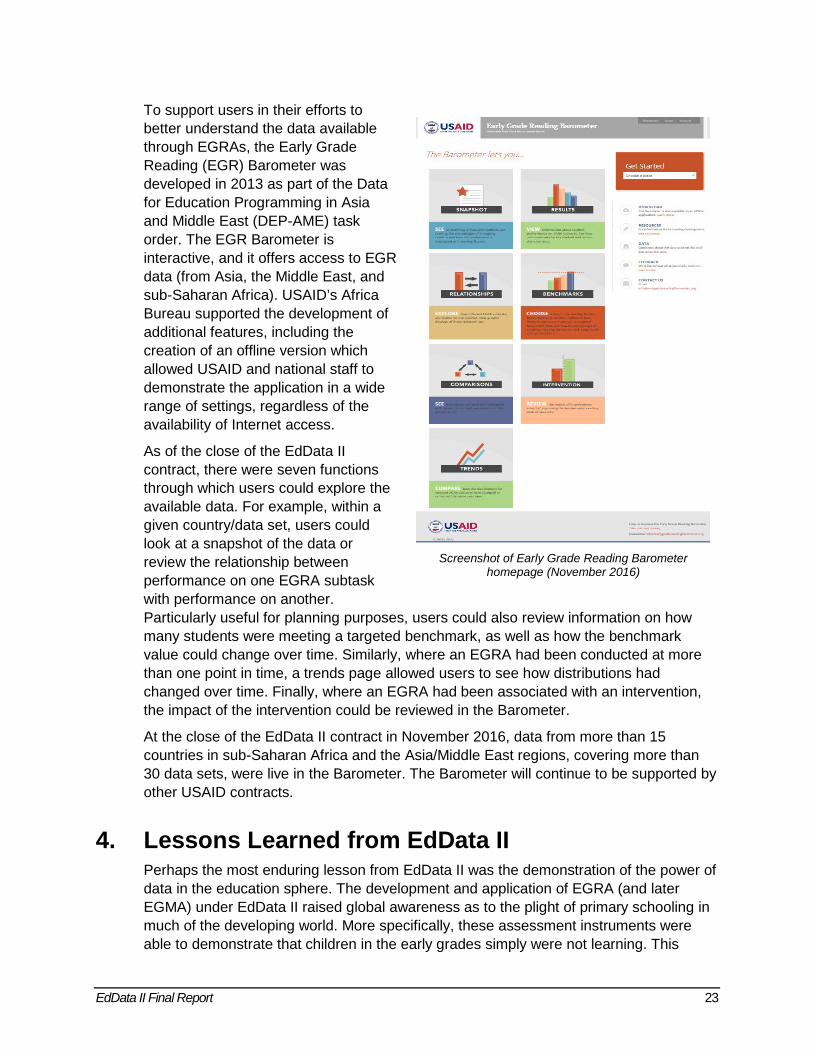
To support users in their efforts to better understand the data available through EGRAs, the Early Grade Reading (EGR) Barometer was developed in 2013 as part of the Data for Education Programming in Asia and Middle East (DEP-AME) task order. The EGR Barometer is interactive, and it offers access to EGR data (from Asia, the Middle East, and sub-Saharan Africa). USAID’s Africa Bureau supported the development of additional features, including the creation of an offline version which allowed USAID and national staff to demonstrate the application in a wide range of settings, regardless of the availability of Internet access.
As of the close of the EdData II contract, there were seven functions through which users could explore the available data. For example, within a given country/data set, users could look at a snapshot of the data or review the relationship between performance on one EGRA subtask with performance on another. Particularly useful for planning purposes, users could also review information on how many students were meeting a targeted benchmark, as well as how the benchmark value could change over time. Similarly, where an EGRA had been conducted at more than one point in time, a trends page allowed users to see how distributions had changed over time. Finally, where an EGRA had been associated with an intervention, the impact of the intervention could be reviewed in the Barometer.
At the close of the EdData II contract in November 2016, data from more than 15 countries in sub-Saharan Africa and the Asia/Middle East regions, covering more than 30 data sets, were live in the Barometer. The Barometer will continue to be supported by other USAID contracts.
4. Lessons Learned from EdData II Perhaps the most enduring lesson from EdData II was the demonstration of the power of data in the education sphere. The development and application of EGRA (and later EGMA) under EdData II raised global awareness as to the plight of primary schooling in much of the developing world. More specifically, these assessment instruments were able to demonstrate that children in the early grades simply were not learning. This
Screenshot of Early Grade Reading Barometer
homepage (November 2016)
24 EdData II Final Report
increased awareness is now evident in shifts in national and international policies and goals. For example, USAID’s 2011 education strategy called on many of its missions to refocus their education resources to support early grade literacy. “Improved reading skills for 100 million children in primary grades by 2015” was declared to be USAID’s first education goal (USAID, 2011, p. 1). The United Nations’ Fourth Sustainable Development Goal calls on countries and international organizations to look beyond the Millennium Development Goals’ primary completion targets to ensure “quality education…for all” (see footnote 3 for website information). In the SDGs, the specific inclusion of an indicator on the proportion of children proficient in reading and mathematics in the early grades and at the end of primary helps to safeguard continued focus on school quality.
What lessons can be gleaned from the EdData II experience? What actions could guarantee that data are collected and used to help guide countries and the donor community as they work to support development? The remainder of this section examines these questions.
4.1 Learning from Pre-Project Assumptions The EdData II project design was based on two main assumptions: (1) Decision makers are making decisions
without the benefit of data because of a weak supply of data; and (2) there is an unmet demand for data. The next two subsections review these assumptions.
4.1.1 Review of Assumption 1 – The constraint is a weak supply of data Historically, even data that have been supplied to the international education sector have been underused for decision-making.
Some distinctions are necessary regarding “use” of data. First, when it comes to education access and raw numbers, data are somewhat used for policy making and, to a much lesser extent, for management. Resources do tend to get allocated differently to regions with fewer schools, for instance. But even this usage is relatively weak, as political and patron-client impulses sometimes impede even this simplest level of data use, and teachers and schools are placed as political favors, or where pressure groups insist. For actual management, on the other hand—such as narrowing the gap between enrollment and attendance—data have been less frequently used. At the country level, ministerial decisions are largely politically driven. Donors, including USAID, traditionally have relied on “walkabouts” and key informant interviews, where staff would visit a
Screenshot of EGR Barometer for the intervention impact in Jordan

EdData II Final Report 25
handful of schools, discuss education system status with key informants, and design their country strategies. Again, these design teams could often find data on access issues, but not on quality issues. Data gap and data capacity assessments conducted in Ghana, Mozambique, and the Philippines under an EdData II task order revealed that data were being routinely collected. If the findings in these countries were representative, as was judged likely, they would effectively counter Assumption 1.
EdData II research and programming eventually pointed to three main reasons for the underutilization, as opposed to absence, of data.
Relevance. First, education data often lack relevance for decision makers. Data are frequently collected out of bureaucratic inertia, mostly in response to the requirements of a national education management information system (EMIS). In order to ensure relevance, data requirements should be driven by country goals, which are sometimes derived from international development goals. The United Nations Sustainable Development Goals and their related indicators provide a good road map for relevant data that should be collected and used to inform decision-making. Further, performance indicators, combined with monitoring and evaluation data on relevant school characteristics and fidelity of program implementation, can help countries better tailor and modify their programs on an ongoing basis to ensure maximum program effectiveness. The SSME and LEMA designed under EdData II (see Sections 3.1.3 and 3.1.4) are examples of two methods that can be used to collect this type of data.
In addition, lack of disaggregation makes even thematically relevant data less useful for local stakeholders. To explain: Although data typically are collected locally initially (at the district, subdistrict, or school level), these data are compiled at the central or sometimes regional level. Findings are rarely generated for or disseminated at a subnational level. As a result, when local offices of education ministries do have power to make decisions, they do so without the benefit of locally relevant information. Schools and districts may see no value to themselves in participating in these big data collection efforts. If local stakeholders have no incentive to improve the quality of these data, the opportunity for them to review and correct any inconsistencies is missed. At times, local offices will take matters into their own hands, generating their own data and in so doing, creating duplication and inconsistencies. EdData II addressed the need for data disaggregation by carefully drawing representative samples for national and regional assessments, for example; and by envisioning approaches such as LEMA that encouraged local data collection for local use.
Reliability and validity. Second, data may lack reliability or be perceived as such. Under EdData II, researchers found that in certain cases, concerns about data quality resulted in duplicative data collection efforts, as multiple branches of the government sought to secure their own data, which they felt would be of better quality. In the “big data” literature, problems of data reliability are known as “little data” issues. In other words, ensuring that simpler things like school counts, repetition, and attendance are measured with good quality should precede the integration of many large data sets.
Raising data quality requires data collection instruments and protocols that are tailored to countries’ specific data needs, but that also reflect local technical and financial resources. How much training and local supervision are needed to ensure reliable

26 EdData II Final Report
administration of these assessment instruments? What can this country sustain with the staff, local nongovernmental organizations, and financial resources it has? EdData II researchers explored the concept that when limited supervision and training are available, it is best to collect data using instruments that can be administered reliably even with minimal supervision or training. Another finding was that quality control measures are essential for all data collection efforts, regardless of their scale or complexity: Random verification of collected data lends accountability to the data collection process. Finally, the project’s introduction of electronic data collection methods (Section 3.1.6) greatly enhanced data quality as well as timeliness.
Faith in the quality of data is nearly as important as data accuracy. EdData II was able to demonstrate that working closely with local governments and stakeholders to adapt and administer assessments and questionnaires created a sense of local ownership in these tools. In most cases, this ownership resulted in greater acceptance of results (whether good or bad). Careful documentation and presentation of the quality control measures taken throughout the instrument development, data collection, and analysis phases also helped to create trust in the rigor of the data.
Customs and habits. Third, EdData II interventions in numerous countries confirmed that even when relevant and reliable data existed, education decision makers were not accustomed to using data to inform their decisions. Cumulative years of maintaining an EMIS, for example, may have generated a supply of data without creating demand at the same time, and resulted in underutilization of data systems. In some cases, issues of limited or no accountability also dampened the demand for data. Further complicating the situation was the fact that most EMIS donor assistance stopped at improving the mechanical aspects of the supply (e.g., better questionnaire design, better hardware and software, improved data transmission). No next step was taken to demonstrate the relevance of data results for both policy making and routine management decisions. In contrast, primarily with its literacy and numeracy data, EdData II demonstrated concretely how data may be used to inform decision-making, and built capacity in how to track progress against development targets. Both are essential if data are to be used effectively and if data collection is to be sustained. In other words, linking data projects to policy projects—or at least, to policy concerns—is key.
4.1.2 Review of Assumption 2 – There exists an unmet demand for data The second EdData II design assumption involved unmet demand for data. An important distinction needs to be made here between unmet need and unmet demand.
EdData II studies revealed that initially, there really was no demand for information about early grade education. Ministries assumed that early grade education was not important or was being handled reasonably well, since the evidence that they had, if any, was collected at the end of primary. Yet even the project’s initial studies of early grade literacy demonstrated, uniformly, that things were not going well. So while there was no unmet demand, there clearly was an unmet need.
Thus, a key lesson from EdData II is that as donor organizations and ministries work to achieve their development goals, thought needs to be put into evaluating which of the development goals have strategies that are fully grounded in locally available/reliable

EdData II Final Report 27
data. Are there unmet data needs related to these development goals? For early grade reading, EdData II researchers were able to identify the need and, by demonstrating how these data could be used in decision-making, helped to create lasting demand for these data. That said, although EdData II was profoundly influential in this regard, it certainly was not the only example of successful creation of data demand. Using its Annual Status of Education Report (ASER) assessments, for instance, Pratham in India has been incredibly successful at generating grassroots demand for information on early grade reading at a very local level. Stories abound of villagers following volunteers from house to house as they assess children’s reading and math skills.
In summary, small pilots of assessments or surveys under EdData II helped determine whether proposed data collection instruments might help to meet an unmet need. EdData II pilot intervention programs also demonstrated how assessment data—or assessment data combined with monitoring data—could help drive improvements in learning outcomes. These pilot findings could be, and sometimes were, used to garner support and demand for larger-scale studies. For example, following the first national-level EGRA survey in the Philippines, the Department of Education in that country committed to regular use of EGRA (and EGMA) to monitor system performance and to evaluate the impact of its national curriculum reforms.
4.2 Cautionary Tales from EdData II Three related cautionary tales stem from EdData II. First, when a new assessment instrument, such as EGRA, is shown to be successful, there is a tendency to want to apply this instrument in ways that differ from its original intent. For example, although the EGRA was designed to raise awareness about early literacy levels, the research team steadfastly maintained that it was not designed as a substitute for nationally administered, census-based examinations, and it was not designed as a high-stakes test. It was also intended only for the early grades; applications to, say, end of primary or even secondary, were not tested under the program and therefore are of unknown value. Assessment instruments should be designed for a specific purpose and to fill a recognized need (as explained above), and the validity, reliability, and sustainability of any alternate applications should be carefully evaluated before the instruments are used for a different purpose.
Second, and similarly, there is a tendency to want to apply the methods or results of research from one context or country universally. Even when well intentioned, making universal education policies that do not take a particular country’s context into consideration can result in ineffective or even deleterious program design. Studies conducted in North America or Europe, for example, have been used as a basis for program design in sub-Saharan Africa without first testing whether those same findings could be replicated reliably in a different context. Similarly, in middle-income countries whose languages may have very transparent orthographies, an assessment such as EGRA that emphasizes the very fundamental skill of decoding may be of questionable utility. Likewise, a project that emphasizes decoding, when children have already mastered this skill, may not be the most suitable. Implementers and evaluators should

28 EdData II Final Report
be careful to select the assessment instruments and intervention approaches that are most appropriate for the context in which they are being applied.
Third, following the USAID Forward Strategy, many of the EdData II task orders included capacity-building activities. The goal of this capacity building was to impart knowledge and skills that local ministerial staff would need to carry out assessments and or intervention work independently of the project team. Although many task orders carried out extensive capacity building (both formal and informal), the ministry staff who were available to work on the projects frequently lacked the technical background they would have needed to fully absorb the training materials and/or lead future assessments.
Perhaps the most lasting impact the project had in terms of capacity building was with the local subcontractors who worked with RTI on multiple surveys and assessments. These subcontractors were able to take on more responsibility with each assessment and, by the end of the contract, were true partners in the endeavor. Similarly, ministry staff who worked on multiple assessments became master trainers in later rounds of data collection.
Future program designs should take into consideration local ministerial capacity and availability when setting capacity-building goals. Building capacity in the local private sector should be considered as a viable alternative when relevant technical resources are not available among the ministerial counterparts. One-time capacity building activities are sufficient for introducing new concepts, but repeated hands-on applications that take place across multiple time intervals can be much more effective means to building lasting capacity.
4.3 Conclusions Gleaned from EdData II The most salient conclusions derived from the project have been summarized in a series of bullet points, as indicated below.
• Broad and long-term goals. Data have the potential to play an incredibly important role in both identifying and prioritizing development needs, and in helping to achieve long-reaching development goals. Specifically, data collection instruments should reflect national and international goals, such as each country’s targets for improving student performance and/or the United Nations SDGs, to ensure that these data provide relevant information to decision-makers.
• Subnational data. In addition to conducting national evaluations, researchers and practitioners should routinely collect local monitoring data, in an effort to increase system accountability and to provide information from the ground up regarding program implementation and design, as needed for national and subnational decision-making.
• Monitoring data. Routine collection and effective use of monitoring data can improve program design, fidelity, and effectiveness.
• Accountability and local ownership. Data quality and reliability (both real and perceived) greatly impact people’s willingness to use the data. Local participation

EdData II Final Report 29
and ownership of assessment and evaluation instruments, and their accompanying protocols, can greatly enhance acceptance of resulting data.
• Capacity. Even with relevant and reliable data, decision-makers still may not use the data unless they receive specific training in how to do so.
• Piloting to assess relevance. Ministries may be reluctant or uncertain of the need to collect information on an issue that they believe is not relevant in their country. Small, exploratory pilot assessments may be needed to confirm the relevance of an issue and to help generate demand for data.
• Staying true to purpose. Researchers and advisors must exercise caution when trying to apply assessment or evaluation instruments for purposes that do not align with their original intent.
• Designing for context. Although international experience and research should certainly inform program design, the exact nature of an education intervention should be tailored to a country’s specific needs. Program designers should resist applying a one-size-fits all approach, whether to assessments or to the application of research findings.
• Open-source instruments and sharing of research. A key feature of EdData II was the focus on sharing information and resources. The project team maintained a commitment to an open-source approach that made all instruments and protocols readily available, and the contract terms permitted RTI to spend time giving advice and guidance to other implementers interested in using this approach. This somewhat unusual step of minimizing project boundaries leveraged USAID’s investments in the EdData II products. As indicated in the introduction to this report, other donors, donor-funded contractors, and private foundations adopted and adapted many of the EdData II-funded tools and approaches.
• Community of practice. The common application of EdData II-developed approaches, and technical exchanges that benefited both RTI and other implementers, helped to ensure learning from each other’s experiences and kept the quality standards/expectations of the data collection and analysis high. A prime example is the May 2015 “EGRA 501” workshop, formally titled “Improving the Quality of EGRA Data: A Consultation to Inform USAID Guidance on the Administration of Early Grade Reading Assessments,” which led to collaborative technical working groups and broad input for EGRA protocols and the EGRA Toolkit, Second Edition (RTI International, 2016).
• Open collaboration between funder and contractor. Finally, throughout the life of EdData II, project activities benefited from close discussion and collaboration between USAID and its contractor, RTI International. Open discussions—led by USAID—with the technical project team about task order goals facilitated the development of scopes of work that reflected technical best practice, as well as local needs and conditions. In addition, this type of pre-contractual discussion, which is not common (or legally feasible) under many procurements, gave Mission staff an opportunity to avail themselves of technical expertise and to learn firsthand about

30 EdData II Final Report
research design, sample selection, and data quality measures, among other topics. EGRA, other tools, and discussions around scale-up were also part of the dialogues that helped ensure USAID’s productive use of the EdData II contracting vehicle.
EdData II Final Report 31
References Baroody, A. J., Lai, M.-L., & Mix, K. S. (2006). The development of number and operation sense
in early childhood. In O. Saracho & B. Spodek (Eds.) Handbook of research on the education of young children (pp. 187–221). Mahwah, NJ: Erlbaum.
Betts, K., Mulcahy-Dunn, A., & Valadez, J. (2016). Toolkit for the Local Education Monitoring Approach (LEMA). Prepared for USAID under the Education Data for Decision Making (EdData II) project, Task Order No. AID-OAA-12-BC-00003 (RTI Task 20, Activity 5). Research Triangle Park, NC: RTI International.
Chard, D. J. Clarke, B., Baker, S., Otterstedt, J., Braun, D., & Katz, R. (2005). Using measures of number sense to screen for difficulties in mathematics: Preliminary findings. Assessment for Effective Intervention, 30(2), 3–14.
Clements, D., & Samara, J. (2007). Early childhood mathematics learning. In F.K. Lester, Jr. (Ed.), Second handbook on mathematics teaching and learning (pp. 461–555). Charlotte, NC: Information Age.
Crouch, L. (2011). Lot Quality Assurance Sampling (LQAS) in education? [Presentation]. Prepared under the USAID EdData II project for the USAID Education Sector Council, February 16, 2011. Research Triangle Park, NC: RTI International. https://globalreadingnetwork.net/eddata/lot-quality-assurance-sampling-lqas-education
Foegen, A., Jiban, C., & Deno, S. (2007). Progress monitoring measures in mathematics: A review of literature. The Journal of Special Education, 41(2), 121–139.
Heneveld, W., & Craig, H. (1996). Schools count: World Bank project designs and the quality of primary education in Sub-Saharan Africa. Washington, DC: The World Bank.
Gove, A. (2016). Reconvening the original EGRA expert panel: How has assessment changed our work in literacy? [Presentation]. Prepared for the Global Reading Network’s International Literacy Day forum, September 9, 2016. Research Triangle Park, NC: RTI International.
Mulcahy-Dunn, A., Jukes, M., & Stern, J. (2016). Measurement and Research Support to Education Strategy Goal 1. Rationale for using Lot Quality Assurance Sampling (LQAS) in projects: Draft for review. Prepared for USAID under the Education Data for Decision Making (EdData II) project, Task Order No. AID-OAA-12-BC-00003 (RTI Task 20, Activity 5). Research Triangle Park, NC: RTI International.
Mulcahy-Dunn, A., Valadez, J. J., Cummiskey, C., & Hartwell, A. (2013). Report on the pilot application of Lot Quality Assurance Sampling (LQAS) in Ghana to assess literacy and teaching in primary grade 3. Prepared for USAID under the Education Data for Decision Making (EdData II) project, Task Order No. EHC-E-07-04-00004-00 (RTI Task 7). Research Triangle Park, NC: RTI International. http://pdf.usaid.gov/pdf_docs/PA00K2DT.pdf
Ralaingita, W. (2012). Development and rationale of the Early Grade Math Assessment [Presentation]. Prepared for the annual conference of the Comparative and International Education Society (CIES), April 22, 2012, San Juan, Puerto Rico. Research Triangle

32 EdData II Final Report
Park, NC: RTI International. https://globalreadingnetwork.net/eddata/cies-2012-egraegma-workshop-presentation-2-development-and-rationale-early-grade-math
RTI International. (2012). Snapshot of School Management Effectiveness: Frequently asked questions (FAQs). Prepared for USAID under the EdData II project, Task Order No. EHC-E-01-04-00004-00 (RTI Task 1). Research Triangle Park, NC: RTI. https://globalreadingnetwork.net/eddata/ssme-faqs
RTI International. (2014a). Early Grade Mathematics Assessment (EGMA) toolkit. Research Triangle Park, NC: RTI. https://globalreadingnetwork.net/eddata/egma-toolkit
RTI International. (2014b). USAID/Kenya Primary Math and Reading (PRIMR) Initiative: Final report. Prepared for USAID under the EdData II project, Task Order No. AID-623-M-11-00001. Research Triangle Park, NC: RTI International. http://pdf.usaid.gov/pdf_docs/PA00K282.pdf
RTI International. 2016. Early Grade Reading Assessment (EGRA) toolkit, second edition. Washington, DC: United States Agency for International Development. Prepared for USAID under the EdData II project, Task Order No. AID-OAA-BC-12-00003 (RTI Task 20, Activity 9). Research Triangle Park, NC: RTI International. https://globalreadingnetwork.net/resources/early-grade-reading-assessment-egra-toolkit-second-edition
Snow, C. E., & the RAND Reading Study Group. (2002). Reading for understanding: Toward an R&D program in reading comprehension. Research report prepared for the Office of Educational Research and Improvement (OERI), U.S. Department of Education. Santa Monica, CA: RAND Corporation. www.rand.org/content/dam/rand/pubs/monograph_reports/2005/MR1465.pdf
USAID. (2011). Education: Opportunity through learning. USAID education strategy 2011–2015. Washington, DC: USAID. http://pdf.usaid.gov/pdf_docs/Pdacq946.pdf

EdData II Final Report 33
Annex A: Summary of EdData II Task Orders
Category Period of
performance Primary purpose of task order RTI Task 1, Core Task Order Sep. 30, 2004 –
Aug. 31, 2014 • Core management (e.g., financials, reporting) • Dissemination • Continued refinement of methodologies and tools • Collaboration with Missions to identify data needs and
design task orders
RTI Task 2, Small Research and Assessment-Related Projects (in conjunction with Mission-funded RTI Task 4; see below)
Sep. 30, 2005 – Mar. 31, 2010
Small research and assessment-related projects in Kenya: • Reading activity • Course modules • Pilot of the Early Grade Mathematics Assessment
(EGMA)
RTI Task 3, Early Grade Reading Assessment
Sep. 1, 2006 – Jun. 30, 2010
Supported the Early Grade Reading Assessment (EGRA): • Spanish and French versions of EGRA Toolkit • Concurrent-validity research • EGRA workshop in DC • EGRA regional meeting in Peru • EGRA social marketing campaign • Adaptation and application of pilot online education
survey course
RTI Task 4, Kenya Education Management Capacity Assessment (KEMACA)
Mar. 14, 2007 – Jul. 31, 2009
Capacity building in Kenya
RTI Task 5, Nicaragua EGRA Oct. 1, 2007 – Dec. 31, 2009
Conducted EGRA and provided teacher training in Nicaragua
RTI Task 6, EGRA Plus: Liberia Oct. 7, 2008 – Jan. 31, 2011
2½-year randomized controlled trial of intervention program to improve reading in primary grades, including EGRA surveys at baseline, midpoint, and post-intervention
RTI Task 7, Learning Outcomes Research and Assessment-Related Projects
Oct. 1, 2009 – Oct. 11, 2013
Learning outcomes research and assessment-related projects in countries within the US President’s Initiative to Expand Education: • EGRA in Ethiopia and Yemen • Combined EGRA, EGMA, and SSME in Dominican
Republic, Kenya, Morocco, Rwanda, Zambia • Development and Pilot of the Lot Quality Assurance
Sampling (LQAS) approach for early grade reading • Dissemination workshop in Mali • Ghana – Review of existing assessments, evaluation of
National Literacy Acceleration Program, small-scale EGRA, and policy dialogue workshop
• Honduras – Development of videos and training materials for teachers, parents, and policy makers on the importance of reading and on ways to improve and track performance in the early grades, using oral assessment components from the EGRA toolkit

34 EdData II Final Report
Category Period of
performance Primary purpose of task order (An RTI Task 20 study assessed utilization of EGRA and EGMA results in 10 of these countries 1–3 years afterward)
RTI Task 8, Nigeria Education Data Survey (NEDS)
Aug. 15, 2009 – Jun. 30, 2011
Survey of 27,000 households nationwide to collect education information and data; linked to Demographic and Health Surveys
RTI Task 9, Early Grade Reading Assessment for Ethiopia
Apr. 26, 2010 – Dec. 31, 2010
Expansion of RTI Task 7 Ethiopia activities into additional regions and languages
RTI Task 10, Morocco Youth Labor Force Assessment
Jun. 16, 2010 - Sept. 30, 2010
Identified barriers to formal-sector employment opportunities for marginalized, out-of-school youth
RTI Task 11, Data Capacity Assessment and Gap Closure Assistance
Sept. 30, 2010 – Sept. 29, 2011
Piloted the evaluation of education data systems and capacity in Ghana, Mozambique, and Philippines
RTI Task 12, Ghana Technical Assistance
Apr. 13, 2011 – Mar. 2, 2012
Technical assistance for the administration of the National Education Assessment in Ghana
RTI Task 13, Primary Math and Reading (PRIMR) Initiative, Kenya
Aug. 15, 2011 – Aug. 14, 2014
Three-year program that used innovative, data-based instructional improvement methods in reading and math to improve outcomes of students in urban areas
RTI Task 14, Iraq Education Surveys – MAHARAT
Sep. 29, 2011 – Dec. 1, 2012
Assessed school management practices and student outcomes (EGRA, EGMA, SSME); assessed Teacher Training Institutes; conducted Education Management Capacity Assessment
RTI Task 15, Data for Education Programming in Asia and Middle East (DEP-AME)
Sep. 29, 2011 – Nov. 30, 2016
Provided technical assistance and training services for USAID Missions in the two regions, supportive of USAID’s new Education Strategy and Evaluation Policy
RTI Task 16, National Early Grade Literacy and Numeracy Survey in Jordan
Dec. 1, 2011 – Sep. 30, 2014
• Evaluated the quality of primary schools in Jordan • Developed a school-based pilot intervention program
designed to improve the reading and math skills found lacking during the evaluation
RTI Task 17, Strengthening Information for Education, Policy, Planning and Management in the Philippines (PhilED Data)
Feb. 22, 2012 – Dec. 31, 2013
• Assisted in analyzing the validity and reliability of national standardized examinations and assessment tools
• Conducted a national, sample-based EGRA • Assisted in developing reporting formats for national
assessment results • Advised on the development of new national benchmark
assessments in line with curricular and structural reforms
RTI Task 18, USAID/Haiti Tout Timoun Ap Li (ToTAL) Applied Research Activity
Aug. 2, 2012 – Dec. 5, 2014
• Evaluated the quality of primary schools in Haiti • Developed new teaching and learning materials in
Haitian Creole and French • Assisted education ministry in developing and testing an
instructional model to improve reading skills of children in grades 1–3 in the Northern, St. Marc, and Port-au-Prince development corridors
RTI Task 19, Data for Education Research and Programming (DERP) in Africa
Oct. 1, 2012 – Nov. 30, 2016
Provided broad regional technical support for data collection and analysis to aid in realignment of Mission programming with USAID Education Strategy
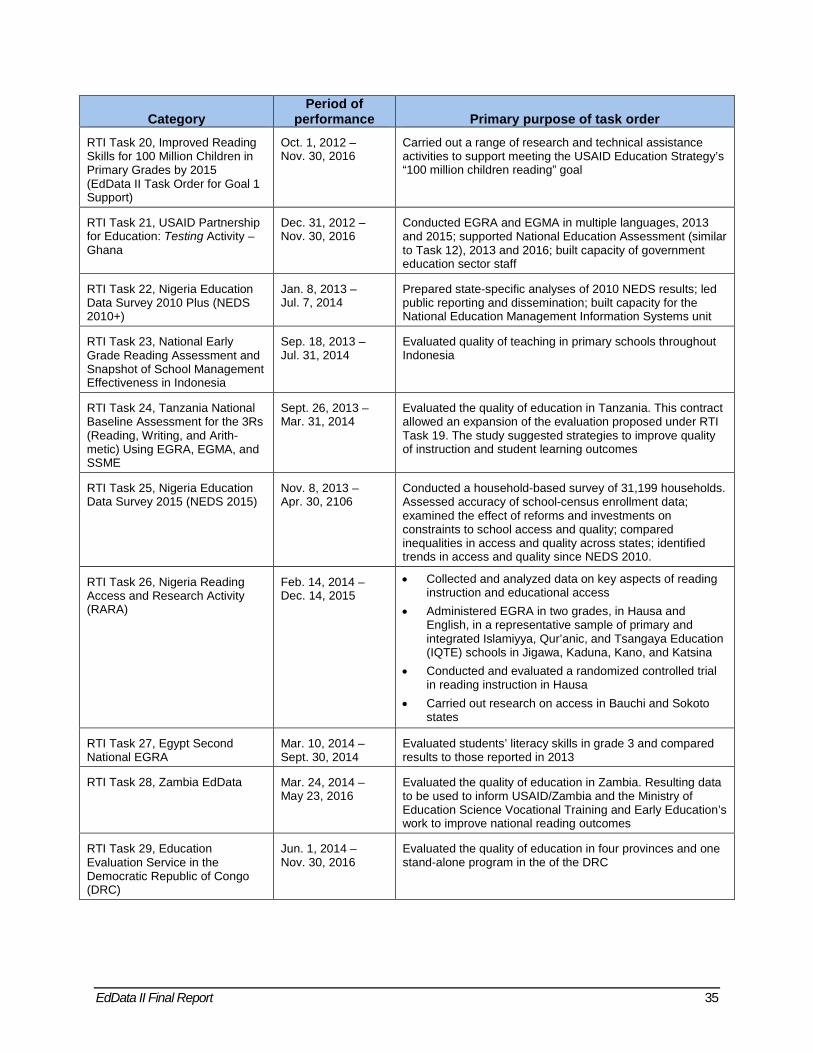
EdData II Final Report 35
Category Period of
performance Primary purpose of task order RTI Task 20, Improved Reading Skills for 100 Million Children in Primary Grades by 2015 (EdData II Task Order for Goal 1 Support)
Oct. 1, 2012 – Nov. 30, 2016
Carried out a range of research and technical assistance activities to support meeting the USAID Education Strategy’s “100 million children reading” goal
RTI Task 21, USAID Partnership for Education: Testing Activity – Ghana
Dec. 31, 2012 – Nov. 30, 2016
Conducted EGRA and EGMA in multiple languages, 2013 and 2015; supported National Education Assessment (similar to Task 12), 2013 and 2016; built capacity of government education sector staff
RTI Task 22, Nigeria Education Data Survey 2010 Plus (NEDS 2010+)
Jan. 8, 2013 – Jul. 7, 2014
Prepared state-specific analyses of 2010 NEDS results; led public reporting and dissemination; built capacity for the National Education Management Information Systems unit
RTI Task 23, National Early Grade Reading Assessment and Snapshot of School Management Effectiveness in Indonesia
Sep. 18, 2013 – Jul. 31, 2014
Evaluated quality of teaching in primary schools throughout Indonesia
RTI Task 24, Tanzania National Baseline Assessment for the 3Rs (Reading, Writing, and Arith-metic) Using EGRA, EGMA, and SSME
Sept. 26, 2013 – Mar. 31, 2014
Evaluated the quality of education in Tanzania. This contract allowed an expansion of the evaluation proposed under RTI Task 19. The study suggested strategies to improve quality of instruction and student learning outcomes
RTI Task 25, Nigeria Education Data Survey 2015 (NEDS 2015)
Nov. 8, 2013 – Apr. 30, 2106
Conducted a household-based survey of 31,199 households. Assessed accuracy of school-census enrollment data; examined the effect of reforms and investments on constraints to school access and quality; compared inequalities in access and quality across states; identified trends in access and quality since NEDS 2010.
RTI Task 26, Nigeria Reading Access and Research Activity (RARA)
Feb. 14, 2014 – Dec. 14, 2015
• Collected and analyzed data on key aspects of reading instruction and educational access
• Administered EGRA in two grades, in Hausa and English, in a representative sample of primary and integrated Islamiyya, Qur’anic, and Tsangaya Education (IQTE) schools in Jigawa, Kaduna, Kano, and Katsina
• Conducted and evaluated a randomized controlled trial in reading instruction in Hausa
• Carried out research on access in Bauchi and Sokoto states
RTI Task 27, Egypt Second National EGRA
Mar. 10, 2014 – Sept. 30, 2014
Evaluated students’ literacy skills in grade 3 and compared results to those reported in 2013
RTI Task 28, Zambia EdData Mar. 24, 2014 – May 23, 2016
Evaluated the quality of education in Zambia. Resulting data to be used to inform USAID/Zambia and the Ministry of Education Science Vocational Training and Early Education’s work to improve national reading outcomes
RTI Task 29, Education Evaluation Service in the Democratic Republic of Congo (DRC)
Jun. 1, 2014 – Nov. 30, 2016
Evaluated the quality of education in four provinces and one stand-alone program in the of the DRC
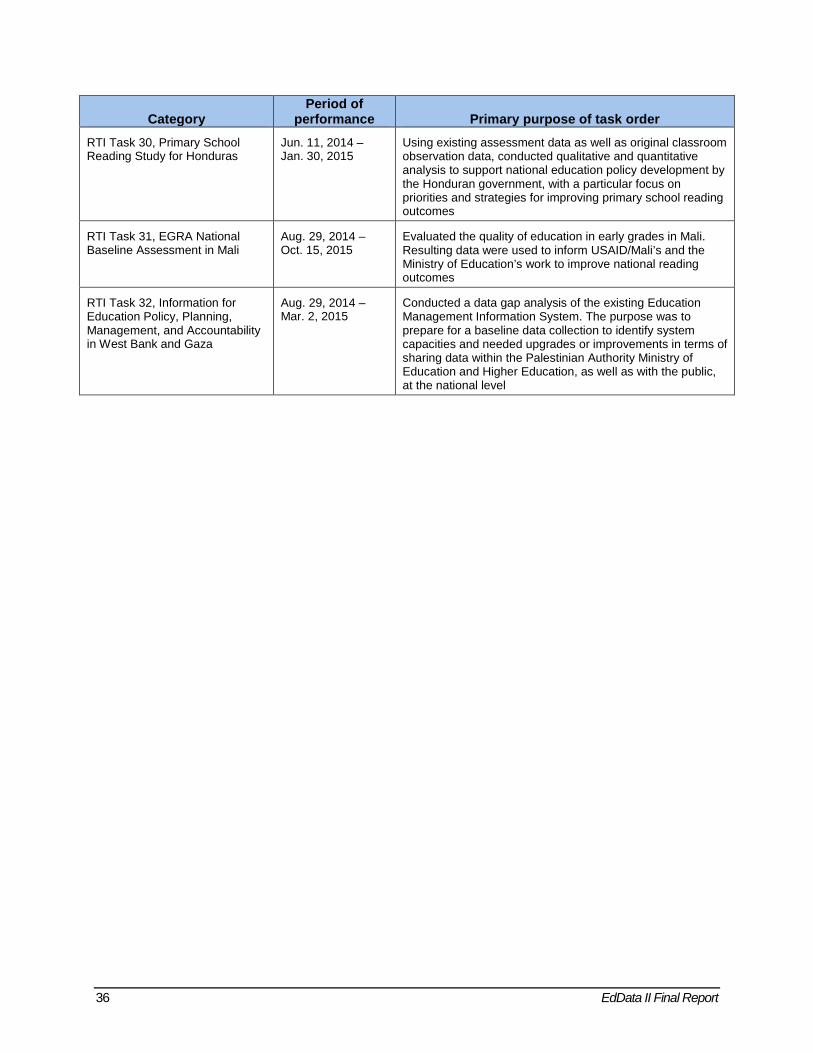
36 EdData II Final Report
Category Period of
performance Primary purpose of task order RTI Task 30, Primary School Reading Study for Honduras
Jun. 11, 2014 – Jan. 30, 2015
Using existing assessment data as well as original classroom observation data, conducted qualitative and quantitative analysis to support national education policy development by the Honduran government, with a particular focus on priorities and strategies for improving primary school reading outcomes
RTI Task 31, EGRA National Baseline Assessment in Mali
Aug. 29, 2014 – Oct. 15, 2015
Evaluated the quality of education in early grades in Mali. Resulting data were used to inform USAID/Mali’s and the Ministry of Education’s work to improve national reading outcomes
RTI Task 32, Information for Education Policy, Planning, Management, and Accountability in West Bank and Gaza
Aug. 29, 2014 – Mar. 2, 2015
Conducted a data gap analysis of the existing Education Management Information System. The purpose was to prepare for a baseline data collection to identify system capacities and needed upgrades or improvements in terms of sharing data within the Palestinian Authority Ministry of Education and Higher Education, as well as with the public, at the national level

EdData II Final Report 37
Annex B: List of RTI Peer-Reviewed Publications Involving EdData II Research
RTI made a concerted effort to ensure that the findings from EdData II research would be available in the published literature, in addition to the hundreds of project-based resources now available through USAID’s Development Experience Clearinghouse or the Global Reading Network website. This annex contains a list of peer-reviewed publications with connections to EdData II research and task orders. As an indication of interest, a casual browser search for scholarly works about EGRA alone turned up over 700 peer-reviewed journal articles.
Crouch, L. A., & Gove, A. K. (2011). Leaps or one step at time: Skirting or helping engage the
debate? The case of reading. In J. N. Hawkins & W. J. Jacob (Eds.), Policy debates in comparative, international and development education (pp. 151–170). Basingstoke, United Kingdom: Palgrave Macmillan. http://link.springer.com/book/10.1057/9780230339361
Davidson, M. R., Korda, M., & White, O. (2011). Teachers’ use of EGRA for continuous assessment: The case of EGRA Plus: Liberia. In A. K. Gove & A. Wetterberg (Eds.), The Early Grade Reading Assessment: Applications and interventions to improve basic literacy (pp. 113–138). Research Triangle Park, NC: RTI Press. doi: 10.3768/rtipress.2011.bk.0007.1109
Dubeck, M. M., & Gove, A. K. (2015). The Early Grade Reading Assessment (EGRA): Its theoretical foundation, purpose, and limitations. International Journal of Educational Development, 40, 315–322. doi: 10.1016/j.ijedudev.2014.11.004
Dubeck, M. M., Gove, A. K., & Alexander, K. D. (2016). School based assessments: What and how to assess reading. In Understanding What Works in Oral Reading Assessments. (pp. 41–57). Montreal, Canada: UNESCO Institute for Statistics (UIS). doi: 10.15220/978-92-9189-196-2-en
Dubeck, M. M., Jukes, M. C. H., Brooker, S. J., Drake, T. L., & Inyega, H. N. (2015). Designing a program of teacher professional development to support beginning reading acquisition in coastal Kenya. International Journal of Educational Development, 41, 88–96. doi: 10.1016/j.ijedudev.2014.11.022
Dubeck, M. M., Jukes, M. C., & Okello, G. (2012). Early primary literacy instruction in Kenya. Comparative Education Review, 56(1), 48–68. doi: 10.1086/660693
Dubeck, M. M., & Kochetkova, E. G. (2016). Assessment in schools. In UNESCO Institute for Statistics (Ed.), Understanding what works in oral reading assessments (pp. 147–156). Montreal, Canada: UNESCO Institute for Statistics (UIS). doi: 10.15220/978-92-9189-1
Gove, A. K., & Dubeck, M. M. (in press). Assess reading early to inform instruction, improve quality and realize possibilities. In 2016 Annual Review for Comparative and International Education. Bingley, United Kingdom: Emerald Group.

38 EdData II Final Report
Gove, A. K., Habib, S. S., Piper, B. L., & Ralaingita, W. D. (2013). Classroom-up policy change: Early reading and math assessments at work. Research in Comparative and International Education, 8(3), 373–386. doi: 10.2304/rcie.2013.8.3.373
Gove, A. K., & Wetterberg, A. (Eds.). (2011). The Early Grade Reading Assessment: Applications and interventions to improve basic literacy. Research Triangle Park, NC: RTI Press. doi: 10.3768/rtipress.2011.bk.0007.1109. Chapters:
Davidson, M. R., Korda, M., & White, O. (2011). Teachers’ use of EGRA for continuous assessment: The case of EGRA Plus: Liberia (pp. 113–138).
Gove, A. K., & Wetterberg, A. (2011). The Early Grade Reading Assessment: An introduction (pp. 1–38).
Mejia, J. M., & Pouezevara, S. R. (2011). Using EGRA as a national reading diagnostic: Nicaragua and Senegal (pp. 39–82).
Piper, B. L., & Miksic, E. V. (2011). Mother tongue and reading: Using early grade reading assessments to investigate language-of-instruction policy in East Africa (pp. 139–182).
Pouezevara, S. R., & Strigel, C. I. (2011). Using information and communication technologies to support EGRA (pp. 183–226).
Ralaingita, W. D., & Wetterberg, A. (2011). Gauging program effectiveness with EGRA: Impact evaluations in South Africa and Mali (pp. 83–112).
Jiménez, J. E., Gove, A. K., Crouch, L., & Rodríguez, C. (2014). Internal structure and standardized scores of the Spanish adaptation of the EGRA (Early Grade Reading Assessment) for early reading assessment. Psicothema, 26(4), 531–537. doi: 10.7334/psicothema2014.93
Jukes, M. C., Turner, E. L., Dubeck, M. M., Katherine, H. E., Hellen, I. N., Wolf, S., Simmons Zuilkowski, S., & Brooker, S. J. (2016). Improving literacy instruction in Kenya through teacher professional development and text messages support: A cluster randomized trial. Journal of Research on Educational Effectiveness. doi: 10.1080/19345747.2016.1221487
Piper, B. L., Jepkemei, E., & Kibukho, K. (2015). Pro-poor PRIMR: Improving early literacy skills for children from low-income families in Kenya. Africa Education Review, 12(1), 67–85. doi: 10.1080/18146627.2015.1036566
Piper, B. L., Jepkemei, E., Kwayumba, D., & Kibukho, K. (2015). Kenya’s ICT policy in practice: The effectiveness of tablets and e-readers in improving student outcomes. Forum for International Research in Education, 2(1), 3–18. http://preserve.lehigh.edu/fire/vol2/iss1/2
Piper, B. L., Ralaingita, W. D., Akach, L., & King, S. J. (2016). Improving procedural and conceptual mathematics outcomes: Evidence from a randomized controlled trial in Kenya. Journal of Development Effectiveness, 8(3), 404–422. doi: 10.1080/19439342.2016.1149502
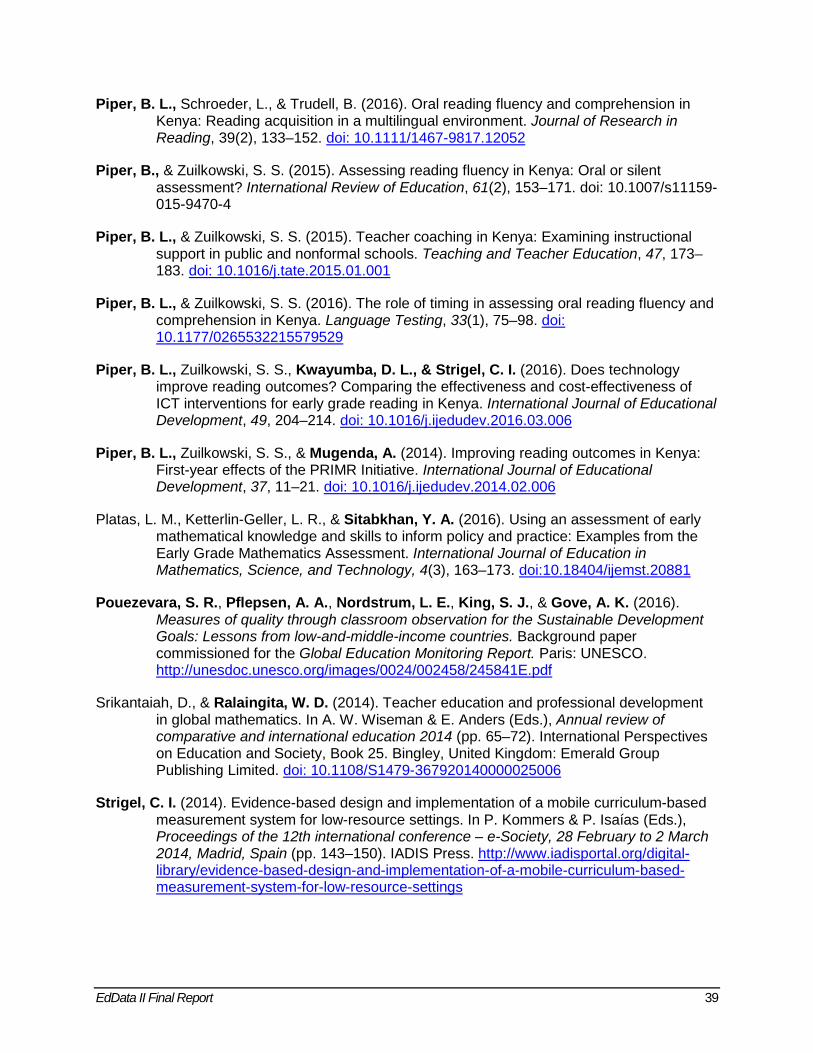
EdData II Final Report 39
Piper, B. L., Schroeder, L., & Trudell, B. (2016). Oral reading fluency and comprehension in Kenya: Reading acquisition in a multilingual environment. Journal of Research in Reading, 39(2), 133–152. doi: 10.1111/1467-9817.12052
Piper, B., & Zuilkowski, S. S. (2015). Assessing reading fluency in Kenya: Oral or silent assessment? International Review of Education, 61(2), 153–171. doi: 10.1007/s11159-015-9470-4
Piper, B. L., & Zuilkowski, S. S. (2015). Teacher coaching in Kenya: Examining instructional support in public and nonformal schools. Teaching and Teacher Education, 47, 173–183. doi: 10.1016/j.tate.2015.01.001
Piper, B. L., & Zuilkowski, S. S. (2016). The role of timing in assessing oral reading fluency and comprehension in Kenya. Language Testing, 33(1), 75–98. doi: 10.1177/0265532215579529
Piper, B. L., Zuilkowski, S. S., Kwayumba, D. L., & Strigel, C. I. (2016). Does technology improve reading outcomes? Comparing the effectiveness and cost-effectiveness of ICT interventions for early grade reading in Kenya. International Journal of Educational Development, 49, 204–214. doi: 10.1016/j.ijedudev.2016.03.006
Piper, B. L., Zuilkowski, S. S., & Mugenda, A. (2014). Improving reading outcomes in Kenya: First-year effects of the PRIMR Initiative. International Journal of Educational Development, 37, 11–21. doi: 10.1016/j.ijedudev.2014.02.006
Platas, L. M., Ketterlin-Geller, L. R., & Sitabkhan, Y. A. (2016). Using an assessment of early mathematical knowledge and skills to inform policy and practice: Examples from the Early Grade Mathematics Assessment. International Journal of Education in Mathematics, Science, and Technology, 4(3), 163–173. doi:10.18404/ijemst.20881
Pouezevara, S. R., Pflepsen, A. A., Nordstrum, L. E., King, S. J., & Gove, A. K. (2016). Measures of quality through classroom observation for the Sustainable Development Goals: Lessons from low-and-middle-income countries. Background paper commissioned for the Global Education Monitoring Report. Paris: UNESCO. http://unesdoc.unesco.org/images/0024/002458/245841E.pdf
Srikantaiah, D., & Ralaingita, W. D. (2014). Teacher education and professional development in global mathematics. In A. W. Wiseman & E. Anders (Eds.), Annual review of comparative and international education 2014 (pp. 65–72). International Perspectives on Education and Society, Book 25. Bingley, United Kingdom: Emerald Group Publishing Limited. doi: 10.1108/S1479-367920140000025006
Strigel, C. I. (2014). Evidence-based design and implementation of a mobile curriculum-based measurement system for low-resource settings. In P. Kommers & P. Isaías (Eds.), Proceedings of the 12th international conference – e-Society, 28 February to 2 March 2014, Madrid, Spain (pp. 143–150). IADIS Press. http://www.iadisportal.org/digital-library/evidence-based-design-and-implementation-of-a-mobile-curriculum-based-measurement-system-for-low-resource-settings

40 EdData II Final Report
Strigel, C. I., Lang’o, M., Kwayumba, D., & Koko, S. (2015). Case study: Tangerine®: Class for data-informed instructional decision making. In H. Crompton & J. Traxler (Eds.), Mobile learning and mathematics: Foundations, design, and case studies (pp. 198–212). Florence, KY: Routledge.
Wagner, D. A., Lockheed, M., Mullis, I., Martin, M. O., Kanjee, A., Dowd, A., & Gove, A. K. (2012). The debate on learning assessments in developing countries. Compare: A Journal of Comparative and International Education, 42(3), 509–545. doi: 10.1080/03057925.2012.670480
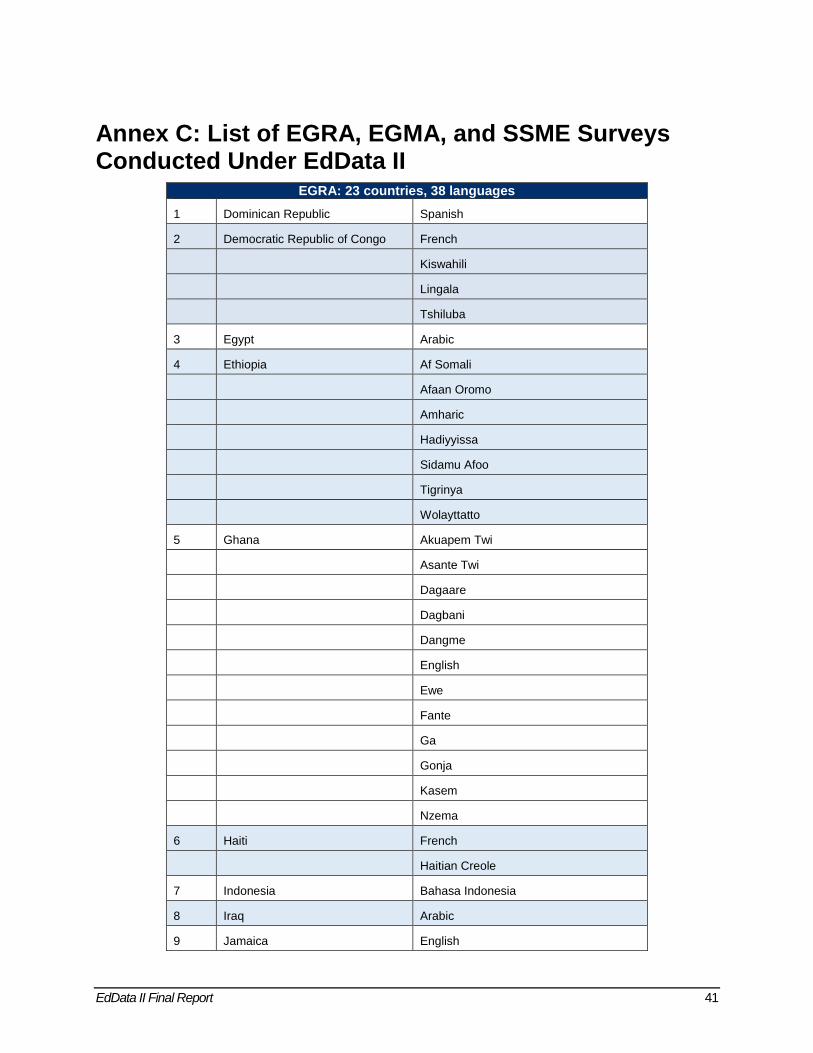
EdData II Final Report 41
Annex C: List of EGRA, EGMA, and SSME Surveys Conducted Under EdData II
EGRA: 23 countries, 38 languages 1 Dominican Republic Spanish
2 Democratic Republic of Congo French
Kiswahili
Lingala
Tshiluba
3 Egypt Arabic
4 Ethiopia Af Somali
Afaan Oromo
Amharic
Hadiyyissa
Sidamu Afoo
Tigrinya
Wolayttatto
5 Ghana Akuapem Twi
Asante Twi
Dagaare
Dagbani
Dangme
English
Ewe
Fante
Ga
Gonja
Kasem
Nzema
6 Haiti French
Haitian Creole
7 Indonesia Bahasa Indonesia
8 Iraq Arabic
9 Jamaica English
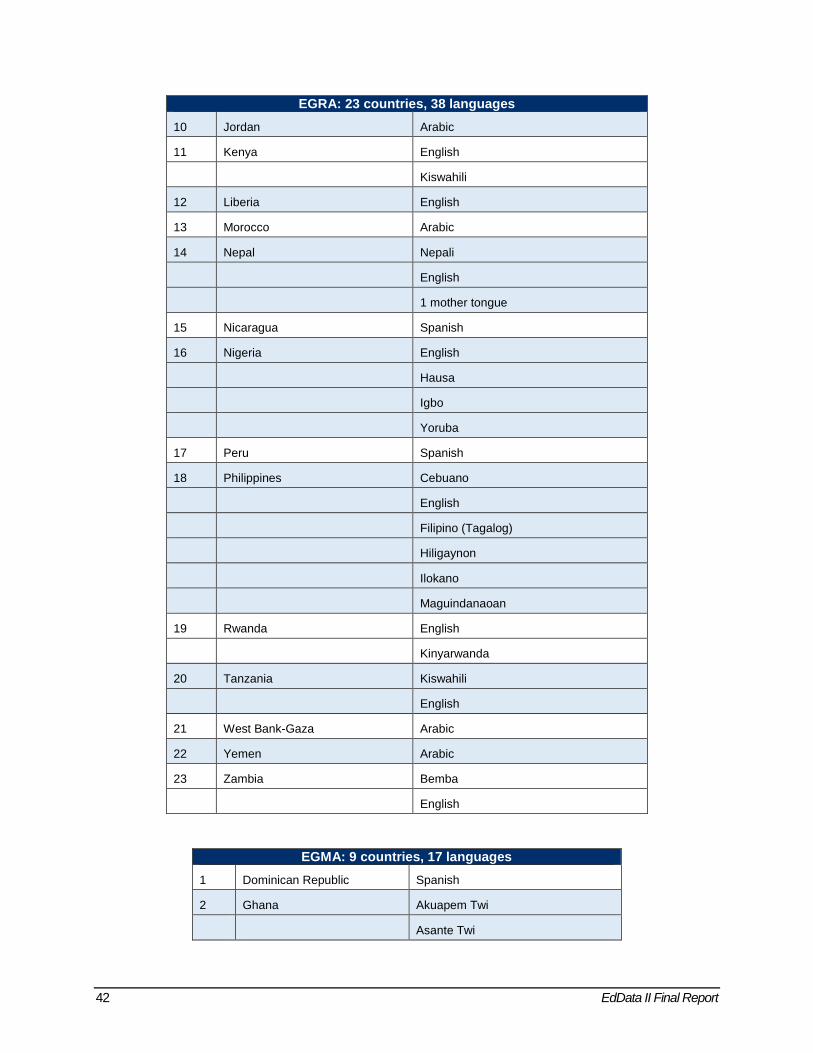
42 EdData II Final Report
EGRA: 23 countries, 38 languages 10 Jordan Arabic
11 Kenya English
Kiswahili
12 Liberia English
13 Morocco Arabic
14 Nepal Nepali
English
1 mother tongue
15 Nicaragua Spanish
16 Nigeria English
Hausa
Igbo
Yoruba
17 Peru Spanish
18 Philippines Cebuano
English
Filipino (Tagalog)
Hiligaynon
Ilokano
Maguindanaoan
19 Rwanda English
Kinyarwanda
20 Tanzania Kiswahili
English
21 West Bank-Gaza Arabic
22 Yemen Arabic
23 Zambia Bemba
English
EGMA: 9 countries, 17 languages 1 Dominican Republic Spanish
2 Ghana Akuapem Twi
Asante Twi
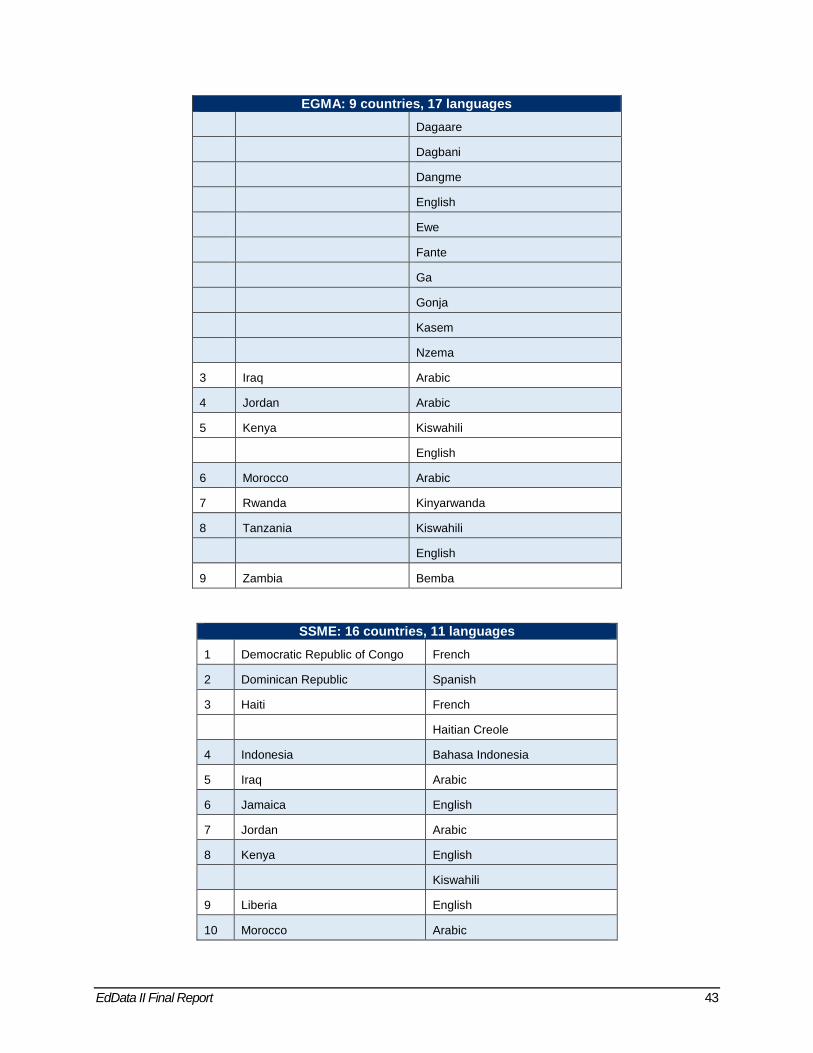
EdData II Final Report 43
EGMA: 9 countries, 17 languages Dagaare
Dagbani
Dangme
English
Ewe
Fante
Ga
Gonja
Kasem
Nzema
3 Iraq Arabic
4 Jordan Arabic
5 Kenya Kiswahili
English
6 Morocco Arabic
7 Rwanda Kinyarwanda
8 Tanzania Kiswahili
English
9 Zambia Bemba
SSME: 16 countries, 11 languages 1 Democratic Republic of Congo French
2 Dominican Republic Spanish
3 Haiti French
Haitian Creole
4 Indonesia Bahasa Indonesia
5 Iraq Arabic
6 Jamaica English
7 Jordan Arabic
8 Kenya English
Kiswahili
9 Liberia English
10 Morocco Arabic
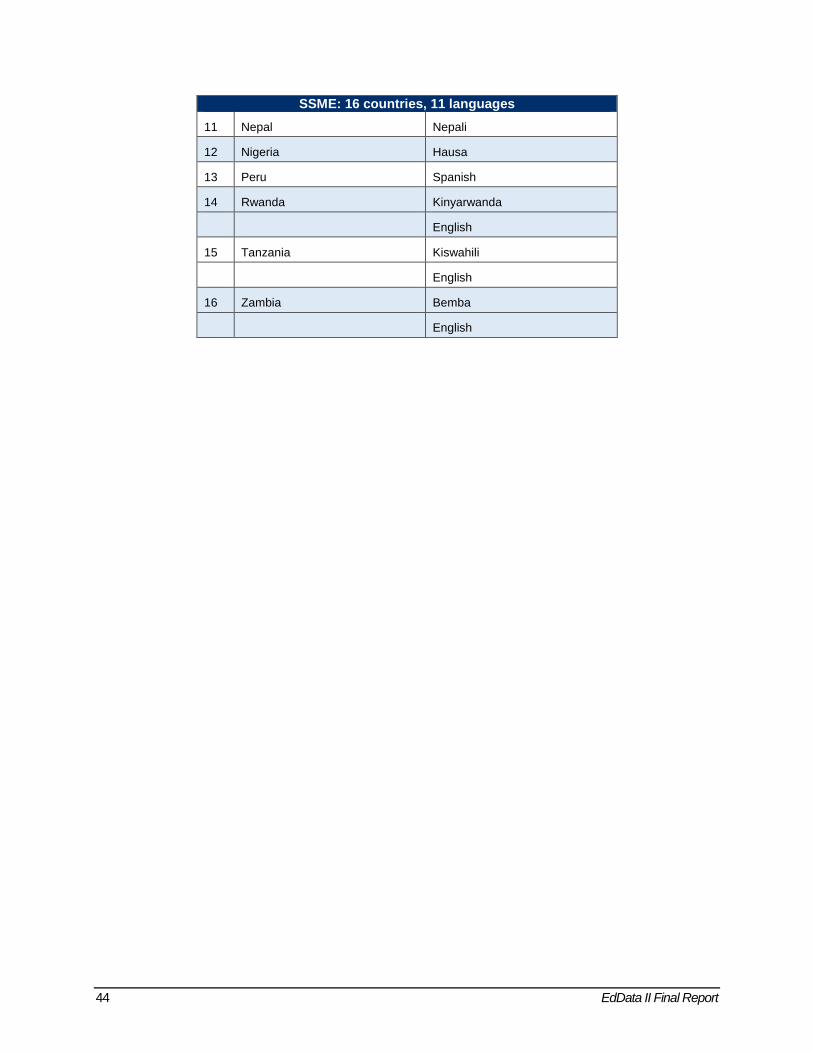
44 EdData II Final Report
SSME: 16 countries, 11 languages 11 Nepal Nepali
12 Nigeria Hausa
13 Peru Spanish
14 Rwanda Kinyarwanda
English
15 Tanzania Kiswahili
English
16 Zambia Bemba
English
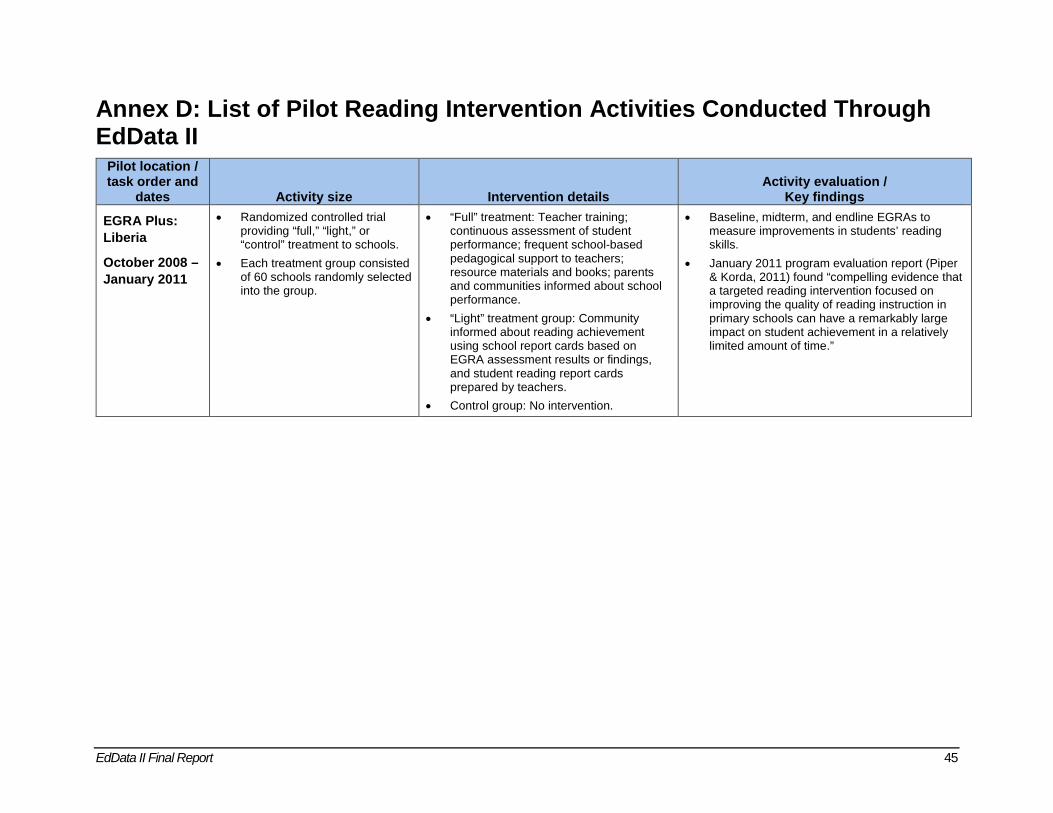
EdData II Final Report 45
Annex D: List of Pilot Reading Intervention Activities Conducted Through EdData II
Pilot location / task order and
dates Activity size Intervention details Activity evaluation /
Key findings
EGRA Plus: Liberia
October 2008 –January 2011
• Randomized controlled trial providing “full,” “light,” or “control” treatment to schools.
• Each treatment group consisted of 60 schools randomly selected into the group.
• “Full” treatment: Teacher training; continuous assessment of student performance; frequent school-based pedagogical support to teachers; resource materials and books; parents and communities informed about school performance.
• “Light” treatment group: Community informed about reading achievement using school report cards based on EGRA assessment results or findings, and student reading report cards prepared by teachers.
• Control group: No intervention.
• Baseline, midterm, and endline EGRAs to measure improvements in students’ reading skills.
• January 2011 program evaluation report (Piper & Korda, 2011) found “compelling evidence that a targeted reading intervention focused on improving the quality of reading instruction in primary schools can have a remarkably large impact on student achievement in a relatively limited amount of time.”
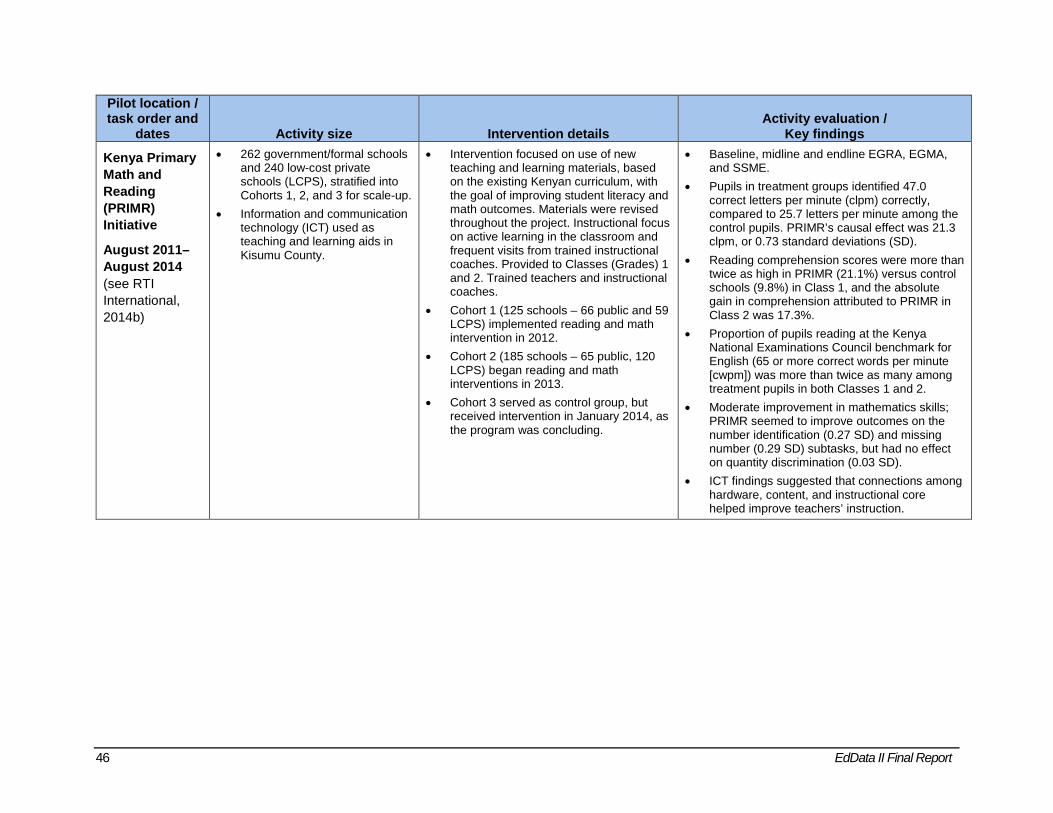
46 EdData II Final Report
Pilot location / task order and
dates Activity size Intervention details Activity evaluation /
Key findings
Kenya Primary Math and Reading (PRIMR) Initiative
August 2011–August 2014 (see RTI International, 2014b)
• 262 government/formal schools and 240 low-cost private schools (LCPS), stratified into Cohorts 1, 2, and 3 for scale-up.
• Information and communication technology (ICT) used as teaching and learning aids in Kisumu County.
• Intervention focused on use of new teaching and learning materials, based on the existing Kenyan curriculum, with the goal of improving student literacy and math outcomes. Materials were revised throughout the project. Instructional focus on active learning in the classroom and frequent visits from trained instructional coaches. Provided to Classes (Grades) 1 and 2. Trained teachers and instructional coaches.
• Cohort 1 (125 schools – 66 public and 59 LCPS) implemented reading and math intervention in 2012.
• Cohort 2 (185 schools – 65 public, 120 LCPS) began reading and math interventions in 2013.
• Cohort 3 served as control group, but received intervention in January 2014, as the program was concluding.
• Baseline, midline and endline EGRA, EGMA, and SSME.
• Pupils in treatment groups identified 47.0 correct letters per minute (clpm) correctly, compared to 25.7 letters per minute among the control pupils. PRIMR’s causal effect was 21.3 clpm, or 0.73 standard deviations (SD).
• Reading comprehension scores were more than twice as high in PRIMR (21.1%) versus control schools (9.8%) in Class 1, and the absolute gain in comprehension attributed to PRIMR in Class 2 was 17.3%.
• Proportion of pupils reading at the Kenya National Examinations Council benchmark for English (65 or more correct words per minute [cwpm]) was more than twice as many among treatment pupils in both Classes 1 and 2.
• Moderate improvement in mathematics skills; PRIMR seemed to improve outcomes on the number identification (0.27 SD) and missing number (0.29 SD) subtasks, but had no effect on quantity discrimination (0.03 SD).
• ICT findings suggested that connections among hardware, content, and instructional core helped improve teachers’ instruction.
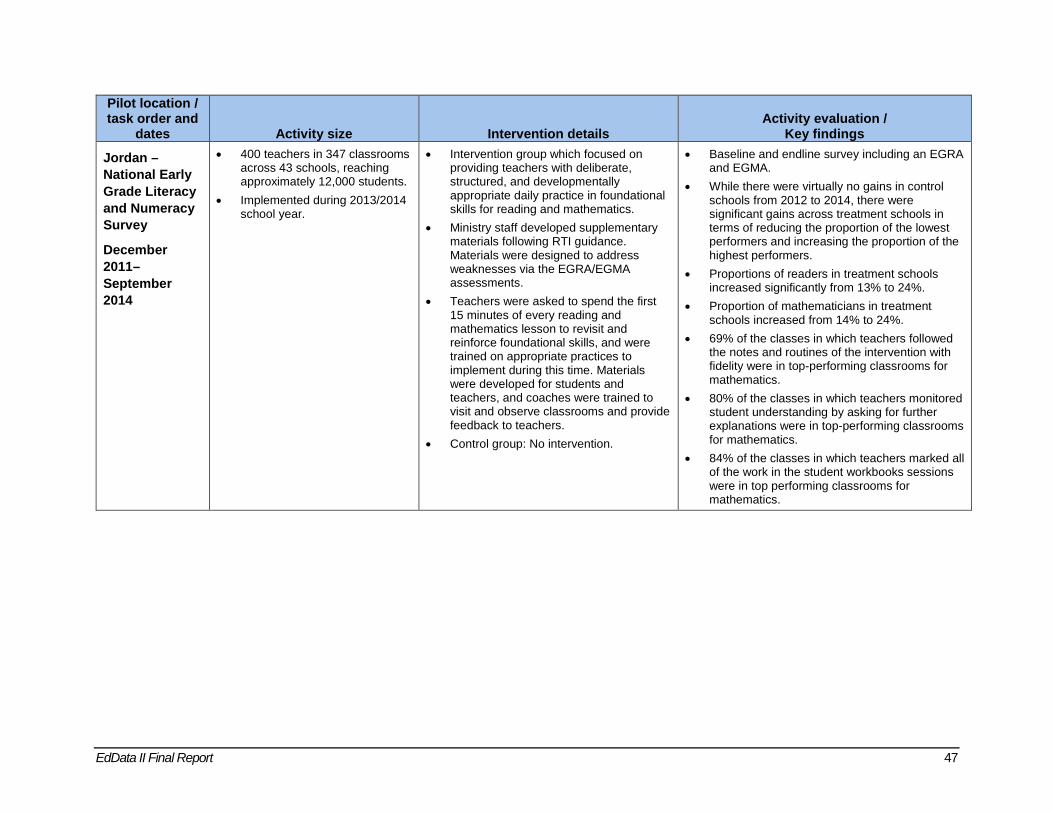
EdData II Final Report 47
Pilot location / task order and
dates Activity size Intervention details Activity evaluation /
Key findings
Jordan – National Early Grade Literacy and Numeracy Survey
December 2011–September 2014
• 400 teachers in 347 classrooms across 43 schools, reaching approximately 12,000 students.
• Implemented during 2013/2014 school year.
• Intervention group which focused on providing teachers with deliberate, structured, and developmentally appropriate daily practice in foundational skills for reading and mathematics.
• Ministry staff developed supplementary materials following RTI guidance. Materials were designed to address weaknesses via the EGRA/EGMA assessments.
• Teachers were asked to spend the first 15 minutes of every reading and mathematics lesson to revisit and reinforce foundational skills, and were trained on appropriate practices to implement during this time. Materials were developed for students and teachers, and coaches were trained to visit and observe classrooms and provide feedback to teachers.
• Control group: No intervention.
• Baseline and endline survey including an EGRA and EGMA.
• While there were virtually no gains in control schools from 2012 to 2014, there were significant gains across treatment schools in terms of reducing the proportion of the lowest performers and increasing the proportion of the highest performers.
• Proportions of readers in treatment schools increased significantly from 13% to 24%.
• Proportion of mathematicians in treatment schools increased from 14% to 24%.
• 69% of the classes in which teachers followed the notes and routines of the intervention with fidelity were in top-performing classrooms for mathematics.
• 80% of the classes in which teachers monitored student understanding by asking for further explanations were in top-performing classrooms for mathematics.
• 84% of the classes in which teachers marked all of the work in the student workbooks sessions were in top performing classrooms for mathematics.

48 EdData II Final Report
Pilot location / task order and
dates Activity size Intervention details Activity evaluation /
Key findings
Haiti Tout Timoun Ap Li (ToTAL)
August 2012 – December 2014
• Two treatment groups and a control group.
• Three regions—Cap-Haitien Corridor and the Saint-Marc Corridor—in the first year, and expanding to include the Port-Au-Prince Corridor in the second year.
• 329 schools received Treatment 1, and 135 received Treatment 2.
• Treatment 1: Reading program – Development and distribution of Grade 1 and 2 French and Creole materials to support literacy development; scripted teacher guides; supplementary materials; in-service training on the new teaching materials and teaching approach for teachers through a 10-day training before the school year began, and 3- to 4-day trainings three times during the school year; trained project coaches and instructors from the Ministère de l’Education Nationale et de Formation Professionnelle visited classrooms during the school year, providing real-time feedback on teaching and classroom management practices.
• Treatment 2: Reading program from Treatment 1 + community mobilization (general outreach and through in-school reading clubs, parent meetings, and literacy fairs).
• Control group: No intervention.
• Baseline, midline, and endline EGRA. • Foundational reading skills improved in both
Treatment 1 and Treatment 2. Performance on initial sound identification and letter sound knowledge improved, and students’ fluency in reading words and connected text by the endline in Grade 2 approached levels needed to progress to reading comprehension.
• Program helped to develop phonemic awareness and phonics skills among students, but this did not translate to higher-level word decoding and other skills necessary for full reading comprehension.
• Community mobilization activities did not impact the effects of the reading program.

EdData II Final Report 49
Pilot location / task order and
dates Activity size Intervention details Activity evaluation /
Key findings
Nigeria Reading and Access Research Activity (RARA)
February 2014 – November 2015
• 30 schools each in Bauchi and Sokoto states for the treatment group.
• 30 schools each in Bauchi and Sokoto states for the control group.
• Total of 120 schools.
Primary grade 2 reading intervention in Hausa, focused on: • Provision of developmentally appropriate
Hausa literacy instructional materials to teachers and pupils
• Professional development/training for teachers, head teachers, and School Support Officers (SSOs) on foundational reading skills
• SSOs trained to serve as reading coaches to teachers, to provide support through the school year
• Teacher peer learning and experience sharing through cluster meetings
• Outreach to school-based management committees and parents to inform them of the importance of reading and encourage support of literacy development in the home
Control group: No intervention.
• Reviewed teacher instructional practices and student reading outcomes prior to intervention and after completion of intervention activities.
• Increased amount of class time used for teaching literacy; presence of print-rich classrooms.
• Hausa teachers implementing the intervention increased their teaching of key reading instructional practices from an average of 4 out of 12 key practices to 10.5 out of 12, while use of key practices declined in control schools.
• Proportion of pupils scoring zero on the letter sound identification subtask decreased from more than 90% to 68%.
• Children who reported that Hausa was not the language most commonly spoken at home also had scores lower than those of their peers who reported speaking Hausa at home, though they also improved as a result of the intervention.
• Working with existing structures within state education systems that engaged in community mobilization activities facilitated easy access to communities and helped to encourage acceptance of messages for distribution to the communities.