ED 312 339 TITLE Report. INSTITUTION · Report. INSTITUTION Austin Independent School District,...
113
DOCUMENT RESUME ED 312 339 UD 027 073 TITLE Chapter 2 Forumula. 1988-c . nal Technical Report. INSTITUTION Austin Independent School District, Tex. Office of Research and Evaluation. SPONS AGENCY Department of Education, Washington, DC. REPORT NO ADSI-ORE-88.32 PUB DATE 30 Jun 89 NOTE 136p.; For 1987-88 report, see UD 027 072. PUB TYPE Reports - Evaluative/Feasibility (142) -- Tests /Evaluation Instruments (160) EDRS PRICE MF01/PC06 Plus Postage. DESCRIPTORS Elementary Secondary Education; *Extracurricular Activities; High Risk Students; *Peer Counseling; Program Descriptions; Program Evaluation; *Staff Development; Student Transportation; *Supplementary Education; Urban Areas; Urban Schools IDENTIFIERS *Austin Independent School District TX; *Education Consolidation Improvement Act Chapter 2; Texas (Austin) ABSTRACT Presented is the final technical report on the evaluation of the 1988-89 supplementary education programs of the Austin (Texas) Independent School Dist-ict funded under Chapter 2 of the Education Consolidation and Impro Cment Act. The following major findings are reported: (1) extracurricular transportationrcosts, which had been reduced by eliminating morning routes, were 49 percent lower per student in 1988-89 than in 1987-88; (2) half of the participants in a first-year Academic Decathlon contest rated the program to be effective, but Black and Hispanic participation was low compared to District ethnic percentages; (3) rates of corporal punishment and other disciplinary actions have continued to decline at the three schools where Project ASSIST has been implemented, but the percentage of Black students sent to the ASSIST room continues to be disproportionately high compared to ASSIST school etanic percentages; and (4) the Comprehensive Competencies Program Lab, a dropout prevention program at one high school, appears to have had a positive effect on participants' academic achievement for both fall and spring participants; however, effects on attendance and credits earned are mixed and the overall dropout rate was similar to what would be predicted for high risk students. Statistical data are included on 27 tables and graphs. Fourteen appendices making up the bulk of the document comprise a copy of a district-wide needs assessment questionnaire plus descriptions of the data-gathering procedures for the following programs: (1) Extracurricular Transportation Program; (2) Homework Pilot Program; (3) Outdoor Learning Program; (4) Peer Assistance and Leadership (PAL) Program; (5) Pre-Kindergarten Program; 6) Private Schools Program; (7) Project ASSIST; (8) Spanish Academy; (9) TEAMS Improvement Funds: (10) Wicat Computer Lab Instructional Aide; (11) Johnston Comprehensive Competencies Program Lab; (12) School-Community Liaison Programs; aid (13) Academic Decathalon Program. (FMW)
Transcript of ED 312 339 TITLE Report. INSTITUTION · Report. INSTITUTION Austin Independent School District,...

DOCUMENT RESUME
ED 312 339 UD 027 073
TITLE Chapter 2 Forumula. 1988-c . nal TechnicalReport.
INSTITUTION Austin Independent School District, Tex. Office ofResearch and Evaluation.
SPONS AGENCY Department of Education, Washington, DC.REPORT NO ADSI-ORE-88.32PUB DATE 30 Jun 89NOTE 136p.; For 1987-88 report, see UD 027 072.PUB TYPE Reports - Evaluative/Feasibility (142) --
Tests /Evaluation Instruments (160)
EDRS PRICE MF01/PC06 Plus Postage.DESCRIPTORS Elementary Secondary Education; *Extracurricular
Activities; High Risk Students; *Peer Counseling;Program Descriptions; Program Evaluation; *StaffDevelopment; Student Transportation; *SupplementaryEducation; Urban Areas; Urban Schools
IDENTIFIERS *Austin Independent School District TX; *EducationConsolidation Improvement Act Chapter 2; Texas(Austin)
ABSTRACT
Presented is the final technical report on theevaluation of the 1988-89 supplementary education programs of theAustin (Texas) Independent School Dist-ict funded under Chapter 2 ofthe Education Consolidation and Impro Cment Act. The following majorfindings are reported: (1) extracurricular transportationrcosts,which had been reduced by eliminating morning routes, were 49 percentlower per student in 1988-89 than in 1987-88; (2) half of theparticipants in a first-year Academic Decathlon contest rated theprogram to be effective, but Black and Hispanic participation was lowcompared to District ethnic percentages; (3) rates of corporalpunishment and other disciplinary actions have continued to declineat the three schools where Project ASSIST has been implemented, butthe percentage of Black students sent to the ASSIST room continues tobe disproportionately high compared to ASSIST school etanicpercentages; and (4) the Comprehensive Competencies Program Lab, adropout prevention program at one high school, appears to have had apositive effect on participants' academic achievement for both falland spring participants; however, effects on attendance and creditsearned are mixed and the overall dropout rate was similar to whatwould be predicted for high risk students. Statistical data areincluded on 27 tables and graphs. Fourteen appendices making up thebulk of the document comprise a copy of a district-wide needsassessment questionnaire plus descriptions of the data-gatheringprocedures for the following programs: (1) ExtracurricularTransportation Program; (2) Homework Pilot Program; (3) OutdoorLearning Program; (4) Peer Assistance and Leadership (PAL) Program;(5) Pre-Kindergarten Program; 6) Private Schools Program; (7) ProjectASSIST; (8) Spanish Academy; (9) TEAMS Improvement Funds: (10) WicatComputer Lab Instructional Aide; (11) Johnston ComprehensiveCompetencies Program Lab; (12) School-Community Liaison Programs; aid(13) Academic Decathalon Program. (FMW)
0
Researchand
EvaluationCHAPTER 2 FORMULA
1988-89 FINAL TECHNICAL REPORT
Publication Number 88.32
June 30, 1989
Austin Independent School DistrictAustin, Texas
U.S. DEPAFITMEN ) OF EDUCATIONOffice of Educational Research and Improvement
EDUCATIONAL RESOURCES INFORMATIONRESOURCES
CilThis document has been reproduced asreceived from the person or organizationoriginating it
O Minor changes have been made to improvewpfOduCtiOn quality
Points of view°, opinions statedin this docu-ment do not necessarily repreznt officialOERI position or policy
'OW:V, n.NWIffi
1988-89
"PERMISSION TO REPRODUCE THISMATERIAL HAS BEEN GRANTED BY
F Halle
65tAs4.4
Sclit6 0151-Y1.C-F
TO THE EDUCATIONAL RESOURCESINFORMATION CENTER (ERIC)."
2 BEST COPY AVAILABLE
Li
OFFICE OF RESEARCH AND EVALUATIONDEPARTMENT OF MANAGEMENT INFORMATIONAUSTIN INDEPENDENT SCHOOL DISTRICT
CHAPTER 2 FORMULA
1988-89 FINAL `TECHNICAL REPORT
Publication Number 88.32
June 30, 1989
Evaluation Associate:Darrick Eugene
Evaluator:Nancy Baenen
Executive Director:Glynn Ligon, Ph.D.
ACKNOWLEDGEMENT AND DISCLAIMER
The project presented or reported herein was performedpursuant to a grant from the Department of Education.However, the opinions expressed herein do notnecessarily reflect the position or policy of theDepartment, and no official endorsement by theDepartment should be inferred.
0

88.32
TABLE OF CONTENTS
1988-89 Final Report iii
Appendix A Peer Assistance and Leadership (PAL) A-1
Appendix B Project ASSIST B-1
Appendix C Extracurricular Transportation C-1
Appendix D Homework Pilot D-1
Appendix E Johnston Comprehensive CompetenciesProgram Lab E-1
Appendix F Spanish Academy F-1
Appendix G TEAMS Improvement Funds G-1
Appendix H Private Schools H-1
Appendix I Outdoor Learning Program I-1
Appendix J Wicat Computer Lab Instructional AIDE J-1
Appendix K School-Community Liaison Program K-1
Appendix L Prekindergarten Units L-1
Appendix M Academic Decathlon M-1
Appendix N Needs Assessment N-1
4

Xtuaprw
iisiunds it%'uoslon iC
nimuruw
olootiosgrow
s' PP3amd"
namaam
ingx-aict
114
Cit
C)10
1414
Academ
ic Decathalon
ASSIST
Extracurrricular T
ransportationit%
Hom
ework
Pilot

8831
CHAPTER 2 FORMULA:1988-89 EVALUATIONEXECUTIVE SUMMARY
AUTHORS: Darrick Eugene and Nancy Baenen
Iprogram ResOiOtion..
, -
1.7*te4i**,0t54171*:'ft*iii40.0iiP**4100r.school ditiii4fnlids*.threearea::° basic skill Cie-.
im and*Pli4services.-aid special p'o- ..
griln-10:11040.00#4k.1"elk(1*;0401P.04,6t(AlsO) *.**51$641;18.0*,cup,* .
400 fOds Orili#01(4*10g 76ifiiO4in *1080-
,L7,:f433:11%
g§f6.04 PilcOcflOstaiCCP La.bithltd910PIOrniig
'PA4 i!el.04Fig100%'Private SCficiols.:SkflopiXtinv .
thirni4tglithP*0411'Acadany; Wicitrointriner/t11.t3
meat, di#e'"iida:aler444projeciOdp3dle*Ii
Tr401:09±60v Kits.innnagenint; andiiralnaiion:-
Major Findings
1. AISD extracurricular transportation costs werereduced this year to $210,027, largely by eliminatingmorning routes. Chapter 2 Formula's costs ($105,014)were 49% lower per student this year (down from$400 per student to $203.50). Frequent ridership mayhave been impacted by reduced routes--85% of stu-dents surveyed in 1988-89 reported riding 0-1 timeper week--significantly higher than the 68% foundlast year.
2. Six schools competed in an Academic Decathloncontest for the first time in the history of the Dis-trict. Half the people familiar with the programfound it effective. Blacks and Hispanics are under-represented in participation compared to Districtethnic percentages.
3. At the three schools with Project ASSIST, rates ofcorporal punishment and other disciplinary actionshave generally declined since the inception ofProject ASSIST. As in the two previous years, Blackstudents are. sent to the ASSIST room at a rate that ishigher than the percentage they represent in theASSIST schools.
4. The Comprehensive Competencies Program Lab atJohnston High School is designed as a dropout pre-vention program. The CCP Lab positively influencedgrades for both fall and spring participants. How-ever, results from attendance and credits earnedwere more mixed. Overall dropout rates were similarto what would be predicted for high risk students.
88.31
Table of Contents
Executive Summary
Introduction 1
Peer Assistance and Leadership Program 2
Project ASSIST 6
Extracurricular Transportation 10
Homework Pilot 14
Johnston Comprehensive Competencies Program Lab 15
Spanish Academy 20
TEAMS Improvement Funds 22
Private Schools 24
Outdoor Learning Program 25
WICAT Computer Lab Instructional Aide ...... . . .28
School-Community Liaison Program 29
Prekindergarten Units 30
Academic Decathlon 31
Program Effectiveness Comparison 34
Bibliography' 35
ii 7

88.31
CHAPTER 2 FORMULA: 1988-89 EVALUATION
INTRODUCTION
As of June, 1989, the Austin Independent School Districtexpenditures for its Chapter 2 Formula funds were asfollows:
o Peer Assistance and Leadership Program ($21,041)
o Project ASSIST ($449,315)
o Extracurricular Transportation ($105,014)
o Homework Pilot (Allocation: $4,500; Expenditures: $0)
o johnston's Comprehensive Competencies Program Lab($49,250)
o Spanish Academy ($44,766)
o TEAMS Improvement Funds ($26,004)
o Outr'oor Learning Program ($8,820)
o Wicat Computer Lab ($14,052)
o School-Community Liaison ($11,874)
o Pre-kindergarten Units ($69,846)
o Academic Decathlon ($17,901)
o Private Schools ($21,587)
o Rainbow Kit ($35,968)
o Management ($27,730)
o Gifted and Talented StaffDevelopment ($16,014)
o Evaluation ($14,565)
o Middle School Training ($6,305)
Indirect costs were $12,062. Plans are to roll forward$87,228 into 1989-90. This report will describe the first13 components listed above and present findings on their useand effectiveness. Evaluation and management activitieswere considered inappropriate for evaluation. expendituresfor Rainbow Kits, Gifted and Talented Staff Development, andMiddle School Training were added too late to be included inevaluation plans.
1

88.31
JIMM11111=111111011
PEER ASSISTANCE AND LEADERSHIP PROGRAM
WHAT I i Tn. PAL PROGRAM?
The Peer Assistance and Leadership (PAL) Program as of June22, 1989 spent $21,041 of 1988-89 Chapter 2 Formula funds.The PAL course is currently offered at area high schools andsix middle/junior high schools. The PAL Program selects andtrains a limited number of students to work as peerfacilitators with younger students who exhibit academicand/or social adjustment problems. PAL students work withyounger students at several elementary schools, feedermiddle/junior high schools, and on their own campuses. Astaff member from each of the participating secondary
.schools serves as the PAL Program sponsor. Chapter 2 fundswere used to pay stipends'to the PAL teachers/trainers andto provide for reproduction, supplies, and transportation.
HOW MAVY STUDENTS WERE ENROLLED IN THE PAL COURSE?
During the fall, 1988 semester, 198 students were enrolledin the PAL course at nine senior high schools and 46students were enrolled at six middle/junior high schools.This was the first year that there was a PAL course at themiddleLiunior high level. For the spring, 1989 semester, aPAL course was added at Robbins High School, bringing totalenrollment to 241 students at the high school level. Thenumber of students enrolled at the middle/junior high levelincreased by 22% to 56. Total spring enrollment for 1989 atthe high school level was 49% above the 161 studentsenrolled in the seven PAL courses last spring.
HOW MANY TARGET STUDENTS WERE SERVED? IN WHAT SCHOOLS WERETHESE STUDENTS ENROLLED?
A count based on teachers' monthly reports showed that 998target students were served by the high school PAL studentsand 186 target students were served by the middle/juniorhigh PAL students for a total of 1,184 target studentsserved by the PAL Program during 1988-89 (see Figure 1).High school PAL students clocked 10,263 hours of servicewhile middle/junior high PAL Students clocked 2,517 hours ofservice for a total of 12,780 hours of service. Both number
29

88.31
of students served and hours of service figures are higherthan last year.
Students at the following elementary and secondary schoolswere served:
Elementary - St. Elmo, Brooke, Govalle, Metz, Zavala,Galindo, Allan, Andrews, Houston, Gullett, andMenchaca.
Middle/Junior High - Bedicheck, Dobie, Kealing, Mendez,Pearce, Fulmore, Lamar, Burnet, 0. Henry, Robbins,Martin, and Murchison.
Senior High - Austin, Bowie, Johnston, Lanier, Reagan,Travis, Crockett, Johnson (LBJ), Robbins, and McCallum.
St. Johns Special Teen Parent Center
Figure 1NUMBER OF STUDENTS SERVED BY PAL PROGRAM
(UNDUPLICATED COUNT)
High School StudentsServed
310
Elementary SchoolStudents Served
291
Students Served by:
Middle SohoolStudents Served
583
Total Students Served: 1,184
Mlddlo School PALS188
High School PALS397
WHAT TYPE OF TRAINING DID THE PAL STUDENTS RECEIVE?
PAL students receive in-class training in self-awareness,group dynamics, communication skills, helping strategies,-problem solving, decision-making, tutoring skills, substanceabuse prevention, knowledge of community resources, andconflict resolution. Training is provided throughout theacademic school year; however, before PAL students beginhelping other students, they receive training for the entirefirst month of their participation in the lab. In additionto in-class training PAL students must receive at least 20hours per semester of training from outside resources. Thistraining is provided by social workers, psychologists, law
88.33.
enforcement agencies, dispute resolution center personnel,and alcohol and drug abuse. specialists. Services are eitherprovided on a voluntary basis or contracted by the PALCoordinator.
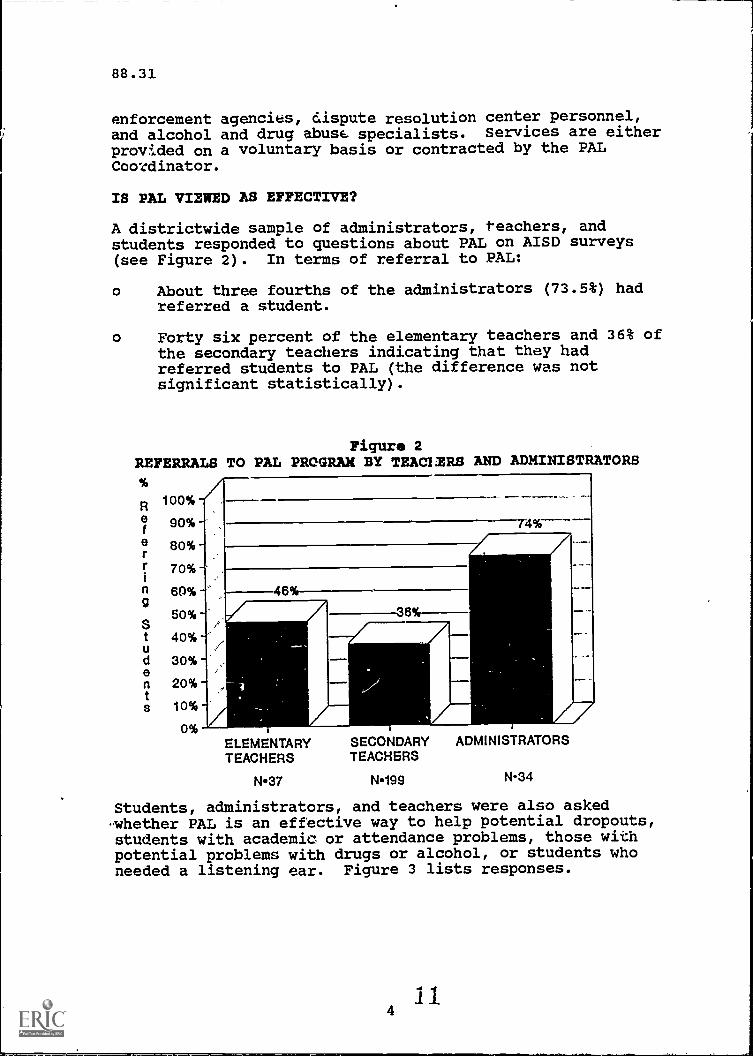
IS PAL VIEWED AS EFFECTIVE?
A districtwide sample of administrators, teachers, andstudents responded to questions about PAL on AISD surveys(see Figure 2). In terms of referral to PAL:
o About three fourths of the administrators (73.5%) hadreferred a student.
o Forty six percent of the elementary teachers and 36% ofthe secondary teachers indicating that they hadreferred students to PAL (the difference was notsignificant statistically).
Figure 2REFERRALS TO PAL PROGRAM BY TEACHERS AND ADMINISTRATORS
R 100%
e 90%
e 80%
70%
n 60%9
50%
t 40%
d 30%
nt
s
20%
10%
0%
T4%
46%
36%--
ELEMENTARY SECONDARYTEACHERS TEACHERS
N37 N199
ADMINISTRATORS
N34
Students, administrators, and teachers were also asked-whether PAL is an effective way to help potential dropouts,students with academic or attendance problems, those withpotential problems with drugs or alcohol, or students whoneeded a listening ear. Figure 3 lists responses.
114
88.31
Figure 3RESPONSES TO PAL QUESTIONS ON DISTRICTWIDE SURVEYS
PAL is an effective way to help students:
% AgreeingStu-dents
N=141-2
Admi.n-istratorsN=19-J1
TeachersElemen- Secon-tary daryN=17-21 N=100-3
With academic problems 92 84 57 46
Who are potentialdropouts 95 88 76 53
Avoid problems withdrugs and alcohol 94 68 22 45
By providing alistening ear 7 90 77 59
Similar to last year, students reported the highest level ofbelief in the efficacy of the program of the groupssurveyed. Students and administrators showed more positiveattitudes than teacheks. All groups most strongly agreedthat PAL provides a listening ear for students, followed byhelping potential dropouts. Lower percentages agreed PALhelped with academic problems or drugs and alcoholavoidance. Positive responses from elementary teachers haveincreased considGzably over those of last year.
An analysis of each of the above questions was done basedupon the response to the question, "Have you ever referred astudent to the Peer Assistance and Leadership Program forassistance from a PAL facilitator" Figure 4 shows thatthose who had referred a student to the PAL Programexhibit(,1 significantly more faith in the ability of theprogram to help students in three of the four areas. Thosewho had referred a student to the PAL Program were moreconfident in the ability of the program to help studentswith academic and attendance problems, to help students who
'-..are potential dropouts, and to help students by providing alistening ear, but did not feel more confident in theability of the program to help students with drug andalcohol problems.
125

88.31
Figure 4OPINIONS OF EFFECTIVENESS OF
THE PEER ASSISTANCE AND LEADERSHIP PROGRAMFOR TEACHERS WHO HAVE AND HAVE NOT REFERRED STUDENTS
Academic/Attendance
Drugs and Alcohol
Dropout Prevention
Provide ListeningEar
45%
47%42%
-49%1
61%
56%
82%
84%
0% 20% 40% 60%% Agreeing
Referred Students Erug Have Not ReferredStudents
80% 100%
For further information on the Peer Assistance andLeadership Program see New initiatives in DropoutPrevention: Prolect GRAD Final Report, 1988-89 (PublicationNo. 88.36) and the Taking Steps Toward Drug-Free Schools inAISDI 1988 -39 Final Report (Publication No. 88.34).
PROJECT ASSIST
WHAT IS PROJECT ASSIST?
Project ASSIST (Assisting Special Students in Stress Times)is currently in operation at three elementary schools- -Blanton, Blackshear, and Wooldridge. ASSIST is based on anapproach to discipline called "reality therapy," whichstresses the importance of teaching students to acceptresponsibility for their own behavior, in contrast tocontrolling behavior with punishment.
16
88.31
The schools and grades served by Project ASSIST have changedover the years. In the 1983-84 school year, Project ASSISTbegan at Blanton, Walnut Creek, and Wooldridge. BlackshearElementary was added during the 1985-86 school year. In1983-84 through 1986-87, only students in grades 4-6 wereserved. Beginning in 1987-88, all students at the ASSISTschools were included; Blanton and Blackshear had grades K-6, while Wooldridge had grades K-5. Walnut Creek did nothave an ASSIST room in 1988-89.
WHAT STUDENTS WERE SERVED BY PROJECT ASSIST?
Students were identified from the ASSIST logs kept by theinstructional monitors and the information was used toobtain the sex, ethnicity, and special education status ofstudents referred to the ASSIST rooms. Students visited theLab a total of 1,486 times. About 23% of the referrals wereenrolled in special education (a slightly higher percentagethan last year's 18%). More males (74%) than females (26%)and more Blacks (61%) than Others (23%) or Hispanics (16%)were referred to ASSIST rooms. Black students were referredto ASSIST classrooms at a rate that significantly exceededthe percentage they represented in the schools with ProjectASSIST (see Figure 5). Similarly, Hispanic and Otherstudents were assigned to ASSIST rooms at a rate that wasless than the percentage they represented in ASSIST schools.This same pattern was found the last two years.
Figure 5ETHNIC COMPOSITION OF STUDENTS REFERRED TO PROJECT ASSIST
COMPARED TO ETHNIC COMPOSITION OF THE ASSIST SCHOOLS
Black(108) 61%
Other(95) 23%
Hispanic(44) lessEthnicity of Students
Referred to Project ASSIST
Black44%
Ethnicity of All Studentsin Project ASSIST Schools
HOW OFTEN WERE STUDENTS REFERRED?
While comparisons between years must be made cautiouslygiven the change in school populations and grades served,the data can be quite helpful for planning purposes. Atotal of 277 students was referred to the ASSIST rooms in1988-89 for an average per-student cost of $178, based ontotal expenditures of $49,315. This is $70 less than last
7
88.31
year. Incomplete records from Blanton (which omitted April
and May), may affect statistics for total number of students
served. However, this effect would probably be slight,given that 246 of the 277 students served visited the labfor the first time in the fall, 1988 semester.
Students in the fourth and fifth grade were referred to theASSIST room most often (see Figure 6). Students referredonly once, were referred 14% less than last year, whilestudents referred 11 or more times rose considerably from0.6% in 1987-88 to 16% this year. In the past, Blanton hassent more students to the ASSIST Room more often than the
other schools. Last year Blanton accounted for 48% of thereferrals to the ASSIST room. This year Blanton alsoaccounted for 48%; however, Wooldridge accounted for 43% ofreferrals (a total of 91% for these two schools).Blackshear referred 27 students this year, 10% of the totalreferrals, down from 47 students referred last year (see
Figure 7).
Figure 6NUMBER OF REFERRALS BY GRADE FOR PROJECT ASSIST
5th Grade(54) 19%
Figure 7FREQUENCY OF REFERRALS BY STUDENT AND SCHOOL
Blackshear(27) 10%
Blanton(132) 48%
2-5 Tim9s(107) 39%
11+ Times(43) 16%
Wooldridge 6-10 Times(118) 43% (40) 14%
Referrals Per Soho°, Referrals Per Student
8
5

88.31
HAS PROZECT ASSIST AFFECTED DISCIPLINE RATES AT THE ASSISTSCHOOLS?
Among the three Project ASSIST schools, there was only onesuspension at WonldLuidge) in 1987-88. This year Blantonhad 20 suspensions accounting for 40 missed class days; theother schools had none. Figure 8 shows the number ofdisciplinary actions, excluding corporal punishment, for1982-83 (before implementation of Project ASSIST), 1983-84(the first year of Project ASSIST at Blanton andWooldridge), 1984-85, 1985-86 (the first year of ProjectASSIST at Blackshear), 1986-87, 1987-88, and 1988-89.
Incidence of corporal punishment by school were highest atWooldridge (7). Blanton, which had the highest incidence ofcorporal punishment (18) last year, reported 3 incidentsthis year, an 83% reduction. Figure 9 shows the number ofinstances of corporal punishment during the past six yearsin the three schools with Project ASSIST.
Figure 8NUMBER OF DISCIPLINARY ACTIONS(EXCLUDING CORPORAL PUNISHMENT)
AT BLANTON, BLACKSHEAR, AND WOOLDRZDGE
1982-83
1983-84
1984-85
*1985-86
1986-87
1987-88
1988-89
0 20
Number
40 60 80 100
0
20
57
83
20 40 60 80
MI Blanton ION Wor MI Blackshear
First year of Implementation at 'hoar
9 I 6
100

88.31
70
ro
40
30d
20
10
41II,
Figure .)
INCIDENCE OF CORPORAL PUNISHMENTAT BLANTON/ BLACKSHEAR, AND WOOLDRIDGE
1982-83 1983-84 1984-85 1985-88 1988-87 1987-88
-IS-Wooldridge -49-Blanton --BlackshearFirst year of Implementation at Blackshear
SUMMARY
1988-89
Rates of corporal punishment and other disciplinary actionshave generally declined since the inception of ProjectASSIST, although increases were seen in one school for eachtype of discipline this year. Blackshear sends fewerstudents to their lab than the other participating schools.As in the two previous years, Black students were sent tothe ASSIST labs at a rate that is higher than the percentagethey represent in the ASSIST schools.
EXTRACURRICULAR TRANSPORTATION
NW,
WHAT IS THE EXTRACURRICULAR TRANSPORTATION PROGRAM?
The school assignments of past and current students havecreated problems in ensuring that students who arereassigned for integration purposes have access toparticipation in extracurricular activities. TheExtracurricular Transportation Program was allocated$192,000 in Chapter 2 Formula Funds for the 1e88-1989 school
year. The funds have been used to provide transportation toand from extracurricular activities before and after schooland transportation home after out-of-town charter
10

88.31
activities. Extracurricular Transportation services areprovided to 21 secondary campuses.
HOW MUCH SERVICE WAS PROVIDED BY CHAPTER 2 FORMULA?
Twenty-one secondary schools were served by this program on43 routes, for a total AISD cost of $210,027. An average of12'Students per bus was served by the extracurriculartransportation program, for an estimated 516 students serveddaily. Chapter 2 Formula funds reimbursed $105,014 of thetotal AISD cost, for a daily per-student cost to Chapter 2of $1.16, and a total school year Chapter 2 cost per-studentof $203.50. This figure is half (49%) of last year's costto Chapter 2 of $400 per student.
FOR WHAT ACTIVITIES WERE BUSES USED?
The extracurricular transportation buses are primarily usedfor athletic practices and events (i.e., football, baseball,track, basketball). Other uses of these buses include band,drama, other school club meetings and practices, drill-teamand cb23rleader practices, and tutoring.
DID THE PROVISION OF EXTRACURRICULAR TRANSPORTATION GIVEREASSIGNID STUDENTS AN OPPORTUNITY TO PARTICIPATE INEXTRKCURU/CULAR ACTIVITIES?
A sample of reassigned high school students was surveyed in
the fall of 1988 concerning their use of extracurriculartransportation (see Figure 10). In general, responsesindicated that:
o Over half (62%) of the students responding (n=570) saidthat they had ridden an extracurricular bus.
o About three fourths (73%) of the reassigned studentsresponding (n=565) said that they rode the bus anaverage of zero (0) times. per week. Overall, 13%indicated they rode the bus 1-5 times per week, with 5%riding 6-10 times per week. Ninth and tenth graders(34%), more than eleventh and twelfth graders (15%),rode an extracurricular bus at least one time per week.
Responses to this question are significantly differentfrom last year when 68% of the reassigned students saidthat they rode an extracurricular bus 0-1 times perweek in 1987-88. The same question yielded a responseof 85% in 1988-89. It appears that students are ridingthe extracurricular buses less often.
o Almost two thirds of the respondents (63%) said thatthey would have been able to participate in
11
88.31
extracurricular activities even if transportation hadnot been provided.
Figure 10EXTRACURRICULAR BUS RIDERSHIP RATES PER WEEK
0-1 TIMES68% 0-1 TIMES 83%
411621i616-107%TIMES
1104-5 TIMES2-3 TIMES 15%
10%
1987-88
,
6-10 TIMES 5%4-5 TIMES 6%
2-3 TIMES 6%
1988-89
On the districtwide teacher/administrator survey,respondents were asked to estimate the number of studentswho were not able to participate in extracurricular eventsthis year because of the reduction in extracurricular busroutes. The responses are summarized in Figure 11.
Figure 11EXTRACURRICULAR EVENTS
Number of Students Unable to Participatein Extracurricular Activities Because of Fewer Buses
100%
90%-
% 80%-
R70%-
e 60%-s
P 50%-o
n 40%-
i 30%-
g 20%-
10%-
0%
A. 0B. 1-10C. 11-20D. 21-30E. 31-40F. 41 -60G. 151-89H. 81-701. 71-80
J. 81-90K. OVER 100
ABODE F G H I J K
IN Teachers x Administrators
About 20% of the teachers and administrators said no one wasaffected by the reduction in the number of buses. Teachersresponded most often that zero students were affected by thereduction in buses. For administrators, this was the secondlargest response with 1-10 students affected being thelargest. Some respondents did indicate more students were
12

88.31
impacted. This suggests that teachers and administratorsgenerally believe that few students cannot attend theextracurricular activities at the same rate as before withfewer extracurricular buses.
When asked what would be the most viable way to reduce costsfor extracurricular transportation, teachers andadministrators responded in the following order:
Teachers Administrators
Restrict ridership to extra- Eliminate magnet schoolcurricular or reassign- serviceed students
Eliminate magnet schoolservice
Offer one route per schoolper day
Lengthen routes
Cut routes at schools withlow ridership
Offer one route per schoolper day
Lengthen routes
Cut routes at schools with lowridership
Restrict ridership to extra-curricular or reassignedstudents
IMPLICATIONS
While the cost of extracurricular transportation hasdecreased considerably compared to previous years, the useof other means of transportation in order to participate inextracurricular activities remains high. The decline incost is largely a result of the elimination of morningroutes, a possibility mentioned in last year's evaluation.As indicated earlier, almost two thirds of all reassignedstudents said they would have been able to participate inextracurricular activities even if transportation had notbeen provided. There is some difference, however, in theneed for this service between eleventh and twelfth graders,as opposed to eighth and ninth graders. Eighth and ninthgraders are more likely than eleventh and twelfth graders to',ride an activity/athletic bus at least once per week.
Finally, while most students have used the bus, they use itonly rarely.
2013

88.31
HOMEWORK PILOT
WHAT /8 THE HOMEWORK PILOT PROJECT?
The Homework Pilot Project originally received $4,500 inChapter 2 Formula funds for 1988-89 for postage. Funds werenot used because booklets were directly distributed tostudent through schools. Funds allocated in 1987-88 wereused for developing the practice booklets and forreproduction. The booklet entitled "Parents' Guide to theTexas Educational Assessment of Minimum Skills (TEAMS)" wasdistributed to all seventh and ninth grade students in AISD.The booklets were designed to involve parents in assistingtheir child in preparing for the TEAMS test.
WERE THE MATERIALS THAT WERE USED EFFECTIVE?
Surveys were sent to 256 ninth grade Fundamentals ofMathematics students and 242 seventh grade mathematicsstudents. Of these, 114 ninth graders and 198 seventhgraders responded for a response rate of 45% and 81%,respectively, and a cumulative response rate of 63%.
o Three of four respondents (76%) completed at least someof the practice material.
o More than half (57%) of the respondents found theactivities helpful in preparing for TEAMS. However, alower percentage (36%), of those responding said thatthey enjoyed the activities.
o Of the students responding, 79% indicated that they didnot receive any help from their parents. Twenty-onepercent of the students indicated that their parentsdid assist them with the practice booklet.
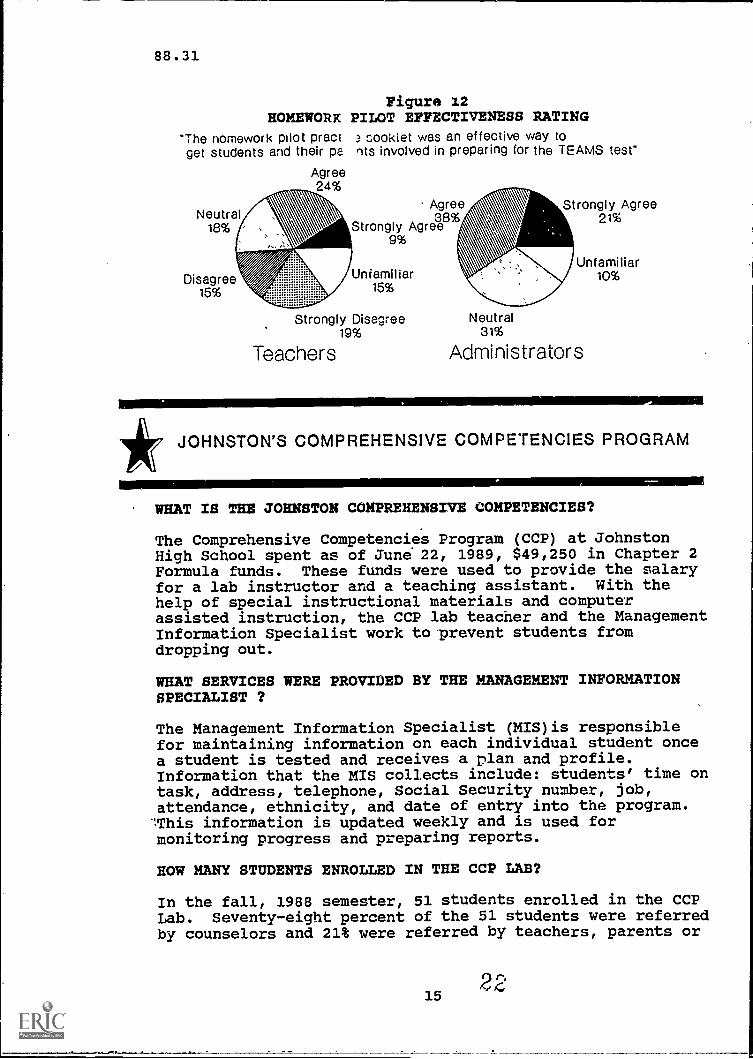
Teachers and administrators were asked if the Homework Pilot:practice booklet was an effective way to get students andtheir parents involved in preparing for the TEAMS (seeFigure 12). More than half (59%) of the administrators feltthe practice booklets were effective, while fewer teachers,33% felt that the practice booklets were effective. Amongthe eight Chapter 2 Formula components appearing on thestaff surveys, Homework Pilot expenditures ranked eighth in
effectiveness.
2114
88.31.
HOMEWORKThe nomework pilot praciget students and their pa
Agree24%
Neutral/1i!18%
v ziv'"
Disagree15%
Figure 12PILOT EFFECTIVENESS RATING3 cookiet was an effective way tonts involved in preparing for the TEAMS test"
Agree
Strongly Agree9%
Unfamiliar15%
Strongly Disagree19%
Teachers
Strongly Agree21%
Unfamiliar10%
Neutral31%
Administrators
JOHNSTON'S COMPREHENSIVE COMPETENCIES PROGRAM
WHAT IS THE JOHNSTON COMPREHENSIVE COMPETENCIES?
The Comprehensive Competencies Program (CCP) at JohnstonHigh School spent as of June 22, 1989, $49,250 in Chapter 2Formula funds. These funds were used to provide the salaryfor a lab instructor and a teaching assistant. With thehelp of special instructional materials and computerassisted instruction, the CCP lab teacher and the ManagementInformation Specialist work to prevent students fromdropping out.
WHAT SERVICES WERE PROVIDED BY THE MANAGEMENT INFORMATIONSPECIALIST ?
The Management Information Specialist (MIS)is responsiblefor maintaining information on each individual student oncea student is tested and receives a plan and profile.Information that the MIS collects include: students' time ontask, address, telephone, Social Security number, job,attendance, ethnicity, and date of entry into the program.'IThis information is updated weekly and is used formonitoring progress and preparing reports.
HOW MANY STUDENTS ENROLLED IN THE CCP LAB?
In the fall, 1988 semester, 51 students enrolled in the CCPLab. Seventy-eight percent of the 51 students were referredby counselors and 21% were referred by teachers, parents or
15

88.31
other students. Five students were transferred to theZenith Program, because they were 17 or 18 in the 9th gradewith five to nine credits. The 41 students who completedat least 10 hours of the specially designed instructionalmaterial (10 hours time on task) will be consideredseparately from the 10 who did not.
In the spring, 1989 semester, 21 students from the fallsemester returned to the lab and 29 new students wereenrolled for a total of 50 students. Of these 50 students66% were referred by a counselor and 34% were referred by ateacher, parent, or friend. During the spring semester, 46of the 50 students completed at .east 10 hours time on task.The four who did not complete the 10 hours time on task willbe considered separately.
HOW MANY STUDENTS WERE SERVED? WHAT WERE THEIRCHARACTERISTICS?
A total of 66 students were served by the CCP lab andcompleted at least 10 hours for the 1988-89 school year.Figures 13 and 14 illustrate the sex and ethniccharacteristics of the participating population for both thefall and spring semesters. In the fall, 1988 class, 85% ofthe students were overage for grade, 12% were limited-English-proficient (LEP) students, and 7% were specialeducation students. In the spring, 1989 class, 85% of thestudents were overage for grade, 13% were (LEP) students,and 15% were special education students.
Figure 13GENDER OF JOHNSTON CCP LAB PARTICIPANTS
Fall, 1988
Female(25) 61%
Spring, 1989Male
(26) 57%
Female(20) 43%

88.31
Figure 14ETHNICITY OF JOHNSTON CCP LAB PARTICIPANTS
Fall, 1988Black
(15) 37%
Spring, 1989
HispanicHispanic (33) 72%(26) 63%
Black
(1) 2%Other
DID THE CCP LAB AFFECT ATTENDANCE, GPA'S, OR CREDITS EARNED?
In reviewing this report, school staff pointed out somestudents (number unknown) are added to the CCP Lab duringeach semester because of attendance and/or disciplinaryproblems. The extent to which this affected overall Labdiscipline and attendance statistics could not be det'rminedquickly enough to be included in this report. Results musttherefore b interpreted with this in mind.
Figure 15 shows the attendance rate for fall and springstudents completing 10 hours or more on task (note that thespring, 1989 figures include some fall, 1988, students).
o For the 41 students enrolled in the CCP Lab during thefall, 1988 semester, there was a slight rise inattendance from fall, 1987 to fall, 1988 and a slightdecline from spring, 1988 to spring, 1989. Attendancewas highest during their fall, 1988 participation inthe CCP Lab.
o For the 46 students participating in the lab during thespring, 1989 semester attendance rates declined betweenthe fall, 1987 and 1988 semesters and between thespring, 1988 and 19C9 semesters. Attendance was nothigher while students were enrolled in the CCP Lab.
Figure 15COMPREHENSIVE COMPETENCIES PROGRAM AT JOHNSTON H.S.
Attendance Rate for Program Students
Fall, 1988Enrollees
Fall, Fall, Spring, Spring,1987 1988 +/- 1988 1989 +/-
87.6 88.3 0.7 82.9 81.8 -1.1
Spring, 1989Enrollees 93.5 90.9 -2.6 89.3 84.1 -5.2
17 24
88.31
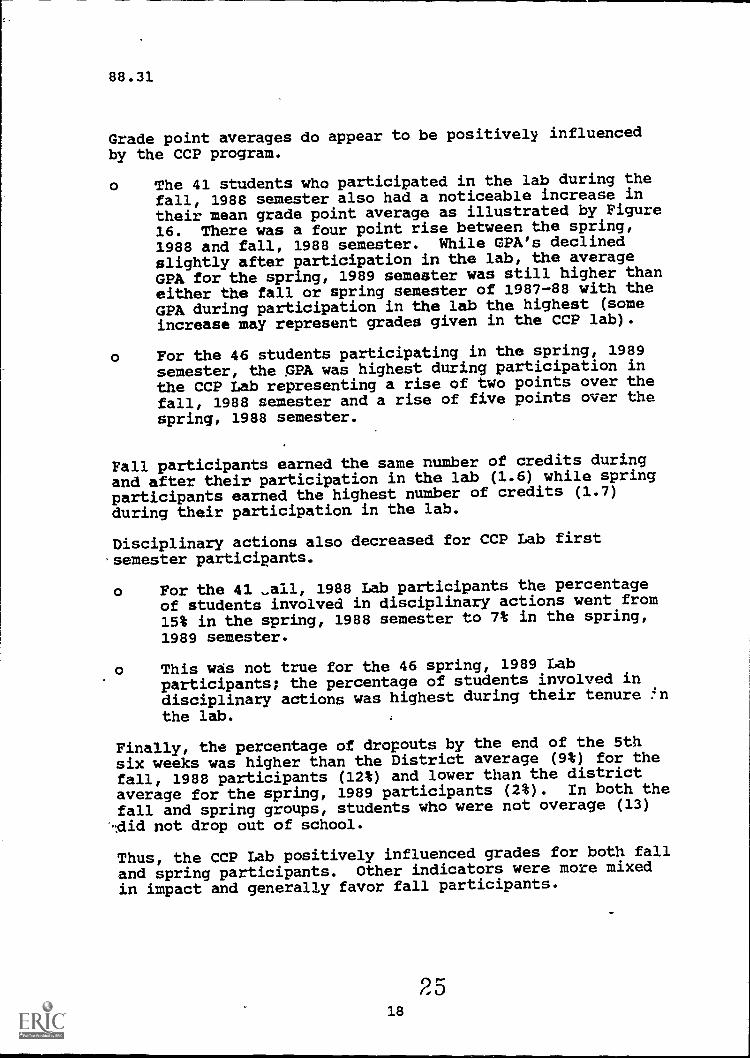
Grade point averages do appear to be positively influencedby the CCP program.
o The 41 students who participated in the lab during thefall, 1988 semester also had a noticeable increase intheir mean grade point average as illustrated by Figure
16. There was a four point rise between the spring,
1988 and fall, 1988 semester. While GPA's declinedslightly after participation in the lab, the averageGPA for the spring, 1989 semester was still higher thaneither the fall or spring semester of 1987-88 with the
GPA during participation in the lab the highest (someincrease may represent grades given in the CCP lab).
o For the 46 students participating in the spring, 1989semester, the GPA was highest during participation inthe CCP Lab representing a rise of two points over thefall, 1988 semester and a rise of five points over the
spring, 1988 semester.
Fall participants earned the same number of credits during
and after their participation in the lab (1.6) while springparticipants earned the highest number of credits (1.7)during their participation in the lab.
Disciplinary actions also decreased for CCP Lab first
semester participants.
o For the 41 _all, 1988 Lab participants the percentageof students involved in disciplinary actions went from15% in the spring, 1988 semester to 7% in the spring,
1989 semester.
o This was not true for the 46 spring, 1989 Labparticipants; the percentage of students involved indisciplinary actions was highest during their tenure :;21
the lab.
Finally, the percentage of dropouts by the end of the 5thsix weeks was higher than the District average (9%) for thefall, 1988 participants (12%) and lower than the districtaverage for the spring, 1989 participants (2%). In both the
fall and spring groups, students who were not overage (13)
%did not drop out of school.
Thus, the CCP Lab positively influenced grades for both fall
and spring participants. Other indicators were more mixed
in impact and generally favor fall participants.

88.31
Figure 16COMPREHENSIVE COMPETENCIES PROGRAM AT JOHNSTON H.S.
Mean Grade Point Average Comparison
80 -
1,4 79 -0
78 - 75O 77 -
77.1 .--a
o 70 -.,-
-".78
75 -o1
74 -^
A 73 - TV........... 7
V
r 72 -e
o 71 -
70Fell. 1087 SP11r0, 1088 Fell. 1988
Fell. 1988 -I- Sprint). 1989
S011110. 1080
CCP Students Completing Less Than 10 Hours on Task
The CCP Lab is designed primarily as a dropout preventionprogram. It is therefore important to consider thecharacteristics of those at-risk students who drop out orleave the lab without accumulating 10 hours time on task.During the fall, 1988 semester of the lab, the 10 studentswho did not meet the time on task requirement where Hispan.!-males and more likely to be LEP than the students who didstay in the Lab. Of these 10 students that did nctaccumulate 10 hours time on task, five were transferred tothe Zenith Program where three of these five eventuallydropped out of school. In all, four of the 10 studentsdropped out of school. Of the four students not completing10 hours time on task during the spring, 1989 semester, onedropped out and three were recommended for retention.
If the fall and spring groups are combined, 11 students ofthe 80 enrolled for any length of time in the CCP labdropped out. This rata: (1470 is higher than AISD's rate of
9%. Of the 45 fall, 1568 enrollees evaluatEd as at risk'1.,(whether completing 10 hours time on task or not), eight
(18%) dropped cut. While this rate (18%) is higher thanwould be predicted for this group (10%), the difference is
not significant.
Students not meeting the 10 hours time on task criteria have
a much higher dropout rate (36%) than the 2.0 hours or morepopulation (9% for the fall group and 2% f6r the spring
group).
88.31
SPANISH ACADEMY
WHAT IS THE SPANISH ACADEMY?
Courses in Spanish as a Second Language are offered free toAISD employees under a continuing program known as theSpanish Academy. In 1988-89, $44,766 in Chapter 2 Formulafunds were spent as of June 22, 1989 for three half-timeinstructors to teach at the Spanish Academy. Courses areoffered to AISD employees during 12-14 week sessions. The
goals of the course are to develop proficiency inconversational Spanish and to familiarize participants with
Hispanic culture. The sessions were taught in both fall andspring semesters, and a third session was offered during thesummer. Spanish Academy participants who attend three ormore classes are eligible for TESD credit (Time EquivalencyStaff Development -- "blue card") or they are eligible forAdvanced Academic Training MAT -- "orange card") creditafter attending nine* or more classes. Each regular sectionmeets one evening per week for two hours.
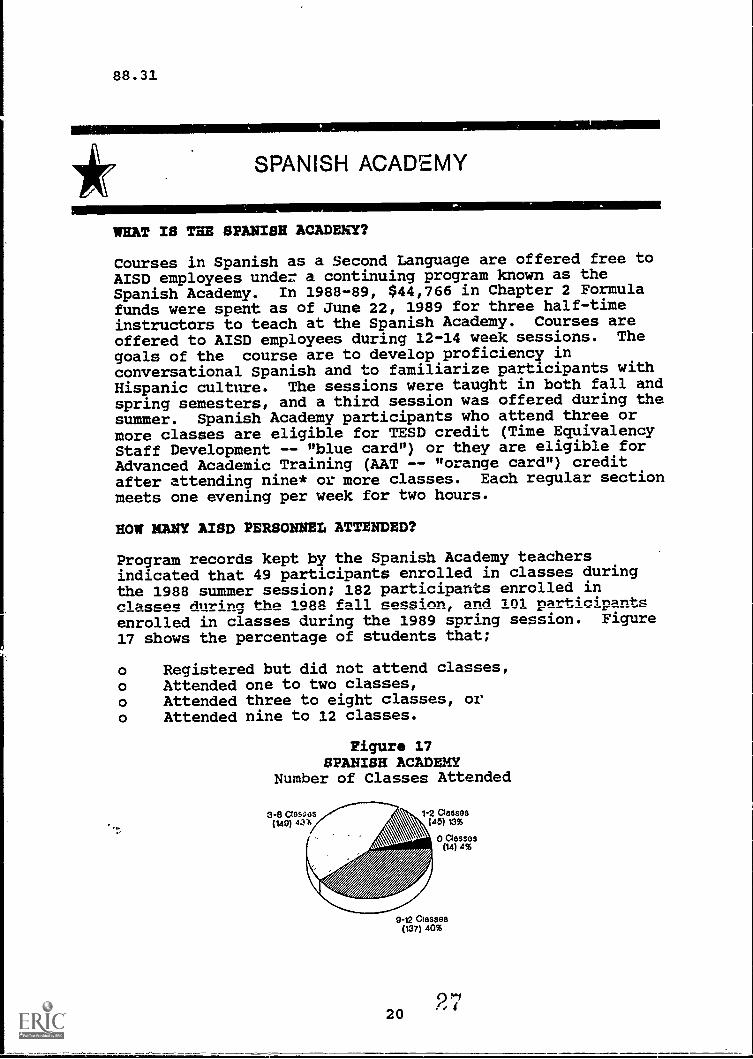
HOW MANY AISD PERSONNEL ATTENDED?
Program records kept by the Spanish Academy teachersindicated that 49 participants enrolled in classes duringthe 1988 summer session; 182 participants enrolled inc1 assns during *hsa lORA f=11 session, and 1 01 partti [_ i pantoenrolled in classes during the 1989 spring session. Figure17 shows the percentage of students that;
o Registered but did not attend classes,o Attended one to two classes,o Attended three to eight classes, oro Attended nine to 12 classes.
Figure 17SPANISH ACADEMY
Number of Classes Attended
3-8 Classes(149) 43%
-(24 5Cri38 aze a
0 Classes
4N11110.°
(14) 4%
8-12Cmssezi(137) 40%
2720

88.31
HOW MANY POSITIONS WERE REPRESENTED IN THIS GROUP?
The majority of the participants (based on the courseevaluation) were teachers (54%), with 10 jobs representedoverall. Some of the other positions represented wereJ.Ibrarian, counselor, secretary, principal, psychologist,and auditor.
HOW DID THE PARTICIPANTS EVALUATE THE COURSE?
All studer,.:s enrollees in the Spanish Academy during the fallsemester were asked to evaluate the program.. Last year,only those completing six or more classes were asked toevaluate the Spanish Academy. In December, 1988, surveysdeveloped by ORE staff were distributed to all 182 studentsthrough the instructors (the survey was mailed to those whodid not attend on the distribution day). Of the 182 surveysdistributed, 82 were returned for a return rate of 45%. In
general, responses indicated that:
o Most participants rated the course as excellent (76%)
or good (20%).
o Almost all respondents reported favorably when asked ifthe course had helped them a lot (56%) or some (39%).
o Three of four (74%) of the respondents work withHispanic students, double that of last year (36%). Ofthese, 58 or 95% indicated their participation improvedtheir rapport with Hispanic students. Thirteen percentof the respondents indicated that the Spanish Academydid affect the achievement of their Hispanic students,and 17% said that it did not. A large percentage (70%)
did not respond or said the question was notapplicable.
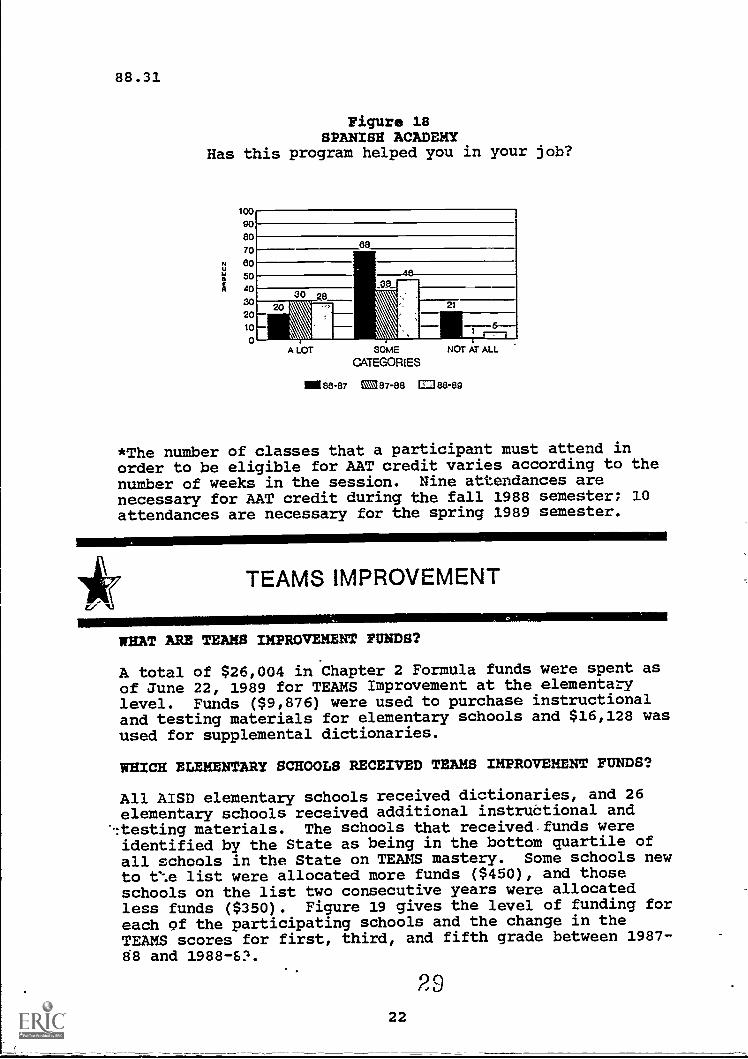
DID PARTICIPATION IN THE PROGRAM HELP THE PARTICIPANTS IN
THEIR JOBS?
Most respondents indicated that the course had helped them'in their jobs (90%). However, there was a slight decline'119%) in the number of respondents indicating Spanish Academyhad helped them "a lot" in their jobs compared to last year,although it was still higher than in 86-87 (see Figure 18).However, the difference between the 87-88 and 88-89 figuresis not statistically significant.
21
88.31
Figure 18SPANISH ACADEMY
Has this program helped you in your job?
100908070
44 805040
302010
0
ea
3
2
A LOT SOME
CATEGORIES
21
NOT AT ALL
- 88-87 ESM87-88 Claa-89
*The number of classes that a participant must attend inorder to be eligible for AAT credit varies according to thenumber of weeks in the session. Nine attendances arenecessary for AAT credit during the fall 1988 semester; 10attendances are necessary for the spring 1989 semester.
TEAMS IMPROVEMENT
WHAT ARE TEAMS IMPROVEMENT FUNDS?
A total of $26,004 in Chapter 2 Formula funds were spent asof June 22, 1989 for TEAMS Improvement at the elementarylevel. Funds ($9,876) were used to purchase instructionaland testing materials for elementary schools and $16,128 wasused for supplemental dictionaries.
WHICH ELEMENTARY SCHOOLS RECEIVED TEAMS IMPROVEMENT FUNDS?
All AISD elementary schools received dictionaries, and 26elementary schools received additional instructional and
'-:testing materials. The schools that received funds wereidentified by the State as being in the bottom quartile ofall schools in the State on TEAMS mastery. Some schools newto t'-.e list were allocated more funds ($450), and thoseschools on the list two consecutive years were allocatedless funds ($350). Figure 19 gives the level of funding foreach 9f the participating schools and the change in theTEAMS scores for first, third, and fifth grade between 1987-
88 and 1988-6?.
22
29
88.31
Figure 191988-89 FUNDING FOR TEAMS IMPROVEMENT
$450 $350
Grade Grade1 3 5 SCHOOL
+ + + Pecan Springs+ + + Zavala- + * Winn- + + Oak Springs- + + Blackshear+ - + Blanton+ + + Andrews+ + + Sanchez+ - Govalle
1 3 5 SCHOOL
WidenCampbellBrookeOrtegaSimsHoustonWooldridgeNormanLinder
- + + Dawson+ + + Ridgetop+ - + Becker
+ TEAMS mastery improved + + + Allison+ * + Webb+ + Allan+ - - Travis Heights- + + Cook
Changes in percent mastering all three tests by grade, 1988to 1989. * Not applicable
- TEAMS mastery declined
TEAMS results show that nine schools improved at all threegrades; at two schools TEAMS mastery declined at all threegrades; and 15 schools showed a mixture of increasing anddecreasing in percent mastery. Of 75 comparisons, 51 (68%)were positive and 24 (32%) were negative.
WERE TEAMS FUNDS CONSIDERED EFFECTIVE?
About three fourths (70%) of the campus administratorssurveyed considered the additional TEAMS related materialsan effective way to prepare students for the TEAMS test.Among the eight Chapter 2 Formula components appearing onthe staff surveys, TEAMS expenditures ranked second in
'.:effectiveness. Based on achievement and survey data, TEAMSexpenditures seemed helpful as part of District TEAMS
- improvement efforts.
3023
88.31
PRIVATE SCHOOLS
HOW WERE PRIVATE SCHOOLS NOTIFIED OF THEIR ELIGIBILITY TO-PARTICIPATE IN THE DISTRIBUTION OF CHAPTER 2 FORMULA FUNDS?
Each year Chapter 2 Formula funds are available through AISDto nonpublic schools in the District. Requests for fundingare solicited from nonpublic schools. These funds are thendistributed to approved applicants on a per-pupil basis forpurchase of items approved by the Texas Education Agency.In April, schools were invited to participate on threeoccasions; 13 (29%) applied and were approved. Theseschools are listed in Figure 20.
Figure 20NONPUBLIC SCHOOLS RECEIVING CHAPTER 2 FORMULA FUNDSSchool Enrollment Appropriation
Austin Waldorf 146 $1,329Perry School 80 728
Kirby Hall School 114 1,038Hope Lutheran 41 373St. Austin's School 228 2,075Sacred Heart 200 1,820Redeemer 301 2,739
St. Mary's 153 1,392
St. Louis 380 3,458
St. Ignatius 243 2,212St. Paul 206 1,875St. Michael's 180 1,638St. Theresa's 100 910
TOTAL $21,587
HOW WERE CHAPTER 2 FORMULA FUNDS UTILIZED?
Chapter 2 Formula funds were allocated to private schools topurchase instructional materials (for items used in theclassroom), library resources (for items specifically housedin the library and checked out from there), or equipment
of which must have been specifically approved by the'1Texas Education Agency).
Using a TEA form adapted by ORE staff, private schooladministrators were surveyed concerning the effectiveness ofthe materials, library resources, and equipment purchasedwith Chapter 2 Formula funds. Completed forms were returnedby 11 of the 13 schools for a return rate of 85%.
24

88.31
According to the surveys, one school used funds for acompensatory language arts program and two used funds forgifted and talented programs. No use for specialpopulations such as students in bilingual/ESL, migrant,compensatory reading or mathematics, or special educationprograms was noted. Most schools used funds for regulareducation programs or special uses not on the survey form.
For the most part, private schools purchased books,materials and audio visual supplies with their Chapter 2Formula allocations (see Figure 21). All purchases wererated highly (4) to extremely (5) effective on a scale fromineffective (1) to extremely effective (5). Computerhardware and software was also purchased by some of theprivate schools receiving funds. In general, these schoolsrated the items they purchased as being effective; that is,the items accomplished at least half of the intendedpurposes.
Figure 21PRIVATE SCHOOL EXPENDITURES IN °TM STUDENT CATEGORY
Total
# of Schools RatingExpenditures
Schools Highly ExtremelyExpenditure Using Effective* Effective*
Books and Materials 10 I 9
Computer Hardware 3 1 2
Computer Software 4 1 3
Audio/Visual 9 2 7
*No schools rated expenditures ineffective orsomewhat effective.
OUTDOOR LEARNING PROGRAM
WHAT IS THE OUTDOOR LEARNING PROGRAM?
The Outdoor Learning Program organized and funded studytrips to several programs and/or sites in the Austin area:Crowe's Nest Farm, Wild Basin and Bone Tales, DinosaursAlive, Mayfield Park, and the Austin Nature Center. Anovernight camping trip for fifth grade students to CampOlympia (Trinity, Texas) was also partially funded byChapter 2 Formula. Chapter 2 Formula funds ($8,820) paidall transportation costs and site admission fees for the 13
25 c..)(-)

88.31
nonpriority, low socio-economic-status (SES) elementaryschools that participated in the program. The goals of theprogram were to reinforce concepts and ideas taught in theclassroom through hands-on instruction, to develop socialinteraction skills through group activities, and to provideresources for classroom teachers.
HOW WERE THE STUDY TRIP ASSIGNMENTS MADE?
Because of the reduction in the number of schools servedfrom 33 to 13 in the past two years, most classes whichapplied were able to take advantage of the services offeredby the Outdoor Learning Program. Trips were offered to allthird, fourth, fifth and sixth grade classes, plus some
first grade classes. Each grade level visited a differentsite (see Figure 22). The co-curricular study tripemphasized essential elements in science and required local
^11*-r4^"1"'". Two or three classes from a school went to asite at a time most trips were held in the spring.
Figure 22STUDY SITES FOR OUTDOOR LEARNING PROGRAM BY GRADE
Grade Studio Sites
1 Crowe's Nest Farm3 Wild Basin and Bone Tales4 Mayfield Park5 Natural Science center5 Camp Olympia6 Dinosaurs Alive
When asked whether the allocation of study trips was made in
an appropriate manner, the majority (50%) of teachers andadministrators responses were "neutral." One third (34%)felt that the trips were allocated in an appropriate manner,and 17% felt the method of allocating trips was
inappropriate.
HOW MANY STUDENTS WERE SERVED?
7-During the 1988-89 school year, 2,648 students in 117.5*'%classrooms took part in the Chapter 2 sponsored Outdoor
Learning Program. The ethnicity of students served is shown
in Figure 23. All groups were represented, with moreminority students served proportionately by this programthan are enrolled in the District overall.
3326
88.31
Figure 23OUTDOOR LEARNING PROGRAM
ETHNIC COMPOSITION OF STUDENTS
Outdoor Learning Program AISD Total
Hispanic(950) 37.8%
Black
\\\\I(762) 30.3% Hispanic
Other
33.1%
(801) 31.9%Other47.0%
Black19.9%
The cost per student, based on the expenditures of $8,820 asof June 22, 1989 were $3.33.
HOW MANY WODY TRIPS WERE FUNDED?
Figure 24 provides the number of trips funded by school andgrade. All 13 schools participated (5-13 classes at each).
Figure 24TRIPS PROVIDED BY SCHOOL AND GRADE
Classes per GradeSchool 1 3 4 5 6 Total
Andrews - - 4.5 3 7.5
Blanton - - 2.5 2.5 2 7
Brown - 3 3 2 8
Dawson .. 3 3.5 2.5 9
Harris 6 3.5 - 1 10.5
Houston - 5 5 3 13
Linder - 5 4 3 12
Maplewood 3 2 2.5 1.5 1.5 10.5
Reilly - 2.5 2.5 2 7
Ridgetop - 2 2 1 5
Walnut Creek - 3 - 4 7
Wooldridge 6 4 - 3 13
Wooten - 3.5 2.5 2 8
!TOTAL 15 36.5 32 30.5 3.5 117.5*
WERE TRIPS CONSIDERED EFFECTIVE?
The Outdoor Learning Program coordinator received a numberof written comments on response cards from teachers on the
study trips. All comments were positive with responses suchas "Super," "This is the best field trip I've been on," and"It was a great field trip".
27 34
88.31
Also, a sample of teachers and administrators fromelementary schools districtwide were asked to respond to aquestion concerning the Outdoor Learning Program on thedistrictwide staff survey. Nearly three-fourths (72%) ofadministrators agree that field trips coordinated by theOutdoor Learning Program are effective and half (47%) of theteachers found the field trips effective. Among the eightChapter 2 Formula components appearing on the staff surveys,the Outdoor Learning Program expenditures ranked sixth in
effectiveness.
Those who actually are able to participate in the trips aregenerally more positive about the program than the generalpopulation.
*Many teachers have classes, with two different grade levels.These grade levels are usually evenly divided students fromtwo grades (for example high -level fourth grade students ina class with lower level fifth graders).
WICAT COMPUTER LAB INSTRUCTIONAL AIDE
WHAT IS THV WICAT LAB?
The WICAT Computer Lab, housed at Blanton Elementary, as ofJune 22, 1989 spent $14,052 of Chapter 2 Formula funds for1988-89. The funds were used to pay for an instructionalaide to run the lab.
The instructional aides duties are to:
o Be proficient in the technical aspects of running thecomputer system,
o Properly place each child in each curriculum area,
o Advise each teacher on how to get the most from thesystem,
o Help students as they work on the system, and
o Produce teacher reports.
WHAT STUDENT POPULATIONS WERE SERVED?
Every student in grades 1-5 goes to the lab for 30 minutes aday for supylementary reading, language, typing, or
3528

88.31
mathematics computer-assisted instruction. Students inkindergarten and in grade 6 may go to the lab during theirelective period.
The Blanton School population includes ESL, specialeducation, gifted and talented, and bil: gual students inaddition to regular students. All had t p benefit of labuse. Based on a January enrollment of 4.. students, theChapter 2 cost per student was $34.78.
WERE LESSONS IN THE LAB COORDINATED WITH CLASSROOMINSTRUCTION?
Teachers received training from the WICAT Company incoordinating the instruction. Teachers consulted with thelab aide to select curriculum lessons that would produce thebest learning opportunities for the children.
IS THE WICAT LAB EFFECTIVE?
Teachers and administrators at Blanton were asked to ratethe effectiveness of the WICAT Lab on the districtwide staffsurvey. Three-fourths (73%) of the teachers and all theadministrators (1) felt that the WICAT Lab was an effectiveway of developing reading and mathematics skills.
Reading, mathematics, and writing results based on both theITBS and TEAMS were mixed. Compared to similar students onthe ITBS, regression analysis for reading and mathematicsfor grades two to six showed students gained as much aspredicted in five cases, less than predicted in three cases,and more than predicted in two cases. On TEAMS, scoresincreased in five cases and decreases in four at grades onethree and five.
SCHOOL-COMMUNITY LIAISON PROGRAM
WHAT SERVICES WERE PROVIDED BY THE PROGRAM?
Transportation to and from multicultural events, school,orientations, Parent-Teacher Association (PTA) meetings,special trips, and Adopt-A-School activities were among thetypes of activities funded. Students attended events atplaces such as the Johnson City Predatory Hills Resort,McKinney Falls, District Hershey National Track & FieldMeet, Austin Children's Museum, Ballet Folklorico, WaterlooPark, LBJ Library for the "Harlem Renaissance: Art in BlackAmerica" exhibit, and Paramount Theater for "Kinderconcert."In addition, groups of elementary students gave performances
29 :36
INIME111111111.11111M.

88.31
of Folkloric° dancing to peers at other schools. Theyparticipated in tours of important sites in their ownneighborhoods that were unfamiliar to many of them, toinstill school pride. In all, during the 1988-89 schoolyear, 320 buses were paid for by Chapter 2 funds.
WHO USED THE SERVIUS?
The School - Community Liaison Program used its allottedChapter 2 Formula funds to provide transportation servicesfor both parents and students. Funds were available for useby all elementary and secondary schools and special campusessuch as the alternative schools and Clifton Center.
HOW MANY STUDENTS WERE SERVED?
Based on an estimate of 60 students per bus and fiveparents, approximately 19,200 people were served (parentsserved as chaperons and used buses for conference meetingswith teachers, PTA events, etc.).
WERE FUNDS CONSIDERED EFFECTIVE?
Elementary and secondary campus administrators were asked toevaluate the effectiveness of the School-Community LiaisonProgram in facilitating parent and student involvement inspecial activities. "Neutral" (46%) was the most commonresponse chosen by campus administrators, followed by"agree" (38%), and "disagree" (16%) responses.
r---
PREKINDERGARTEN UNITS
WHAT PURPOSE DO PRE-KINDERGARTEN UNITS SERVE?
Since the mid-seventies, AISD has had federally funded full-day pre-kindergarten classes for low-achieving children.House Bill 72 provided for half-day pre-kindergarten forLimited-English-Proficient (LEP) and low-income children.Using local and State funds for the first time, AISD servedchildren with a full-day program in 1985 -1936 with half paidfrom Chapter 1 federal funds. During the 1988-89 schoolyear, there were 7b full-day Pre-K classes and 34 half-dayclasses, with funding for one-half of 73 of the full-dayclasses paid for with Chapter 1 funds. Chapter 2 Formulafunds were used to pay for one half-time teacher at Blantonand three at Travis Heights. A total of 72 students wereserved at the two Chapter 2 Formula schr,ols.
3730
88.31
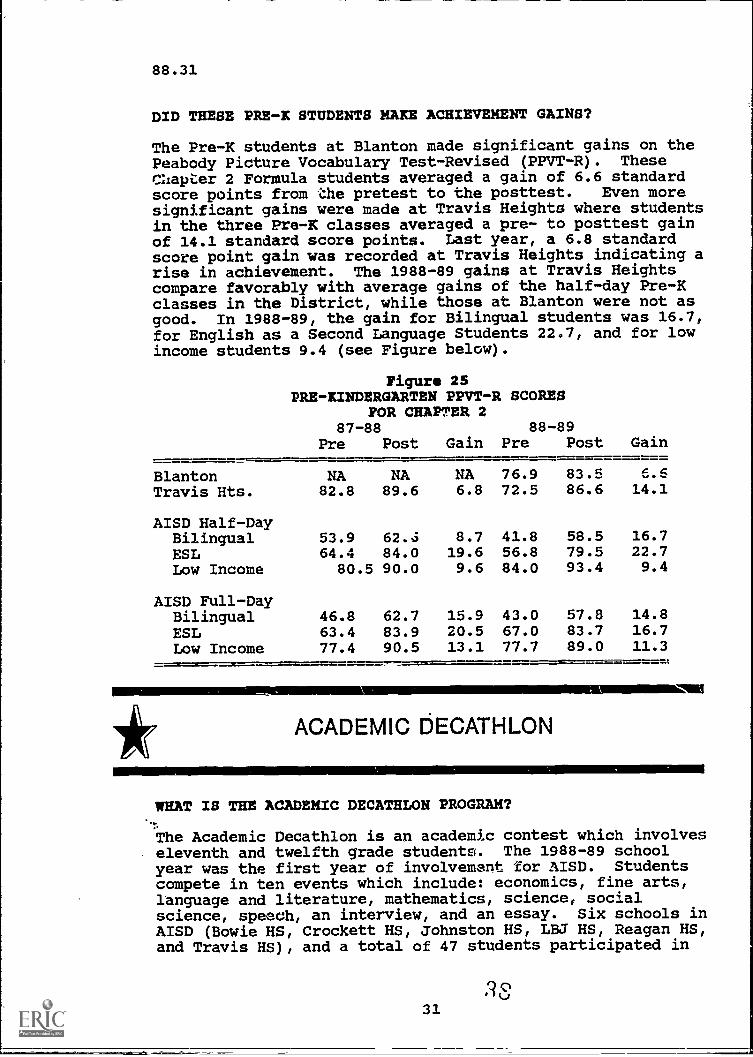
DID THESE PRE -X STUDENTS MAKE ACHIEVEMENT GAINS?
The Pre-K students at Blanton made significant gains on thePeabody Picture Vocabulary Test-Revised (PPVT-R). Thesealapter 2 Formula students averaged a gain of 6.6 standardscore points from the pretest to the posttest. Even moresignificant gains were made at Travis Heights where studentsin the three Pre-K classes averaged a pre- to posttest gainof 14.1 standard score points. Last year, a 6.8 standardscore point gain was recorded at Travis Heights indicating arise in achievement. The 1988-89 gains at Travis Heightscompare favorably with average gains of the half-day Pre-Kclasses in the District, while those at Blanton were not asgood. In 1988-89, the gain for Bilingual students was 16.7,for English as a Second Language Students 22.7, and for lowincome students 9.4 (see Figure below).
Figure 25PRE - KINDERGARTEN PPVT-R
FOR CHAPTER 287-88
Pre Post Gain
SCORES
88-89Pre Post Gain
Blanton NA NA NA 76.9 83.5 6.6Travis Hts. 82.8 89.6 6.8 72.5 86.6 14.1
AISD Half-DayBilingual 53.9 62.S 8.7 41.8 58.5 16.7ESL 64.4 84.0 19.6 56.8 79.5 22.7Low Income 80.5 90.0 9.6 84.0 93.4 9.4
AISD Full-DayBilingual 46.8 62.7 15.9 43.0 57.8 14.8ESL 63.4 83.9 20.5 67.0 83.7 16.7Low Income 77.4 90.5 13.1 77.7 89.0 11.3
111141.......
ACADEMIC DECATHLON
WHAT IS THE ACADEMIC DECATHLON PROGRAM?
The Academic Decathlon is an academic contest which involveseleventh and twelfth grade students. The 1988-89 schoolyear was the first year of involvement for AISD. Studentscompete in ten events which include: economics, fine arts,language and literature, mathematics, science, socialscience, speech, an interview, and an essay. Six schools inAISD (Bowie HS, Crockett HS, Johnston HS, LBJ HS, Reagan HS,and Travis HS), and a total of 47 students participated in
.3831

88.31
these contests with schools from other districts. Eachschool had two coaches (usually teachers or administrators)who assisted the students in preparation for the contests'.Each team is made up of three Honor students, threeScholastic students, and three Varsity students who have thefollowing grade point average definition:
Hon(r 3.75-4.00 GPAScholastic 3.00-3.74 GPAVarsity 0.00-2.99 GPA
Each team member competes in all ten events of the Decathlonand is eligible for individual medals in all ten events.
Students are usually recommended by teachers and then chooseto participate at their discretion. Students do not receiveany credit and all participation is voluntary.
In 19l)8 -89, a total of $17,901 in Chapter 2 Formula fundswere spent as of June 22, 1989 for the Academic Decathlon.These funds were used for stipends for the coaches, books,and testing/ evaluation materials.
WHAT WERE THE CHARACTERISTICS OF PARTICIPATING STUDENTS?
All major ethnic groups were represented (see vigures 26 &27). However, Blacks and Hispanics on the Acadt.:qicDecathlon teams were less well represented than tL.1irnumbers in the District. While Blacks and Hispanics make up53% of the district, they represented 30% of the AcademicDecathlon teams. Overall, there were 21 eleventh gradersand 26 twelfth graders involved. Figure 28 shows gendercharacteristics of the program participants (62% were maleand 38% were female).
Figure 26ACADEMIC DECATHWN
ETHNIC COMPOSITION OF STUDENTS
Hispanic(7) 15%
Black(7) 15%
Other(33) 70%
Competing Teams
33%\
HispanicBlack20%
Other47%
AISD Total
3932

88.31
10
Figure 27ACADEMIC DECATHLON
ETHNIC COMPOSITION OF STUDENTS BY SCHOOL
Bowie Crockett
# *r2
0 0 /rr 0 M 0 '1 irr L.
Johneton L.B.J. Reagan
High SchoolsEthnicity
NM Asian Metal* =Hispanic Mg Other
Travis
Figure 28GENDER OF ACADEMIC DECATHLON PARTICIPANTS
Mere82%
Female38%
WAS THE DECATHLON CONSIDERED EFFECTIVE?
According to responses to the teacher/administrator survey,39% of teachers and administrators felt that both theDistrict and students benefitted from participation in the
-Academic Decathlon. In addition, 45% believe that theAcademic Decathlon competition is an effective way to
promote academic vccellence. Of those familiar with theprogram (87%), most were neutral (42%) or positive (52%).Among the eight Chapter 2 Formula programs which appeared oathe staff surveys, the Academic decathlon ranked seventh in
effectiveness.
3340

88.31
lir PROGRAM EFFECTIVENESS COMPARISON
Teachers and administrators received questions aboutspecific Chapter 2 programs on the districtwide survey.Respondents were asked to evaluate the effectiveness of
various programs. The percentage of respondents who wereneutral was fairly high for some programs. Here is thepercentage responding positively:
% of Respondents Agreeingthat the Program is EffectiveProgram
Peer Assistance andLeadership Program (PAL)
Homework Pilot
TEAMS Materials
Outdoor Learning Program(Field trips)
WICAT Computer Lab(Asked at Blanton only)
Johnston ComprehensiveCompetencies Lab(Asked at Johnston only)
'1Academic Decathlon
54.8% (Helping studentswith academic andattendance problems)
62.0% (Working withpotential dropouts)
47.1% (Helping studentswith drug or alcoholproblems)
65.4% (As a listeningear)
42.5%
70.3%
48.5%
74.1%
63.0%
45.5%
Project ASSIST 58.3%
(Asked at Blanton, Blackshear, and WooldAdge)
4134
88.31
BIBLIOGRAPHY
Eugene, Darrick, et. al. (1988). Chapter 2 Formula: 1987-88 Final Technical Report (ORE Publication Number87.14). Austin,.TX: Austin Independent SchoolDistrict, Office of Research and Evaluation.
Moede, Lauren, Lesley Swanson and Nancy Baenen. (1988).Chapter 2 Formula: 1987-88 Final Report (OREPublication Number 87.15). Austin, TX: AustinIndependent School District, Office of Research andEvaluation.
Moede, Lauren. (1987). Chapter 2 Formula: 1986-87 FinalTechnical Report (ORE Publication Number 86.10).Austin, TX: Austin Independent School District, Officeof Research and Evaluation.
4235

83.32
Chapter 2 Formula
Appendix A
Peer Assistance and Leadership Program
Appendix-A43
1
88.32
CHAPTER 2 FORMULA
Peer Assistance And Leadership Program
Procedure
Information on the Peer Assistance and Leadership Program(PAL)(TEA No. X3360100) was obtained using three methods,student survey, teacher and administrator survey, andprogram records. Each of these methods will be describedbelow.
Student Survey
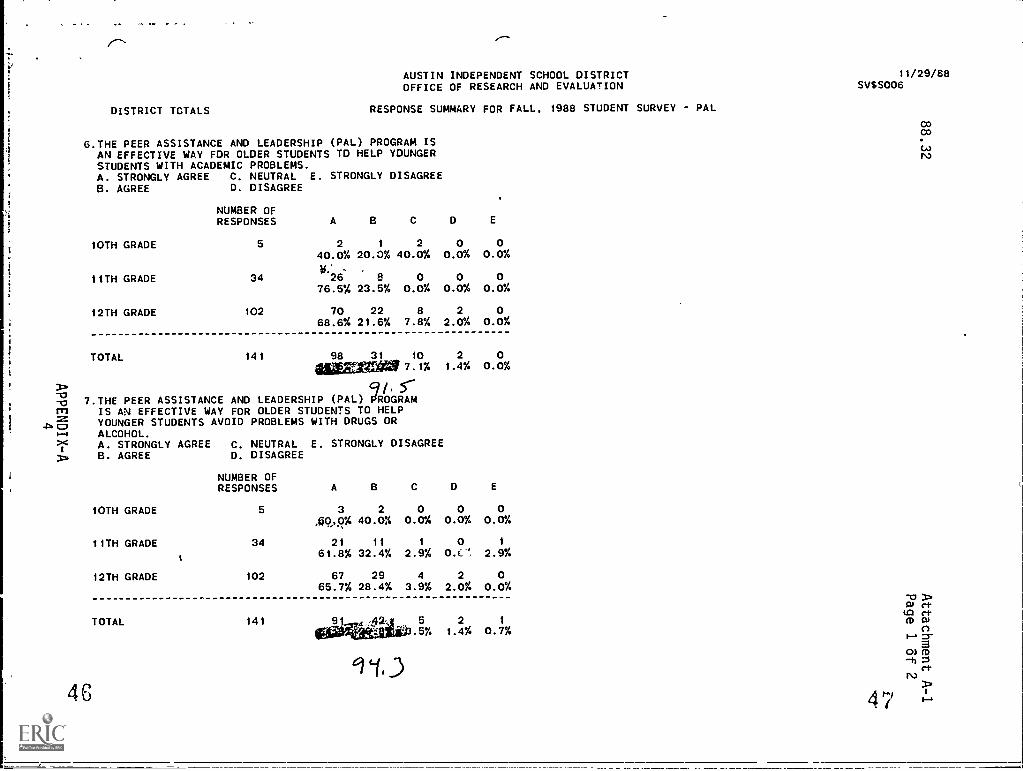
During the fall, 1987, semester a districtwide survey of allhigh school students was conducted from November 7-11. Atotal of 90 items were included in the item pool, and eachstudent received from 11 to 24 of these items, depending ongrade level and special program membership. Surveys weredistributed to 15,351 students; 13,186 :;f these surveys werereturned, for a return rate of 86%. At the end of October,1988, PAL items for the student survey were given to thestudent survey coordinator. In December the survey resultswere returned. There were four PAL items in the studentitem pool. The questions and responses to the four PALitems are listed in Attachment A-1.
Program Records
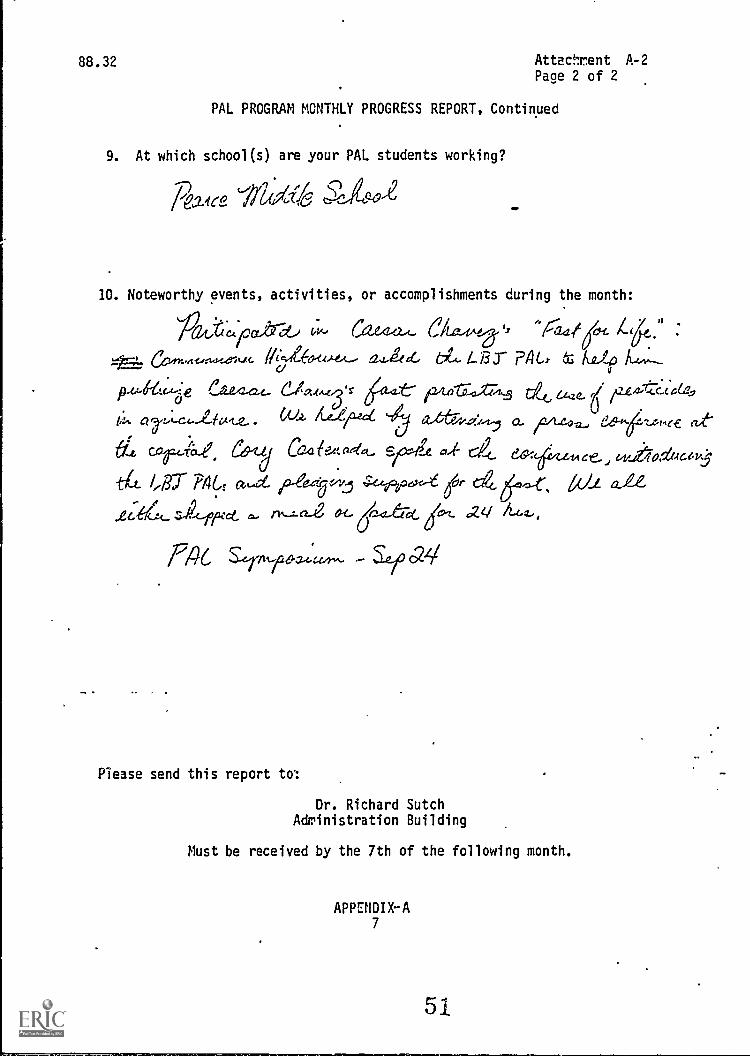
Arrangements were made with the PAL program coordinator forthe monthly progress reports to be forwarded to the Chapter2 evaluation associate (see Attachment A-2). These monthlyreports were used to obtain the number of schools andstudents served by the 7AL program. Also, an ORE evaluatortaveloped a report to collect information on studentsserved. These reports were summarized by the ORE evaluatorand submitted to the Chapter 2 evaluation associate.However they were not used in the Chapter 2 final report.
Districtwide Teacher/Administrator Survey
The Office of Research and Evaluation regularly conductssurvey- of District teachers and administrators. In 1988-89, the teacher/administrator survey was conducted in thespring and included all teachers and administrators. Thesurvey was administered March 7 - March 24, 1989 andincluded 283 items overall. Of these items, teachersreceived 28-48 items per survey, other professionalsreceived 33-48 items per survey, and administrators reeived28-44 items per survey. The return rate for teachers, other
Appendix-A2
44

88,32
professionalsrespectively.The questionsin Attachment
and administrators was 96%, 87%, and 90%There were four PAL items in the item pool.and responses to the four PAL items are listedA-3.
5
Appendix-A3
AUSTIN INDEPENDENT SCHOOL DISTRICT 11/29/88OFFICE OF RESEARCH AND EVALUATION SV$S006
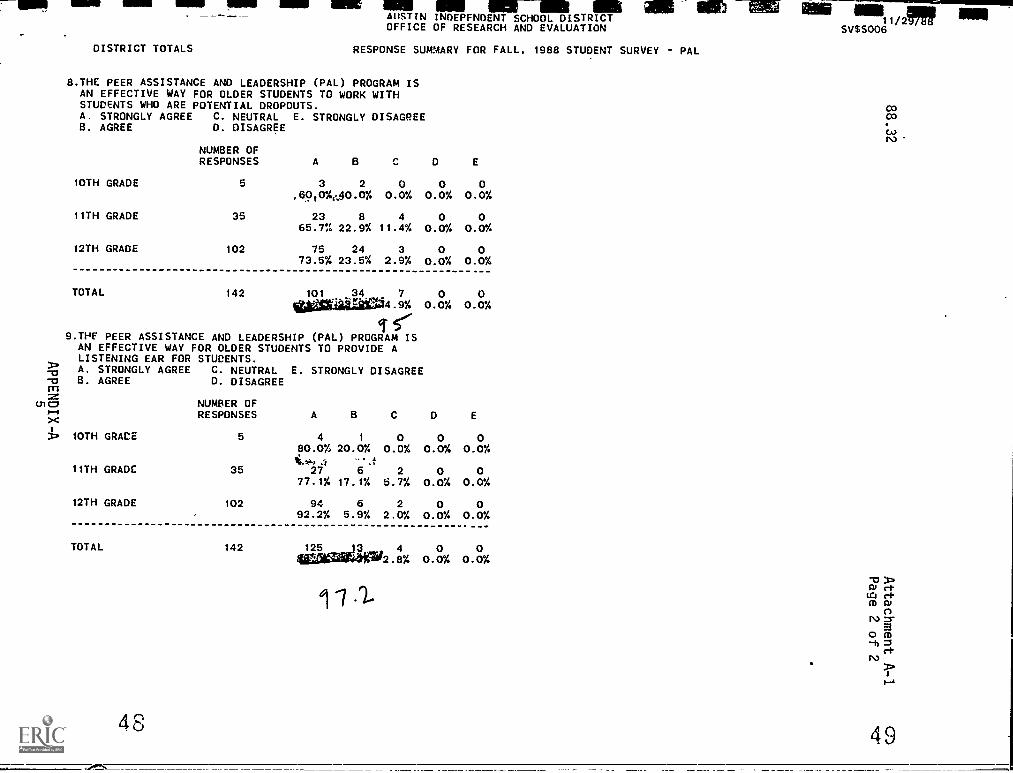
DISTRICT TOTALS RESPONSE SUMMARY FOR FALL, 1988 STUDENT SURVEY - PAL
6.THE PEER ASSISTANCE AND LEADERSHIP (PAL) PROGRAM ISAN EFFECTIVE WAY FOR OLDER STUDENTS TO HELP YOUNGERSTUDENTS WITH ACADEMIC PROBLEMS.A. STRONGLY AGREE C. NEUTRAL E. STRONGLY DISAGREEB. AGREE D. DISAGREE
NUMBER OFRESPONSES
10TH GRADE 5
11TH GRADE 34
12TH GRADE 102
TOTAL 141
A B
2 1 2 0 040.0% 20.0% 40.0% 0.0% 0.0%
26 8 0 0 076.5% 23.5% 0.0% 0.0% 0.0%
70 22 8 2 068.6% 21.6% 7.8% 2.0% 0.0%
98 31 10 2 0GEESZEMX 7.1% 1.4% 0.0%
. 97.THE PEER ASSISTANCE AND LEADERSHIP (PAL) pRO1GRAM
zrsi IS AN EFFECTIVE WAY FOR OLDER STUDENTS TO HELP
-Pbc7YOUNGER STUDENTS AVOID PROBLEMS WITH DRUGS OR
p...4 ALCOHOL.>< A. STRONGLY AGREE C. NEUTRAL E. STRONGLY DISAGREE
::.B. AGREE D. DISAGREE
46
NUMBER OFRESPONSES
10TH GRADE 5
11TH GRADE 34
12TH GRADE 102
TOTAL 141
A
3 2 0 0 0,69,4F% 40.0% 0.0% 0.0% 0.0%
21 11 1 0 1
61.8% 32.4% 2.9% 0.C, 2.9%
67 29 4 2 065.7% 28.4% 3.9% 2.0% 0.0%
taiggettio . 5% 1.4% 0.7%2 1
47
>sv ct(t3 ctfl)
a0) (D
ctN.)
DISTRICT TOTALS
um me OINK III. 11111 11111 11111 111111AUSTIN INDEPENDENT SCHOOL DISTRICT 11/2", 111111OFFICE OF RESEARCH AND EVALUATION SV$S006
RESPONSE SUMMARY FOR FALL, 1988 STUDENT SURVEY - PAL
8.THE PEER ASSISTANCE AND LEADERSHIP (PAL) PROGRAM ISAN EFFECTIVE WAY FOR OLDER STUDENTS TO WORK WITHSTUDENTS WHO ARE POTENTIAL DROPOUTS.A. STRONGLY AGREE C. NEUTRAL E. STRONGLY DISAGREEB. AGREE D. DISAGREE
NUMBER OFRESPONSES A
10TH GRADE 5 3 2 0 0 0.6910%,..40.0% 0.0% 0.0% 0.0%
11TH GRADE 35 23 8 4 0 065.7% 22.9% 11.4% 0.0% 0.0%
12TH GRADE 102 75 24 3 0 073.5% 23.5% 2.9% 0.0% 0.0%
TOTAL 142 101 34. 7 0 0Igialiaj2034.9%
I 1r'
0.0% 0.0%
9.THE PEER ASSISTANCE AND LEADERSHIP (PAL) PROGRAM ISAN EFFECTIVE WAY FOR OLDER STUDENTS TO PROVIDE ALISTENING EAR FOR STUDENTS.
0-0niz
to GI
>c,..4
3:.
A STRONGLY AGREEB. AGREE
10TH GRACE
11TH GRADE
12TH GRADE
TOTAL
C. NEUTRAL E. STRONGLY DISAGREED. DISAGREE
NUMBER OFRESPONSES A B C
5 4 1 080.0% 20.0% 0.0%
35 27 6 277.1% 17.1% 5.7%
102 94 6 292.2% 5.9% 2.0%
142 itatughai 42.8%
D
00.0%
00.0%
00.0%
00.0%
E
00.0%
00.0%
00.0%
00.0%
4849
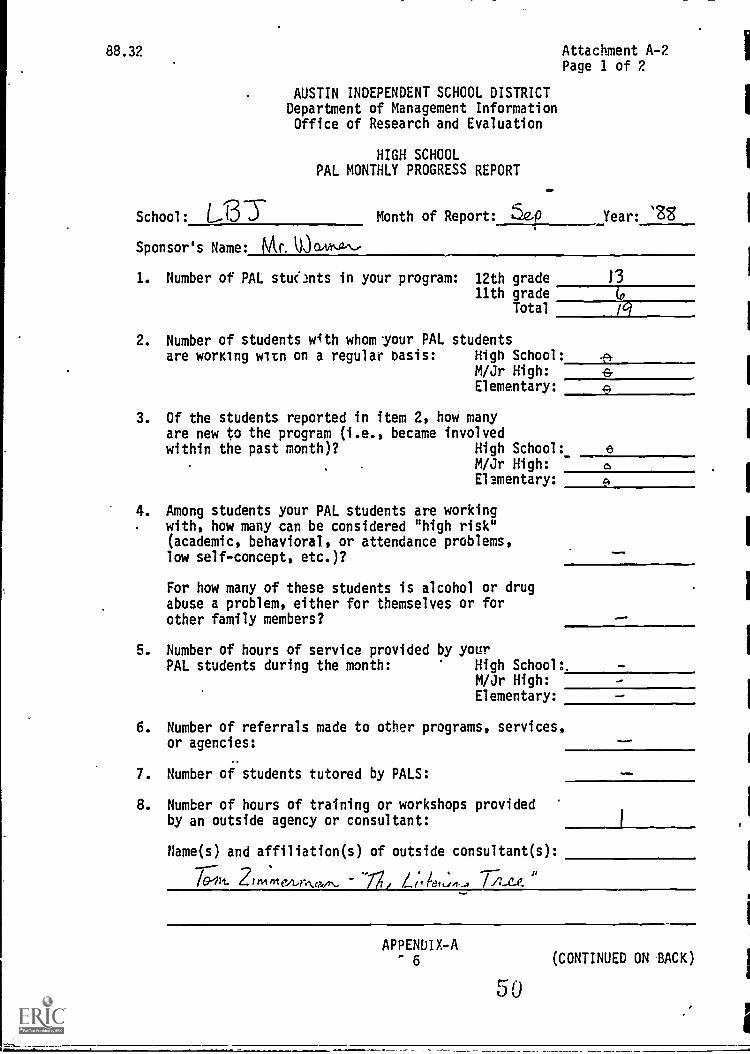
88.32 Attachment A-2 1Page 1 of 2
AUSTIN INDEPENDENT SCHOOL DISTRICTDepartment of Management InformationOffice of Research and Evaluation
HIGH SCHOOLPAL MONTHLY PROGRESS REPORT
1
3. Of the students reported in item 2, how manyare new to the program (i.e., became involvedwithin the past month)? High School: e
M/Jr High: aElementary: e
4. Among students your PAL students are workingwith, how many can be considered "high risk"
I(academic, behavioral, or attendance problems,low self-concept, etc.)?
_.
For how many of these students is alcohol or drugabuse a problem, either for themselves or forother family members? _.
5. Number of hours of service provided by your I
PAL students during the month: High School:. -M /Jr High: -
Elementary:I
I.....
6. Number of referrals made to other programs, services,or agencies:
7. Number of students tutored by PALS: --
8. Number of hours of training or workshops providedby an outside agency or consultant:
Name(s) and affiliation(s) of outside consultant(s):
I
21 /Si 41 e.4.46A.c?,./A21 /Si 41 e.4.46A.c?,./A
other programs, services,or agencies:
7. Number of students tutored by PALS: --
8. Number of hours of training or workshops providedby an outside agency or consultant:
Name(s) and affiliation(s) of outside consultant(s):
I
I
APPENDIX-A6 (CONTINUED ON 'BACK)
I
1
APPENDIX-A6 (CONTINUED ON 'BACK)
88.32 Attactment A-2
Page 2 of 2
PAL PROGRAM MONTHLY PROGRESS REPORT, Continued
9. At which school(s) are your PAL students working?
Raitee /Id
10. Noteworthy events, activities, or accomplishments during the month:
lit,t.y.cx,tra c;,,, Ca-64/2A- 0 04A t 421( tC. . 1 46....
vst,e144411.1 4b4a,,,_,... ezaa, tle.A.G.BY Fill., eis Allf A.4,,..-
ei.A.,..3., ,KAk Or-Cc.-41,,q4..e. CU.A. /Cf.1?/ (,14,, a /CAI-4a, de-sttei4e.e ezt
tke. porAe &-z CanfeAtacL. S _e 0.,I e4 edo: tie,(4,..Aducm.:3,LI
-44 7 c4,0,,
zje-44_. acw.cce, ., nr.,...:47-e O. d...4, 62t z(=,I- .2 A/
Pilk, S-efitia6,0.4..,:t4, - See C24
Please send this report to:
Dr. Richard SutchAdministration Building
Must be received by the 7th of the following month.
APPENDIX-A7
PROGRAM: SV$EM019 AUSTIN INDEPENDENT SCHOOL DISTRICTDEPARTMENT OF MANAGEMENT INFORMATIONOFFICE OF RESEARCH AND EVALUATION
SPRING, 1989 EMPLOYEE SURVEY RESPONSE SUMMAAY -CHAPTER I
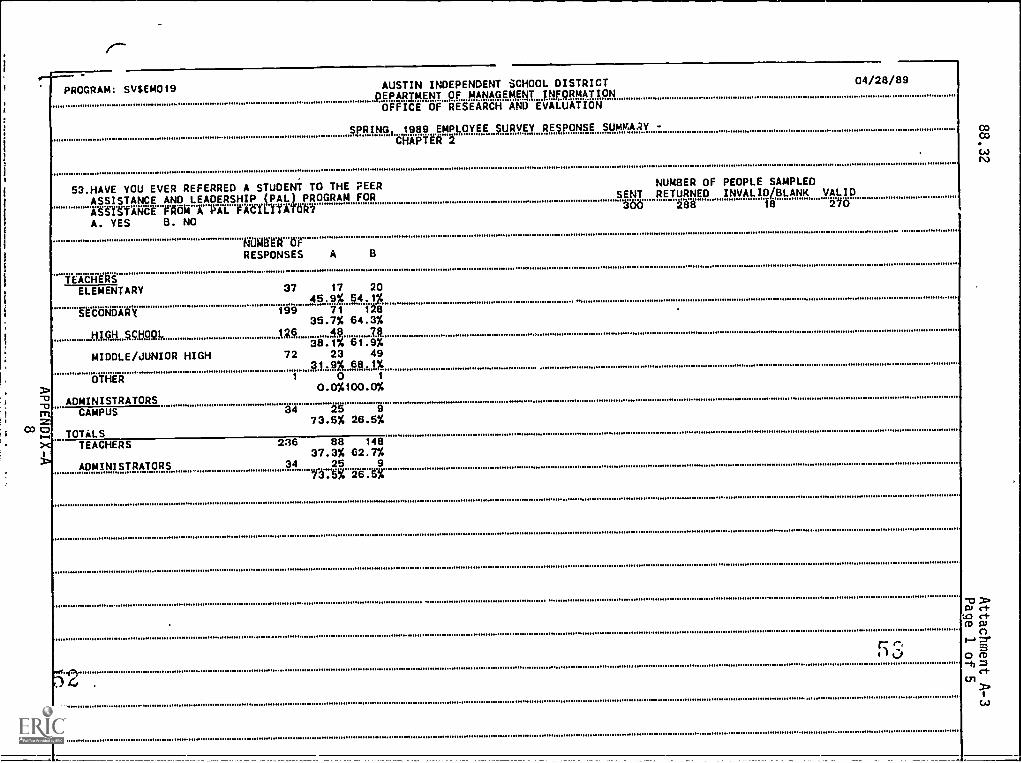
53.HAVE YOU EVER REFERRED A STUDENT TO THE PEERASSISTANCE AND LEADERSHIP iPA9 PROGRAM FOR"T§tYtTUCEPOWIOltFAULMA. YES B. NO
NOWA-0RESPONSES A 8
TEACHERSELEMENTARY
SECONDARY
H10.50444
MIDDLE /JUNIOR HIGH
OTHER3m-a ADMINISTRATORSm CAMPUS
Co o1-1 TOTALS
TEACHERS
ADMINISTRATORS
NUMBER OF PEOPLE SAMPLEDSENT RETURNED INVALID/BLANK VALIDN)e) 18 2/6
37 17 20
199 71 di35.7% 64.3%
' ' 2.1).38.17! 81.9%
72 23 4931.9%"68,1X
1 0 1
0.0%100.0%
34 25 973.5% 26.5%
236 88 14837.3% 62.7%
34 25 9/3.0: 26.Bg

---AUSTIN-1140EPENOENT-SCHOOL DISTRICTOEPARTNOT OF MAN.AUMENT INFORMATIONOFFICE OF RESEARCH AND EVALUATION
-- -- .04/28/89
SPRING, 1989 EMPLOYEE SURVEY RESPONSE SUMMARY -CHAPTk 2
.54.THE PEER ASSISTANi:E AND LEADERSHIP (PAL) PROGRAM NUMBER DF PEOPLE SAMPLEDSENT RETURNED INVALID BLANK VALIDIS AN EFFECTTVE WAY FOR PEER FACILITATORS TD HELP
ttURNICWffii AZWATC-WaCENWINtrATTERVAUCt. 1t6 10 iS5
A. STRONGLY AGREE8. AGREEC. NEUT011.
TEACHERS
D. DISAGREEE. STRONGLY DISAGREEF. tiONTY-ROW
NUMBER OFRESPONSES A
ELEMENTARY 21 3 9 2 1 0 614.3% 42.9% 9.5% 4.8% 0.0% 28.6%
SgCONDARy 194 li 3a 24 9 2 N10.7% 35.0% 23.314 8.7% 2.97 19.4%
HIGH SCHOOL 61 5 25 14 5 0 128.2A 41.0% 23.9% 8.2% 0.0119,7%
MIDDLE/JUNIOR HIGH 41 6 11 10 4 3 7
14.6% 26.8% 24.4% 9.8% 7.3% 17.1%OTHER 1 0 0 0 0 0 1
0.08 0.0g 0.0g 0.0g 0.0%100.0gADMINISTRATORS
CAMPUS 23 12 7 2 0 0 2
52.28 30.4 8.7,8 CO .g 0.0% 0.78CENTRAL 8 3 4 0 0 0 1
37.5% 50.0% 0.0% 0.0% 0.0% 12.5%TOTALSTEACHERS 124 94 45 26 10 3 26
11 3% 36.3% 21.0% 8 1% 2.4% 21.0%ADMINISTRATORS 31 15 11 2 0 0 3
48.4% 35.5% 6.5% 0.0% 0.0% 9.7%
4
't
5.455
0303

! : SV$EM019 AUSTIN INDEPENDENT SCHOOL DISTRICT(APARTMENT OF MANAGEMENLINFORMATIONOFFICE OF RESEARCH AND EVALUATION
04/28/89
SPRING, ..1989 EMPLOYEE SURVEY RESPONSE SUMMARY -CHAPTER 2
55.THE rcER ASSISTANCE AND LEADERSHIP (PAL) PROGRAM IS NUMBER OF PEOPLE SAMPLED
AN EFFECTIVE WAY FOR PEER FACILITATORS TO HELP STU- SENT RETURNED INVALID/BLANK VALID
DEN tt AVOID PROLES efil Nifdt--0 ArtNot.. 1/Y in 4i TO-A. STRrVGLY AGREE D. DISAGREEB. AGREE E. STRONGLY DISAGREE
TEACHERSELEMENTARY
SUONDARY
HIGH SCHOOL
MIDDLE/JUNIOR HIGH
OTHER
ADMINISTRATORSCAMPUS
CENTRAL
TOTALSg
tTEACHERS
ADMINISTRATORS
NUMBER OFB CRESPONSES A
18 2 2. 711.1% 11.1% 38.9%
1Q1 M.10.9X 33.7X 25.7X
59 4 21 196.0%. 35.6X 32. Vt..
41 7 13 717.1% 31.7% 17.1%
1 0 0 0o.og 0.65 oriig
24 6 9 525.0:4 37.5:4 20.8%
10 4 : 240.0% 40.0 20.0%
119 13 36 33imy09,4 27.7&
34 10 13 729.4% 38.2% 20.6%
D E F
1 0 65.6% 0.0% 33.3%
9.9% 3.0X 16.8%6 1 8
10 . zt_ 1.71_13.04 2 8
9.8% 4.9% 19.5%O 9.
o.og- o.ogloo.og
O 1 3ChOg 4.2 12.57:
O 0 00.0% 0.0% 0.0%
11 3 239.2L 2.5X 19.3
O 1 30.0% 2.9% 8.8%
57
0303
N3
>go cf.(Qcf(Do'0co=aO(l)
-41rt.
cn

AUSTIN INDEPENDENT SCHOOL:*DISIRICI(419,RTKNT of mANAgia MT iNFgRKUJONOFFICE OF RESEARCH ANO EVALUATION
Amr.18/89-
SpRING 1969 EMPLOYEf SURVEY RESpONSE sUMMARY -CHAPfn
56.THE PEER ASSISTANCE AND LEADERSHIP (PAL) PROGRAM IS--AN EFFECTIVE WAY FOR PEER FACILITATORS TO WORK WITHtfiRSEAfr WRECIWOOTENTIAL otOVOint.A. STRONGLY AGREEB. AGREEC. NEUTRAL
TEACHERS.,
D. DISAGrEEE. STRONGLY DISAGREEP. NWT kNOW
NUMBER OFRESPONSES A
ELEMENTARY 17 4 9 2 2 0 023.5% 52.9% 11.8% 11.8% 0.0% 0.0%
sfcoNDARY 19,42 44 32 p 4 g 1321.0% 32.0% 28.0% 4.0% 2.0% 13.0%
HIGH SCHOOL 68 14 23 19 3 2 720.61' 33.8% 27.9%. 4.4% 2.9% 10.3%
(IDDLEAJUNIOR HIGH 32 7 9 9 1 0 621.9% 28.1% 28.1% 3.1% 0.0% 18.8%
ADMINISTRATORSCAMPUS 14 4 8 1 1 0 0
28.6% 57.1% 7.1% 7.1% O.0% 0.0%CENTRAL 11 6 4 0 0 1 0
54.6%.36.4%. 0.0% 0.0% 9.1% 0.0%TOTALS
TEACHERS 117 25 41 30 6 2 1321.4% 35.0% 25.6% 5.1%. 1.1%-ii.fg
ADMINISrRATORS 25 10 12 1 1 1 040.0148.0% 4.0%
NUMBER OF PEOPLE SAMPLEDSENT RETURNED INVALID/BLANK VALID154 147 5
59
COCO
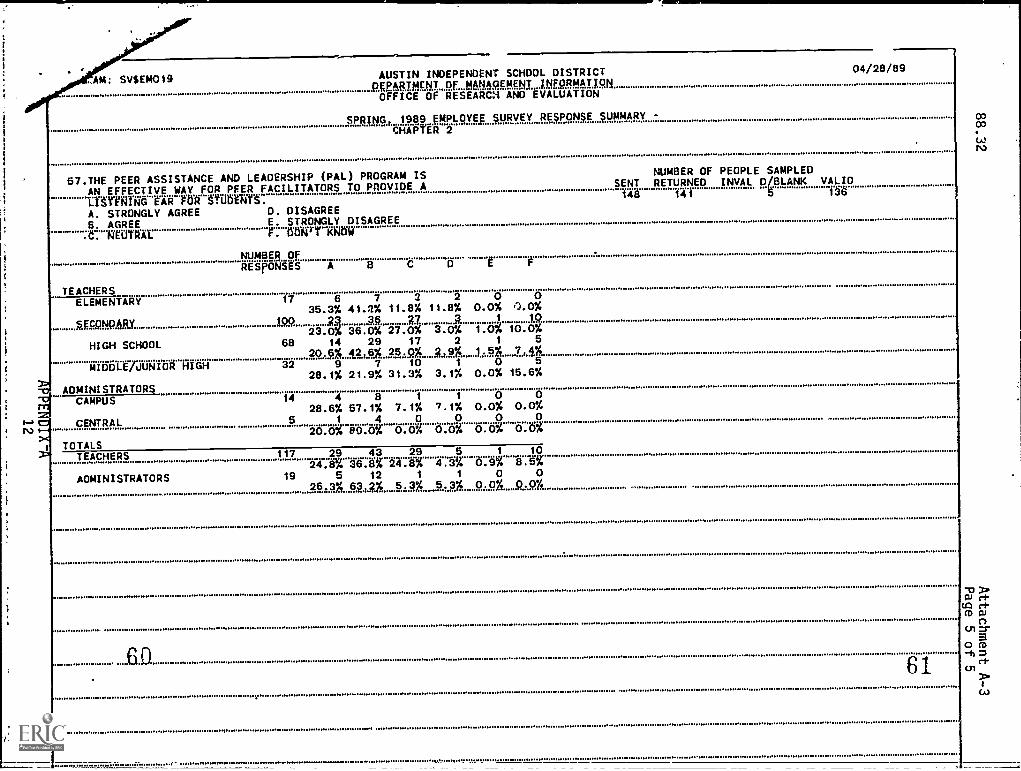
AM: SV$EM019
!
1
1
AUSTIN INDEPENDENT SCHOOL DISTRICTKPARTMENT OF MANAggMfMLINE0RMATJONOFFICE OF RESEARCX AND EVALUATION
04/28/89
SPRING, 1989 EMPLOYE SURVEY RESPONSE SUMMARY -CHAPTER 2
57.THE PEER ASSISTANCE AND LEADERSHIP (PAL) PROGRAM ISAN EFFECTIVE WAY FOR PEER FACILITATORS TO POOVIDE A
LISYTNiNG EAR tlt alt.
A. STRONGLY AGREE6. AGREE:Z. RAMC"
TEACHERSELEMENTARY
D. DISAGREEE. STRONGLY DISAGREEP.-67M7Y Mar
NUMBER OFRESPONSES A B C
17 6 7 235.3% 41.2% 11.8%
D
211.8%
E
00.0%
0.0%
BfCDARyN0 1914 2123.0%
PQ36.0%
2727.0%
P3.0%
A1.0%
1Q10.0%
HIGH SCHOOL 68 14 29 17 2 1 5206% 42.6% 25.9% ;,9% 1.5% 74%
MIDDLE/JUNIOR HIGH 32 9 7 10 1 0 5
28.1% 21.9% 31.3% 3.1% 0.0% 15.6%
ADMINISTRATORSCAMPUS 14 4 8 1 1 0 0
28.6% 57.1% 7.1% 7.1% 0.0% 0.0%
CENTRAL 5 1 4 o o o o
20.0% 80.0% 0.0% 0.0% 0.0% 0.0%
TOTALSTEACHERS 117 29 43 29 5 1 10
24.8% 36.6% 24.8% 4.34 0.9% 8.5%
ADMINISTRATORS 19 5 12 1 1 0 026.3% 63.2%. 5.3% 5.3% 0.01_9.07
NUMBER OF PEOPLE SAMPLED
41SENT
46RETURNED INVAL %
04BLANK VALID
( 1
6.D 61
.44
W rPUZ rPrD Wn
01z-a
O CD
UirP
cA)

88.32
Chapter 2 Formula
Appendix B
PROJECT ASSIST
Appendix-B1
13 2

88.32
88.32
CHAPTER 2 FORMULA
PROJECT ASSIST
Procedure
Project ASSIST Logs
The instructional monitors at the three Project ASSISTschcols (Blackshear, Blanton, and Wooldridge) were sent amemo (see files) explaining that they would be provided witha computer-generated printout (see files) to use to recordthe referrals to the ASSIST classroom. Each printoutcontained an alphabetical listing of the students in eachgrade level at each of the four schools. The dates for eachsix weeks during the 1988-89 school year were listed incolumns. If a student spent any time in the ASSISTclassroom during any day of the six weeks, the monitorrecorded the date in the row of that student's name and inthe appropriate column for that six weeks.
Monitors were instructed to add names of new students to theprintout if they were referred to the ASSIST classroom andtheir names were not listed on the current printout. Theprintouts at each school were examined during the first sixweeks for irregularities. However, all instructionalmonitors were using the printouts as instructed.
The student identification numbers of students referred toASSIST were entered on a CRT screen into a Project ASSISTdata file (DE @ASST). These student identification numberswere collected from the instructional monitors at the end ofthe 88-89 school year. A SAS program (DE$002) was used tomerge the data file with the Student Master File in order totabulate frequency taoles of sex by school, grade by school,and ethnicity by, school. The Project ASSIST file was mergedwith the Special Education File in order to tabulate afrequency table of special education status by school.
OSA Files The Office of Student Affairs maintains a file(OSA) on AISD students receiving suspensions and corporalpunishment, Prior to the 1984-85 school year, suspensionswere categorized as short (1-3 days), intermediate (4-10days), or long (more than 10 days). During the 1984-83school year, a short suspension could run from one to fivedays, and the categories of intermediate and long termsuspensions were eliminated. In their place, the categoriesof expulsion or removal were created, and a student could be
Appendix -B2

88.32
suspended for any number of days. The categories were againrevised for the 1985-86 school year. They were:
o Compelling (1-5 day suspension)o Pre-Hcaring (1-5 day suspension)o Removal to Alternative Education Program (secondary
only), ando Expulsion.
Records from the Office of Students Affairs contain the typeof suspension, the total number of days the student misseddue to the suspension, the student's Special Educationstatus as well as the student's school code. Because datafor the category including students removed to analternative education program was available only for the1985-86 .year, it was not used in comparing incidences ofsuspension. A program was developed by an Office ofResearch and Evaluation programmer to obtain the suspensionand corporal punishment data from the OSA file. Because ofthe changes in categories for suspensions, data inindividual categories could not be compared across years.Instead, the total number of disciplinary actions wascompared.
Districtwide TeacherLAdministrator Survey
The Office of Research and Evaluation regularly conductssurveys of District teachers and administrators. In 1988-89, the teacher/administrator survey was conducted in thespring and included all teachers and administrators. Thesurvey was administered March 7 - March 24, 15'1 andincluded 283 items overall. Of these items, t achersreceived 28-48 items per survey, other professionalsreceived -;3-48 items per survey, and administrators reeived28-44 items per survey. The return rate for teachers, otherprofessionals and administrators was 96%, 87%, and 90%respectively. An item on the ASSIST program was included inthe item pool. Responses to this item are included inAttachment B-1.
Appendix -B3
PA.

-0
: SVSEM019 AUSTIN INDEPENDENT SCHOOL DISTRICTpgPARTMENT OF MANAGEMENT INFORMATIONOFFICE OF RESEARCH AND EVALUATION
04/28/89
SPRING 1989 EMPLOYEE SURVEY RESPONSE SUMMARY -&Java/2 2
60.DO YOU THINK THE REDUCTION IN THE NUMBER OF SUSPEN- NUMBER OF PEOPLE SAMPLEDSIONS AND EXPULSIONS IN THE THREE PROJECT ASSIST SENT RETURNED INVALID/BLANK VALIDtcHboLt Yt DUE Mont 16 big utg Or dlAttn,t AtattV tO to 6 ti
THERAPY OR THE AVAILABILITY OF THE ASSIST ROOM?A. GLASSER'S REALITY THERAPY METHODSC AialagnITY Urfa AnTtl-AlibM
NUMBER OF
TEACHERS
RESPONSES A
ELEMENTARY 47 8 3917.0% 83.0%
OTHER PROFESSIONALS1 CAMPUS 4 2 2
50.0% 50.0%TOTALSTEACHERS
OTHER PROFESSIONALS
47 8 3917.0% 83.0%
4 2 2
50.0% 50.04
61.1 THINK THE ASSIST PROGRAM IS EFFECTIVE IN GRADES: NUMBER OF PEOPLE SAMPLED(CHOOSE ALL THAT APPLY) SENT RETURNED INVALID/BLANK VALID
A. K-3 B. 4-d 6.1;16f-WafIVE XN ANY ORA6E trl 52 4 48
TEACHERS
NUMBER OFRESPONSES A
ELEMENTARY 51 12 20 19
OTHER PROFESSIONALSCA".PUS 9 4 4 1
TOTALSTEACHERS 51 12 20 19
OTHER PROFESSIONALS 9 4 4 1

88.32
Chapter 2 Formula
Appendix C
EXTRACURRICUUR TRANSPORTATION
Appendix-C1
67
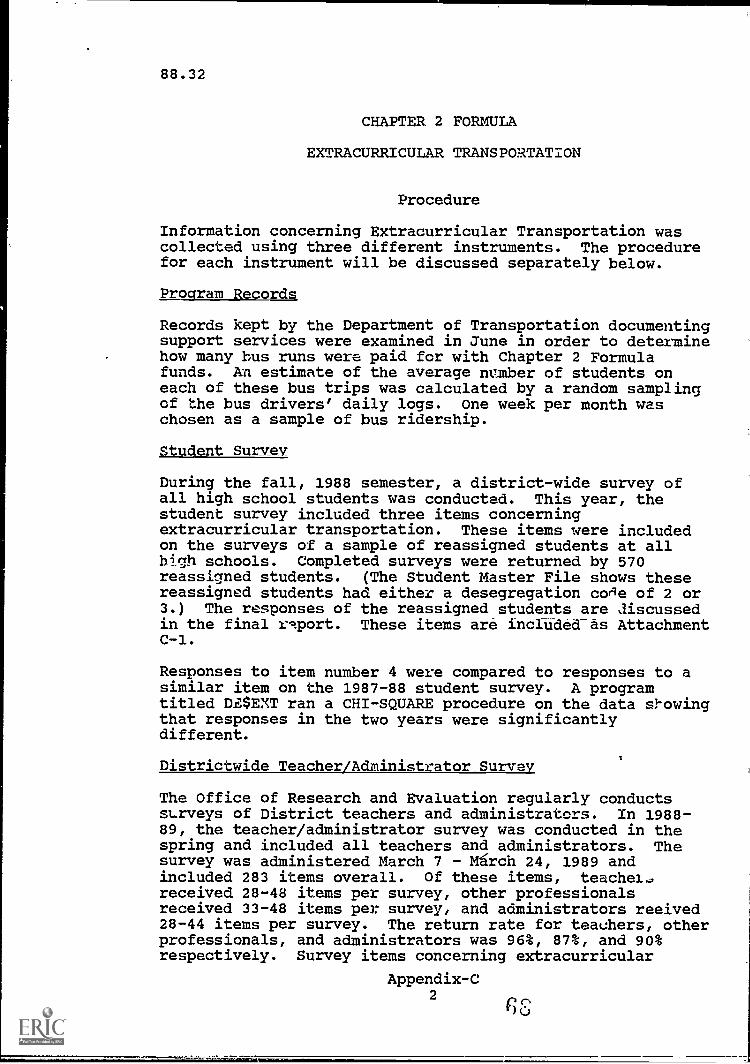
88.32
CHAPTER 2 FORMULA
EXTRACURRICULAR TRANSPORTATION
Procedure
Information concerning Extracurricular Transportation wascollected using three different instruments. The procedurefor each instrument will be discussed separately below.
Proqram Records
Records kept by the Department of Transportation documentingsupport services were examined in June in order to determinehow many bus runs were paid for with Chapter 2 Formulafunds. An estimate of the average mmber of students oneach of these bus trips was calculated by a random samplingof the bus drivers' daily logs. One week per month waschosen as a sample of bus ridership.
Student Survey
During the fall, 1988 semester, a district-wide survey ofall high school students was conducted. This year, thestudent survey included three items concerningextracurricular transportation. These items were includedon the surveys of a sample of reassigned students at allhigh schools. Completed surveys were returned by 570reassigned students. (The Student Master File shows thesereassigned students had either a desegregation cone of 2 or3.) The responses of the reassigned students are discussedin the final report. These items are inclUded-as AttachmentC-1.
Responses to item number 4 were compared to responses to asimilar item on the 1987-88 student survey. A programtitled Di$EXT ran a CHI-SQUARE procedure on the data sl'owingthat responses in the two years were significantlydifferent.
Districtwide Teacher/Administrator Survey
The Office of Research and Evaluation regularly conductssurveys of District teachers and administrators. In 1988-89, the teacher/administrator survey was conducted in thespring and included all teachers and administrators. Thesurvey was administered March 7 - Mirch 24, 1989 andincluded 283 items overall. Of these items, teachei.received 28-48 items per survey, other professionalsreceived 33-48 items per survey, and administrators reeived28-44 items per survey. The return rate for teachers, otherprofessionals, and administrators was 96%, 87%, and 90%respectively. Survey items concerning extracurricular
Appendix-C2
S

88.32
transportation were solicited from central administrators,program staff, and ORE staff; four of these items wereselected for inclusion in the teacher survey. These itemsare included as Attachment C-2. Responses to item #58 mayreflect the comments of teachers and administrators on thereduction in extracurricular participation for the entireschool district, or for their school in particular.
139
Appendix -C3
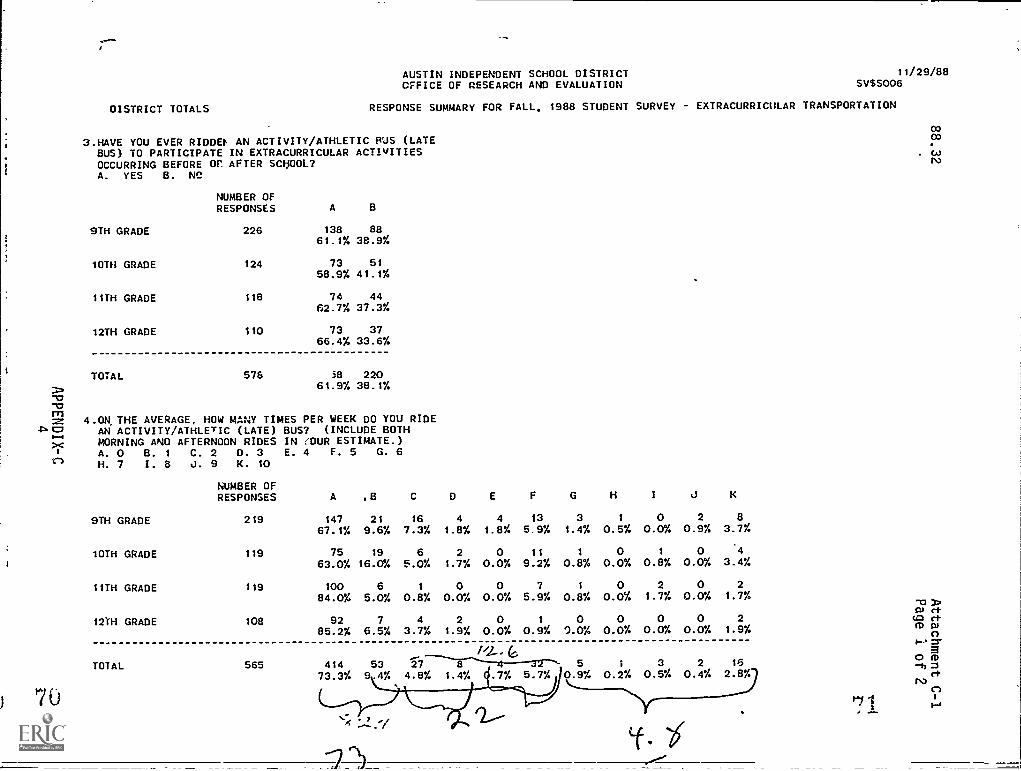
AUSTIN INDEPENDENT SCHOOL DISTRICT 11/29/88OFFICE OF RESEARCH AND EVALUATION SV$S006
DISTRICT TOTALS RESPONSE SUMMARY FOR FALL. 1988 STUDENT SURVEY - EXTRACURRICULAR TRANSPORTATION
3.HAVE YOU EVER RIDDE1, AN ACTIVITY/ATHLETIC PUS (LATEBUS) TO PARTICIPATE IN EXTRACURRICULAR ACTIVITIESOCCURRING BEFORE or AFTER SCHOOL?A. YES B. NC
NUMBER OFRESPONSES A
9TH GRADE 226 138 8861.1% 38.9%
10TH GRADE 124 73 5158.9% 41.1%
11TH GRADE 118 74 4462.7% 37.3%
12TH GRADE 110 73 3766.4% 33.6%
TOTAL 576 58 22061.9% 38.1%
-o
1-114.0N, THE AVERAGE, HOW MANY TIMES PER WEEK DO YOU RIDE
-Pc; AN ACTIVITY/ATHLETIC (LATE) BUS? (INCLUDE BOTHF4>c MORNING AND AFTERNOON RIDES IN YOUR ESTIMATE.)1 A. 0 B. 1 C. 2 D. 3 E. 4 F. 5 G. 6r, H. 7 I. 8 J. 9 K. 10
NUMBER OFRESPONSES
9TH GRADE 219
10TH GRADE 119
11TH GRADE 119
12TH GRADE 108
TOTAL 565
J7U
A ,B C D E F G H I J K
147 21 16 4 4 13 3 1 0 2 8
67.1% 9.6% 7.3% 1.8% 1.8% 5.9% 1.4% 0.5% 0.0% 0.9% 3.7%
75 19 6 2 0 11 1 0 1 0 4
63.0% 16.0% 5.0% 1.7% 0.0% 9.2% 0.8% 0.0% 0.8% 0.0% 3.4%
100 6 1 0 0 7 1 0 2 0 2
84.0% 5.0% 0.8% 0.0% 0.0% 5.9% 0.8% 0.0% 1.7% 0.0% 1.7%
92 7 4 2 0 1 0 0 0 0 2
85.2% 6.5% 3.7% 1.9% 0.0% 0.9% 0.0% 0.0% 0.0% 0.0% 1.9%
414 53 27Thr----21-7E-, 5 1 3 2 16
73.3% 9.4% 4.8% 1.4% .7% 5.77.. 0.9% 0.2% 0.5% 0.4% 2.8%
CoCo
.

11151141C1 101ALS
EIM-111117MIE,IIIF-111-111F-18§-511-1El lagliT---1111r"---
OFVIGE ui -RkStARCH ANt) LVAMAItuN SM00b---
RESPONSE SUMMARY FOR FALL, 1988 STUDENT SURVEY - EXtRACURRICULAR TRANSPORIATION
5.wOuiD YOU HAVL BEEN ABLE 10 PARTICIPATE IN EXTRA-"URRICutAR ACTIVITIES IF TRANSPORTATION HAD NOTBEEN PROVIDED?A. yis H. No
NUMBER OFRESPONSES A
91H GRADE 225 141 8462.7% 37,3%
10TH GRADE 125 74 5159.2% A0.8%
11TH GRADE 117 78 3P66.7% 33.4%
12TH GRADE 107 67 4062.6% 37.4%
TOTAL 574 360 21462.7% 37.3%
03CO
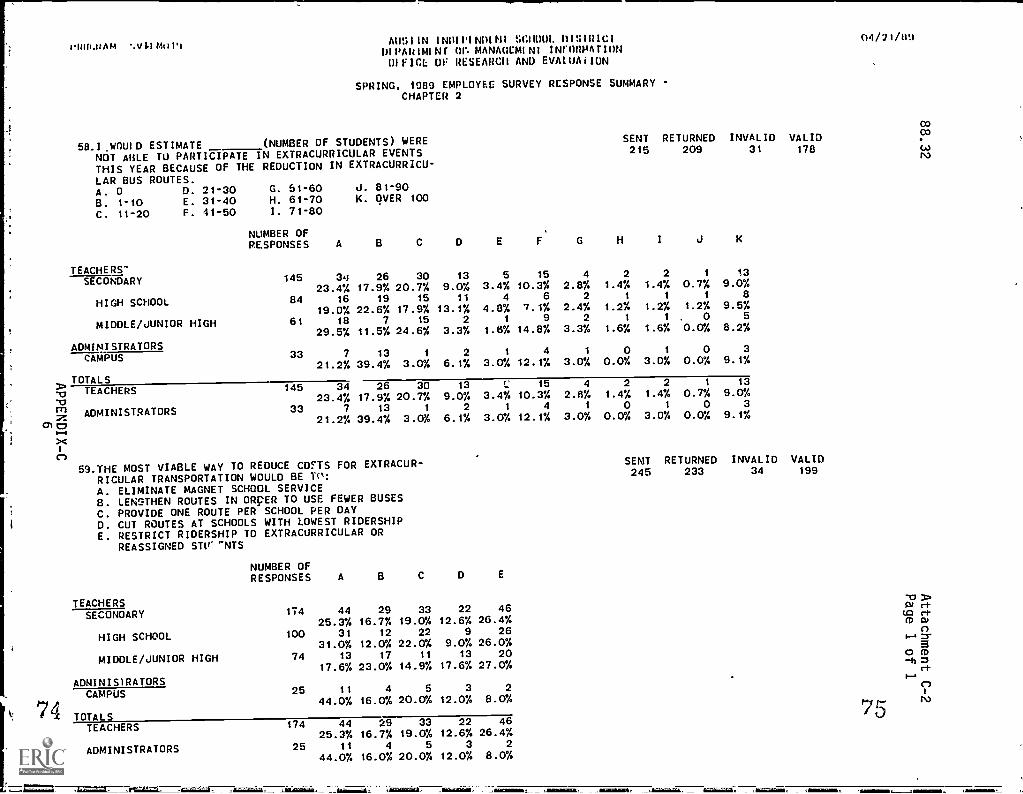
111111.if .V 1.1 Mt)14AUGIIN %CHOUI. DISIRICI01PAIIIMINI MANAUCMI NI IWORMATIONDIFICL OF RESEARCH AND EVALUAI ION
SPRING, 1989 EMPLOYEE SURVEY RESPONSE SUMMARY -CHAPTER 2
58.I.WOUID ESTIMATE (NUMBER OF STUDENTS) WERE
NOT ABLE TU PARTICIPATE IN EXTRACURRICULAR EVENTSTHIS YEAR BECAUSE OF THE REDUCTION IN EXTRACURRICU-
LAR BUS ROUTES.A. 0 D. 21-30B. 1-10 E. 31-40C. 11-20 F. 41-50
G. 51-60H. 61-70I. 71-80
J. 81-90K. OVER 100
SENT RETURNED INVALID VALID215 209 31 178
TEACHERS'
NUMBER OFRESPONSES A
SECONDARY 145 3,3 26 30 13 5 15 4 2 2 1 13
23.4% 17.9% 20.7% 9.0% 3.4% 10.3% 2.8% 1.4% 1.4% 0.7% 9.0%
HIGH SCHOOL 84 16 19 15 11 4 6 2 1 1 1 8
19.0% 22.6% 17.9% 13.1% 4.8% 7.1% 2.4% 1.2% 1.2% 1.2% 9.5%
MIDDLE/JUNIOR HIGH 61 18 7 15 2 1 9 2 1 1, 0 5
29.5% 11.5% 24.6% 3.3% 1.45% 14.8% 3.3% 1.6% 1.6% 0.0% 8.2%
ADMINISTRATORSCAMPUS 33 7 13 1 2 1 4 1 0 1 0 3
21.2% 39.4% 3.0% 6.1% 3.0% 12.1% 3.0% 0.0% 3.0% 0.0% 9.1%
TOTALSlu TEACHERS 145 34 26 30 13 15 4 2 2 1 13
lu 23.4% 17.9% 20.7% 9.0% 3.4% 10.3% 2.A% 1.4% 1.4% 0.7% 9.0%
;t ADMINISTRATORS 33 7 13 1 2 1 4 1 0 1 0 3
alter21.2% 39.4% 3.0% 6.1% 3.0% 12.1% 3.0% 0.0% 3.0% 0.0% 9.1%
c-i
59.THE MOST VIABLE WAY TO REDUCE COFTS FOR EXTRACUR-RICULAR TRANSPORTATION WOULD BE To:
A. ELIMINATE MAGNET SCHOOL SERVICEB. LENGTHEN ROUTES IN ORpER TO USE FEWERC. PROVIDE ONE ROUTE PER SCHOOL PER DAYD. CUT ROUTES AT SCHOOLS WITH LOWEST RIDERSHIPE. RESTRICT RIDERSHIP TO EXTRACURRICULAR OR
REASSIGNED STV""NTS
BUSES
SENT RETURNED INVALID VALID245 233 34 199
04/21/AO
0303
TEACHERS
NUMBER OFRESPONSES
174
100
74
25
A
4425.3%
3131.0%
1317.6%
11
44.0%
2916.7%
1212.0%
17
23.0%
4
16.0%
C
3319.0%
2222.0%
11
14.9%
520.0%
D
2212.6%
99.0%
1317.6%
312.0%
E
4626.4%
2626.0%
2027.0%
28.0% 75
fa; t+t-+
CD C1)
--) ="'afD
-11t-+
rNa
SECONDARY
HIGH SCHOOL
MIDDLE/JUNIOR HIGH
ADMINISIRATORSCAMPUS
74 TOTALSTEACHERS
ADMINISTRATORS
174
25
4425.3%
11
44.0%
2916.7%
4
16.0%
3319.0%
520.0%
2212.6%
3
12.0%
4626.4%
2
8.0%
.77-71;=Er=r6=:_-= _Airamora, _ aira.maT-77:airazatialz _ Ammar,
E8.32
Chapter 2 Formula
Appendix D
Homework Pilot Project
Appendix-D1
76

88.32
CHAPTER 2 FORAULA
Homework Pilot Project
Procedure
Information concerning the Homework Pi113t evaluation wascollected using two different instruments. The procedurefor each instrument will be discussed separately below.
Homework Pilot Survey
During the fall, 1988 semester the Homework Pilot surveyswere printed and the distribution method was determined.Surveys were sent to randomly selected teachers of 7th grademathematics and 9th grade Fundamentals of Mathematics. Theteachers were selected by a program developed by an OREprogrammer that listed teacher number, location number andnumber of students for a selected course. The surveys weremailed to campuses on February 9th and 10th, 1989, and wereto be returned by February 24th.
Surveys were sent to 256 9th grade Fundamentals ofMathematics students and 242 7th grade mathematics studentsfor a total of 498 surveys. The surveys were sent to theprincipal of eac' school where a teacher was to receive apackage of surveys. The project was explained to theprincipal in a memo signed by the Executive Director of theDepartment of Management Information and by the AssistantSuperintendent for Secondary Education and the principal wasasked to give the surveys to the appropriate teachers fordistribution (see Attachment - 1). A total of 312 surveyswere returned for a response rate of 63%. Follow up callswere made to increase the return rate; however, manyteachers indicated a number of students .sere absent on theday the surveys were distributed and some teachers said theyinstructed the students to return the surveys through themail.
Districtwide Teacher/Adminis+rator Survey.
The Office of Research and Evaluation regul rly conductsvulveys of District teachers and administrators. In 1988-89, the teacher/administrator survey was conducted in thespring and included all teachers and administrators. Thesurvey was administered March 7 - March 24, 1989 andincluded 283 items overall. Of these items, teachersreceived 2Q-48 items per surrey, other professional received33-48 itzlas per survey, and administrators received 28-44items per survey. The return rate for teachers, other
Appendix-D2

88.32
professionals and administrators was 96%, 87%, and 90%respectively. The survey items on the Homework PilotProject are included in Attachment D-1.
Appendix -D3
7(?,

4000000.0,041"." AUSTIN INDEPENDENT SCHOOL DISTRICT
POPFFICIME PONr I RESEARCH ANC-EVKLUATION 9N
04/28/89
1
SPRING, 1989 EMPLOYEE SURVEY RESPONSE SUMMARY -CHAPTEA 2
219.THE HOMEWORK PILOT PRACTICE BOOKLET WAS AN EFFECTIVE NUMBER OF PEOPLE SAMPLED
WAY TO GET STUDENTS AND THEIR PARENTS INVOLVED IN SENT r-TURNED INVALID VALID
PREPARiNG FOR ftUritrt. 111 1 68
/BLANKl
A. STRONGLY AGREE D. DIS 'TREEB. AGREE E. STRONGLY DISAGREEC.NUMAL P. UATUTCTWA-WTTA-Mtbr
NUMBER OFRESPONSES A
TEACHERSSECONDARY 67 6 16 12 10 13 10
9.0% 23.9% 17.9% 14.9% 19.4% 14.9%
HIGH CHQ04 qi. ..),..7 AZ ...a.
2.7 24.3% 13.5 13.9% P2.4% 8.1%
MIDDLE/JUNIOR HIGH 30 5 7 7 3 1 7
18.7% 22.31.23.3g_i0.:.Qg 3.34 23.3%
> ADMINISTRATORS-LI CAMPUS 39 8 15 12 0 0 A
t
i
4:2,
M1.=
0..4
C3
x
(TOTALS
20.5% 38.5% 0.8% 0.0% 0.0% 10.3%
TEACHERS 67 6 16 12 10
9.0% 23.9% 17.9% 14.013
19.4%10
14.9%i ADMINISTRATORS 39 8 15 12 0 0 4
20.5% 38.5% 30.8% 0.0% 0.0% 10.3%
01Ga
N.)
13 3>a 0.
U3 rtm
a0 a)-h
rF

88.32
Chapt -r 2 Formula
Appendix E
Johnston Comprehensive Competencies Program Lab
Appendix-E1
81

88.32
CHAP' 2 FORMULA
Johnston Comprehensive Competencies Lab
Procedure
On October 14, 1988 the Chapter 2 evaluation associate andthe supervising evaluator visited the ComprehensiveCompetencies Program (CCP) at Johnston, High School.Aspects of the program such as enrollment, participation,and instructional materials were discussed with the CCPstaff. At that time it was agreed chat participationinformation would be collected on all students, but onlythose students who had completed 10 hourS on speciallydesigned instructional materials (10 hours time on task)would be examined for program impact. At the end of thefall and spring semesters the MIS Specialist at the CCP labsupplied a list of students enrolled. Names and studentID's were entered into a computer file that was used inGENESYS to provide current and historical data on theprogram (Attachment E-1).
Districtwide Teacher/Administrator Survey
The O'fice of Research and Evaluation regularly conductssurveys of District teachers and administrators. In 1988-89, the teacher/administrator survey was conducted in thespring and included all teachers and administrators. Thesurvey is administered Match 7 - March 24, 1989 andincludoU 283 items overall. Of these items, teachersreceived 28-48 items per survey, other professionalsreceived 33-48 items per survey, and administrators received28-44 items per survey. The return rate for teachers, otherprofessionals and administrators was 96%, 87%, and 90%respectively. There was one question concerning theJohnston CCP Lab in the item pool. The question andresponses are included in Attachment E-2.
Appendix -E2
82
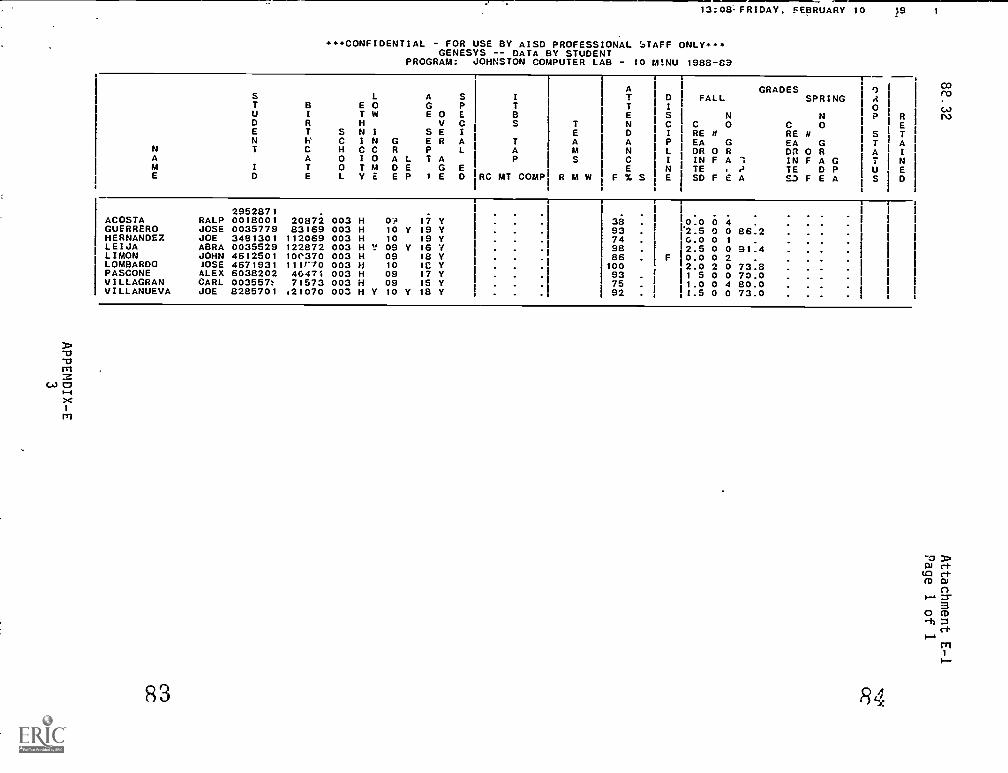
13:08-FRIDAY, FEBRUARY
***CONFIDENTIAL - FOR USE BY AISD PROFESSIONAL STAFF ONLY***GENESYS DATA BY STUDENT
JOHNSTON COMPUTER LAB - 10 M!NU 1988-E9PROGRAM:
L AT E 0 GU T W E0D R H VE T S N I S EN CING ER
N T C HCCR PA A O 1 0 AL TA
T O TM DE GE D E L Y E E P 1 E
2952871ACOSTA RALP 0018001 20872 003 H 17GUERRERO JOSE 0035779 83169 003 H 10 Y 19HERNANDE7. JOE 3481301 112069 003 H 10 19LEIJA ABRA 0035529 122872 003 H Y 09 Y 16 YLIMON JOHN 4612501 100370 003 H 09 18LOMBARDO JOSE 4671931 111r70 003 H 10 1CPASCONE ALEX 6038202 40471 003 H 09 17VILLAGRAN CARL 003557: 71573 003 H 09 15VILLANUEVA JOE 8285701 ,21070 003 H Y 10 Y 18 Y
S I I
P I TEl BC SI
I
AI TL I A
I
PED I RC MT COMP
iAT D FALLGRADES
SPRINGTE N N
T N C 0 C 0E D RE N RE NA I A P EA G EA GM I N DR 0 R DR 0 RS 1 C IN F A IN F A G
RMWI] ES
NE
TE ,
SD F E0A
TE53
D PF E A
138 o:o 0 4 :
93 . '2.5 0 0 86.274 . G.0 0 1
9 . 2.5 0 0 91.486 . F 0.0 0 2
'100 2.0 2 0 73.893 . 1 5 0 0 70.075 . I 1.0 0 4 80.092 . 1.5 0 0 73.0 -
10 19 1
a
03ro
0RE
S TT AA
NU ES D
a
83 841

'-
228.THE COMPREHENSIVE COMPETENCIES PROCRAM LAS HERE AT ----NUMBER OF PEOPLE SAMPLED
JOHNSTON IS EFFECTIVE IN KEEPING STUDENTS IN SCHOOL. SENT RETURNED INVALIO7BLANK VALID
A. STRONGLY AGREE D. DISAGREE 106 96 4 92
B. AGREE E. STRONGLY DISAGREEC. NEUTRAL
TEACHERS
NUMBER CFRESPONSES A it b- f
SECONDARY 83 21 32 18 1025.3% 38.6% 21.7% 12.0% 2.4%
HIGH25.3r38.6r21.7 12.0m:4
OTHER PROFESSIONALSCAMPKS 6 _R _22 3 1 2
........ N
16.7A 0.1.a33.3g 0.0% 60.0%ADMINISTRATORSCAMPUS 3 3 0 0 0 0
c41-Oti o o.6Y. 6 o .
TOTALSTEACHER5. 83 21 31 18 lc 2
25.5g-38.6g-21.7g 12.0% 2.47;
OTHER PROFESSIONALS 6 2 0 3 1 0B3. 3x. 50.61 16.7r,t. 0.02c.
ADMINISTRATORS-
3.Q.,52x
3 0 0 0 0100.0% 0.0% 0.0% 0.0% 0.0%
85
Mo..*
66
COCO
3>pJ etLO et'DJ0
M
nl
rNa
88.32
Chapter 2 Formula
Appendix F
Spanish Academy
Appendix-F1
87

88.32
CHAPTER 2 FORMULA
Spanish Academy
Procedure
Information on the Spanish Academy was collected using threedifferent instruments. Information from program records, afall semester survey and the Districtwide teacheradministrator survey, was used in the program evaluationprocess.
Fall Semester Survey_
All students enrolled in the Spanish Academy during the fallsemester evaluated the program. Last year, only thosecompleting six or more classes were asked to evaluate theSpanish Academy. On Friday, December 2, 1989 the SpanishAcademy course surveys were delivered to the instructors.The following week the surveys were distributed to all 182students (the survey was mailed to those who did not attendclassLr on the distribution day). Of the 182 surveysdistributed, 82 were returned for a response rate of 45%.The survey summary appears in the final report. For thecomplete results see Attachment F-1.
The 1988-89 responses to the question "Has this coursehelped you in your job?" were compared to the responses to asimilar question on the 1987-88 survey. A CHI-SQUAREanalysis showed that the responses were not significantlydifferent.
Proaram Records
At the end of the fall semester, the Spanish Academyinstructors were requested to supply a copy of the summerand fall classes rosters to the evaluation associate. Thesame request was made at the end of the spring semester.These rosters were used to evaluate attendance for theprogram.
Districtwide Teacher/Administrator Survey
The Office of Research and Evaluation regularly conductssurveys of District teachers and administrators. In 1988-89, the teacher/administrator survey was conducted in the
Appendix-F2
88.32
spring and included all teachers and administrators. Thesurvey was administered March 7 - March 24, 1989 andincluded 459 items overall. Of these items, teachersreceived 4-24 items per survey, other professionals received9-24 items per survey, and administrators received 8-24items per survey. The return rate for teachers, otherprofessionals and administrators was 96%, 47%, and 90%respectively. Three Spanish Academy items were in the itempool. The questions and responses are listed in AttachmentF-2.
Appendix-F3
R9

88.32 Attachment F-1Page 1 of 5
CLASS LOCATION:
AUSTIN INDEPEgDENT SCHOOL DISTRICTDepartment of ranagement InformationOffice of Research and Evaluation
SPANISH ACADEMY EVALUATION FOR4
CLASS TAKEN (Beginner, Intermediate,Advanced, Translation/Interpretation):
YOUR JOB TIT'2:
YOUR SCHOOL NAME OR JOB LOCATE
Please circle the most appropriate response.
I. Overall, the Spanish Academy course was:
EXCELLENT GOOD ADEQUATE POOR VERY POOR
2. Has this course helped you in your job? A LOT SOME NOT AT ALLIf it has, please explain how.
3. Has this course helped you in general? A LOT SOME NOT AT ALLIf it has, please explain how.
4. Do you feel the course has improved your rapport with Hispanic students?
YES NO NOT APPLICABLE
If it has, please explain how.
APPENDIX-F4
PLEASE COMPLETE BACK PAGE
90
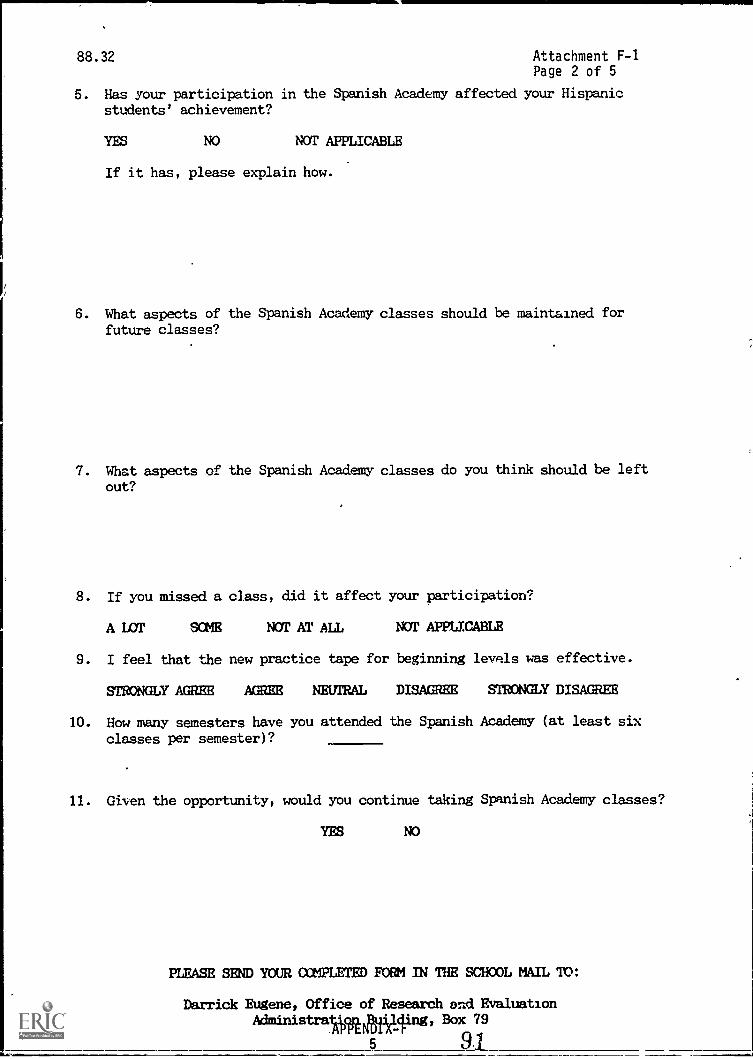
88.32 Attachment F-1Page 2 of 5
5. Has your participation in the Spanish Academy affected your Hispanicstudents' achievement?
YES NO Nar APPLICABLE
If it has, please explain how.
6. What aspects of the Spanish Academy classes should be maintained forfuture classes?
7. What aspects of the Spanish Academy classes do you think should be leftout?
8. If you missed a class, did it affect your participation?
A LOT SOME NOT AT ALL NOT APPLICABLE
9. I feel that the new practice tape for beginning levels was effective.
STRONGLY AGREE AGREE NEUTRAL DISAGREE STRONGLY DISAGREE
10. How many semesters have you attended the Spanish Academy (at least sixclasses per semester)?
11. Given the opportunity, would you continue taking Spanish Academy classes?
Y133 NO
PLEASE SEND YOUR COMPLETED FORM IN THE SCHOOL MAIL TO:
Darrick Eugene, Office of Research and EvaluationAcainistraVatiMing, Box 79
5 9_1

92
AUSTIN INDEPENDENT SCHOOL DISTRICTOFFICE OF RESEARCH AND EVALUATIONFALL. 1988 SPANISH ACADEMY SURVEY
CLASS FREQUENCY
0Mc.11J rAbg
01
23
::
5"
165
ItAti)4. 1
PERCENTCUk,LATIVEFREQUENCY
3.7 3
69.5 6019.5 766.1 811.2 82
CUMULATIVEPERCENT
3.773.292.798.8100.0
CUMULATIVE CUMULATIVETEACHER FREQUENCY PERCENT FREQUENCY PERCENT
0CAC4re I
RALL
0PitcP4Ar..e1
60fl0 2
OP0uAlf-3
38 4b.3 38 46.344 53.7 82 100.0
CUMULATIVE-CUMULATIVEFREQUENCY PERCENT FREQUENCY
1 1.2 1
62 75.6 6316 19.5 793 3.7 82
_JOB FREQUENCY
PERCENT"---,
1.276.896.
.400.0
CUMULATIVE CUMULATIVE,PERCENT FREQUENCY PERCENT
0 3 3.7 3 3.7%.0 r 1 28 34.1 31 37.8
Scum 2 46 56.1 77 93.9rz. 3 5 6.1 82 100.0
CUMULATIVE CUMULATIVEGENERAL FREQUENCY PERCENT FREQUENCY PERCENT
L0
err4
454.9
56.14
504.9
61.05bmi- 2 32 39.0 82 100.0
CUMULATIVE CUMULATIVERAPPORT FREQUENCY PERCENT FREQUENCY PERCENT
6i1
.
1.2 1 1.2)176 1 58 71.6 59 72.8Na 2 3 3.7 62 76.5
iqr 3 19 23.5 81 100.0
11:13 MONDAY, JANUARY 23. 1989 1
35 c- (
ti
OJCD
"X7 )W.12 M.M W0=ra0
01
93

so mom ism 11111 11111 11111 Imo moll per 11111- 11111 11111 11111 11111 11111 111111 11111 11111 11111AUSTIN INDEPENDENT SCHOOL DISTRICT 11:13 MONDAY, JANUARY-13-.-1989 2
OFFICE OF RESEARCH AND EVALUATIONFALL, 1988 SPANISH ACADEMY SURVEY
ZO
-1
94
-2
CUMULATIVE CUMULATIVESTUDENT FREQUENCY PERCENT FREQUENCY PERCENT
0 11 13.4 11 13.4 coyI 1 13.4 22 26.8..1% 2 14 17.1 36 43.9
3 46 66.1 82 100.0
MISSED FREQUENCY PERCENTCUMULATIVEFREQUENCY
CUMULATIVEPERCENT
0 10 12.2 10 12.21.01^'
4 4.9 14 17.1.5z64 2 37 45.1 51 62.2oitf 3 24 29.3 75 91.5N A- 4 7 8.5 82 100.0
TAPE FREQUENCY PERCENTCUMULATIVEFREQUENCY
CUMULATIVEPERCENT
N 0 16 19.5 16 19.54t.t.CC1 31 37.8 47 57.3442Pa 27 32.9 74 90.2A./coma 6 7.3 80 97.6NA 2 k.4 J2 100.0
NUMSEM FREQUENCY PERCENTCUMULATIVEFREQUENCY
CUMULATIVEPERCENT
0 12 4.6 12 14.61 39 47.6 51 62.22 .7 8.5 58 70.73 II 11.0 67 81,74 6 7.3 73 89.05 2 2.4 75 91.Z6 2 2.4 77 9. 97 1 1.2 78 95.110 1 1.2 79 96.311 1 1.2 80 97.633 2.4 82 100.0
'VD>W r+ca c+co
aOro-$1
r+cn
'1
1.4

AUSTIN INDEPENDENT SCHOOL DISTRICTDEE4CE-OF-RE5 EARC11-tNOFALL. SPANISH ACADEMY SURVEY
CUMULATIVE CUMULATIVECONTINU FREQUENCY PERCENT FREQUENCY PERCENT
Nig3 .S.7 3 3.7
57 69.5 60 73.216 19.5 76 9
S.,1.......---- 8.85 6.1100.0
11:13 MONDAY. JANUARY 23. 1939 3
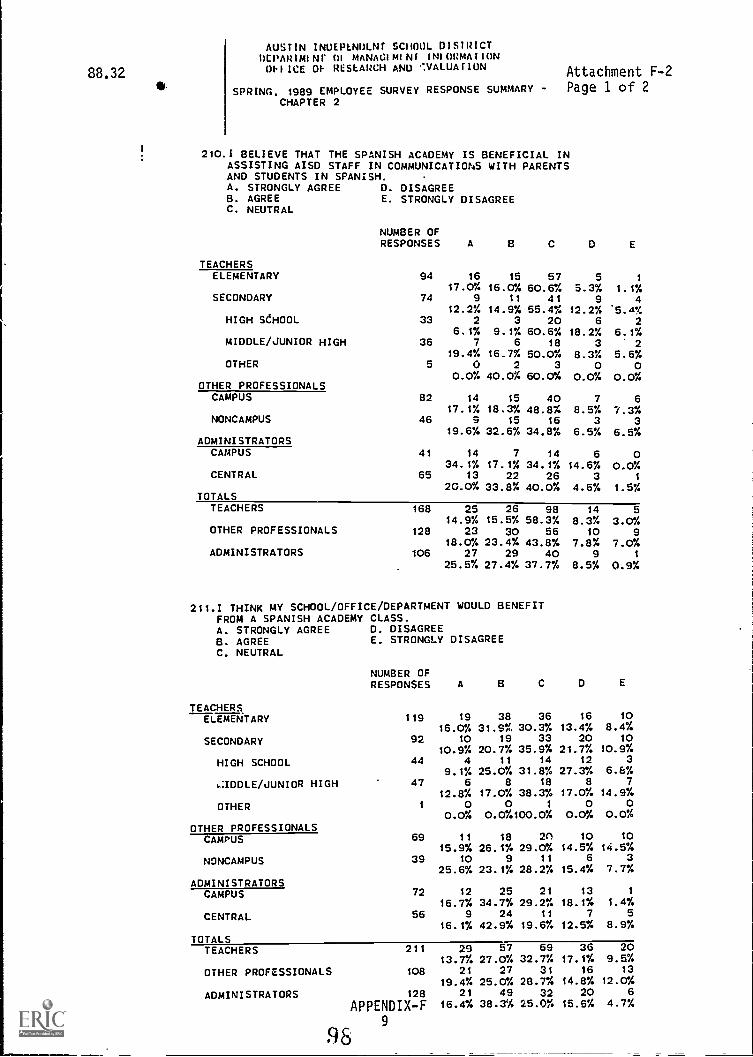
88.32
AUSTIN INUEPENDLNI SCHOOL DIS1RICTDEPARIMINF 01 MANAGIMIN1 1N10104ATION01.110E 01 RESLARCH AND '.VALUAIION Attachment F-2
SPRING, 1989 EMPLOYEE SURVEY RESPONSE SUMMARY - Page 1 of 2CHAPTER 2
210.1 BELIEVE THAT THE SPANISH ACADEMY IS BENEFICIAL INASSISTING AISD STAFF IN COMMUNICATIONS WITH PARENTSAND STUDENTS IN SPANISH.A. STRONGLY AGREE D. DISAGREEB. AGREE E. STRONGLY DISAGREEC. NEUTRAL
TEACHERS
NUMBER OFRESPONSES A B C 0
ELEMENTARY 94 16 15 57 5 1
17.0% 16.0% 60.6% 5.3% 1.1%SECONDARY 74 9 11 41 9 4
12.2% 14.9% 55.4% 12.2% '9..1.4
HIGH SCHOOL 33 2 3 20 6 26.1% 9.1% 60.6% 18.2% 6.1%
MIDDLE/JUNIOR HIGH 36 7 6 18 3 219.4% 16.7% 50.0% 8.3% 5.6%
OTHER 5 0 2 3 0 00.0% 40.0% 60.0% 0.0% 0.0%
OTHER PROFESSIONALSCAMPUS 82 14 15 40 7 6
17.1% 18.3% 48.8% 8.5% 7.3%NONCAMPUS 46 9 15 16 3 3
19.6% 32.6% 34.8% 6.5% 6.5%ADMINISTRATORS
CAMPUS 41 14 7 14 6 034.1% 17.1% 34.1% 14.6% 0.0%
CENTRAL 65 13 22 26 3 1
20.0% 33.8% 40.0% 4.6% 1.5%TOTALS
TEACHERS 168 25 26 98 14 514.9% 15.5% 58.3% 8.3% 3.0%
OTHER PROFESSIONALS 128 23 30 56 10 918.0% 23.4% 43.8% 7.8% 7.0%
ADMINISTRATORS 106 27 29 40 9 1
25.5% 27.4% 37.7% 8.5% 0.9%
211.1 THINK MY SCHOOL /OFFICE /DEPARTMENT WOULD BENEFITFROM A SPANISH ACADEMY CLASS.A. STRONGLY AGREEB. AGREEC. NEUTRAL
TEACHERS
D. DISAGREEE. STRONGLY DISAGREE
NUMBER OFRESPONSES A
ELEMENTARY 119 19 38 36 16 1016.0% 31.9% 30.3% 13.4% 8.4%
SECONDARY 92 10 19 33 20 1010.9% 20.7% 35.9% 21.7% 10.9%
HIGH SCHOOL 44 4 11 14 12 3
9.1% 25.0% 31.8% 27.3% 6.8%.:IDDLE/JUNIOR HIGH 47 6 8 18 8 7
12.8% 17.0% 38.37. 17.0% 14.9%
OTHER 1 0 0 1 0 00.0% 0.0%100.0% 0.0% 0.0%
OTHER PROFESSIONALSCAMPUS 69 11 18 2C 10 10
15.9% 26.1% 29.0% 14.5% 14.5%
NONCAMPUS 39 10 9 11 6 3
25.6% 23.1% 28.27. 15.4% 7.7%
ADMINISTRATORSCAMPUS 72 12 25 21 13 1
16.7% 34.7% 29.2% 18.1% 1.4%
CENTRAL 56 9 24 11 7 5
16.1% 42.9% 19.6% 12.5% 8.97.
TOTALSTEACHERS 211 29 57 69 36 20
13.7% 27.0% 32.7% 17.1% 9.5%OTHER PROFESSIONALS 108 21 27 31 16 13
19.4% 25.0% 28.7% 14.8% 12.0%
ADMINISTRATORS 128 21 49 32 20 6
APPENDIX-F 16.4% 38.3% 25.0% 15.6% 4.7%
989
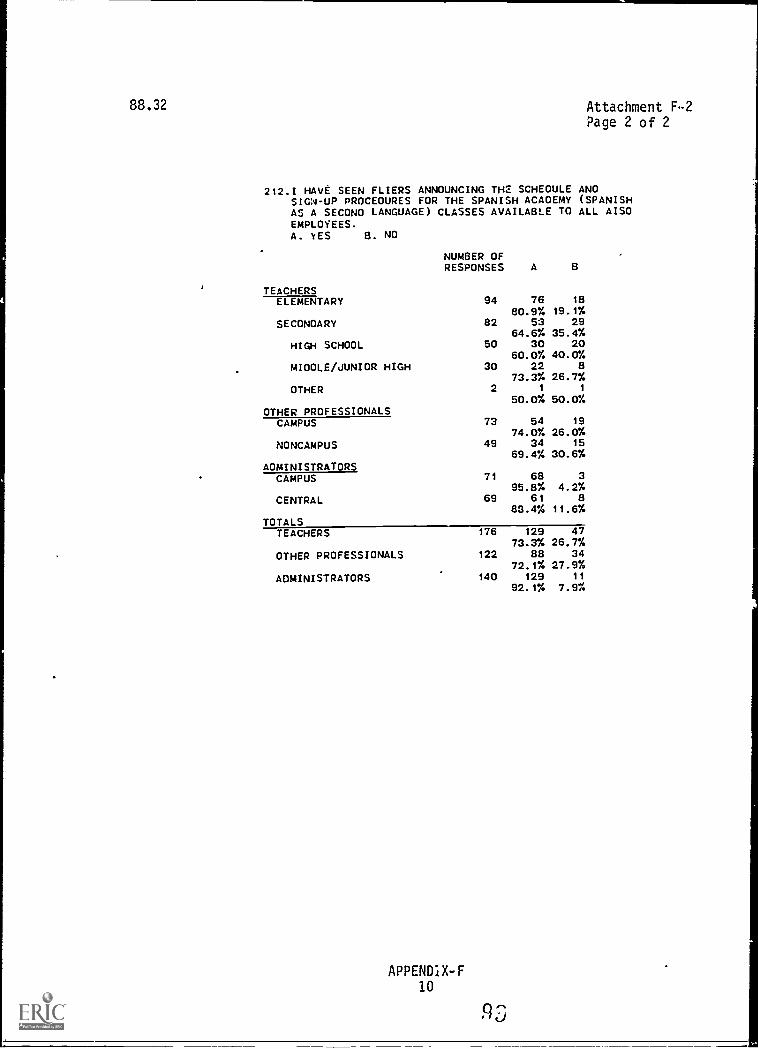
88.32 Attachment F-2Page 2 of 2
212.1 HAVE SEEN FLIERS ANNOUNCING THE SCHEOULE ANOSIGN-UP PROCEOURES FOR THE SPANISH ACAOEMY (SPANISHAS A SECONO LANGUAGE) CLASSES AVAILABLE TO ALL AISOEMPLOYEES.A. YES 8. NO
TEACHERS
NUMBER OFRESPONSES A 8
ELEMENTARY 94 76 1880.9% 19.1%
SECONOARY 82 53 2964.6% 35.4%
HIGH SCHOOL 50 30 2060.0% 40.0%
MIOOLE/JUNIOR HIGH 30 22 873.3% 26.7%
OTHER 2 1 1
50.0% 50.0%OTHER PROFESSIONALSCAMPUS 73 54 19
74.0% 26.0%NONCAMPUS 49 34 15
69.4% 30.6%AOMINISTRATORS
CAMPUS 71 68 395.8% 4.2%
CENTRAL 69 61 882.4% 11.6%
TOTALSTEACHERS 176 129 47
73.3% 26.7%OTHER PROFESSIONALS 122 88 34
72.1% 27.9%ADMINISTRATORS 140 129 11
92.1% 7.9%
APPENDIX-F10
RS
88.32
Chapter 2 Formula
Appendix G
TEAMS Improvement Funds
Appendix-G1
100

88.32
CHAPTER 2 FORMULA
TEAMS IMPROVEMENT FUNDS
Procedure
Information concerning the TEAMS improvement funds wascollected from a questionnaire, the districtwideteacher/administrator survey, and program records. Theprocedure used for each will be discussed below.
Questionnaire
Information concerning TEAMS improvement funds was collectedusing a questionnaire completed by the program coordinator(see files for questionnaire). On April 10, 1989 thisquestionnaire was mailed to the Elementary School CurriculumDirector. The questionnaire was returned April 24, 1989.
Districtwide Teacher/Administrator Survey
The Office of Research and Evaluation regularly conductssurveys of District teachers and administrators. Ia 1980-8?, the teacher/administrator survey was conducted in thespring and included all teachers and administrators. Thesurvey was administered March 7 - March 24, 1989 andincluded 283 items overall. Of these items, teachersreceived 28-48 items per survey, other professionalsreceived 33-48 items per survey, and administrators received28-44 items per survey. The return rate for teachers, otherprofessionals and administrators was 96%, 87%, and 90%respectively. There was one question concerning TEAMSimprovement funds in the item pool. The question andresponses are included in Attachment G-1.
Program Records
TEAMS test scores for participating schools were analyzed tosee if TEAMS improvement funds had any effecit. on scores.The TEAMS scores were obtained from the Testing andEvaluation Evaluator. TEAMS test scores were entered into adatabase named ELE.WDB by a coder and reports were createdto analyze the data. See Attachment G-2 for an example of areport.
Appendix-G2
101

19- -----AUS444-INDEPENDENT- SCHOOL- DISTRICT-DEPARTMENT OF MANAGEMENT INFORMATIONOFFICE OF RESEARCH AND EVALUATION
SPRING& 1989 EMPLOYEE SURVEY RESPONSE SUMMARYCHAPTER 2
219.THE HOMEWORK PILOT PRACTICE BOOKLET WAS AN EFFECTIVEWAY TO GET STUDENTS AND THEIR PARENTS INVOLVED INPREPARING FOR tHE TEAMS TEST.A. STRONGLY AGREE D. DISAGREEB. AGREE E. STRONGLY DISAGREE
''''''''''''''''''''' ''
NUMBER OF
04/28/89
NUMBER OF PEOPLE SAMPLEDSENT RETURNED INVALID/BLANK VALID111 108 2 106
RESPONSES A
TEACHERSSECONDARY 67 6 16 12 10 13 10
9.0% 23.9% 17.9% 14.9% 19.4% 14.9%HIWSCHOOL 27 1 7 1? i
2.7% 24.3% 13.57. 18.9% 32.4g C.1%MIDDLE /JUNIOR HIGH 30 5 7 7 3 1 7
16.7% 23,31 23.3g 10.0%, 3.3g 23.3gADMINISTRATORS
CAMPUS 39 8 15 12 0 0 420.5% 38 . 4.30. al o,oz: o.gx, lo.qg,_-
TOTALSTEACHERS
ADMINISTRATORS
67 6 16 12 10 13 109.0% 23.8g 17.9% 14.9%.19.41_14.9%.
39 8 15 12 0 0 420.5% 38.5% 30.8% 0.0% 0.0% 10.3%
220. THE TEAMS MATERIALS WE PURcHASED THROUGH CHAPTER 2 NUMBER OF PEOPLE SAMPLEDFUNDS WERE AN EFFECTIVE WAY TO PREPARE STUDENTS SENT RETURNED INVALID/BLANK VALIDFOR THE TEAMS TEST. 42 41 4 37A. STRONGLY AGREE D. DISAGREEB. AGREE d. STRONGLY DISAGREEC. NEUTRAL
NUMBER (?FRESPONSES A
ADMINISTRATairCAMPUS 37 13 13 10 1 0
35.1% 35.1 27.0x o.oxTOTALSADMINISTRATORS 37 13 13 10 1 0
35.1% 35.14 27.0% 2.7% 9.04
88.32
Chapter 2 Formula
Appendix H
PRIVATE SCHOOLS
Appendix-H1
104
88.32
CHAPTER 2 FORMULA
PRIVATE SCHOOLS
Procedure
In the spring of 1989, the grants administrator wascontacted concerning the procedures used in notifyingqualified private schools of the application process for1988-89 Chapter 2 funds. The notification and evaluationprocedures used are discussed below.
Private School Survey
In order to collect information concerning the effectivenessof Chapter 2 expenditures made by private schools whoreceived Chapter 2 funds, a TEA survey form was adapted byORE staff to be completed by the schools involved (seeAttachment H-1 for survey and responses). This survey formwas reviewed by the grants administrator and was sent duringthe first week of April, 1989 to private schools receivingfunds (see Attachment H-2 for cover memo). A self-addressed, stamped envelope was included.
In May, 1989, program records were examined in the office ofthe grant administrator's bookkeeper in order to determinehow funds were spent. These records included purcharserequisitions submitted by private schools receiving Chapter2 funds.
Program Records
On April 12, 1988, the grants administrator and Chapter 1instructional administrator sent.a memo explaining theapplication for 1988-89 funds to administrators of private(nonpublic) schools. Interested administrators wererequested to complete a participation form indicating theirintention to participate. This memo, participation form,and eligibility criteria are in the Chapter 2 evaluationfiles.
On April 29, 1988, a reminder lemo (see files) was sent toadministrators who did not return a participation form norattend the planning meeting on April 26, 1988. Finally, onMay 13, 1988, a certified letter (return receipt requested)was sent to administrators who had not responded to eitherof the earlier memos. This certified letter (see filet) wassent to provide documentation that all private schools hadreceived notification of the application for funds.
Appendix-H2 in5
88.32
In August, 1988, private schools were notified of the amountof funds allocated to their account. AISD purchasingprocedures were attached (see files).
Appendix-H3
106

88.32
AUSTIN INDEPENDENT SCHOOL DISTRICTDepartment of Management InformationOffice of Research and Evaluation
Attachment H-1Page 1 of
EFFECTIVENESS RATINGS OF CHAPTER 2 EXPENDITURES
Rate the effectivenss of Chapter 2 expenditures for each of thefollowing types of students by circling the number which bestdescribes your opinion. Please do not c;:,:rcle more than one numberor mark between the numbers. Use the key below for definitions ofscales.
KEY
1 = INEFFECTIVE. Accomplished almost none (0% TO 20%) of theintended purposes.
2 = NOT VERY EFFECTIVE. Accomplished few (21% to 40%) of theintended purposes.
3 = MODERATELY EFFECTIVE. Accomplished about half (41% to 60%) ofthe intended purposes.
4 = HIGHLY EFFECTIVE. Accomplished most (61% to 80%) of theintended purposes.
5 = EXTREMELY EFFECTIVE. Fully accomplished (61% TO 103%) of theintended purposes.
N = NOT APPLICABLE. Materials described on any given line were notassisted with Chapter 2 block grant
Students in Bilingual /ESL Programs
funds.
Books, Materials 1 2 3 4 5Nr-fa111
ComplAer Hardware 1 2 3 4 5 14-1--1-1. I I 1
CompiAter Software 1 2 3 4 5 N'r+-I-L 11Audi /Visual 1 2 3 4 5 NT14.1.11
Students in Migrant Programs
Books, Materials 1 2 3 4 5 N-H-LIIComputer Hardwarew.4
-.. Computer Software11
2
2
3
3
4
4
55
Nr-I-I-4- 1 1
N71-I-4 I
Audio/Visual 1 2 3 4 5 N-FH-1- II
PLEASE COMPLETE BACK PAGE
APPENDIX-H4
1 0 7

88.32 Attachment H-1Page 2 of 2
Etgdent§isiggppenggtuyEggslingarggiatn
Books, MaterialsComputer HardwareComputer SoftwareAudio/Visual
1111
2 3 4
2 3 4
2 3 4
2 3 4
Students in Other Compensatory Language Arts Programs
Books, MaterialsComputer HardwareComputer Softwareliudio/Visual
Books, MaterialsComputer HardwareComputer SoftwareAudio/Visual
Students i1i Gifted /Talented Programs
Books, MaterialsComputer HardwareComputer SoftwareAudio/Visual
Books. MaterialsComputer HardwareComputer SoftwareAudio/Visual
Books, MaterialsComputer HardwareComputer SoftwareAudio/Visual
1111
Students in Compensatory Mathematics Programs
1111
1111
Students in Special Education Programs
1111
Students Not in Any of the Categories Above
1 21 21 21 2
2 3 42 3 42 3 4
2 3 4
2 3 4
2 3 4
2 3 4
2 3 4
2222
3
3
3
3
4
444
2 3 4
2 3 4
2 3 4
2 3 4
3 413 41
3 4I
3 411
.
PLEASE SEND THIS COMPLETED FORM TO:
Darrick EugeneAustin Independent School DistrictOffice of Research and Evaluation6100 Guadalupe, Box 79Austin, TX 78752
APPENDIX-H5
inc
5 Nr-L-1-1 "115 N. -1- MI5 N` 4L 1 Il.
5 N 7-1-1-1 1111
5 1 N '111
1
55 1
i 1 I
51 N*--1-1_1 111
511l ti
1+5N
0. 11115 N*1-1-4-1 li"
5 N 11 11
5115151
511
N-H-11"1 1
-N-1-4--LL 111N 1-4-L1 I I
N--L 11"55 NTh1-1. 11"5 NI-4-1-1-1M5 N-H-1--L/111
1111
5H-44. NI
5 1i N11 .L II5 11' N-1-1-14.1
511-q.1411
H

Attachment H-2
88.32 Page 1 of 1
Austin Independent School DistrictDepanment of Intergovernmental RelationsApril 7, 1989
MEMORANDUM
TO: Lauren Holmes/St. Theresa's School
FROM: Ann Cunningham/Grants Administrator
SUBJECT: Evaluation of ECIA Chapter 2 Formula Funds
The requirements for Chapter 2 funds include evaluation ofthe programs provided by these monies. The latestnon-regulatory guidelines make it the local educationagency's responsibility to include evaluation informationabout the programs provided to private school children inits records. We must submit this evaluation information toTexas Education Agency annually.
Attached is an evaluation form from the AISD EvaluationAssociate for Chapter 2. This form serves to evaluate theeffectiveness of expenditures from Cha.?ter 2 block grantfunds in the format requested by TEA. We are asking you toevaluate the effectiveness of the instructional materials,library books and equipment you purchased for your schoolwith Chapter 2 funds. Effectiveness ratings for differentgroups of students are requested by TEA. We do realize thatyou may not have students that fit into all of thecategories listed.
Please complete the enclosed survey and return it in thestamped, pre-addressed envelope to:
Darrick EugeneAustin Independent School DistrictOffice of Research and Evaluation5100 Guadalupe, Box 79Austin, TX 78752
Please call us at 458-1291 if you have any questions.
dyh
enc
xc: Nancy Baenen /Darrick Eugene,/Sister Loretta APPENDIX-H
George Solana 6
5555 North Lamar, Bldg. H Austin. Texas 78751-1001 512/458-1291
ins

88.32
Chapter 2 Formula
Appendix I
Outdoor Learning Program
Appendix-I1
1 1 0
88.32
CHAPTER 2 VORMULA
OUTDOOR LEARNING PROGRAM
Procedure
Information concerning the Outdoor Learning Programevaluation was collected from a questionnaire and thedistrictwide teacher/administrator survey. The procedurefor each method will be discussed separately below.
Questionnaire
Information concerning theOutdoor Learning Program wascollected using a questionnaire completed by the programcoordinator (see files for questionnaire). On April 10,1989 this questionnaire was mailed to the Outdoor LearningProgram coordinator. The questionnaire was returned April24, 1989.
Districtwide Teacher/Administrator Survey
The Office of Research and Evaluation regularly conductssurveys of District teachers and administrators. In 1988-89, the teacher/administrator survey was conducted in thespring and included all teachers and administrators. Thesurvey was administered March 7 - March 24, 1989 andincluded 283 items overall. Of these items, teachersreceived 28-48 items per survey, other professionalsreceived 33-48 items per survey, and administrators received28-44 items per survey. The return rate for teachers, otherprofessionals and administrators was 96%, 87%, and 90%respectively. The survey item on the Outdoor LearningProgram is included as Attachment I-1.
Proctram Records
Teachers of classes scheduled for a 1988-89 study tripfilled out program registration forms. In addition toinformation on the school, grade, class size, and site, thecards asked for an ethnic breakdown of the class. A sampleTeacher Card is included in the Chapter 2 Formula files.
Appendix-I2
111
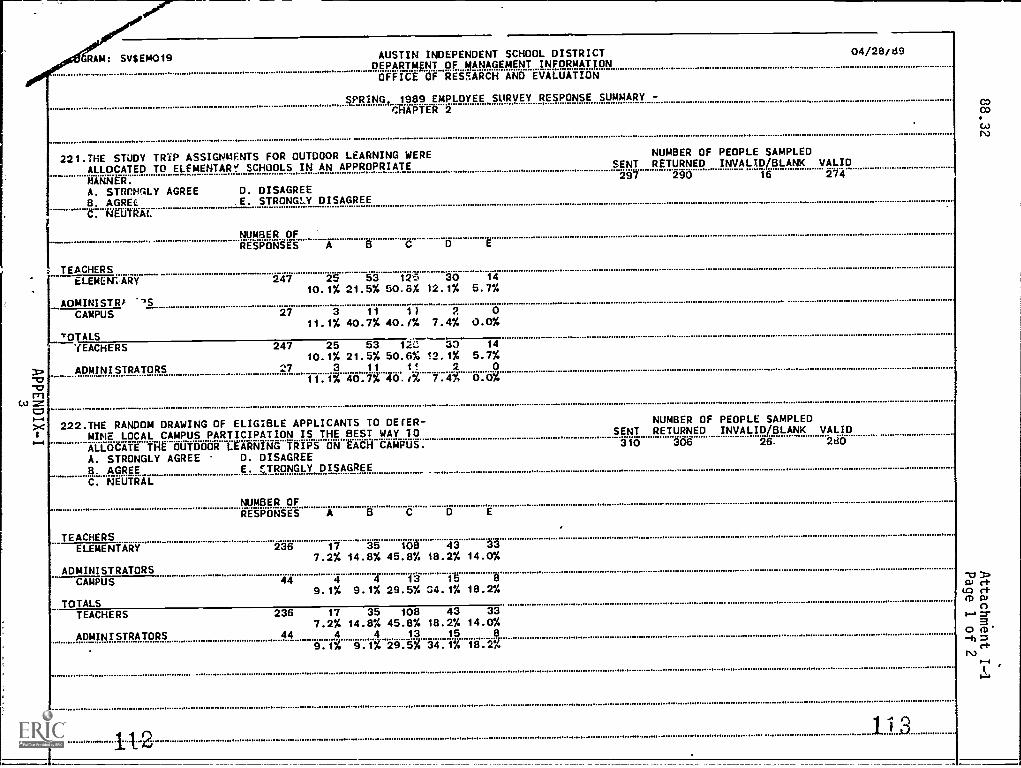
RAM: SVSEM019 AUSTIN INDEPENDENT SCHOOL DISTRICTDEPARTMENT OF MANAGEMENT INFORMATIONOFFICE OF RESEARCH AND EVALUATION
04/28,d9
SPRING, 1989 EMPLOYEE SURVEY RESPONSE SUMMARY -CHAPTER 2
221.THE STUDY TRIP ASSIGNMENTS FOR OUTDOOR LEARNING WEREALLOCATED TO ELEMENTAW! SCHOOLS IN AN APPROPRIATEMANNER.A. STDCMGLY AGREE D. DISAGREEB. AGREE .E. STRONGLY DISAGREEC. NEUTRAL
TEACHERSELEMENTARY
NUMBER OFRESPONSES A B C D
247 25 53 12';N, 3010.1% 21.5% 50.0% 12.1%
AOMINISTRA --"E.
CAMPUS 27 3 11 11 211.1% 40.7% 40.1% 7.4%
TOTALSYEACHERS 247 25 53 12C 33
3 ADMINISTRATORSnunuing
CAI =CV...4
10.1% 21.5% 50.6% 12.1%27 3 11 11 2
11.1% 40.7% 40.,% 7.43
>< 222.THE RANDOM DRAWING OF ELIGIBLE APPLICANTS TO DEFER-i MIME LOCAL CAMPUS PARTICIPATION IS THE BEST WAY 10
...4
NUMBER OF PEOPLE SAMPLEDSENT RETURNED INVALID/BLANK VALID29/ 256 16 2/4
E
14
5.7%
00.0%
145.7%
00.0%
NUMBER OF PEOPLE SAMPLEDSENT RETURNED INVALID/BLANK VALID
ALLOCATE THE OUTDOOR LEARNING TRIPS ON EACH CAMPUS. 310 306 26. 280
A. STRONGLY AGREE D. DISAGREE
- B. AGREE E. STRONGLY DISAGREEC. NEUTRAL
TEACHERSELEMENTARY
ADMINISTRATORS-.CAMPUS
TOTALSTEACHERS
ADMINISTRATORS
NUMBER OFRESPONSES A B C D E
236 17 35 108 43 337.2% 14.8% 45.8% 18.2% 14.0%
44 4 4 13 1g 8
9.1% 9.1% 29.5% 34.1% 18.2%
236 17 35 108 43 337.2% 14.8% 45.8% 18.2% 14.0%
44 4 4 13 15 8
9.1% 9.1% 29.571 34.1% 18.2%
11..2 113

e/40,9AUSTIN INDEPENDENT SCHOOL DISTRICTpfPARTMcNT ne MANAMINI_INERRMATIQNOFFICE OF RtiSEARCH AND EVALUATION
04/28/89
SPRING, 1989 EMPLOYEE SURVEY RESPONSE SUMMARY -CHAPTER 2
223.FIELD TRIPS COORDINATED BY TIE OUTDOOR LEARNING NUMBER OF PEOPLE SAMPLED
PROGRAM ARE EFFECTIVE.SENT RETURNED INVALID/BLANK VALID
A. STRONGLY AGREe b. Main- X93 297 23 274
S. AGREE E. STRONGLY DISAGREEC
...... ... ...... --..NEUTRAL.- .... ...... - .....
NUMBER OFRESPONSES A
TEACHERSELEMENTARY 256 51 69 128 6 2
19.9% 27.0% 50.0% 2.3% 0.8%
ADMINISTRATORSCAMPUS 14 7 6 4 Q i
38.9% 33.3% 22.2% 0.0% 5.6%
TOTALSTEACHERS-
256 51 69 128 6 2.................. .... ----- ...... . .....
19.9% 27.0% 50.07 2.3% 0.8%
ADMINISTRATORS 18 7 6 4 0 1
38.9% 33.3% 22.2% 0.0% 5.6%....... ......
t itt. zv,-.4X --a
,-.4
1141 1 5
CO03
73Sa/ c-h
CO c-hCD Sa/
=o
aCD
-h
88.32
Chapter 2 Formula
Appendix J
Wicat Computer Lab Instructional Aide
Appendix-J1.16

88.32
CHAPTER 2 FORMULA
Wicat Computer Lab Instructional Aide
Procedure
Information concerning the Wicat Computer Lab evaluation wascollected from a questionnaire and the districtwideteacher/administrator survey. The procedure for each methodwill be discussed separately below.
Ouestionnaire
On April 4, 1989, the principal at Blanton Elementary schoolwas sent a questionnaire. The questionnaire containedquestions on most of the the evaluation objectives for theWICAT program (see files for questionnaire). Thequestionnaire was returned April 24, 1289.
Districtwide Teacher/Administrator Survey
The Office of Research and Evaluation regularly conductssurveys of District teachers and administrators. In 1988-89, the teacher/administrator survey was conducted in thespring and included all teachers and administrators. Thesurvey was administered March 7 - March 24, 1989 andincluded 283 items overall. Of these items, teachersreceived 28-48 items per survey, other professionalsreceived 33-48 items per survey, and administrators received28-44 items per survey. The return rate for teachers, otherprofessionals and administrators was 96%, 87%, and 90%respectively. There was one question concerning WicatComputer Lab in the item pool. The question and responsesare included in Attachment J-1.
Appendix-J2
11

224.THE WICAT LAB IS AN EFFECTIVE: WAY 00 0EVELOPING NUMBER OF PEOPLE: SAMPLED
READING AND MATHEMATICS SKILLS. SENT RETURNED INVALID/BLANK VALID
A. STRONGLY AGREE D. DISAGREE 30 30 3 27
B. AGREE: t. t1loNdt.1 MOMC. NEUTRAL
TEACHERSELEMENTARY
NUMBER OFRESPONSES A
ADMINISTRATORSCAMPUS
TOTALSTEACHERS
26 13 6 6 1 0S0.0% 3.8%,. 0.0%
1 1 0 0 0 0100.0% 0.2% 0.O% 0.0% 0.0%
ADMINISTRATORS
26 13 6 6 1 0
- SO.0%_23.1% 23.1% 3.sg o.og1 1 o o o o100.0% 0.0% 0.0% 0.0% 0.0%
....... 4444444444 0
118
COCO
rs.)
rfto rfM SL
L'T
aO m
rf

88.32
Chapter 2 Formula
Appendix K
SCHOOL-COMMUNITY LIAISON PROGRAM
Appendix-K1

88.32
CHAPTER 2 FORMULr.
School-Community liaison P-ogram
Procedure
Information concerning the School-Community Liaison Programevaluation was collected in two ways. The procedure foreach will be discussed separately below.
Questionnaire
Information concerning the School-Community Liaison Programwas collected using a questionnaire completed by the programcoordinator (see files for questionnaire). On April 10,1989 this questionnaire was mailed to the Home/SchoolServices Coordinator. The questionnaire was returned April24, 1989.
Districtwide Teacher/Administrator Survey_
The Office of Research and Evaluation regularly conductssurveys of District teachers and administrators. In 1988-89, the teacher/administrator survey was conducted in thespring and included all teachers and administrators. Thesurve,r was administered March 7 - March 24, 1989 andincluded 283 items overall. Of these items, teachersreceived 28-48 items par survey, other professionalsreceived 33-48 items per survey, and administrators rece_ved28-44 items per survey. The return rate for teachers, otherprofessionals and administrators was 96%, 87%, and 90%respectively. The survey Item on the School-CommunityLiaison Program is included in Attachment K-1.
Aependix-K2
1°

Em019AUSTIN INDEPENDENT SCHOOL DISTRICT
DEPARTMENT OF MANAGEMENT INFORMATIONOFFICE OF RES_ARCH AND EVALUATION
SPRING, 1989 EMPLOYEE SURVEY RESPONSE SUMMARY -
CHAFTEA 2
04/28/89
13
..... . Nr .... »» M&H.e.MM ..
MCAJ2 227.PARENT AND STUDENT INVOLVEMENT IN SPECIAL ACTIVI-
NUMBER OF PEOPLE SAMPLED
co TIES IS FACILITATED BY THE TRANSPORTATION SERVICESSENT RETURNED INVALID /BLANK VALID
I...1
...
><COORDINATED BY THE SCHOOL-COMMUNIYY LIAISON OFftt.
94 91 2 89
o A. STRONGLY AGREE D. DISAGREEx B. AGREE STRONGLY DISAGREE
d. kEUTWAL
ADMINISTRATORS
NUMBER OFRESPONSES.-- A
MINH
CAMPUS 89 13 21 41 10 4
14.6% 23.6% 46.1% 11.2% 4.5%
_TOTALSADMINISTRATORS 89 13 21 41 10 4
14.6% 23.6% 46.1% 11.2% 4.5%
122
133>' rtUD ctM W0
1-4
aO m-11=
ct
7C
88.32
Chapter 2 Formula
Appendix L
Prekindergarten Units at Blanton and Travis Heights
Appendix-L1
124

88.32
CHAPTER 2 FORMULA
Prekindergarten Units at Blanton and Travis Heights
Procedure
Information concerning the Blanton and Travis HeightsPrekindergarten Program evaluation was collected from aquestionnaire and the Chapter 1 Evaluator. The procedurefor each method will be discussed separately below.
Questionnaire
On April 4, 1989, the Prekindergarten program coordinatorwas sent a questionnaire. The questionnaire containedquestions on most of the the evaluation objectives for thePre-K program (see files for questionnaire). Thequestionnaire was returned April 24, 1989.
Chapter 1 Evaluator.
On June 5, 1988 the Chapter 1 Evaluator supplied informationon the Peabody Picture Vocabulary Test-Revised scores forBlanton and Travis Heights elementary schools. Thisinformation provided the basis for investigating theeffectiveness of the Pre-K program.
Appendix -L2
125
88.32
Chapter 2 Formula
Appendix M
Academic Decathlon
Appendix-M1
126

88.32
CHAPTER 2 FORMULA
ACADEMIC DECATHLON
Information concerning the Academic Decathlon evaluation wascollected from a questionnaire and the districtwideteacher/administrator survey. The procedure for each methodwill be discussed separately below.
Ouestionnaire
Information concerning the Academic Decathlon was collectedusing a questionnaire completed by the program coordinator(see Attachment M-1). On April 10, 1989 this questionnairewas mailed to the Director of Academic, Vocational, andSpecial Education Curriculum and Programs. Thequestionnaire was returned April 24, 1989.
Districtwile Teacher/Administrator Survey
The Office of Research and Evaluation regularly conductssurveys of District teachers and administrators. In 1988-89, the teacher/administrator survey was conducted in thespring and included all teachers and' administrators. Thesurvey was administered March 7 - March 24, 1989 andincluded 283 items overall. Of these items, teachersreceived 28-48 items per survey, other professionalsreceived 33-48 items per survey, and administrators received28-44 items per survey. The return rate for teachers, otherprofessionals and administrators was 96%, 87%, and 90%respectively. The survey items on the Academic DecathlonProgram are included in Attachment M-2.
Appendix -M2
1-170_,A. _
. ,r---) ,--N ,_
88 . 32yi,,,t Ifs i A ir FT-it:Irv...,
Attachment M-1 : . '; --I-4:i .: I 11 r4"-`
Page 1 of 2 '-'--.4'...' !' f i
r...8(7
1988-89 CHAPTER 2 FORMULA QUESTIONNAIRE44-7.--,_ '' - /
,,,....... -.4.44.;)-,...,_.
For the purpose of evaluating the Academic Decathlon, this-. ,,__
questionnaire has been prepared by the Chapter 2 Formula
evaluation associate. Please complete the following questions
and return to Darrick Eugene, ORE, Carruth AdministrationBuilding by April 24, 1989.
WHAT STUDENT POPULATIONS WERE SERVED WITH CHAPTER 2 FUNDS?CIRCLE THE NUMBER OF THE APPROPRIATE CATEGORY(IES).
1. MIGRANT STUDENTS2. COMPENSATORY EDUCATION STUDENTS3. TALENTED AND GIFTED STUDENTS4. OTHER STUDENTS5. STAFF OR PARENTS
HOW WERE CHAPTER 2 FUNDS USED FOR THE Academic Decathlon?CIRCLE THE APPROPRIATE CATEGORIES AND EFFECTIVENESS RATING FOR
EACH.
1-5 Ineffecttve (1) to, VIctremelv Effective (5). Accorml.ished
almost none (0% to 20%0'4 to almost all (81% to 100%)') of the
intended purpose(s).
NA. Not Applicable. Materials, programs, services, oractivities described on any given line were not assisted with
Chapter 2 block grant funds.
TYPE LUIRIPLISIBE
SALARIESBRIEF DESCRIPTION
BOOXB, MATERIALSBRIEF DESCRIPTION
EPPECTIVENESS
1 2 3 5 NA
1 2 3 5 NA
COMPUTERS 1 2 3 4 5 6ZBRIEF DESCRIPTION
TESTING/EVALUATIONBRIEF DESCRIPTION
1 2 3 (;) 5 NA
AUDIO/VISUAL 1 2 3 4 5
BRIEF DESCRIPTIONAPPENDI-X-M

88.32Attachment M-1Page 2 of 2
If you rated any uses as ineffective or very effective, why?
What changes (if any) would you recommend for next year for theAcademic Decathalon?
Tt e C 0 /fx-fx J-e,,a,.1-.95)
*12.04 2F+2-"-9 pAn c .
How many students were served? A (Pe 5 0-** #`44) g
How many schools participated?
X
jhA4 cAtec) ev .8 ek 4.-tio vt. .
cov.,.?e4J2 4
How effective academically was the Decathlon?
1\41AAA-1-11-0
APPENDIX -P1
4

PROGRAM: SV$EM019 AUSTIN INDEPENDENT SCHOOL DISTRICTpfpARTmgNy 9F mANAgpmpiT INFORMATIONOFFICE OF RESEARCH AND EVALUATION
04/28/89
SPRING. 1989 EMPLOYEE SURVEY RESPONSE SUMMARY -CHAPTER 2
225.80TH THE DISTRICT AND STUDENTS BENEFITTED FROM OUR NUMBER OF PEOPLE SAMPLED
PARTICIPATION IN THE ACADEMIC DECATHLON. SENT RETURNED INVALID/BLANK VALID
A. stahca AOR b. bYtnlitt 584 98 2 268
B. AGREE E. STRONGLY DISAGREEC. NEUTRAL
NUMBER OFRESPONSES A
TEACHERSSECONDARY 230 30 58 129
13.0% 25.2% 56.1%
HIGH SCHOOL 132 18 39 691P.6 t...
MIDDLE/JUNIOR HIGH 98 12 19 6012.2% 19.4% 61.2%
ADMINISTRATORSCAMPUS 38 t2 5 20
31.6% 13.2% 52.6%
TOTALS ,u
TEACHERS 230 30 ,111.58 129
. 13.0% 25.2% 56.1%nvnv ADMINISTRATORS 38 12 5 20rn 31.6% 13.2% 52.6%zC;
>4 "4474$..4
I
3 226.THE ACADEMIC DECATHLON COMPETITION IS AN EFFEC- NUMBER OF PEOPLE SAMPLED
TIVE WAY TO PROMOTE ACADEMIC EXCELLENCE. SENT RETURNED INVALID/BLANK VALID
A. STRONGLY AGREE D. DISAGREE 326 306 20 286
B. AGREE E. STRONGLY DISAGREEC. NEUTRAL F. UNFAMILIAR WITH
B 5
5.5% 2.2%5 1
9.4%3 4
3.1% 4.1%
0 1
0.0% 2.6%
8 53.5% 2.2%
0 1
0.02 2.6%
NUMBER DFRESPONSES A B C D
TEACHERSSECONDARY 232 31 67 86 9 4 35
13.4% 28.0%7.1% 3.92 1.7% 15.12
HIGH SCHOOL 133 19 41 53 7 3 10
14.3% 30.8% 39.8% 5.3% 2.31
MIDDLE/JUNIOR HIGH 99 12 26 33 2 1 25
1-2.1% 26.3% 33.3% 2.0% 1.0% 25.3%
ADMINISTRATORSCAMPUS
CENTRAL
39 12 11 13 1 1 1
30.8% 28.2% 33.3% 2.6% 2.6% 2.6%15 3 6 5 0 0 1
20.0% 40.02 33.3% 0.0% 0.0% 6.7%TOTALS
TEACHERS 232 31 4. 67 86 9 4 35
16.4% 28.62 37.1% 5.9% CI% 1.1%ADMINISTRATORS 54 15 17 18 1 1 2
27.8% 31.5% 33.3% Ito 1.9% 3,7%
2
.1,
,,
A
88.32
Chapter 2 Formula
Appendix N
NEEDS ASSESSMENT
Appendix-N1
1. t 4
88.32
CHAPTER 2 FORMULA
Needs Assessment
Proceedure
The Chapter 2 needs assessment requires responses fromteachers, administrators and parents. The teacher andadministrator information was obtained from the districtwide personnel survey. The parent opinions were obtainedfrom surveys distributed at selected Parent AdvisorCommittee meetings (see Attachment N-1). During the firstweek of February the Chapter 2 evaluation associatecontacted the Grants Administrator and a Parent InvolvementSpecialist about the participation of parents in the Chapter2 needs assessment. Arrangements were made to survey theparents attending the Parent Advisory Committee meetings onMarch 7, 22, and 29 and April 18. The results from thesesurveys were summarized and given to Ann Cunningham on April28, 1989.
Appendix-N2
1 33
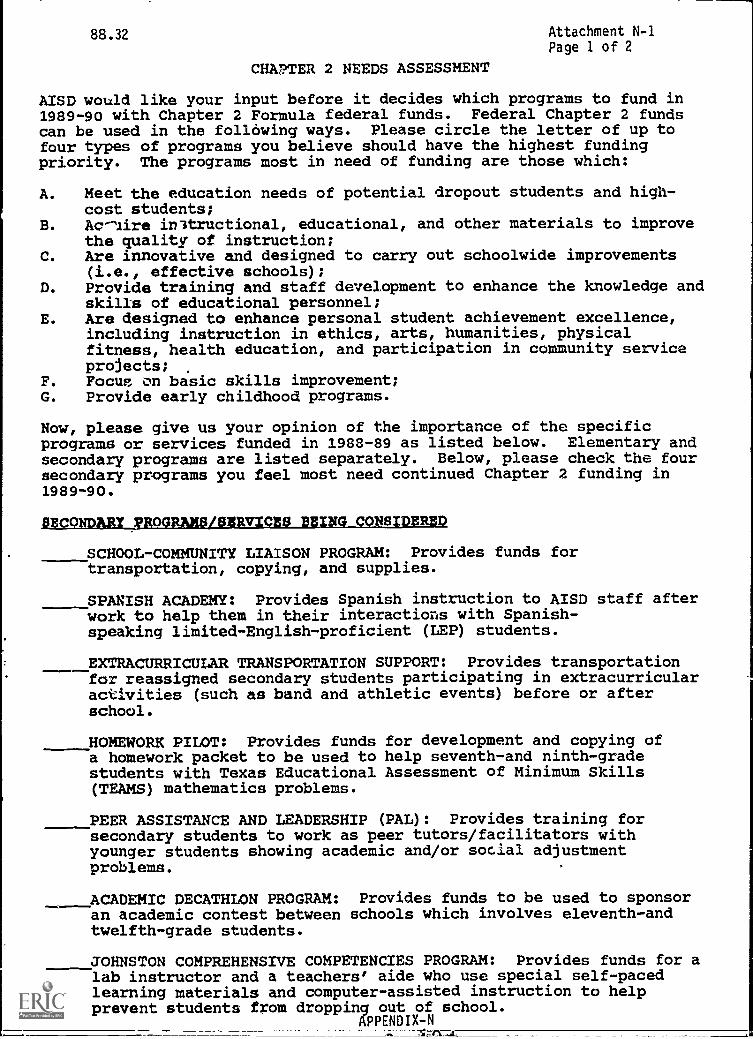
88.32 Attachment N-1Page 1 of 2
CHAPTER 2 NEEDS ASSESSMENT
AISD would like your input before it decides which programs to fund in1989-90 with Chapter 2 Formula federal funds. Federal Chapter 2 fundscan be used in the following ways. Please circle the letter of up tofour types of programs you believe should have the highest fundingpriority. The programs most in need of funding are those which:
A. Meet the education needs of potential dropout students and high-cost students;
B. Aciire initructional, educational, and other materials to improvethe quality of instruction;
C. Are innovative and designed to carry out schoolwide improvements(i.e., effective schools);
D. Provide training and staff development to enhance the knowledge andskills of educational personnel;
E. Are designed to enhance personal student achievement excellence,including instruction in ethics, arts, humanities, physicalfitness, health education, and participation in community serviceprojects;
F. Focus on basic skills improvement;G. Provide early childhood programs.
Now, please give us your opinion of the importance of the specificprograms or services funded in 1988-89 as listed below. Elementary andsecondary programs are listed separately. Below, please check the foursecondary programs you feel most need continued Chapter 2 funding in1989-90.
SBCONDAR PROGRAXB /SERVICES BEING CONSIDERED
SCHOOL-COMMUNITY LIAISON PROGRAM: Provides funds fortransportation, copying, and supplies.
SPANISH ACADEMY: Provides Spanish instruction to AISD staff afterwork to help them in their interactions with Spanish-speaking limited-English-proficient (LEP) students.
EXTRACURRICULAR TRANSPORTATION SUPPORT: Provides transportationfor reassigned secondary students participating in extracurricularactivities (such as band and athletic events) before or afterschool.
HOMEWORK PILOT: Provides funds for development and copying ofa homework packet to be used to help seventh-and ninth-gradestudents with Texas Educational Assessment of Minimum Skills(TEAMS) mathematics problems.
PEER ASSISTANCE AND LEADERSHIP (PAL): Provides training forsecondary students to work as peer tutors/facilitators withyounger students showing academic and/or social adjustmentproblems.
ACADEMIC DECATHLON PROGRAM: Provides funds to be used to sponsoran academic contest between schools which involves eleventh-andtwelfth-grade students.
JOHNSTON COMPREHENSIVE COMPETENCIES PROGRAM: Provides funds for alab instructor and a teachers' aide who use special self-pacedlearning materials and computer-assisted instruction to helpprevent students from dropping out of school.
APPENDIX-N
88,32
Now, check the four elementary programs you believeChapter 2 funding in 1989-90.
ILETATJARRE4BLOEIMICE1311112jgMUMUM
Attachment 11-1Page 2 of 2
most need continued
OUTDOOR LEARNING PROGRAM: Provides transportation and admissionfees for study trips to bring elementary students together in avariety of outdoor learning environments.
PREKINDERGARTEN SUPPORT: Provides supplemental support toprekindergarten classes by funding afternoon sessions (not requiredby law) for three prekindergarten classes.
PROJECT ASSIST: Provides an instructional monitor to staff an in-school suspension rcom in three elementary schools. The principalrefers students to the room, and following Glasser's realitytherapy principles, students and the monitor develop a plan tochange the undesirable behavior.
TEnS IMPROVEMENT: Provides funds to be used for instructionalmaterials at the elementary level.
WICAT COMPUTER LAB: Provides funds for an instructional aide torun the Wicat computer lab at Blanton Elementary. Students goto the lab for additional reading or mathematics computer-assisted instruction.
SCHOOL-COMMUNITY LIAISON PROGRAM: Provides funds fortransportation, copying, and supplies.
SPANISH ACADEMY: Provides Spanish instruction to AISD staff afterwork to help them in their interactions with Spanish-speaking limited-English-proficient (LEP) students.
In the snAce below, please list any other programs or services you thinkAISD neeels to provide with these funds.
Thank you. Please turn this form in now.APPEN4DIX-N
IR 3

Austin Independent School District
Department of Management Information
Dr. Glynn Ligon, Executive Director
Office of Research and Evaluation
Board of Trustees
Ed Small, President
John Lay, Vice President
Bernice Hart, Secretary
Nan Clayton Bob West
Dr. Beatriz de la Garza Dr. Gary R. McKenzie
Superintendent of Schools
Dr. John Ellis
DS