Ecosystem ecology: Concepts, data, models Dr. Whendee … · Processes/Organisms that fix N:...
14
Ecosystem ecology: Concepts, data, models Dr. Whendee Silver
Transcript of Ecosystem ecology: Concepts, data, models Dr. Whendee … · Processes/Organisms that fix N:...

Ecosystem ecology: Concepts, data, models
Dr. Whendee Silver
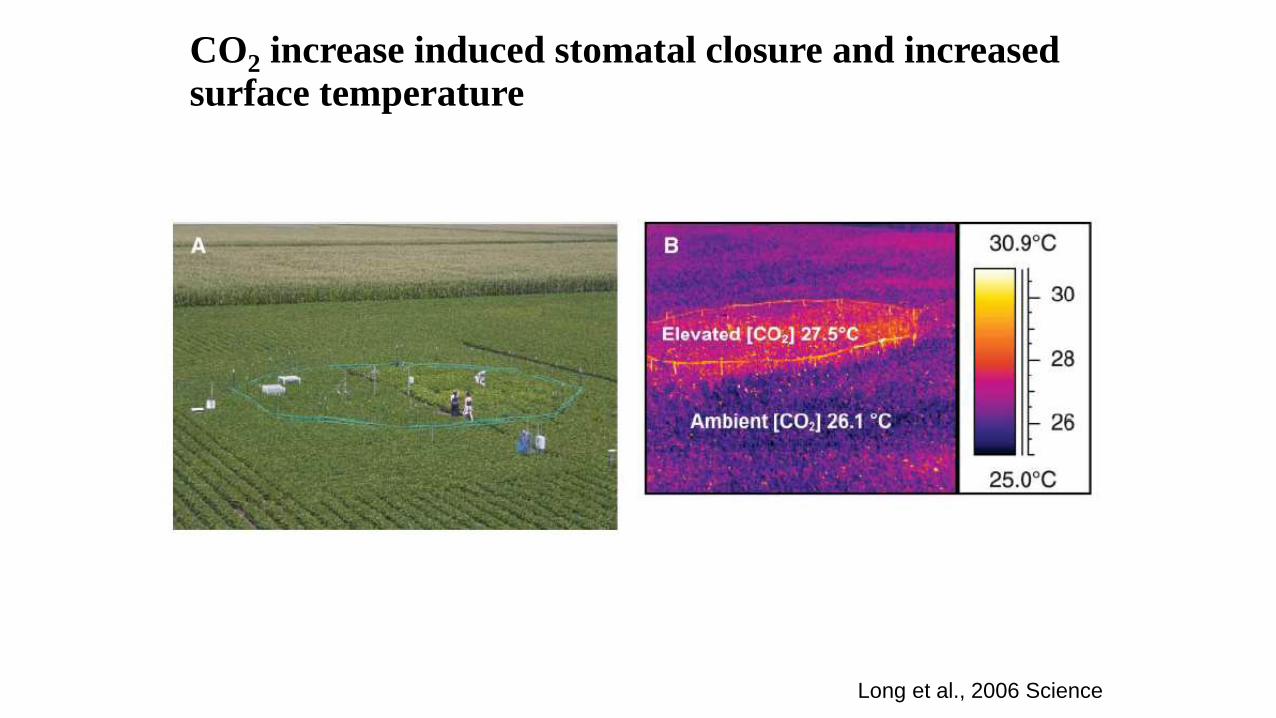
Long et al., 2006 Science
CO2 increase induced stomatal closure and increased surface temperature
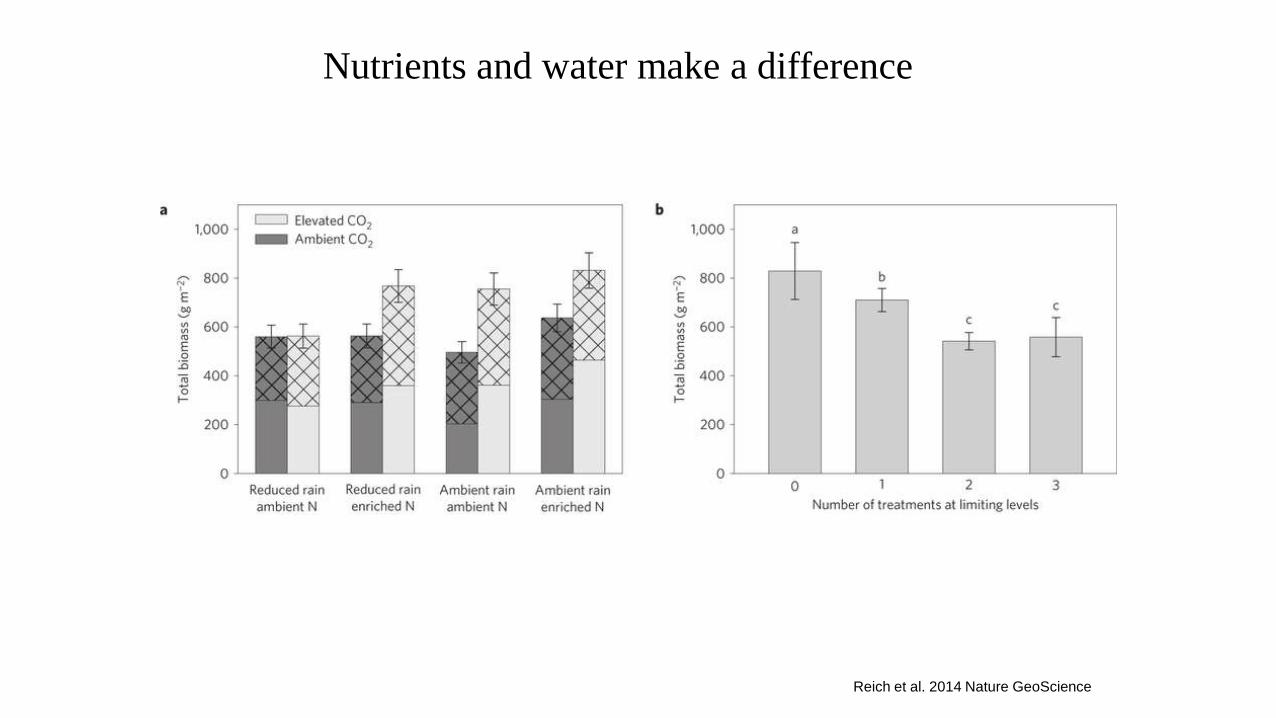
Reich et al. 2014 Nature GeoScience
Nutrients and water make a difference

World F
oo
d P
rod
uction
(10
9m
etr
ics p
er
yea
r)
Tilman 1999 PNAS
Justus von Liebig(1803-1873)
Liebig’s Law of the Minimum
Liebig’s Barrel
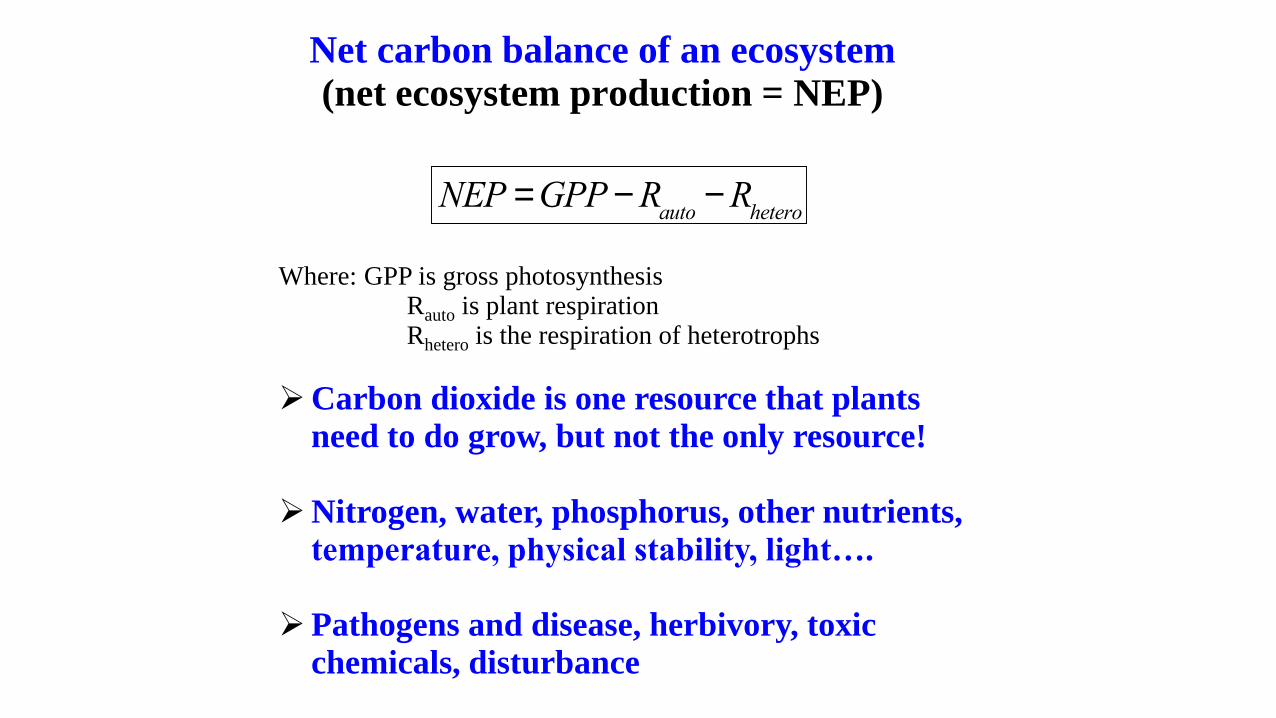
Net carbon balance of an ecosystem (net ecosystem production = NEP)
NEP =GPP-Rauto
-Rhetero
Where: GPP is gross photosynthesisRauto is plant respirationRhetero is the respiration of heterotrophs
Carbon dioxide is one resource that plants need to do grow, but not the only resource!
Nitrogen, water, phosphorus, other nutrients, temperature, physical stability, light….
Pathogens and disease, herbivory, toxic
chemicals, disturbance
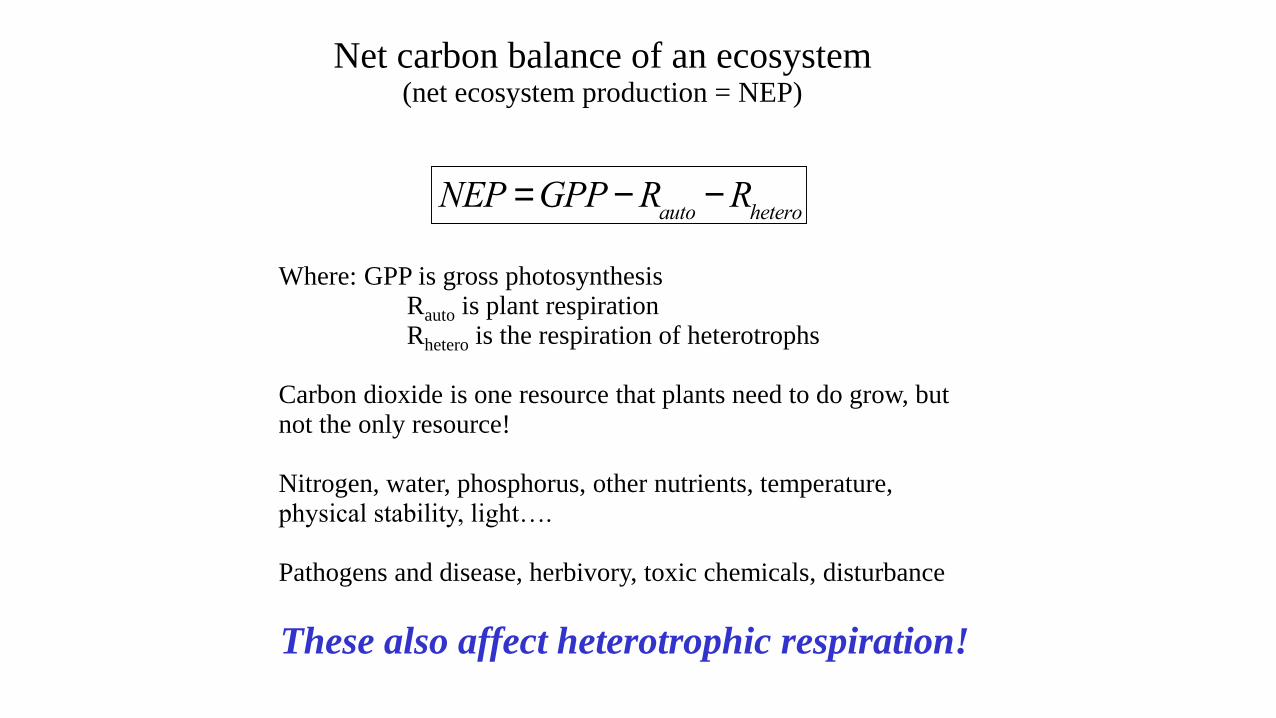
Net carbon balance of an ecosystem (net ecosystem production = NEP)
NEP =GPP-Rauto
-Rhetero
Where: GPP is gross photosynthesisRauto is plant respirationRhetero is the respiration of heterotrophs
Carbon dioxide is one resource that plants need to do grow, but not the only resource!
Nitrogen, water, phosphorus, other nutrients, temperature, physical stability, light….
Pathogens and disease, herbivory, toxic chemicals, disturbance
These also affect heterotrophic respiration!

Brienen et al. 2015 Nature

Nitrogen

Electrical Power Plants(Burning of Fossil Fuels)
Automobiles(Burning of Fossil Fuels)
Agriculture (Synthetic Fertilizers & Leguminous Crops)
Causes of N fixation in the Environment 3
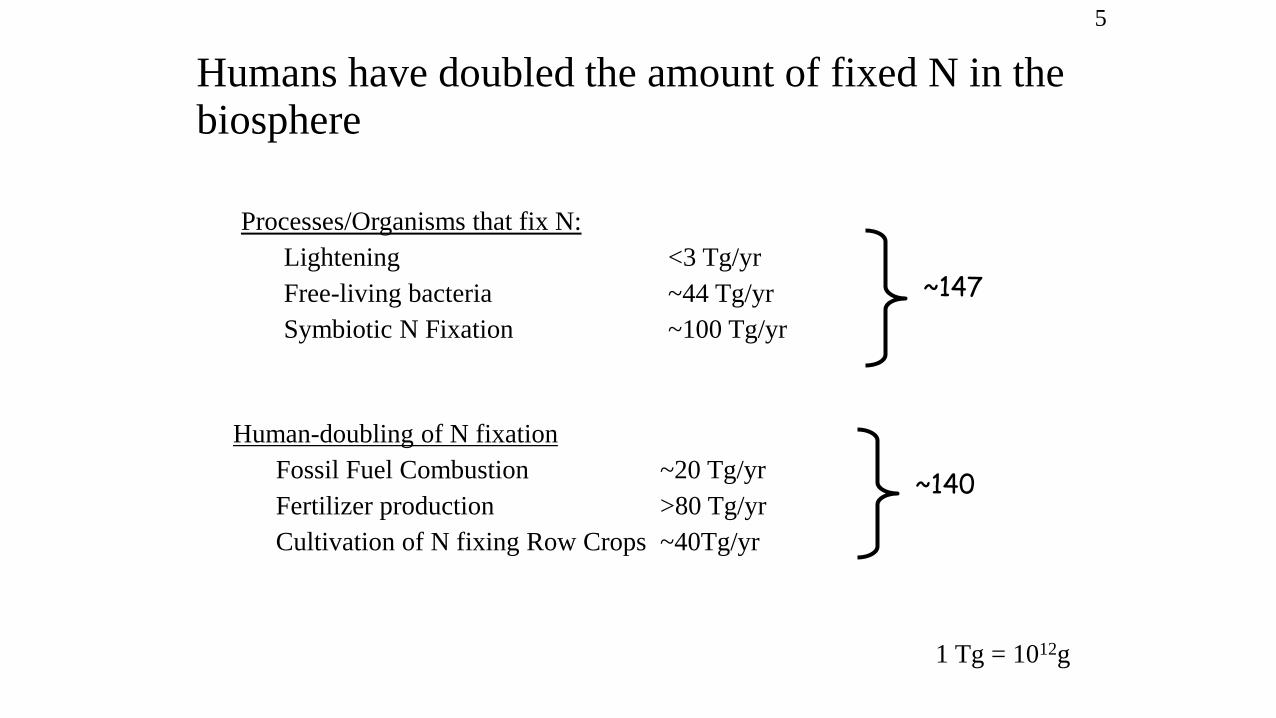
Processes/Organisms that fix N:
Lightening <3 Tg/yr
Free-living bacteria ~44 Tg/yr
Symbiotic N Fixation ~100 Tg/yr
Human-doubling of N fixation
Fossil Fuel Combustion ~20 Tg/yr
Fertilizer production >80 Tg/yr
Cultivation of N fixing Row Crops ~40Tg/yr
Humans have doubled the amount of fixed N in the biosphere
1 Tg = 1012g
~147
~140
5
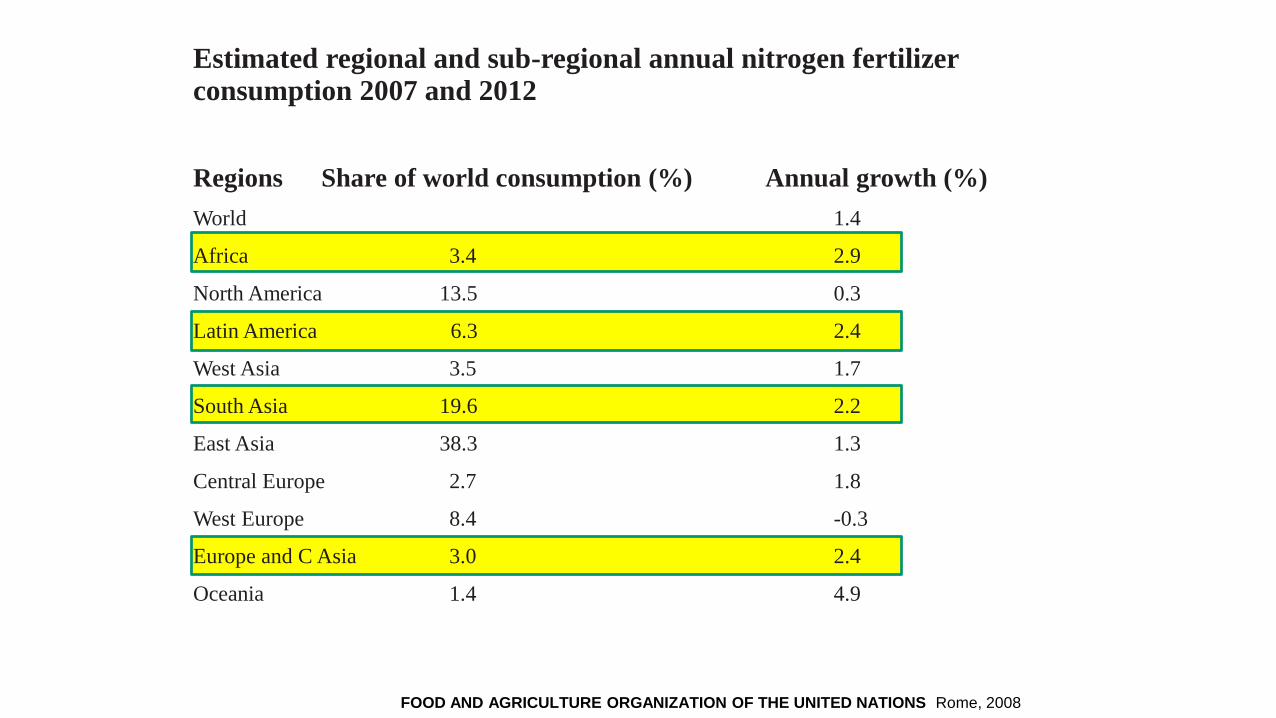
Estimated regional and sub-regional annual nitrogen fertilizer consumption 2007 and 2012
Regions Share of world consumption (%) Annual growth (%)
World 1.4
Africa 3.4 2.9
North America 13.5 0.3
Latin America 6.3 2.4
West Asia 3.5 1.7
South Asia 19.6 2.2
East Asia 38.3 1.3
Central Europe 2.7 1.8
West Europe 8.4 -0.3
Europe and C Asia 3.0 2.4
Oceania 1.4 4.9
FOOD AND AGRICULTURE ORGANIZATION OF THE UNITED NATIONS Rome, 2008
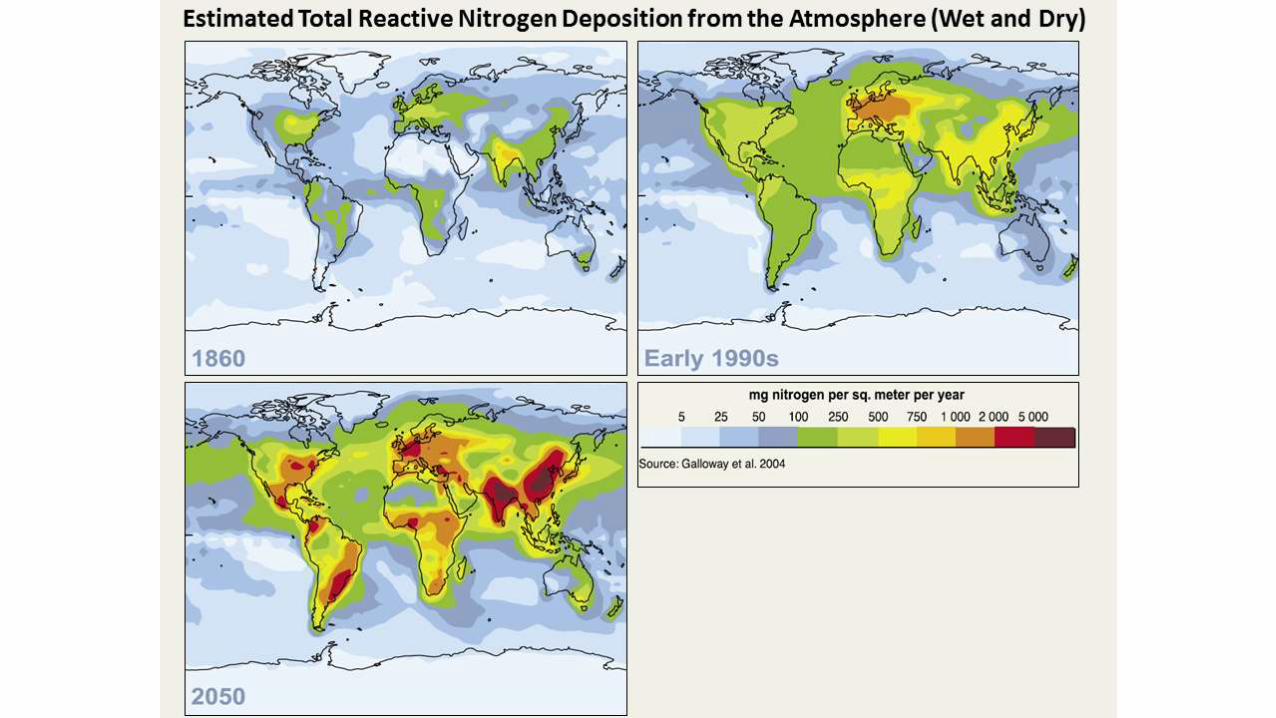
Total reactive nitrogen deposition for 2000 (mg N m-2 y-1)
Detener et al. Global Biogeochemical Cycles 2006
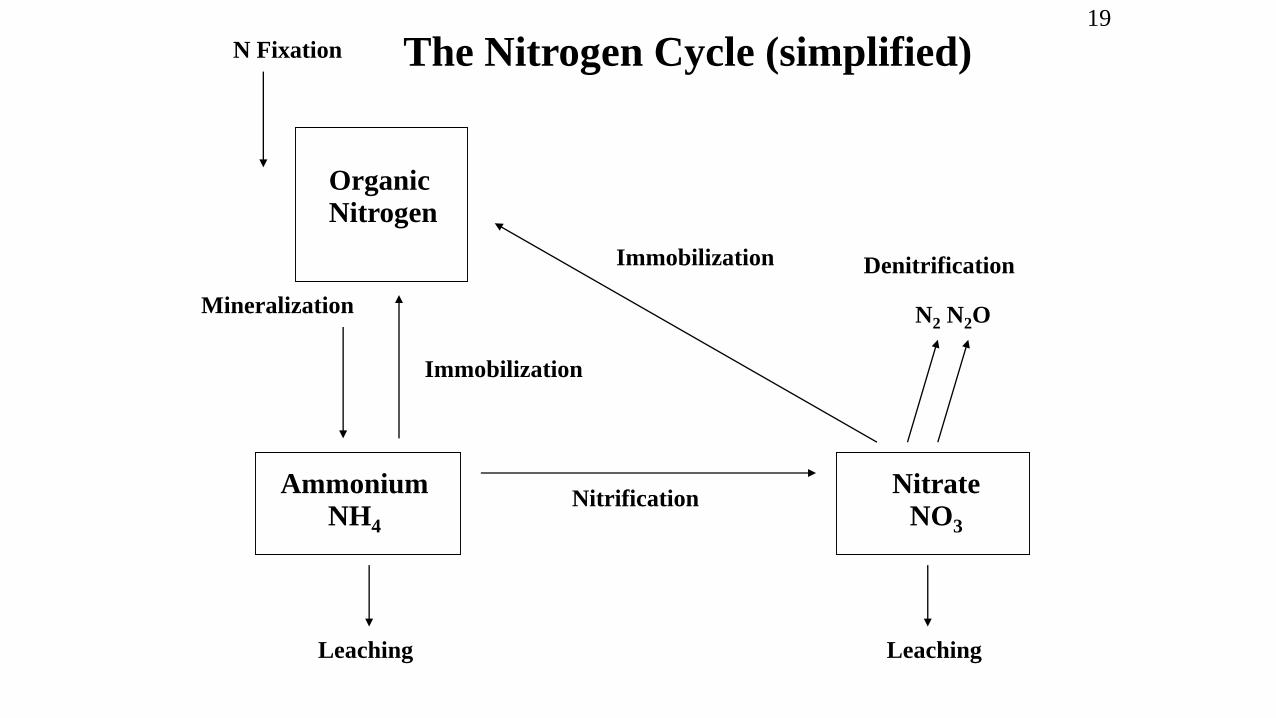
AmmoniumNH4
NitrateNO3
OrganicNitrogen
N2 N2O
Immobilization
Immobilization
Mineralization
Nitrification
Leaching Leaching
N Fixation
Denitrification
The Nitrogen Cycle (simplified)19
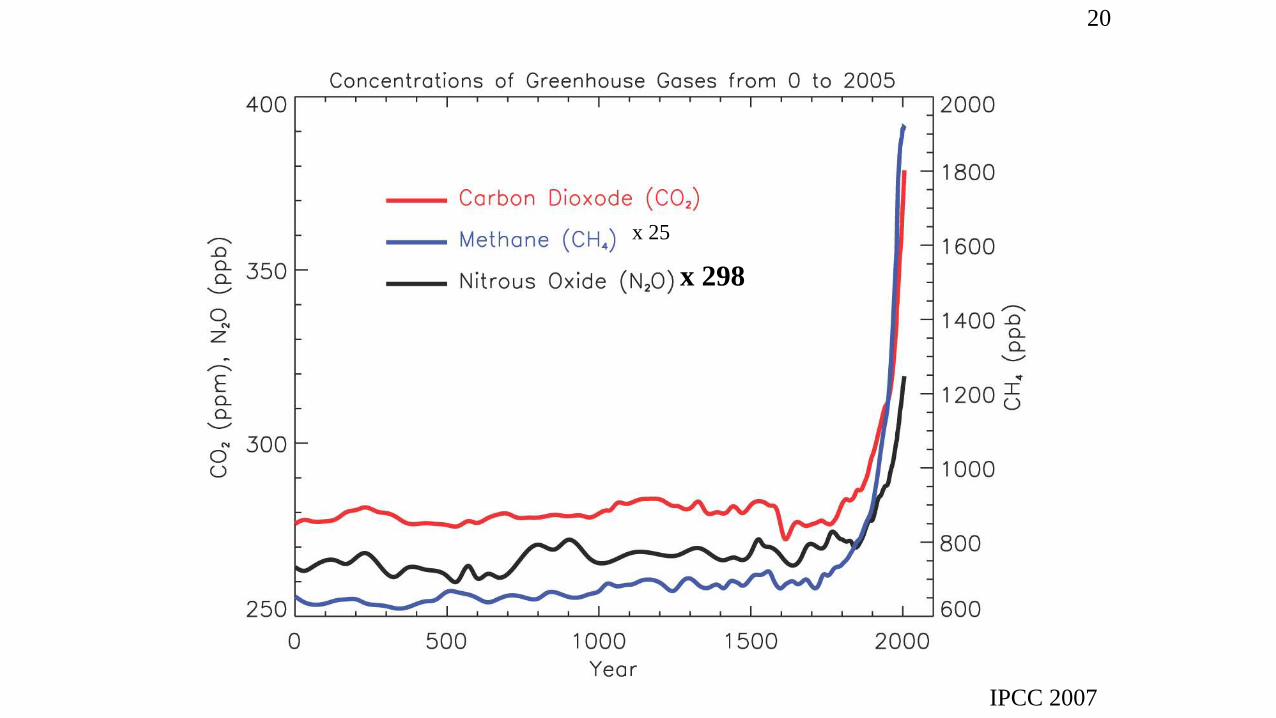
IPCC 2007
x 298
x 25
20