eCook Myanmar Cooking Diaries - mecs.org.uk
108
eCook Myanmar Cooking Diaries October 2019 Working Paper (final report expected December 2019) Main authors: Jon Leary, Nigel Scott, Wint Wint Hlaing, Aung Myint, Sane Sane, Phyu Phyu Win, Thet Myat Phyu, Ei Thinzar Moe, Than Htay, Simon Batchelor, Dipti Vaghela Associate authors: Matt Leach, Ed Brown Innovate Project 132724 Implemented by: Funded by: With additional analysis by:
Transcript of eCook Myanmar Cooking Diaries - mecs.org.uk
eCook Myanmar Cooking Diaries October 2019 Working Paper
(final report expected December 2019)
Main authors: Jon Leary, Nigel Scott, Wint Wint Hlaing, Aung Myint, Sane Sane, Phyu Phyu Win, Thet Myat Phyu, Ei Thinzar Moe, Than Htay,
Simon Batchelor, Dipti Vaghela Associate authors: Matt Leach, Ed Brown
Innovate Project 132724 Implemented by:
Funded by:
With additional analysis by:

Acknowledgement
The findings presented in this report would not have been possible without the dedication and
enthusiasm of the twenty two households who diligently recorded data on everything they cooked for
six whole weeks. Their willingness to experiment with new appliances and share their experiences
created a rich learning opportunity. We are also grateful to the staff of REAM, both those named as
authors and the supporting staff, who helped reveal what really goes on in Myanmar kitchens. Finally,
we thank the donors, UK Aid (DfID) via Innovate UK for partial funding and the directors and
shareholders of Gamos who matched the funding for the benefit and public good of Myanmar.
Additional analysis was carried out under the Modern Energy Cooking Services (MECS) programme, also
funded by UK Aid.
Rights, permissions & disclaimer
This work is available under the Creative Commons Attribution 4.0 International
license (CC BY 4.0) https://creativecommons.org/licenses/by/4.0/. Under the Creative
Commons Attribution license, you are free to: Share — copy and redistribute the material in any
medium or format; Adapt — remix, transform, and build upon the material; for any purpose, even
commercially.
Attribution: please cite this work as “Jon Leary, Nigel Scott, Wint Wint Hlaing, Aung Myint, Sane Sane,
Phyu Phyu Win, Thet Myat Phyu, Ei Thinzar Moe, Than Htay, Simon Batchelor, Dipti Vaghela, Matt Leach,
Ed Brown. 2019. “eCook Myanmar Cooking Diaries – October 2019 Working Paper.” REAM,
Loughborough University, University of Surrey & Gamos Ltd. supported by Innovate UK, UK Aid (DfID) &
Gamos Ltd. Available from: www.MECS.org.uk”
This data and material have been funded by UK AID from the UK government; however, the views
expressed do not necessarily reflect the UK government’s official policies.

Executive Summary
This report presents the key learning points from the cooking diaries study to inform the future
development of eCook (battery-supported electric cooking) within Myanmar. The aim of this study is to
gain a deeper understanding of how households in Myanmar cook and how compatible this is with
electricity. This mixed methods approach gathers data from various sources: cooking diary forms, energy
measurements, a registration survey an exit survey.
Despite decades of work on improving the efficiencies of biomass stoves, there seems to be little
available data on ‘how’ people cook. Modern fuels such as gas & electricity are more controllable & can
be turned on/off in an instant. There are also a huge range of electric cooking appliances, each designed
for specific processes (e.g. microwave for reheating). Therefore, it is important to know how often
people are frying, boiling, reheating or doing something else entirely.
22 households (HHs) were asked to keep detailed cooking diaries, recording exactly what they cooked,
when and how for six weeks. For the first two weeks they were asked to cook as they would normally,
using their usual fuels and stoves. For the remaining four weeks, they were asked to transition to
cooking with electricity, using a range of electric cooking appliances, including rice cookers, Electric
Pressure Cookers (EPCs), induction stoves and thermo-pots, plus any electrical appliances they already
owned. Fuel quantities were measured by weighing firewood, charcoal or LPG cylinders before and after
each “cooking event”; plug-in electricity meters were used for the electric cooking appliances.
The study samples were drawn from a mixture of rural and per-urban households in the Dry Zone and
Ayeyarwady Delta regions and urban households in Yangon and therefore represent an evolved mix of
traditional and modern cuisine. A database of foods cooked; cooking time and duration; and energy
used was assembled. The probability distributions for the energy required to cook each meal type were
produced, and disaggregated as far as possible to explore the influence of a variety of parameters,
including fuel, appliance and meal type.
The cooking diaries study in Myanmar has shown that cooking with electricity is compatible with
Myanmar cuisine and that modern energy-efficient appliances are highly desirable to everyday cooks. In
particular, the rice cooker, electric frying pan, thermo-pot and Electric Pressure Cooker (EPC) are prime
candidates for future eCook products. Insulation not only significantly reduces the energy demand for
cooking, but also mitigates the impact of short blackouts and low voltage, simply by stopping heat from
escaping from the cooking pot.
In Myanmar, electricity is already the aspirational fuel, however the grid is heavily overloaded, placing
severe restrictions on how people cook with electricity. Many of the participants from the cooking

diaries study could only cook at certain times of the day, as at peak times, the voltage regularly sags to
levels where it is unusable without a voltage stabiliser (<150V). As a result, integrating battery-storage
into cooking appliances is likely to be beneficially from both a user and grid-stability perspective. For the
user, it would enable cooking throughout the day and predictable performance, as the voltage would be
much more stable. Plus it would also allow them to use other low power appliances by also connecting
them to the battery. For the grid operator, it would smooth out the load profile, as the battery could be
trickle charged at off-peak times and discharged at meal times, effectively time shifting cooking loads
into times when spare generating capacity is available.
LPG is not yet popular in Myanmar, as the market was extremely restricted under military rule. However
if the market develops, it may well become an attractive option to consumers. Nonetheless, as grid
electricity is so cheap in Myanmar and electric appliances such as the rice cooker and electric frying pan
are already so embedded within kitchen routines, it is unlikely that many households would completely
switch over from electricity to LPG. Instead, a fuel stacking scenario with LPG and electric appliances
seems much more attractive for modern cooks in Myanmar wanting to mitigate the highly unstable
nature of electricity from the national grid. This scenario would have the additional advantage of
combining the manual control of LPG and automatic control of electricity to enable both fine control for
specific dishes and multi-tasking.

Table of Contents
ACKNOWLEDGEMENT .......................................................................................................................................... 2
RIGHTS, PERMISSIONS & DISCLAIMER .................................................................................................................. 2
EXECUTIVE SUMMARY ......................................................................................................................................... 3
1 INTRODUCTION ........................................................................................................................................... 6
1.1 BACKGROUND .................................................................................................................................................. 7
1.1.1 Context of the potential landscape change by eCook .............................................................................. 7
1.1.2 Introducing ‘eCook’ .................................................................................................................................. 8
1.1.3 eCook in Myanmar .................................................................................................................................. 9
1.2 AIM ............................................................................................................................................................... 9
2 METHODOLOGY ......................................................................................................................................... 10
2.1 THE COOKING DIARY METHODOLOGY .................................................................................................................. 10
2.2 COOKING DIARIES IN MYANMAR ........................................................................................................................ 11
3 RESULTS .................................................................................................................................................... 14
3.1 TYPICAL MYANMAR FOODS ............................................................................................................................... 14
3.2 OVERVIEW OF DATA ........................................................................................................................................ 15
3.2.1 Overview of participants ........................................................................................................................ 15
3.2.2 Identifying valid records ........................................................................................................................ 15
3.2.3 Description of valid data records ........................................................................................................... 17
3.3 ENERGY CONSUMPTIONS .................................................................................................................................. 22
3.3.1 Mix of fuels ............................................................................................................................................ 23
3.3.2 Per capita consumptions ....................................................................................................................... 24
3.3.3 Energy consumption by heating event .................................................................................................. 27
3.3.4 Energy consumption per day ................................................................................................................. 32
3.3.5 24 hour electricity load profiles ............................................................................................................. 37
3.4 MEALS COOKED .............................................................................................................................................. 45
3.4.1 Food types cooked ................................................................................................................................. 45
3.4.2 Reheating food ...................................................................................................................................... 47
3.4.3 Energy to cook food types ..................................................................................................................... 50
3.5 COOKING DEVICES ........................................................................................................................................... 52
3.5.1 Detail on how participants cook ............................................................................................................ 52
3.5.2 Characteristics of different cooking devices .......................................................................................... 54
3.5.3 Fuel stacking .......................................................................................................................................... 56
3.5.4 Energy used by different electrical appliances (Phase 2) ....................................................................... 58

3.6 TIME TAKEN ................................................................................................................................................... 60
3.6.1 Time taken to cook food types ............................................................................................................... 60
3.6.2 Time taken to prepare meal .................................................................................................................. 63
3.6.3 Time of day ............................................................................................................................................ 66
3.7 WATER HEATING ............................................................................................................................................. 68
3.7.1 Responses to exit survey questions ....................................................................................................... 70
4 EVALUATION ............................................................................................................................................. 71
4.1 DATA LIMITATIONS .......................................................................................................................................... 71
4.1.1 Dish level data ....................................................................................................................................... 71
4.2 ENUMERATOR VISITS & DIGITISATION OF DATA ..................................................................................................... 73
4.3 SAMPLE DIVERSITY .......................................................................................................................................... 74
5 CONCLUSION ............................................................................................................................................. 75
6 APPENDIX .................................................................................................................................................. 76
6.1 APPENDIX A: PROBLEM STATEMENT AND BACKGROUND TO INNOVATE ECOOK PROJECT ................................................ 76
6.1.1 Beyond business as usual ....................................................................................................................... 76
6.1.2 Building on previous research ................................................................................................................ 78
6.1.3 Summary of related projects ................................................................................................................. 81
6.1.4 About the Modern Energy Cooking Services (MECS) Programme. ........................................................ 82
6.2 APPENDIX B: COOKING DIARIES REGISTRATION FORM ............................................................................................. 86
6.2.1 Checklist for enumerators ...................................................................................................................... 86
6.2.2 Cooking Diaries Registration Form ........................................................................................................ 87
6.3 APPENDIX C: COOKING DIARY FORM ................................................................................................................... 94
6.4 APPENDIX D: DAILY SUMMARY FORM ................................................................................................................. 99
6.5 APPENDIX E: COOKING DIARIES EXIT SURVEY ...................................................................................................... 101
1 Introduction
This report presents one part of the detailed in country research carried out to explore the market for
eCook in Myanmar. In particular, this in country work aims to gain much greater insight into culturally
distinct cooking practices and explore how compatible they are with battery-supported electric cooking.
The report is rich with detail and is intended to provide decision makers, practitioners and researchers
with new knowledge and evidence.
This report presents findings from the design, assembly and testing of a concept prototype to inform the
future development of eCook within Myanmar. It is one component of a broader study designed to
assess the opportunities and challenges that lay ahead for eCook in high impact potential markets, such
as Myanmar, funded through Innovate UK’s Energy Catalyst Round 4 by DfID UK Aid and Gamos Ltd.
(https://elstove.com/innovate-reports/). A much deeper analysis of the data collected during this
project was supported by the Modern Energy Cooking Services (MECS) programme, which included the
writing of this report.
The overall aims of the Innovate project, plus the series of interrelated projects that precede and follow
on from it are summarised in in Appendix A: Problem statement and background to Innovate eCook
project.
1.1 Background
1.1.1 Context of the potential landscape change by eCook
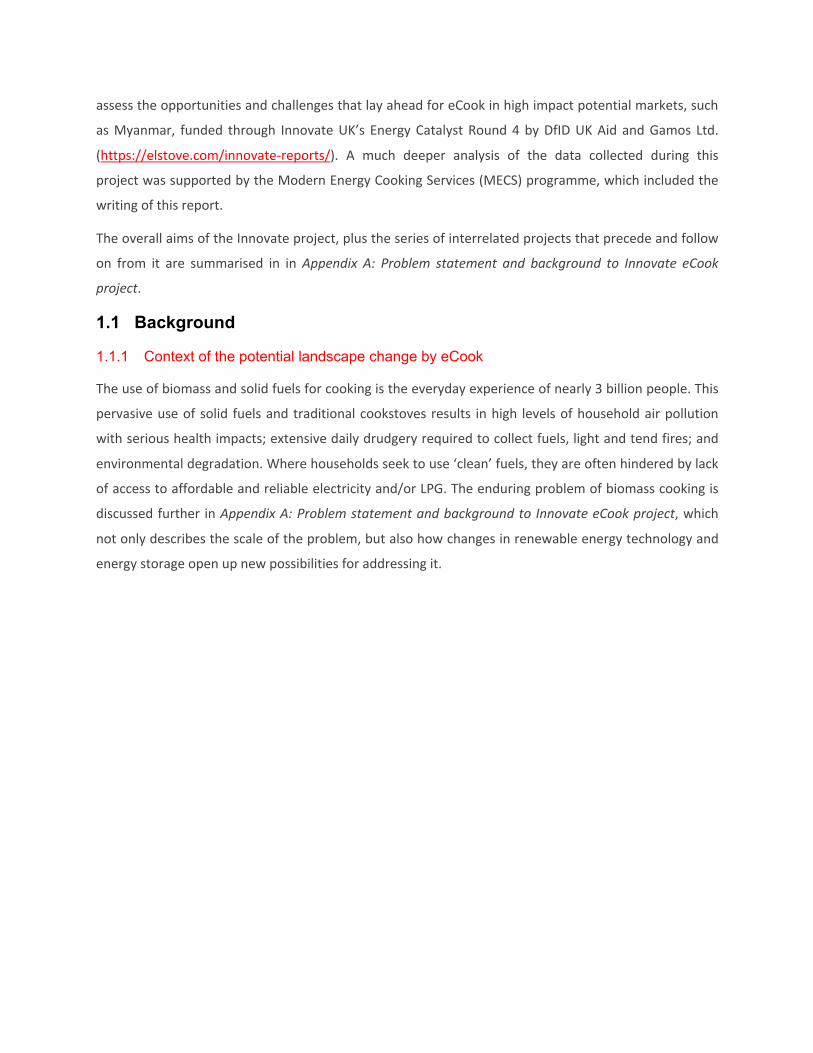
The use of biomass and solid fuels for cooking is the everyday experience of nearly 3 billion people. This
pervasive use of solid fuels and traditional cookstoves results in high levels of household air pollution
with serious health impacts; extensive daily drudgery required to collect fuels, light and tend fires; and
environmental degradation. Where households seek to use ‘clean’ fuels, they are often hindered by lack
of access to affordable and reliable electricity and/or LPG. The enduring problem of biomass cooking is
discussed further in Appendix A: Problem statement and background to Innovate eCook project, which
not only describes the scale of the problem, but also how changes in renewable energy technology and
energy storage open up new possibilities for addressing it.

1.1.2 Introducing ‘eCook’
eCook is a potentially transformative battery-supported electric cooking concept designed to offer
access to clean cooking and electricity to poorer households (HHs) currently cooking on charcoal or
other polluting fuels (Batchelor 2013; Batchelor 2015a; Batchelor 2015b). Enabling affordable electric
cooking sourced from renewable energy technologies, could also provide households with sustainable,
reliable, modern energy for a variety of other purposes.
A series of initial feasibility studies were funded by UK Aid (DfID) under the PEAKS mechanism (available
from https://elstove.com/dfid-uk-aid-reports/). Slade (2015) investigated the technical viability of the
proposition, highlighting the need for further work defining the performance of various battery
chemistries under high discharge and elevated temperature. Leach & Oduro (2015) constructed an
economic model, breaking down PV-eCook into its component parts and tracking key price trends,
concluding that by 2020, monthly repayments on PV-eCook were likely to be comparable with the cost
of cooking on charcoal. Brown & Sumanik-Leary's (2015), review of behavioural change challenges
highlighted two distinct opportunities, which open up very different markets for eCook:
• PV-eCook uses a PV array, charge controller and battery in a comparable configuration to the
popular Solar Home System (SHS) and is best matched with rural, off-grid contexts.
• Grid-eCook uses a mains-fed AC charger and battery to create distributed HH storage for
unreliable or unbalanced grids and is expected to best meet the needs of people living in urban
slums or peri-urban areas at the fringes of the grid (or on a mini-grid) where blackouts are
common.
Figure 1: Pictorial definitions of ‘eCook’ terminology used in this report.
= PV-eCook + + +
+ + + = Grid-eCook
= eCook +

1.1.3 eCook in Myanmar
Given the technical and socio-economic feasibility of the systems in the near future, Gamos,
Loughborough University and the University of Surrey have sought to identify where to focus initial
marketing for eCook. Each country has unique market dynamics that must be understood in order to
determine which market segments to target are and how best to reach them. Leary et al. (2018) carried
out a global market assessment, highlighting that the liberalisation of Myanmar opens the door to a
significant charcoal market, with a small percentage of users already cooking on electricity, paving the
way for eCook.
The accompanying reports from the other activities carried out in Myanmar can be found at:
https://elstove.com/innovate-reports/ and www.MECS.org.uk.
1.2 Aim
The aim of this study is to gain a deeper understanding of how households in Myanmar cook and how
compatible this is with electricity.
In particular, the objectives of the study are:
• To find out what households in Myanmar cook and how
• To assess the user acceptability of electricity for cooking popular Myanmar dishes
o Can people cook the foods they want?
o If so, which appliances are best matched with each food?
• To quantify the amount of energy households in Myanmar need to cook
o To make comparisons between electricity and popular fuels
o To generate cooking load profiles for typical households
2 Methodology 2.1 The cooking diary methodology
The cooking diary study is an innovative methodology that addresses
limitations of the standard tests associated with improved cookstoves. To
date, the standard international improved cookstove tests are the Water
Boiling Test (WBT), Controlled Cooking Test (CCT) and the Kitchen
Performance Test (KPT). None of these tests were designed to give key
insights into ‘how’ a cook cooks, and whether, when they transition to a
different fuel or appliance, their cooking practices change. Cooking is a
deeply cultural experience, as the foods people cook and the practices
they use to prepare them vary widely. To date studies of the ‘how’
people cook have been based on observational qualitative data.
The cooking diary study was applied in Myanmar to offer a deeper
exploration into the unique cooking practices of individual households,
paired with quantitative measurements of energy consumption. 22
households were selected to participate in the study, based upon the
fuels they cooked with and their willingness and ability to record high
quality data for the duration of the study. This mixed methods approach
gathers data from various sources:
• Cooking diary forms
o Data on foods cooked, cooking processes and times,
appliances used.
o Appendix C: Cooking diary form.
o Appendix D: Daily summary form.
• Energy measurements
o Manual measurements of fuel use and electricity
consumption taken by participants.
• Registration surveys
o Simple demographic data on participants.
o o Appendix B: Cooking diaries registration form.
• Exit surveys
o Qualitative feedback from participants.
DESPITE DECADES OF
WORK ON IMPROVING
THE EFFICIENCIES OF
BIOMASS STOVES,
THERE SEEMS TO BE
LITTLE AVAILABLE
DATA ON ‘HOW’ PEOPLE
COOK.
MODERN FUELS SUCH AS
GAS & ELECTRICITY ARE
MORE CONTROLLABLE &
CAN BE TURNED ON/OFF
IN AN INSTANT. THERE
ARE ALSO A HUGE RANGE
OF ELECTRIC COOKING
APPLIANCES, EACH
DESIGNED FOR
SPECIFIC PROCESSES
(E.G. MICROWAVE FOR
REHEATING).
THEREFORE, IT IS
IMPORTANT TO KNOW
HOW OFTEN PEOPLE ARE
FRYING, BOILING,
REHEATING OR DOING
SOMETHING ELSE
ENTIRELY.

o Appendix E: Cooking diaries exit survey.
Data was recorded in two stages:
• Baseline: cooking as normal. • Transition: cooking with electric appliances only.
2.2 Cooking diaries in Myanmar
Enumerators visited participating households throughout the research. The study began with a
registration survey designed to capture basic information on who cooks are cooking for, the appliances
they use and why (
Appendix B: Cooking diaries registration form). Enumerators explained the purpose of the research,
obtained informed consent from participants and showed participants how to take energy
measurements complete the diary forms (Appendix C: Cooking diary form and Appendix D: Daily
summary form).
Energy measurements were taken before and after each heating event to give ‘meal-level resolution’
data (Table 1). Solid, liquid and gaseous fuels were measured using the difference in weight between
before and after cooking from a hanging balance, whilst electricity consumption was measured using a
plug-in electricity meter (Figure 2). Gas is the hardest fuel to measure by weight, as the weight of gas
used in each meal is relatively small compared to the total weight of the cylinder.
Table 1: Measurement techniques for energy consumption during each heating event.
Technique Equipment Accuracy Installation Procedure
Weight Hanging balance 5-10g Metal frame Fixed hanging point far from
walls found to ensure hanging object does
not touch when being weighed.
Hang bag of biomass, whole kerosene stove
or whole LPG cylinder (detaching regulator)
before cooking and again after cooking.
kWh
metering
Plug-in electric
meter
0.001kW
h
Plug-in meter plugged into socket, appliances
plugged into meter.
Zero meter before cooking, read kWh value
after cooking.

Figure 2: a) (left) Plug-in energy meters and b) hanging balance used to measure the total energy consumption of each heating event.
For the first 2 weeks of the study, baseline data was captured on how households currently cooked.
Before cooking, the cook would record the time and an energy reading by weighing the fuels they
planned to use. After cooking, they would again record time and energy, plus details of what they
cooked and how they cooked it. Data was recorded on paper forms (Appendix C: Cooking diary form and
Appendix D: Daily summary form), which were collected by the enumerators. The first day of data was
validated by the enumerators, who described the meal that was recorded to the participant from the
recorded data, noting and correcting any inconsistencies. Initially, participants were visited every day,
however once they were recording good quality data, the visits gradually decreased to around once a
week.
In the second part of the experiment, the households were asked to transition to using solely electricity
for cooking. Many households were already using electricity for a significant portion of their cooking, so
already owned several appliances, in particular rice cookers and red insulated frying pans. Rice cookers
and induction stoves were purchased for all households who didn’t already have one. Several
participating households also trialled thermo-pots and Electric Pressure Cookers (EPCs). They received
basic training on how to use each appliance. The appliances were plugged into a plug-in energy meter
(Figure 2), with an extension cable, where necessary. Participants were also able to continue using any
electrical appliances that they already owned, as long as they were plugged into the plug-in meter so
that energy consumption data could be captured. Data was recorded for a further 4 weeks, allowing
participants time to adapt their cooking practices around the new appliances.
The study finished with an exit survey, asking participants about their experience with cooking with
different electric appliances (Appendix E: Cooking diaries exit survey). Participants were also invited to
share their energy-efficient cooking practices by participating in the Chicken Curry eCooking Challenge.

A prize was offered to the participant who could cook half kg of chicken curry using the least energy
possible, whilst the enumerators observed and recorded their cooking practices to understand exactly
where energy was being saved/wasted.
Paper records kept by participants were transcribed into digital form by the enumerators. An Excel
worksheet was designed to mimic the paper form, with a macro to copy data from each ‘sheet’ into a
separate column in the database. Subsequent analysis of the complete database was performed in both
SPSS and Excel.
The cooking diaries protocols offer a more complete guide to this methodology for those looking to
replicate the cooking diaries study: www.mecs.org.uk/working-papers/

3 Results
3.1 Typical Myanmar foods
An overview of typical preparation techniques for popular Myanmar foods is given below, based upon
observations made of cooks during the cooking diaries study. Dishes are categorised into 4 groups
according to their compatibility with efficient electric cooking appliances and the potential energy and
time savings available: ‘heavy’, ‘staple’, ‘quick fry’ and ‘long fry and deep fry’ foods.
‘Heavy’ foods generally require boiling for 60 minutes or more. They are easy to cook on an EPC, which
can offer significant energy & time savings over uninsulated appliances (hotplates, induction stoves or
infra-red stoves) or a rice cooker with moderate energy savings.
• Beans - assumed that other unnamed cereals (peas, lentils, green grams) may well have been put in this category. Usually stewed. Typically dry, so require rehydrating as well as cooking - some people soak before cooking, others just cook for longer. Many people will pre-cook (boil) in bulk and wet fry portions throughout the week.
• Meat/fish/egg/veg curry – Stewed meat with a thick sauce. Chicken/fish/egg/veg curries generally cooked for a lot less time than meat, but difficult to separate out without going through the quantity field one by one.
• Dry fish - requires rehydrating as well as cooking. Often stewed. Big dried fish take several hours to cook and need long boiling, little dried fish (kapenta), would fit much better in the 'quick fry' category.
‘Staple’ foods and water that require boiling for 15 minutes or more can also be cooked on an EPC or
rice cooker, with moderate energy & time savings.
• Noodles, Coconut milk noodles, Myanmar vermicelli - Boiled and then often stir fried • Rice - Usually just boiled. Sticky rice categorised separately below. • Soup – Just boiled.
‘Quick fry’ foods can also be cooked on an EPC or rice cooker, but some households may be reluctant to
try and/or there are limited energy savings.
• Eggs - Often boiled, but can also be fried. • Other meat/fish/tofu - Typically stir fried. • Other veg - Can be dry fried or wet fried. Some are boiled or blanched beforehand.
‘Long fry and deep fry’ foods are very difficult to cook on an EPC or rice cooker, as they require precise
temperature control.
• Pancakes - Shallow fried one by one in a shallow pan, as they must be flipped and swapped over many times. Requires low heat evenly distributed throughout the pan.
• French fries - Deep fried. If oil too hot, they burn, if too cold, they go soggy. • Sticky rice - Boil like normal rice and then shallow fry with low, even heat.

3.2 Overview of data 3.2.1 Overview of participants
AT THE TIME OF WRITING, REGISTRATION SURVEY DATA HAD NOT YET BEEN PROCESSED
3.2.2 Identifying valid records
Paper records kept by participants were transcribed into digital form using an Excel worksheet. Data
from each heating event was entered into a separate column. Any given column could cover multiple
heating events e.g. an early morning record could include breakfast, preparing food for a baby, and
heating water (3 events). Participants created a total of 6,000 records. However, participants were
prompted to record details of events in seven periods of the day: early morning, breakfast time, mid-
morning and so on, so diligent participants created a large number of records in which no activity took
place.
Even if no details were recorded for a particular heating event, participants were asked to indicate why
this was the case. Results in Table 2 show that in one third of these cases, no food was eaten. However,
it turned out that in some cases, participants gave a reason for not recording data, and also recorded
information on a heating event. Examples include:
• participants did not eat but they prepared a meal for lunch and/or dinner (especially in morning periods);
• participants ate food prepared earlier without reheating, but they heated water for tea; • participants bought food, but only part of the meal (e.g. rice), so they recorded cooking details
for the rest of the meal.
Therefore, many cases flagged as having no data do actually contain valid data on heating events.
Table 2 Reasons no heating data recorded
Frequency Percent
(n=6000)
Forgot to fill in a form 2 0%
Bought food 476 7.9%
Ate food prepared earlier without reheating 1479 24.7%
Ate at friend/family members' place 92 1.5%

Did not eat 2199 36.7%
Before continuing with the analysis, the dataset should be reduced to contain on records with valid data.
But what constitutes valid data?
One third of cases are flagged as involving one or more heating event (breakfast, lunch, dinner, heating
water, snack, food for baby, and other) – see Table 3. There were additional records, not allocated to
any heating event, that contained valid information on foods cooked, and/or water heated. Valid data
has been selected to capture all of these records:
• A heating event was specified; • Detail of food was recorded (Dish 1); • Any water heating event was recorded (for bathing, purifying drinking water, making hot drinks,
or other).
On this basis, and after duplicate records were removed, the analysis has proceeded with a dataset of
1,938 valid records.
There was a substantial number of cases in which food that did not require heating was recorded
(mostly bought), but no detail of the food was recorded, nor was it allocated to a specific heating event
(e.g. lunch).
Table 3 Number of heating events recorded in each case
Frequency Percent
Valid 1.00 1412 23.5
2.00 315 5.3
3.00 187 3.1
4.00 53 .9
5.00 1 .0
Total 1968 32.8
Missing System 4032 67.2
Total 6000 100.0

3.2.3 Description of valid data records
One quarter of data records covered multiple heating events (see Table 4).
Table 4 Number of heating events captured (valid records)
Frequency Percent
Valid 1.00 1401 72.3
2.00 288 14.9
3.00 159 8.2
4.00 53 2.7
5.00 1 .1
Total 1902 98.1
Missing System 36 1.9
Total 1938 100.0
Cooking dinner is the most common single heating event (Table 5), closely followed by lunches. The
number of breakfasts in the data set is lower because people often bought breakfast (typically
mohinga1). The breakdown of heating events represented by those records relating to only a single
heating event was similar (see Table 6), although water was less often heated on its own as a single
event. N.B. of the 1401 cases with a single heating event, 30% included a water heating event (n=422).
Only 86 of these were allocated to ‘Heat water’ as the heating event, which means that 336 single
heating events actually included some ‘hidden’ water heating. These have been filtered out of most
calculations in order not to inflate energy consumption figures.
1 a rice noodle and fish soup from Myanmar and is an essential part of Burmese cuisine (Wikipedia).

Table 5 Number of heating events2
Heating event Frequency Percent
(n=1938)
Breakfast 634 32.7%
Lunch 819 42.3%
Dinner 845 43.6%
Snack 31 1.6%
Baby food 2 0.1%
Heat water 331 17.1%
Other 9 0.5%
Table 6 Breakdown of heating events (single heating event records only)
Heating event Frequency Valid Percent
Breakfast 379 27.1
Lunch 421 30.0
Dinner 497 35.5
Heat water 88 6.3
Snack 16 1.1
Total 1401 100.0
2 N.B. multiple heating events in each record means that total sums to more than 100%.
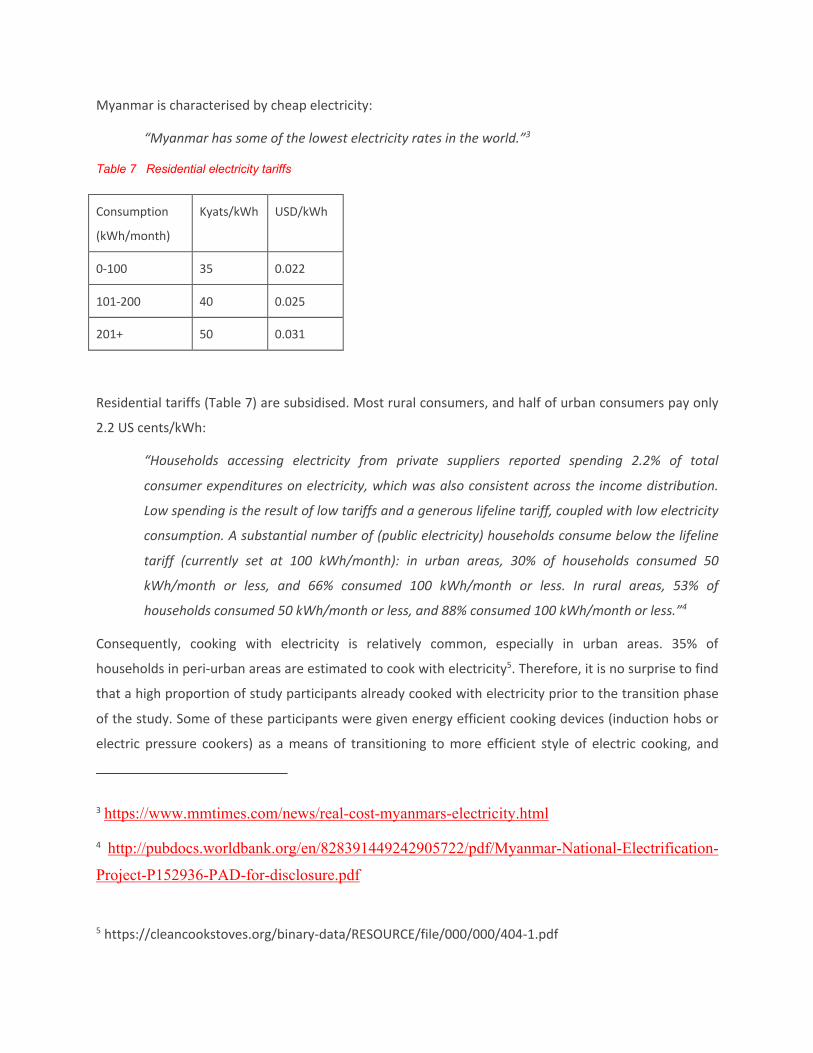
Myanmar is characterised by cheap electricity:
“Myanmar has some of the lowest electricity rates in the world.”3
Table 7 Residential electricity tariffs
Consumption
(kWh/month)
Kyats/kWh USD/kWh
0-100 35 0.022
101-200 40 0.025
201+ 50 0.031
Residential tariffs (Table 7) are subsidised. Most rural consumers, and half of urban consumers pay only
2.2 US cents/kWh:
“Households accessing electricity from private suppliers reported spending 2.2% of total
consumer expenditures on electricity, which was also consistent across the income distribution.
Low spending is the result of low tariffs and a generous lifeline tariff, coupled with low electricity
consumption. A substantial number of (public electricity) households consume below the lifeline
tariff (currently set at 100 kWh/month): in urban areas, 30% of households consumed 50
kWh/month or less, and 66% consumed 100 kWh/month or less. In rural areas, 53% of
households consumed 50 kWh/month or less, and 88% consumed 100 kWh/month or less.”4
Consequently, cooking with electricity is relatively common, especially in urban areas. 35% of
households in peri-urban areas are estimated to cook with electricity5. Therefore, it is no surprise to find
that a high proportion of study participants already cooked with electricity prior to the transition phase
of the study. Some of these participants were given energy efficient cooking devices (induction hobs or
electric pressure cookers) as a means of transitioning to more efficient style of electric cooking, and
3 https://www.mmtimes.com/news/real-cost-myanmars-electricity.html
4 http://pubdocs.worldbank.org/en/828391449242905722/pdf/Myanmar-National-Electrification-
Project-P152936-PAD-for-disclosure.pdf
5 https://cleancookstoves.org/binary-data/RESOURCE/file/000/000/404-1.pdf
others already had such devices in their homes prior to the study. A five point classification of records
was, therefore, considered:
1. Using mainly biomass or LPG (2 participants using LPG, 2 using charcoal, 2 using wood) 2. transitioned to using mainly electricity (5 participants) 3. using mainly electricity (baseline) (10 participants) 4. transitioned to include efficient electrical devices (10 participants) 5. previously equipped with efficient electrical devices (no transition) (5 participants).
The original design of the study was intended to make comparisons between cooking with biomass/LPG
and cooking with electricity. The prevalence of participants using electricity prior to the study held out
the promise of enabling a further comparison between cooking with ‘standard’ devices and cooking with
energy efficient devices.
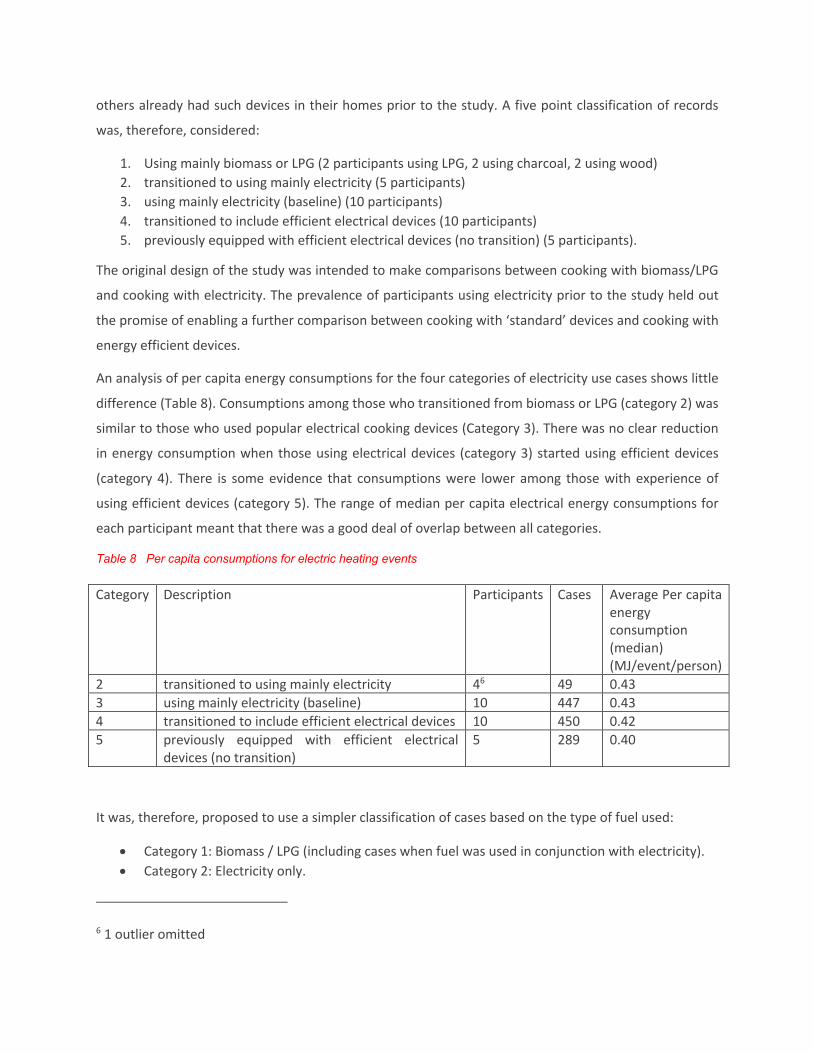
An analysis of per capita energy consumptions for the four categories of electricity use cases shows little
difference (Table 8). Consumptions among those who transitioned from biomass or LPG (category 2) was
similar to those who used popular electrical cooking devices (Category 3). There was no clear reduction
in energy consumption when those using electrical devices (category 3) started using efficient devices
(category 4). There is some evidence that consumptions were lower among those with experience of
using efficient devices (category 5). The range of median per capita electrical energy consumptions for
each participant meant that there was a good deal of overlap between all categories.
Table 8 Per capita consumptions for electric heating events
Category Description Participants Cases Average Per capita energy consumption (median) (MJ/event/person)
2 transitioned to using mainly electricity 46 49 0.43 3 using mainly electricity (baseline) 10 447 0.43 4 transitioned to include efficient electrical devices 10 450 0.42 5 previously equipped with efficient electrical
devices (no transition) 5 289 0.40
It was, therefore, proposed to use a simpler classification of cases based on the type of fuel used:
• Category 1: Biomass / LPG (including cases when fuel was used in conjunction with electricity). • Category 2: Electricity only.
6 1 outlier omitted

The five point classification was not able to clearly highlight differences in electrical energy
consumptions at the participant level, but analysis of electric heating cases (category 2 in the two point
classification) will be able to identify differences in energy consumptions at the device level.
Table 9 shows that this classification splits the sample roughly one third to two thirds.
Table 9 Classification of heating event records
Frequency Percent
Valid uses biomass/LPG 593 30.6
uses electricity only 1292 66.7
Total 1885 97.3
Missing System 53 2.7
Total 1938 100.0
Table 10 shows that biomass and LPG were more likely to be used when preparing breakfast (than
electricity), while lunches were more likely to be prepared using electricity.
Table 10 Breakdown of heating events by category (single heating event records only)
Heating
event
Biomass/LPG
(Category 1)
Electricity only
(Category 2)
Frequency Valid Percent Frequency Valid Percent
Breakfast 172 45.5% 197 19.9%
Lunch 72 19.0% 340 34.4%
Dinner 114 30.2% 370 37.4%
Heat water 16 4.2% 70 7.1%
Snack 4 1.1% 11 1.1%
Total 378 100.0% 988 100.0%

Energy consumption is proportional to the number of people being cooked for. Overall, the mean
number of adults per heating event was 3.8, and the mean number of children was 1.4 (n=791). If
children are weighted the same as adults, then the mean number of persons per heating event was 4.4
(n=1875). Most cases catered for 2 to 6 household members – see the distribution in Figure 3.
Figure 3 Distribution of persons per heating event
3.3 Energy consumptions
For each of the four dominant fuels, energy consumptions have been calculated from deduced fuel
consumptions (based on the before and after readings e.g. weight of wood (kg)) and the calorific values
given in Table 11.
Table 11 Calorific values7
Fuel Calorific value Wood 15.9 MJ/kg Charcoal 29.9 MJ/kg LPG 44.8 MJ/kg Electricity 3.6 MJ/kWh
7 Source: World Bank (BLG14 Cooking Costs by Fuel Type.xlsx)

3.3.1 Mix of fuels
The mix of fuels used in Category 1 cases is presented in Figure 4. This shows that wood and charcoal
account for the majority of energy consumed (91%). Only electricity was consumed in the Category 2
cases.
Figure 4 Energy content of fuels used in Category 1 (n=593)
Table 12 shows that in over one quarter of cases, biomass or LPG was used in conjunction with another
fuel. Table 13 shows that only three participants used LPG, and among participants who used biomass,
one third used both wood and charcoal
Table 12 Number of fuels used in single heating event
Category 1 Category 2
Frequency Percent Frequency Percent
1 427 72.0% 1292 100.0%
2 166 28.0%
Total 593 100.0% 1292 100.0%
Table 13 Use of fuels by participants (both categories)
Electricity LPG Charcoal Wood
1 x
2 x x
3 x x x
4 x x

5 x x
6 x x
7 x x
8 x x
9 x x x
10 x x x
11 x x
12 x x
13 x x
14 x
15 x
16 x x
17 x x x
18 x
19 x
20 x
22 x
3.3.2 Per capita consumptions
It has already been pointed out that energy consumption depends on the number of people being
cooked for. Per capita energy consumptions have been calculated simply by dividing the energy
consumption for the heating event by the number of people that the meal was cooked for. Note that
adults and children have been given an equal weighting when calculating per capita consumptions.
Among Category 1 records, different participants used different fuels, so per capita energy consumption
values will depend on the fuel being used. A single fuel was used in most heating events (Table 12), so
per capita consumptions for heating events using a single fuel only have been calculated (Table 14). This
table presents data from 418 out of 593 heating events in Category 1. Totals indicate that cooking with
charcoal uses roughly seven times as much energy as cooking with electricity (in Category 2), and
cooking with wood uses over eight times as much energy. Even though the number of records and
households is small, figures indicate that LPG uses twice as much energy as electricity.

Table 14 Per capita energy consumptions and number of people cooked for – single fuels only
Participant ID Category 1 Category 2
LPG Charcoal Wood Electricity
Median People (mean) N Median
People (mean) N Median
People (mean) N Median
People (mean) N
1 0.92 2.0 81 2 1.94 3.0 16 0.69 3.0 18 3 2.2 5.9 46 0.25 6.0 67 4 2.5 6.0 7 0.21 5.9 138 5 2.7 6.0 46 0.16 6.0 11 6 2.6 8.0 5 0.16 8.0 121 7 3.2 3.0 45 0.30 2.9 64 8 3.1 6.0 38 9 2.5 6.0 29 0.47 6.0 14 10 11 0.75 3.8 6 0.52 5.0 39 12 6.7 2.7 64 1.11 2.0 26 13 3.0 5.0 28 0.23 5.1 36 14 0.50 3.1 184 15 0.60 3.9 50 16 6.4 4.0 14 0.29 4.0 65 17 0.67 4.0 62 3.3 4.0 8 0.40 4.0 6 18 0.58 3.0 190 19 0.47 2.8 34 20 0.25 4.9 71 22 0.75 2.9 44 Total 0.75 3.8 84 2.8 5.5 131 3.2 4.2 203 0.38 4.3 1261
* results shown only for participants with 5 or more cases.

The main fuels used other than electricity were wood and charcoal; Figure 5 and Figure 6 plot median
per capita energy used against the mean number of people for each, but only for heating events where
only wood or only charcoal was used. A regression analysis shows that per capita wood energy
consumption goes down when cooking for larger numbers of people (β = -0.935, p < 0.001), as does the
per capita consumption of charcoal (β = -0.883, p < 0.001).
Figure 5 Relationship between per capita energy consumption and number of people – Category 1 Wood
Figure 6 Relationship between per capita energy consumption and number of people – Category 1 Charcoal

eCook Myanmar Cooking Diaries | October 2019 Working Paper
[email protected] | PV-ecook.org
This research is funded by DfID/UK Aid and Gamos through the Innovate UK Energy Catalyst and the MECS programme.
27
Figure 7 presents consumption data for Category 2 records, but only those heating events where only
electricity was used. Note the difference in scales between Figure 5 / Figure 6 and Figure 7. Regression
analysis shows that per capita electrical energy consumption also goes down with the number of people
cooked for (β = -0.114, p < 0.001).
Figure 7 Relationship between per capita energy consumption and number of people – Category 2 Electricity
These findings suggest that economies of scale can be achieved when using all three fuels. This might be
expected when cooking with biomass fuels – the size of the fire required to cook being almost
independent of the amount of food being cooked. However, it is somewhat surprising to find the same
effect when cooking with electricity, especially given the widespread use of energy efficient electrical
devices, notably rice cookers.
3.3.3 Energy consumption by heating event
Summing the energy consumed in all Category 1 records shows a huge amount of energy used to cook
breakfasts, most of which was wood (see Figure 8), however, wood was hardly used for lunches. LPG
was not used for cooking breakfasts.
The mix of fuels used for different events in Category 1 cases is also illustrated in Figure 9. Note that this
chart presents the number of occasions (or cases) in which fuels were used – it does not reflect the
amount of energy used, which is presented in Figure 8. It shows that for participants not using electricity
as their main cooking fuel:

eCook Myanmar Cooking Diaries | October 2019 Working Paper
[email protected] | PV-ecook.org
This research is funded by DfID/UK Aid and Gamos through the Innovate UK Energy Catalyst and the MECS programme.
28
• Wood was the dominant fuel of choice for breakfasts, yet it was not used at all for lunches (on its own)
• charcoal was the fuel of choice for lunches; • LPG was not used for dinners (on its own).
The median per capita energy consumptions for each type of heating event illustrate differences in the
overall conversion efficiencies associated with different fuels (Figure 10). Figures in Table 15 to Table 18
show inconsistencies in the way different fuels are used for different meals. Breakfasts are most energy
intensive when cooking with charcoal, and dinners when cooking with wood (on a per capita basis).
Figure 8 Total energy consumption by heating event (Category 1)

eCook Myanmar Cooking Diaries | October 2019 Working Paper
[email protected] | PV-ecook.org
This research is funded by DfID/UK Aid and Gamos through the Innovate UK Energy Catalyst and the MECS programme.
29
Figure 9 Choice of fuels for heating events (Category 1) single fuel only
Table 15 Per capita energy consumption by heating event – Category 1 LPG only
Heating event Frequency Mean (MJ/pers/event)
Median
(MJ/pers/event)
Std.dev. 25% Quartile
75% Quartile
Breakfast
Lunch 13 0.79 0.67 0.36 0.54 1.02
Dinner 17 0.74 0.67 0.30 0.59 0.79
Heating water 13 0.54 0.55 0.17 0.45 0.59
Snack
Food for baby

eCook Myanmar Cooking Diaries | October 2019 Working Paper
[email protected] | PV-ecook.org
This research is funded by DfID/UK Aid and Gamos through the Innovate UK Energy Catalyst and the MECS programme.
30
Table 16 Per capita energy consumption by heating event – Category 1 Charcoal only
Heating event Frequency Mean (MJ/pers/event)
Median
(MJ/pers/event)
Std.dev. 25% Quartile
75% Quartile
Breakfast 15 5.72 5.98 2.19 3.49 7.48
Lunch 27 3.45 2.62 2.82 1.94 3.49
Dinner 32 2.34 1.99 0.97 1.50 2.99
Heating water
Snack
Food for baby
Table 17 Per capita energy consumption by heating event – Category 1 Wood only
Heating event Frequency Mean (MJ/pers/event)
Median
(MJ/pers/event)
Std.dev. 25% Quartile
75% Quartile
Breakfast 19 3.07 2.65 0.97 2.12 3.98
Lunch
Dinner 21 2.02 1.86 0.86 1.33 2.57
Heating water
Snack 3 6.10 6.76 2.65 3.18 .
Food for baby

eCook Myanmar Cooking Diaries | October 2019 Working Paper
[email protected] | PV-ecook.org
This research is funded by DfID/UK Aid and Gamos through the Innovate UK Energy Catalyst and the MECS programme.
31
Table 18 Per capita energy consumption by heating event – Category 2 Electricity only
Heating event Frequency Mean (MJ/pers/event)
Median
(MJ/pers/event)
Std.dev. 25% Quartile
75% Quartile
Breakfast 96 0.27 0.21 0.15 0.16 0.32
Lunch 318 0.56 0.43 0.45 0.25 0.72
Dinner 306 0.29 0.20 0.56 0.14 0.28
Heating water 56 0.58 0.41 0.44 0.26 0.91
Snack 10 0.31 0.27 0.17 0.20 0.50
Figure 10 Per capita energy consumptions for different heating events

eCook Myanmar Cooking Diaries | October 2019 Working Paper
[email protected] | PV-ecook.org
This research is funded by DfID/UK Aid and Gamos through the Innovate UK Energy Catalyst and the MECS programme.
32
3.3.4 Energy consumption per day
The total energy consumed per day has been calculated as the sum of the energy consumption of all
heating events on a given date. Data has been calculated for 426 Category 1 person-days, and 676
Category 2 person-days.
In order to compare the energy required by different fuels to meet daily household needs, an analysis
has been conducted on only those days in which a single fuel was used for all heating events recorded in
a day. Not all meals are necessarily prepared each and every day (and neither are other heating events).
Table 19 shows that dinners and lunches were prepared most days, and breakfasts only on around half
of days (N.B. these values will be skewed towards the patterns of behaviour of those participants who
submitted records for a greater number of days.
Daily household energy consumptions, based on these daily patterns of heating events, are presented in
Table 20. Note that these values have not been normalised for the number of people catered for –
rather, they show the range of total daily energy consumptions at the household level, which is
dependent on the number of people that each meal was prepared for. The mean number of household
members catered for has been calculated for each day (across however many meals were prepared),
and the table presents the mean of these means. This indicates that wood and charcoal energy
consumption is an order of magnitude higher than the energy required when cooking with electricity.
The table also shows a nuancing of fuels chosen to cook different meals (category 1 records) –
participants who cooked with only LPG throughout the day prepared lunches almost all days, and few
breakfasts; those who cooked only with wood almost cooked breakfasts almost all days. N.B. any
participant may appear in different rows, e.g. they may cook with charcoal only on some days, and wood
only on other days (e.g. when the charcoal has run out).
Table 19 Participant-days in which heating events were flagged
Frequency Percent (n=953)
Breakfast 624 66%
Lunch 766 80%
Dinner 799 84%
Heating water 240 25%

eCook Myanmar Cooking Diaries | October 2019 Working Paper
[email protected] | PV-ecook.org
This research is funded by DfID/UK Aid and Gamos through the Innovate UK Energy Catalyst and the MECS programme.
33
Table 20 Total daily energy consumption (MJ/household/day) – use of single fuel in a day
Daily energy consumption (MJ/household/day)
Proportion of days with heating event Household members
(mean of means)
n Mean Q1 Median Q3 Breakfast Lunch Dinner Water heating
LPG (Category 1) 26 7.2 4.5 7.2 9.5 19% 92% 89% 65% 3.3
Charcoal (Category 1) 26 35.4 28.4 32.1 44.5 89% 8% 92% 0% 5.9
Wood (Category 1) 62 24.4 18.2 23.9 31.8 98% 57% 92% 31% 4.2
Electricity (Category 2) 476 4.0 2.4 3.7 5.1 57% 87% 77% 20% 4.0
Many participants cooked with electricity throughout the survey, and few made a discernible transition
from biomass / LPG to electricity. It is not possible, therefore, to plot daily load profiles for individual
fuels. Instead, the following figures present profiles for an illustrative mix of households:

eCook Myanmar Cooking Diaries | October 2019 Working Paper
[email protected] | PV-ecook.org
This research is funded by DfID/UK Aid and Gamos through the Innovate UK Energy Catalyst and the MECS programme.
34
Figure 11 Daily load profiles - LPG/electric transition to all electric
Figure 12 Daily load profiles - Charcoal/electric transition to all electric

eCook Myanmar Cooking Diaries | October 2019 Working Paper
[email protected] | PV-ecook.org
This research is funded by DfID/UK Aid and Gamos through the Innovate UK Energy Catalyst and the MECS programme.
35
Figure 13 Daily load profiles - Wood/electric (no transition)
Figure 14 Daily load profiles – All electric (no transition)

eCook Myanmar Cooking Diaries | October 2019 Working Paper
[email protected] | PV-ecook.org
This research is funded by DfID/UK Aid and Gamos through the Innovate UK Energy Catalyst and the MECS programme.
36
Daily energy demand profiles in Figure 11 to Figure 14 show wide fluctuations in daily energy
consumption. Mean energy consumptions by day of the week for example participants using biomass
are presented in Figure 15. These show a trend of slightly lower consumptions during the middle of the
week. Note that these figures typically represent the means of only 3 to 5 days. This is not so clear
among participants using electricity (Figure 15).
Figure 15 Mean daily energy consumption by day of the week

eCook Myanmar Cooking Diaries | October 2019 Working Paper
[email protected] | PV-ecook.org
This research is funded by DfID/UK Aid and Gamos through the Innovate UK Energy Catalyst and the MECS programme.
37
3.3.5 24 hour electricity load profiles
The energy consumption for any given day has been estimated from records for multiple heating events
(e.g. breakfast, lunch, dinner, heating water) – see Table 20. For each heating event, average power
consumption has been calculated for the time period during which the meal was prepared by dividing
the energy consumption by the time duration of the heating event (both start and end times for the
preparation of the meal were recorded for each heating event). Load patterns have been added
together for multiple heating events occurring on the same date to create a 24 hour load profile for
each day, for each household.
Two types of chart have been created:
• A multiple line chart showing 24 hour profiles for seven days (not necessarily consecutive days making up a week); this illustrates how much the shape of daily load profiles changes from day to day;
• A single line chart in which all daily load profiles have been aggregated together to give a smoother ‘average’ profile.
While these load profiles give a good idea of the overall patterns of consumption, they are conservative,
in that they do not include all electricity consumed. There are several reasons for this:
• Some records were omitted because they had incomplete (or nonsensical) electricity meter readings.
• Many records had incomplete start/end times for the heating event • Some combinations of energy consumption and event duration give unreasonably high power
levels, so a filter has been used to include only those records with an average power of 2.5 kW or less.
The load profiles in Figure 16 suggest that loads from most household exhibit two peaks, one for
preparing breakfast and another for preparing an evening meal e.g. Household ID 1,5. Others show
three distinct peaks e.g. Household ID 6, 18.
When loads from all households are aggregated together, the combined effect is for an early morning
peak, as all households prepare breakfasts, and more diluted peaks in late morning and evening – see
Figure 17.

eCook Myanmar Cooking Diaries | October 2019 Working Paper
[email protected] | PV-ecook.org
This research is funded by DfID/UK Aid and Gamos through the Innovate UK Energy Catalyst and the MECS programme.
38
ID 7 day chart Aggregate chart (all records)
1
2
3

eCook Myanmar Cooking Diaries | October 2019 Working Paper
[email protected] | PV-ecook.org
This research is funded by DfID/UK Aid and Gamos through the Innovate UK Energy Catalyst and the MECS programme.
39
ID 7 day chart Aggregate chart (all records)
4
5
6

eCook Myanmar Cooking Diaries | October 2019 Working Paper
[email protected] | PV-ecook.org
This research is funded by DfID/UK Aid and Gamos through the Innovate UK Energy Catalyst and the MECS programme.
40
ID 7 day chart Aggregate chart (all records)
7
9
10

eCook Myanmar Cooking Diaries | October 2019 Working Paper
[email protected] | PV-ecook.org
This research is funded by DfID/UK Aid and Gamos through the Innovate UK Energy Catalyst and the MECS programme.
41
ID 7 day chart Aggregate chart (all records)
11
12
13

eCook Myanmar Cooking Diaries | October 2019 Working Paper
[email protected] | PV-ecook.org
This research is funded by DfID/UK Aid and Gamos through the Innovate UK Energy Catalyst and the MECS programme.
42
ID 7 day chart Aggregate chart (all records)
14
15
16

eCook Myanmar Cooking Diaries | October 2019 Working Paper
[email protected] | PV-ecook.org
This research is funded by DfID/UK Aid and Gamos through the Innovate UK Energy Catalyst and the MECS programme.
43
ID 7 day chart Aggregate chart (all records)
18
19
20

eCook Myanmar Cooking Diaries | October 2019 Working Paper
[email protected] | PV-ecook.org
This research is funded by DfID/UK Aid and Gamos through the Innovate UK Energy Catalyst and the MECS programme.
44
ID 7 day chart Aggregate chart (all records)
22
Figure 16 24 hour load profiles (all households Category 2 only)
Figure 17 24 hour load profile – aggregated from all households (Category 2 only)

eCook Myanmar Cooking Diaries | October 2019 Working Paper
[email protected] | PV-ecook.org
This research is funded by DfID/UK Aid and Gamos through the Innovate UK Energy Catalyst and the MECS programme.
45
3.4 Meals cooked
3.4.1 Food types cooked
Separating out foods cooked for breakfast, lunch or dinner only, Table 21 shows a good degree of
consistency in the mix of foods cooked in both categories i.e. cooking with electricity did not cause
participants to change what they cooked. There are a couple of exceptions e.g. when cooking with
electricity, participants were less likely to cook rice and curries in particular. Overall, category 2 meals
cooked with electricity had less of most food types, which is consistent with the finding in Table 22 that
meals cooked with electricity tended to be simpler, comprising fewer dishes.
N.B. food information was submitted in almost all records.
Table 21 Number of meals containing food types (Breakfast, lunch and dinner heating events only)
Category 1 Category 2
N = 564 N = 1187
Frequency Percent Frequency Percent
Sticky rice 8 1.4% 8 0.7%
Rice 525 93.1% 865 72.9%
Eggs 56 9.9% 88 7.4%
Dry fish 52 9.2% 31 2.6%
Myanmar vermicelli 8 1.4% 8 0.7%
French fries 1 0.2% 3 0.3%
Coconut milk noodels 1 0.2% 1 0.1%
Meat/fish/egg/veg curry 271 48.0% 396 33.4%
Other meat/fish/tofu 64 11.3% 93 7.8%
Other veg 122 21.6% 179 15.1%
Beans 43 7.6% 41 3.5%
Noodles 3 0.5% 16 1.3%
Soup 82 14.5% 106 8.9%
Other 212 37.6% 281 23.7%

eCook Myanmar Cooking Diaries | October 2019 Working Paper
[email protected] | PV-ecook.org
This research is funded by DfID/UK Aid and Gamos through the Innovate UK Energy Catalyst and the MECS programme.
46
Table 22 Number of foods included in a heating event (Breakfast, lunch and dinner heating events only)
Number of food types in meal
Category 1 Category 2 Total
Frequency Percent Frequency Percent
1 108 19% 489 42% 597
2 158 28% 453 39% 611
3 200 36% 154 13% 354
4 72 13% 56 5% 128
5 23 4% 7 1% 30
6 2 0% 0 0% 2
Total 563 100% 1159 100% 1722
It can be seen from Table 23 that some foods tend to be eaten on their own, such as rice and noodles.
Others, such as dry fish and beans are more likely to be eaten in complex meals (4 or more food types).
Table 23 Occurrence of foods in meals by number of foods in the meal (all heating events, Phase 1, 2 and 3)
Food type Number of food types in meal
1 2 3 4 5 6
Sticky rice 2 4 1 1 0 0
Rice 452 479 325 125 29 2
Eggs 9 64 38 25 8 1
Dry fish 2 22 24 28 8 0
Myanmar vermicelli 2 6 6 2 1 0
French fries 0 0 2 3 0 0
Coconut milk noodels 0 0 1 0 0 0
Meat/fish/egg/veg curry 61 287 219 90 15 1
Other meat/fish/tofu 8 67 46 31 7 1
Other veg 17 99 116 54 18 2
Beans 7 12 32 21 12 1
Noodles 5 10 5 0 0 0
Soup 23 37 63 42 23 2
Other 25 151 193 98 29 2

eCook Myanmar Cooking Diaries | October 2019 Working Paper
[email protected] | PV-ecook.org
This research is funded by DfID/UK Aid and Gamos through the Innovate UK Energy Catalyst and the MECS programme.
47
3.4.2 Reheating food
For each food item prepared (up to a maximum of four dishes per meal), participants were asked if each
dish was freshly cooked or reheated. If all dishes in a meal were reheated, then the meal was classified
as reheated, if all were freshly cooked, then the meal was classified as fresh, and if only some of the
dishes in the meal were reheated then the meal was classified as partially cooked. Results for all those
records that contained only a single heating event are presented in Table 24. This shows that few meals
are reheated in any way. When cooking with electricity, dinners were the meal that most commonly
included some reheated dishes, but when cooking with other fuels, it was lunches.
Table 24 Number of meals fresh or reheated (single heating event records only)
Category 1
Fresh Reheated Partially cooked Total
Frequency Percent Frequency Percent Frequency Percent Frequency Percent
Breakfast 171 99% 0 0% 1 1% 172 100%
Lunch 64 89% 0 0% 8 11% 72 100%
Dinner 104 94% 0 0% 7 6% 111 100%
Heating water 1 100% 0 0% 0 0% 1 100%
Snack 4 100% 0 0% 0 0% 4 100%
Category 2
Fresh Reheated Partially cooked Total
Frequency Percent Frequency Percent Frequency Percent Frequency Percent
Breakfast 161 93% 3 2% 9 5% 173 100%
Lunch 325 96% 4 1% 10 3% 339 100%
Dinner 313 85% 45 12% 10 3% 368 100%
Heating water 0 0 0 0 Snack 9 90% 1 10% 0 0% 10 100%
To find out which foods were most commonly reheated, cases in which a food was cooked in a meal
were tagged as either fresh or reheated (where information was available). Results collated across all
four dishes are presented in Table 25 and show that vermicelli and curries (and other meat/fish/tofu)
were most commonly reheated (in terms of proportion of times they were cooked).

eCook Myanmar Cooking Diaries | October 2019 Working Paper
[email protected] | PV-ecook.org
This research is funded by DfID/UK Aid and Gamos through the Innovate UK Energy Catalyst and the MECS programme.
48
Table 25 Food types most commonly reheated (individual dishes, cooked as part of meals)
Fresh Reheated Total
Frequency Percent Frequency Percent Frequency
Sticky rice 12 100% 0 0% 12
Rice 1431 98% 26 2% 1457
Eggs 142 98% 3 2% 145
Dry fish 82 99% 1 1% 83
Myanmar vermicelli 16 89% 2 11% 18
French fries 5 100% 0 0% 5
Coconut milk noodels 1 100% 0 0% 1
Meat/fish/egg/veg curry 741 91% 69 9% 810
Other meat/fish/tofu 153 91% 15 9% 168
Other veg 313 98% 5 2% 318
Beans 83 94% 5 6% 88
Noodles 20 95% 1 5% 21
Soup 177 94% 11 6% 188
Other 606 95% 34 5% 640
Reheating food for a meal might be expected to take less energy than preparing a meal from scratch
(fresh). There are not enough Category 1 records available to make a meaningful comparison between
fresh and reheated food using charcoal. Data from meals prepared using LPG are presented in Table 26
and suggest that partially cooked lunches use slightly less energy than lunches cooked fresh (this
difference is not evident for the small number of dinners cooked using LPG).
Data from meals prepared using only electricity are presented in Table 27. This confirms that reheating
dinners takes less energy than cooking fresh (roughly one half), although partially cooked meals appear
to use more energy, a finding that can be seen across all three types of meals.

eCook Myanmar Cooking Diaries | October 2019 Working Paper
[email protected] | PV-ecook.org
This research is funded by DfID/UK Aid and Gamos through the Innovate UK Energy Catalyst and the MECS programme.
49
Table 26 Per capita energy consumption by heating event and reheating (MJ/pers/event) – Category 1 LPG only
Heating event Frequency Mean Std.dev. 25% Quartile Median
75% Quartile
Breakfast
Fresh
Partially cooked
Lunch
Fresh 7 0.80 0.44 0.45 0.75 1.03
Partially cooked 6 0.78 0.29 0.57 0.67 1.06
Dinner
Fresh 8 0.80 0.43 0.49 0.68 1.05
Partially cooked 6 0.72 0.06 0.67 0.71 0.77
Table 27 Per capita energy consumption by heating event and reheating (MJ/pers/event) – Category 2 electricity only
Heating event Frequency Mean Std.dev. 25% Quartile Median
75% Quartile
Breakfast
Fresh 95 0.26 0.15 0.16 0.20 0.32
Partially cooked
Reheated
Lunch
Fresh 304 0.55 0.41 0.26 0.43 0.72
Partially cooked 9 1.08 1.01 0.21 0.64 1.88
Reheated 4
Dinner
Fresh 254 0.30 0.60 0.14 0.21 0.29
Partially cooked 8 0.49 0.40 0.18 0.37 0.71
Reheated 42 0.20 0.22 0.11 0.14 0.18

eCook Myanmar Cooking Diaries | October 2019 Working Paper
[email protected] | PV-ecook.org
This research is funded by DfID/UK Aid and Gamos through the Innovate UK Energy Catalyst and the MECS programme.
50
3.4.3 Energy to cook food types
In this section we identify the energy required to cook various food types and meal combinations.
Category 1 participants may have used multiple fuels. In order to meaningfully compare the specific
energy used to cook different foods and combinations, only records using a single fuel have been
included in Table 28 to Table 30. Furthermore, records in which food was reheated or precooked for
eating later have been omitted from the results.
Electrical energy consumption is broken down further in Section 3.5.4 where the efficiency of different
electrical devices is discussed.
Table 28 Specific energy consumptions (MJ/pers/event) - single food meals
Food Frequency Mean Median Std.dev. 25% Quartile
75% Quartile
Category 1 Wood
Rice 3 1.41 1.33 0.40 1.06 .
Category 1 Charcoal
Rice 27 2.09 1.79 0.61 1.50 2.99
Category 2 Electricity
Eggs 4 0.22 0.14 0.23 0.06 0.45
Meat/fish/egg/veg curry 4 0.36 0.26 0.30 0.14 0.68
Noodles 2 0.48 0.48 0.21 0.33 .
Other 8 0.28 0.26 0.17 0.18 0.33
Other veg 5 0.24 0.15 0.20 0.12 0.40
Rice 97 0.21 0.21 0.06 0.17 0.23
Soup 6 0.51 0.48 0.13 0.40 0.63

eCook Myanmar Cooking Diaries | October 2019 Working Paper
[email protected] | PV-ecook.org
This research is funded by DfID/UK Aid and Gamos through the Innovate UK Energy Catalyst and the MECS programme.
51
Table 29 Specific energy consumptions (MJ/pers/event) - two food meals
Food Frequency Mean Median Std.dev. 25%
Quartile 75%
Quartile
Category 2 Electricity
Eggs Other 2 0.38 0.38 0.13 0.28 .
Meat/fish/egg/veg curry Other 7 0.36 0.35 0.14 0.24 0.51
Other meat/fish/tofu Other 3 0.66 0.74 0.19 0.44 .
Other veg Other 7 0.32 0.24 0.17 0.20 0.51
Rice Eggs 5 0.35 0.32 0.06 0.31 0.41
Rice Meat/fish/egg/veg curry 4 0.52 0.52 0.27 0.26 0.77
Rice Other 4 2.67 0.55 4.47 0.29 7.16
Soup Other 4 0.30 0.30 0.07 0.24 0.36
Table 30 Specific energy consumptions (MJ/pers/event) - three food meals
Food Frequency Mean Median Std.dev. 25%
Quartile 75%
Quartile
Category 2 Electric
Meat/fish/egg/veg curry Other veg Other 3 0.52 0.53 0.01 0.51 .
Other meat/fish/tofu Soup Other 2 0.75 0.75 0.30 0.54 .
Rice Meat/fish/egg/veg curry Other 2 0.75 0.75 0.35 0.50 .
Rice Other meat/fish/tofu Other 3 0.72 0.72 0.13 0.59 .
Rice Soup Other 2 1.38 1.38 0.15 1.28 .
The meals (food combinations) most commonly cooked are presented in Table 318
8 Meals representing >=2.5% of all meals (breakfast, lunch, dinner, or snack).

eCook Myanmar Cooking Diaries | October 2019 Working Paper
[email protected] | PV-ecook.org
This research is funded by DfID/UK Aid and Gamos through the Innovate UK Energy Catalyst and the MECS programme.
52
Table 31 Most commonly prepared meals
Meal description
Freq
uenc
y
Perc
ent
Sing
le fu
el
Freq
uenc
y
Onl
y el
ectr
icity
Freq
uenc
y
Onl
y LP
G
Freq
uenc
y
Onl
y ch
arco
al
Freq
uenc
y
Onl
y w
ood
Freq
uenc
y
Med
ian
per c
apita
ele
ctric
ity
ener
gy c
onsu
mpt
ion
(MJ/
pers
/mea
l)
Rice 302 291 250 8 28 5 0.17
Rice Meat/fish/egg/veg curry 100 96 90 3 1 2 0.47
Rice Meat/fish/egg/veg curry Other 47 35 21 4 5 5 0.54
Rice Other 25 23 21 1 0 1 0.47
Meat/fish/egg/veg curry 52 50 49 0 1 0 0.27
Rice Other veg 21 20 18 0 0 2 0.24
Rice Eggs 22 21 14 0 2 6 0.32
3.5 Cooking devices
3.5.1 Detail on how participants cook
Participants were asked to record the following information on how they cooked:
• Cooking device used i.e. what type of stove. • Type of cooking pot / utensil. • How they used the lid. • Cooking process used e.g. fry, boil, bake etc.
The cooking appliances used to cook individual foods are presented in Table 32. Note that any single
record (or meal) can contain information on up to four foods, so the table includes each separate food–
appliance combination. This shows that 11% of foods were cooked with electricity in Category 1 records.
When cooking with electricity, the most commonly use devices were rice cookers and electric frying
pans. Table 33 shows that participants mostly used non-electric fuels for boiling, and electricity was
mostly used for steaming. Category 2 records in Table 34 appear to be incomplete, which probably
reflects the high use of electric frying pans and rice cookers, neither of which require a pot. Participants
were more likely to use lids when cooking with electricity only (see Table 35), again, this may reflect the
high use of rice cookers, which must be closed in order to work.

eCook Myanmar Cooking Diaries | October 2019 Working Paper
[email protected] | PV-ecook.org
This research is funded by DfID/UK Aid and Gamos through the Innovate UK Energy Catalyst and the MECS programme.
53
Table 32 Appliances used to cook foods – across four dishes (frequencies)
Category 1
Category 2 (electric only)
Biomass stove 1036 4
Gas stove 205 1
Electric hotplate 8
Induction hotplate 3 290
Infrared stove 131
Electric frying pan 39 684
Electric pressure cooker 1 51
Microwave 10
Rice cooker 109 886
Other 1
Total 1393 2067
Table 33 Cooking processes used to cook foods (frequencies)
Category 1 Category 2 (electric only)
Fry 243 437
Boil 806 546
Grill 25
Steam 104 740
Bake 1
Microwave 8
Pressure cooking 1 41
Other 1
Total 1180 1773

eCook Myanmar Cooking Diaries | October 2019 Working Paper
[email protected] | PV-ecook.org
This research is funded by DfID/UK Aid and Gamos through the Innovate UK Energy Catalyst and the MECS programme.
54
Table 34 Utensils used to cook foods (frequencies)
Category 1 Category 2 (electric only)
Bowl/plate 6
Frying pan 204 66
Pot: Big 30 27
Pot: Med 799 561
Pot: Small 162 138
Other 14
Total 1209 798
Table 35 Use of lid when cooking foods (frequencies)
Category 1 Category 2 (electric only)
No 261 352
Some 879 738
Yes 234 943
Total 1374 2033
3.5.2 Characteristics of different cooking devices
Among participants who cooked with non-electric fuels, both charcoal and gas were mostly used for
cooking rice. Biomass was more often used for cooking curries and vegetables, including beans (Table
36).
Table 37 shows that electric frying pans were most commonly used for all foods other than rice. Curries
were the food type most commonly cooked in pressure cookers but use was low.

eCook Myanmar Cooking Diaries | October 2019 Working Paper
[email protected] | PV-ecook.org
This research is funded by DfID/UK Aid and Gamos through the Innovate UK Energy Catalyst and the MECS programme.
55
Table 36 Cooking devices used to cook different food types - Category 1 (frequencies)
biomass stove
Gas stove
Rice 338 89
Eggs 32 7
Dry fish 29 4
Myanmar vermicelli 2 4
Meat/fish/egg/veg curry 222 37
Other meat/fish/tofu 18 28
Other veg 71 6
Beans 33 0
Noodles 2 0
Soup 30 5
Other 51 24
Table 37 Cooking devices used to cook different food types - Category 2 (frequencies)
Electric hotplate
Induction hotplate
Infrared stove
Electric frying pan
Electric pressure cooker Microwave
Rice cooker
Sticky rice 0 0 0 6 0 0 6
Rice 0 3 1 26 3 3 855
Eggs 2 18 5 47 0 0 0
Dry fish 0 5 3 21 0 0 0
Myanmar vermicelli 0 1 1 3 0 0 0
French fries 0 0 1 0 0 0 0
Coconut milk noodels 0 0 0 1 0 0 0
Meat/fish/egg/veg curry 5 75 4 254 25 0 5
Other meat/fish/tofu 0 11 4 44 3 1 0
Other veg 0 23 2 100 3 1 5
Beans 0 8 3 15 3 1 1
Noodles 0 2 3 8 0 0 1
Soup 0 12 17 39 1 0 2
Other 1 38 5 73 3 3 8

eCook Myanmar Cooking Diaries | October 2019 Working Paper
[email protected] | PV-ecook.org
This research is funded by DfID/UK Aid and Gamos through the Innovate UK Energy Catalyst and the MECS programme.
56
Table 38 shows that both biomass and gas stoves are used mostly for boiling, but also for frying. It also
shows that people who cooked with non-electrical fuels (Category 1), also made some use of electric
rice cookers.
Frying and steaming were more commonly used when cooking with electricity (Category 2) – see Table
39. This reflects ownership of dedicated electrical devices, notably rice cookers and electric frying pans.
Note that baking does not appear to be part of cooking in Myanmar.
Table 38 Cooking processes used with different cooking devices - Category 1 (frequencies)
Fry Boil Grill Steam
biomass stove 194 651 21 14
Gas stove 36 116 4 1
Electric frying pan 12 15 0 1
Rice cooker 0 21 0 88
Table 39 Cooking processes used with different cooking devices - Category 2 (frequencies)
Fry Boil Steam Bake Microwave Pressure cooking
Electric hotplate 2 6 0 0 0 0
Induction hotplate 89 150 3 0 0 0
Infrared stove 46 77 5 1 0 0
Electric frying pan 293 196 4 0 0 0
Electric pressure cooker 2 3 3 0 0 41
Microwave 0 0 2 0 8 0
Rice cooker 4 112 720 0 0 0
3.5.3 Fuel stacking
The number of cooking devices used in preparing each meal (or case) is presented in Table 40 and shows
that multiple devices were more commonly used when cooking with electricity. When cooking with non-
electric fuels and using multiple devices, Table 41 shows that biomass stoves were most commonly used
in conjunction with rice cookers, but also electric frying pans and gas stoves.

eCook Myanmar Cooking Diaries | October 2019 Working Paper
[email protected] | PV-ecook.org
This research is funded by DfID/UK Aid and Gamos through the Innovate UK Energy Catalyst and the MECS programme.
57
Table 40 Number of cooking devices used in preparing meals
Category 1 Category 2
Frequency Valid Percent Frequency Valid Percent
1 349 61% 641 54%
2 187 33% 492 42%
3 38 7% 44 4%
4 1 0% 2 0%
Total 575 100% 1179 100%
Table 41 Cooking devices used by participants who use multiple devices preparing single meal (Category 1)
Cooking device Frequency
Biomass stove 209
Gas stove 25
Electric hotplate 1
Induction hotplate 3
Infrared stove
Electric frying pan 31
Electric pressure cooker 1
Microwave
Rice cooker 106

eCook Myanmar Cooking Diaries | October 2019 Working Paper
[email protected] | PV-ecook.org
This research is funded by DfID/UK Aid and Gamos through the Innovate UK Energy Catalyst and the MECS programme.
58
3.5.4 Energy used by different electrical appliances (Phase 2)
Per capita electrical energy figures in Table 42 indicate that ‘efficient’ electrical devices such as rice
cookers and pressure cookers use less energy than electric frying pans and hotplates. Note that while
rice cookers were used to cook mostly rice, electric frying pans and hobs (both induction and infrared)
were used to cook a range of foods including complex meals such as curries (see Table 43). Note that the
figures in Table 42 are based on all meals i.e. including reheated and precooked foods, so specific energy
consumptions will be lower for devices most commonly used to reheated meals (e.g. 9 out of 10 curries
cooked on induction hobs were reheated).
In order to make more meaningful comparisons, the specific energy consumption for different foods and
combinations prepared fresh and not precooked are presented in Table 43. However, the sub-sample
sizes are small, and the different devices appear to be used to prepare different meals, so it is not really
possible to compare like for like energy consumptions for cooking specific meals using different devices.
Table 42 Per capita energy consumption (MJ/pers/event) of meals cooked using single electrical device (Category 2)
Cooking device Frequency Mean Median Std.dev. 25%
Quartile
75%
Quartile
Induction hotplate 76 0.34 0.30 0.23 0.15 0.47
Infrared stove 37 0.41 0.25 0.34 0.16 0.53
Electric frying pan 114 0.40 0.33 0.36 0.20 0.46
Electric pressure cooker 5 0.28 0.22 0.16 0.16 0.42
Rice cooker 260 0.20 0.17 0.15 0.14 0.22

eCook Myanmar Cooking Diaries | October 2019 Working Paper
[email protected] | PV-ecook.org
This research is funded by DfID/UK Aid and Gamos through the Innovate UK Energy Catalyst and the MECS programme.
59
Table 43 Detail of per capita energy consumption (MJ/pers/event) of meals cooked using single electrical device – fresh and not precooked (Category 2)
Food(s) Frequency Mean Median Std.dev. 25% Quartile
75% Quartile
Induction hob
Noodles 2 0.48 0.48 0.21 0.33 .
Other 3 0.41 0.36 0.19 0.26 .
Other veg 2 0.12 0.12 0.03 0.10 .
Meat/fish/egg/veg curry Other 4 0.40 0.41 0.13 0.27 0.51
Other meat/fish/tofu Other 2 0.59 0.59 0.21 0.44 .
Other veg Other 2 0.37 0.37 0.32 0.14 .
Rice Other 2 0.55 0.55 0.04 0.52 .
Soup Other 2 0.30 0.30 0.08 0.25 .
Infrared stove Soup 4 0.48 0.48 0.11 0.37 0.58
Other veg Other 5 0.30 0.24 0.12 0.21 0.41
Soup Other 2 0.30 0.30 0.09 0.24 .
Meat/fish/egg/veg curry Other veg Other 2 0.53 0.53 0.00 0.53 .
Other meat/fish/tofu Soup Other 2 0.75 0.75 0.30 0.54 .
Electric frying pan Eggs 3 0.26 0.20 0.25 0.05 .
Meat/fish/egg/veg curry 2 0.15 0.15 0.03 0.13 .
Other 3 0.15 0.16 0.10 0.05 .
Other veg 3 0.32 0.22 0.23 0.15 .
Soup 2 0.56 0.56 0.20 0.42 .
Meat/fish/egg/veg curry Other 2 0.22 0.22 0.04 0.19 .
Rice cooker Other 2 0.27 0.27 0.00 0.26 .
Rice 96 0.21 0.21 0.06 0.17 0.23
eCook Myanmar Cooking Diaries | October 2019 Working Paper
[email protected] | PV-ecook.org
This research is funded by DfID/UK Aid and Gamos through the Innovate UK Energy Catalyst and the MECS programme.
60
3.6 Time taken
3.6.1 Time taken to cook food types
The times taken to cook individual food types using only wood, charcoal or LPG (Category 1) are
presented in Table 44 (ranked by median). Note that this includes times taken to cook individual foods
when prepared as part of a multi-dish meal. There is a good deal of consistency in the time take to cook
specific foods, with the exception of eggs, which take only 10 minutes, and rice, which takes around 40
minutes.
Table 45 presents times taken to cook using electricity (Category 2). When comparing the most common
food types (Figure 18) there is little difference in cooking times using biomass and electricity, whereas
those who cook with LPG appear to be able to cook most foods faster.

eCook Myanmar Cooking Diaries | October 2019 Working Paper
[email protected] | PV-ecook.org
This research is funded by DfID/UK Aid and Gamos through the Innovate UK Energy Catalyst and the MECS programme.
61
Table 44 Time taken to cook food types using biomass/LPG – Category 1 (minutes) (n>=5)
Food N Mean Median Std.dev. 25% Quartile
75% Quartile
Wood
Eggs 12 12.0 10.0 7.3 6.25 15
Other meat/fish/tofu 5 29.4 20.0 28.5 13.5 50
Other veg 35 24.3 25.0 11.4 15 32
Meat/fish/egg/veg curry 92 27.9 28.0 15.0 15.5 32
Beans 18 42.0 30.0 30.9 18 64
Soup 9 28.3 30.0 8.3 22.5 32.5
Rice 198 38.4 40.0 7.8 34.75 45
Charcoal Eggs 12 15.7 10.0 9.4 10 27.5
Other meat/fish/tofu 7 14.3 10.0 9.3 10 15
Soup 10 24.7 20.0 10.7 16.5 30
Other veg 12 22.5 22.5 7.8 16.25 30
Beans 7 23.3 25.0 11.0 13 30
Dry fish 8 26.9 30.0 10.7 17.5 30
Meat/fish/egg/veg curry 56 32.3 30.0 28.3 20 35
Rice 106 43.4 40.0 11.3 35 45
LPG Meat/fish/egg/veg curry 37 13.6 10.0 11.2 7 15
Other meat/fish/tofu 22 10.0 10.0 6.6 5 10.5
Soup 5 20.0 10.0 25.5 5 40
Other veg 6 12.0 12.5 4.5 8.75 15.5
Rice 67 35.1 35.0 5.4 31 40

eCook Myanmar Cooking Diaries | October 2019 Working Paper
[email protected] | PV-ecook.org
This research is funded by DfID/UK Aid and Gamos through the Innovate UK Energy Catalyst and the MECS programme.
62
Table 45 Time taken to cook food types using electricity only – Category 2 (minutes) (n>=5)
Food N Mean Median Std.dev. 25% Quartile
75% Quartile
Eggs 72 10.4 10.0 6.9 5 15
Myanmar vermicelli 5 20.4 15.0 7.9 14.5 29
Other veg 135 19.7 19.0 13.5 10 28
Beans 31 27.4 20.0 20.4 10 42
Sticky Rice 12 29.3 22.5 16.2 15.5 45
Dry fish 28 22.1 25.0 12.3 10 30
Other meat/fish/tofu 64 29.1 25.0 19.8 16.25 35
Noodles 14 25.4 26.0 14.6 13.75 41.25
Soup 71 26.1 26.0 11.1 20 34
Meat/fish/egg/veg curry 368 32.4 30.0 19.3 20 41
Rice 896 40.5 37.0 17.2 30 50
Figure 18 Time taken to cook common food types - different fuels (N>=5)

eCook Myanmar Cooking Diaries | October 2019 Working Paper
[email protected] | PV-ecook.org
This research is funded by DfID/UK Aid and Gamos through the Innovate UK Energy Catalyst and the MECS programme.
63
3.6.2 Time taken to prepare meal
When using biomass or LPG (Category 1), breakfasts took longer to cook than lunches and dinners (Table
46). However, when people cooked with electricity (Table 47) it was lunches that took longer to prepare
than breakfasts or dinners.
A small proportion of breakfasts cooked with electricity were reheated (or partially cooked) (7%) while
all were fresh in Category 1. The single meal most commonly cooked for breakfast when cooking with
biomass/LPG was rice, curry, whereas over half of breakfasts cooked with electricity were rice only.
Table 46 Duration of heating events – Category 1 (minutes) (single heating events only)
Heating event N Mean Median Std.dev. 25% Quartile 75% Quartile
Breakfast 172 90 90 28 70 110
Lunch 47 78 70 37 55 95
Dinner 98 62 60 28 45 75
Water heating 0

eCook Myanmar Cooking Diaries | October 2019 Working Paper
[email protected] | PV-ecook.org
This research is funded by DfID/UK Aid and Gamos through the Innovate UK Energy Catalyst and the MECS programme.
64
Breakfast
Lunch
Dinner
Heating water
Figure 19 Distributions of durations of heating events (minutes) – Category 1 (single heating events only)
Table 47 Duration of heating events – Category 2 (minutes) (single heating events only)
Heating event N Mean Median Std.dev. 25% Quartile 75% Quartile
Breakfast 196 66 53 42 35 90
Lunch 334 78 75 41 47 105
Dinner 368 50 46 36 28 65
Water heating 68 31 25 27 15 38

eCook Myanmar Cooking Diaries | October 2019 Working Paper
[email protected] | PV-ecook.org
This research is funded by DfID/UK Aid and Gamos through the Innovate UK Energy Catalyst and the MECS programme.
65
Breakfast
Lunch
Dinner
Heating water
Figure 20 Distributions of durations of heating events (minutes) – Category 2 (single heating events only)

eCook Myanmar Cooking Diaries | October 2019 Working Paper
[email protected] | PV-ecook.org
This research is funded by DfID/UK Aid and Gamos through the Innovate UK Energy Catalyst and the MECS programme.
66
3.6.3 Time of day
There is a good deal of consistency in the time of day at which participants using biomass/LP and those
using electricity started to prepare each of the three types of meals (see Table 48 and Table 49).
Table 48 Time of day to start preparing meal –Category 1 (multiple fuels) (single heating events only)
Heating event N Mean Median Std.dev. 25% Quartile 75% Quartile
Breakfast 172 6.24 6.30 0.39 6.00 6.45
Lunch 72 9.45 10.00 1.24 8.18 10.50
Dinner 114 16.15 16.00 2.46 15.00 16.48
Table 49 Time of day to start preparing meal – Category 2 (electricity only) (single heating events only)
Heating event N Mean Median Std.dev. 25% Quartile 75% Quartile
Breakfast 197 6.21 6.27 0.56 5.54 6.52
Lunch 340 9.51 9.55 1.50 8.30 11.00
Dinner 370 16.13 16.20 2.23 15.16 17.55
There are a few instances in which participants cooking with electricity started cooking early in the
morning, but indicated that they were preparing dinner (an evening meal) (Figure 21); this may be a
strategy that is found more among households with working women. This feature is not as clearly seen
when people cook with biomass/LPG.
Figure 21 Time of day when dinners started to be prepared – electricity users (Category 2) (single heating events only)

eCook Myanmar Cooking Diaries | October 2019 Working Paper
[email protected] | PV-ecook.org
This research is funded by DfID/UK Aid and Gamos through the Innovate UK Energy Catalyst and the MECS programme.
67
Water is heated throughout the day, with a clear peak at around 17.00 in the evening. An early morning
peak at around 6.00 can also be seen in Figure 22. There were insufficient Category 1 data points to
create a clear chart.
Figure 22 Time of day when water heating started – electricity users (Category 2) (single heating events only)
Comparing these meal preparation start times with solar insolation times (Figure 23) shows that dinners
are mostly prepared just before sunset.
Figure 23 Solar insolation times9
9 https://www.gaisma.com/en/location/rangoon.html

eCook Myanmar Cooking Diaries | October 2019 Working Paper
[email protected] | PV-ecook.org
This research is funded by DfID/UK Aid and Gamos through the Innovate UK Energy Catalyst and the MECS programme.
68
3.7 Water heating
Water heating was usually heated for a single purpose (Table 50), and the most common use of hot
water was for making hot drinks (Table 51). Water was usually heated as part of a heating event rather
than being heated on its own (heating water event). Table 52 shows that water was most commonly
heated as part of preparing breakfasts, and that at breakfasts, it was used mainly for hot drinks.
Table 50 Number of purposes for heated water (max 4)
Frequency Valid Percent
Valid 1.00 786 94.8
2.00 41 4.9
3.00 2 .2
Total 829 100.0
Missing System 1109
Total 1938
Table 51 Purposes for heated water
Purpose of heating water Frequency Percent
(n=82910)
Purifying drinking water 178 21.5%
Bathing 81 9.8%
Tea / coffee 601 72.5%
Other 14 1.7%
10 Number of cases in which water heating event was recorded.

eCook Myanmar Cooking Diaries | October 2019 Working Paper
[email protected] | PV-ecook.org
This research is funded by DfID/UK Aid and Gamos through the Innovate UK Energy Catalyst and the MECS programme.
69
Table 52 Purpose of water heating (including multiple purposes) by heating events (single heating event only)
Heating event Purify drinking Bathing
Hot drinks Other
Breakfast 64 7 143 2 216
Lunch 6 3 20 1 30
Dinner 17 4 72 1 94
Snack 1 1 2
Heating water 2 30 63 95
90 44 299 4 437
The energy consumption for heating water for different purposes can only be deduced from those
records that pertain only to the heating of water (heating event), and only for a single purpose. This
restricts the analysis to a small sub-set of cases so it has only been possible to compare energy
consumptions between Category 1 and Category 2 records for making tea/hot drinks, and even then
only when LPG was used in Category 1 records. This indicates that roughly twice as much energy is used
when heating water with LPG. The amount of energy used to heat bathing water is roughly three times
that used to boil water for tea.
Table 53 Per capita energy consumed by heating water for different purposes (MJ/pers/event) – Category 1 and 2 (single use of water in water heating events only)
Frequency Mean (MJ/event) Median Std.dev.
25% Quartile
75% Quartile
Bathing Category 2 Electricity 14 0.88 0.93 0.31 0.72 1.01
Tea/hot drinks
Category 1 LPG 12 0.50 0.55 0.11 0.45 0.56
Category 2 Electricity 33 0.29 0.28 0.14 0.20 0.36
Even in when participants were cooking with biomass/LPG (Category 1), 16% of water heating events
used electric kettles (Table 54). When cooking with electricity (Category 2), kettles were mostly used for
hot drinks and for purifying water, and infrared stoves for heating bathing water (Table 55). These tables
show the devices used for heating water for different purposes in all records, irrespective of number of
heating events, fuels, or water heating purposes included in the record.

eCook Myanmar Cooking Diaries | October 2019 Working Paper
[email protected] | PV-ecook.org
This research is funded by DfID/UK Aid and Gamos through the Innovate UK Energy Catalyst and the MECS programme.
70
Table 54 Devices used to heat water – cooking with biomass/LPG (Category 1)
Bathing water
Purify water
Tea/hot drinks Other Total
Biomass Stove 2 125 123 5 255
Gas stove 3 0 48 2 53
Electric kettle 0 6 55 0 61
Other 0 0 2 0 2
Total 5 131 228 7 371
Table 55 Devices used to heat water – cooking with electricity (Category 2)
Bathing water
Purify water
Tea/hot drinks Other Total
Biomass Stove 0 1 0 0 1
Electric hotplate 0 0 0 1 1
Induction hotplate 5 0 10 2 17
Infrared stove 55 0 86 0 141
Electric kettle 5 39 257 2 303
Other11 6 0 15 2 23
Total 71 40 368 7 486
3.7.1 Responses to exit survey questions
AT THE TIME OF WRITING, EXIT SURVEY DATA HAD NOT YET BEEN PROCESSED
11 Mostly rice cookers.

eCook Myanmar Cooking Diaries | October 2019 Working Paper
[email protected] | PV-ecook.org
This research is funded by DfID/UK Aid and Gamos through the Innovate UK Energy Catalyst and the MECS programme.
71
4 Evaluation
Whilst this cooking diaries study has enabled us to shed new light on what everyday cooks in Myanmar
really do in their kitchens, the following section seeks to understand the limitations in the data obtained
and offer constructive recommendations for the next round of cooking diaries, both in Myanmar and
internationally.
4.1 Data limitations
4.1.1 Dish level data
Because of the meal level resolution of data collection, it was very difficult to make meaningful
comparisons between fuels and appliances. It was hoped that dishes could be categorised according to
their energy and time signatures, facilitating the transferability of the results to other contexts. For
example, parallel research in the kitchen laboratory for the eCookBook in Kenya clearly showed that
‘heavy foods’ such as beans take several hours and several kWh to boil
on an uninsulated cooking appliance, yet can be cooked for roughly half
the time and 10-40% of the energy using an EPC. Attempts were made
to group these dishes together during the data analysis phase based
upon their energy and time signatures, however this was not successful
because insufficient data points were available and it was suspected
that many participants had misinterpreted the reheating (simply
warming up again), pre-cooking (boiling the beans for storage) and
partially cooked (combining pre-cooked beans with a freshly made
sauce) options.
The data collection forms are set up to record a before and after energy
reading for every meal, however, data is also collected on how each dish that composes that meal is
cooked. As a result, whilst making comparisons between meals is easy, as a lot of data exists, making
comparisons between individual dishes is difficult. Dish level energy data is limited to the meals where
only a single dish is cooked. For some single pot meals like matoke (banana stew), this may happen
reasonably often, but for others like ugali, this is relatively uncommon as it is a staple that usually
accompanies another dish. The data for electric appliances is subdivided even further because three
appliances were available, each of which is likely to use a different amount of energy.
APPLIANCE LEVEL SUB-
METERING, ‘UN-STACKING’
BY APPLIANCE DURING
PHASE 2 & OR FIXED MENUS
COULD ENABLE MUCH
BROADER DISH-LEVEL
COMPARISONS ACROSS
FUELS & APPLIANCES.

eCook Myanmar Cooking Diaries | October 2019 Working Paper
[email protected] | PV-ecook.org
This research is funded by DfID/UK Aid and Gamos through the Innovate UK Energy Catalyst and the MECS programme.
72
The solution for electric appliances is relatively straight forward – sub meter each appliance and ask
users to record dish level energy data. However, this would be more challenging for kerosene, as it
would require multiple weight measurements whilst the stove is hot, and even more so for LPG, as
many people use multi-burner stoves. However, the biggest challenge would be for charcoal, as charcoal
is burned during lighting and continues to burn after cooking has finished. As a result, cooking three
dishes independently (i.e. lighting and allowing the remaining charcoal to burn out each time) would
consume more charcoal than cooking a three dish meal in one go. Perhaps the only way to achieve dish
level energy measurements with charcoal is to have the stove sitting on top of a flat scale throughout
cooking, taking measurements of the empty stove, after filling with the first load of charcoal, after
starting cooking, then after each dish is completed and finally of any remaining charcoal that can be
resused. This has obvious practical challenges, but it would allow the decomposition of dish level data if
the charcoal burned during lighting and burn out were divided evenly between each dish.
Another way to increase the amount of dish level data for each fuel/appliance is to ‘unstack’ them, by
asking participants to spend a set periods of time cooking solely on one fuel. This could also occur in
Phase 2, with participants spending a two week period cooking solely on a single (or perhaps pair of
identical) appliance. This would be challenging for some appliances (e.g. kettles), but perhaps an
agreement could be made with participants, whereby it is decided beforehand which dishes will be
cooked on which appliance during which period. It may also be worth including a quantitative metric of
user satisfaction with how each dish turned out, so as to pinpoint what the strengths and weaknesses of
each fuel/appliance are.
Finally, more directly comparable data could be obtained by setting fixed menus. These could be
decided in advance by each participant, or by the group as a whole, and data collection would involve
cycling though a daily or weekly menu with each fuel/appliance a sufficient number of times to allow
enough data points to be collected. However, this would then create a slightly less realistic dataset, as
whilst some households may have regular menus that they stick to quite closely, others will not and for
some of those it simply won’t be possible at all due to participant’s other commitments (e.g. having to
work late unexpectedly).

eCook Myanmar Cooking Diaries | October 2019 Working Paper
[email protected] | PV-ecook.org
This research is funded by DfID/UK Aid and Gamos through the Innovate UK Energy Catalyst and the MECS programme.
73
4.2 Enumerator visits & digitisation of data
Many issues with the dataset were only discovered long after data
collection had finished due to the slow pace of follow up visits, digitisation
of the data and analysis of the dataset. Enumerators were contracted to
visit the households daily and asked to digitise the paper forms as soon as
they were collected. However with 10 households for each enumerator to
visit, this was simply not possible, even though households had been
selected based upon their proximity to the enumerators home. What is
more, the sheer volume of data recorded on paper forms meant that it
often was not digitised until months later. As a result, issues that could
easily have been corrected at the time, such as faulty meters, other cooks
in the household not recording data properly or not recording during blackouts, often went undetected,
resulting in data having to be corrected or excluded.
To increase the quality of the dataset, it is recommended that if collecting data as detailed as this in the
future, each enumerator monitor just 5 households and a digital data collection system be created.
Although most participants (15/17) stated that enumerator visits were helpful and frequent enough,
more frequent visits could greatly increase the quality of the data, as small issues could be corrected on
the day, rather than having to correct of completely remove questionable data at a later date. It was
noticed that many participants were writing down the key bits of information (time, energy & basic
information about the dish) on a notepad during cooking. They would
later transcribe this onto the full diary form when they had more time
available. This suggests that if an enumerator were to visit each day, they
could sit down with the participant and enter the data from the notepad
into a digital form, for example using a tablet with a specially designed
questionnaire in a data collection app such as Kobo Collect. This data
would be uploaded to the server by each enumerator at the end of each
day, then downloaded and checked by the lead researcher the following
day. This would also help to reduce the errors in the transcription phase,
as the participant would be able to remember any missing details (except
energy readings) from that same day. Digitising the paper forms was often
done in bulk under extreme time pressure, making the possibility of errors
during transcription high.
DIGITISING DATA
COLLECTION & REDUCING
THE NUMBER OF HHS
MONITORED BY EACH
ENUMERATOR COULD
GREATLY INCREASE THE
QUALITY OF THE DATA
SET.
THIS STUDY HAS OFFERED
AN INITIAL
EXPLORATION OF
MYANMAR COOKING.
FOLLOW UP STUDIES
SHOULD EXPLORE THE
DIFFERENCES BETWEEN
URBAN/RURAL,
POOR/WEALTHY &
DIFFERENT REGIONS OF
THE COUNTRY.
eCook Myanmar Cooking Diaries | October 2019 Working Paper
[email protected] | PV-ecook.org
This research is funded by DfID/UK Aid and Gamos through the Innovate UK Energy Catalyst and the MECS programme.
74
4.3 Sample diversity
This study used convenience sampling as a means to get some initial data as quickly as possible. As a
result, most participants were middle class and all were urban. Future studies in Myanmar should seek
to understand how different sectors of society cook, in particular poorer households and rural
households, and identify regional differences in cooking.

eCook Myanmar Cooking Diaries | October 2019 Working Paper
[email protected] | PV-ecook.org
This research is funded by DfID/UK Aid and Gamos through the Innovate UK Energy Catalyst and the MECS programme.
75
5 Conclusion
The cooking diaries study in Myanmar has shown that cooking with electricity is compatible with
Myanmar cuisine and that modern energy-efficient appliances are highly desirable to everyday cooks. In
particular, the rice cooker, electric frying pan, thermo-pot and Electric Pressure Cooker (EPC) are prime
candidates for future eCook products. Insulation not only significantly reduces the energy demand for
cooking, but also mitigates the impact of short blackouts and low voltage, simply by stopping heat from
escaping from the cooking pot.
In Myanmar, electricity is already the aspirational fuel, however the grid is heavily overloaded, placing
severe restrictions on how people cook with electricity. Many of the participants from the cooking
diaries study could only cook at certain times of the day, as at peak times, the voltage regularly sags to
levels where it is unusable without a voltage stabiliser (<150V). As a result, integrating battery-storage
into cooking appliances is likely to be beneficially from both a user and grid-stability perspective. For the
user, it would enable cooking throughout the day and predictable performance, as the voltage would be
much more stable. Plus it would also allow them to use other low power appliances by also connecting
them to the battery. For the grid operator, it would smooth out the load profile, as the battery could be
trickle charged at off-peak times and discharged at meal times, effectively time shifting cooking loads
into times when spare generating capacity is available.
LPG is not yet popular in Myanmar, as the market was extremely restricted under military rule. However
if the market develops, it may well become an attractive option to consumers. Nonetheless, as grid
electricity is so cheap in Myanmar and electric appliances such as the rice cooker and electric frying pan
are already so embedded within kitchen routines, it is unlikely that many households would completely
switch over from electricity to LPG. Instead, a fuel stacking scenario with LPG and electric appliances
seems much more attractive for modern cooks in Myanmar wanting to mitigate the highly unstable
nature of electricity from the national grid. This scenario would have the additional advantage of
combining the manual control of LPG and automatic control of electricity to enable both fine control for
specific dishes and multi-tasking.
The findings from this study will be combined with those from the other activities that have been carried
under the eCook Myanmar Market Assessment. Together they will build a more complete picture of the
opportunities and challenges that await this emerging concept. Further outputs will be available from
https://elstove.com/innovate-reports/ and www.MECS.org.uk.

eCook Myanmar Cooking Diaries | October 2019 Working Paper
[email protected] | PV-ecook.org
This research is funded by DfID/UK Aid and Gamos through the Innovate UK Energy Catalyst and the MECS programme.
76
6 Appendix 6.1 Appendix A: Problem statement and background to Innovate eCook
project
6.1.1 Beyond business as usual
The use of biomass and solid fuels for cooking is the everyday experience of nearly 3 Billion people. This
pervasive use of solid fuels––including wood, coal, straw, and dung––and traditional cookstoves results
in high levels of household air pollution, extensive daily drudgery required to collect fuels, and serious
health impacts. It is well known that open fires and primitive stoves are inefficient ways of converting
energy into heat for cooking. The average amount of biomass cooking fuel used by a typical family can
be as high as two tons per year. Indoor biomass cooking smoke also is associated with a number of
diseases, including acute respiratory illnesses, cataracts, heart disease and even cancer. Women and
children in particular are exposed to indoor cooking smoke in the form of small particulates up to 20
times higher than the maximum recommended levels of the World Health Organization. It is estimated
that smoke from cooking fuels accounts for nearly 4 million premature deaths annually worldwide –
more than the deaths from malaria and tuberculosis combined.
While there has been considerable investment in improving the use of energy for cooking, the emphasis
so far has been on improving the energy conversion efficiency of biomass. Indeed in a recent overview
of the state of the art in Improved Cookstoves (ICS), ESMAP & GACC (2015), World Bank (2014), note
that the use of biomass for cooking is likely to continue to dominate through to 2030.
“Consider, for a moment, the simple act of cooking. Imagine if we could change the way nearly five hundred
million families cook their food each day. It could slow climate change, drive gender equality, and reduce
poverty. The health benefits would be enormous.” ESMAP & GACC (2015)
The main report goes on to say that “The “business-as-usual” scenario for the sector is encouraging but
will fall far short of potential.” (ibid,) It notes that without major new interventions, over 180 million
households globally will gain access to, at least, minimally improved12 cooking solutions by the end of
the decade. However, they state that this business-as-usual scenario will still leave over one- half (57%)
of the developing world’s population without access to clean cooking in 2020, and 38% without even
12 A minimally improved stove does not significantly change the health impacts of kitchen emissions. “For biomass cooking,
pending further evidence from the field, significant health benefits are possible only with the highest quality fan gasifier stoves;
more moderate health impacts may be realized with natural draft gasifiers and vented intermediate ICS” (ibid)

eCook Myanmar Cooking Diaries | October 2019 Working Paper
[email protected] | PV-ecook.org
This research is funded by DfID/UK Aid and Gamos through the Innovate UK Energy Catalyst and the MECS programme.
77
minimally improved cooking solutions. The report also states that ‘cleaner’ stoves are barely affecting
the health issues, and that only those with forced gasification make a significant improvement to health.
Against this backdrop, there is a need for a different approach aimed at accelerating the uptake of truly
‘clean’ cooking.
Even though improved cooking solutions are expected to reach an increasing proportion of the poor, the
absolute numbers of people without access to even ‘cleaner’ energy, let alone ‘clean’ energy, will
increase due to population growth. The new Sustainable Development Goal 7 calls for the world to
“ensure access to affordable, reliable, sustainable and modern energy for all”. Modern energy
(electricity or LPG) would indeed be ‘clean’ energy for cooking, with virtually no kitchen emissions (other
than those from the pot). However, in the past, modern energy has tended to mean access to electricity
(mainly light) and cooking was often left off the agenda for sustainable energy for all.
Even in relation to electricity access, key papers emphasise the need for a step change in investment
finance, a change from ‘business as usual’. IEG World Bank Group (2015) note that 22 countries in the
Africa Region have less than 25 percent access, and of those, 7 have less than 10 percent access. Their
tone is pessimistic in line with much of the recent literature on access to modern energy, albeit in
contrast to the stated SDG7. They discuss how population growth is likely to outstrip new supplies and
they argue that “unless there is a big break from recent trends the population without electricity access
in Sub-Saharan Africa is projected to increase by 58 percent, from 591 million in 2010 to 935 million in
2030.” They lament that about 40% of Sub-Saharan Africa’s population is under 14 years old and
conclude that if the current level of investment in access continues, yet another generation of children
will be denied the benefits of modern service delivery facilitated by the provision of electricity (IEG
World Bank Group 2015).
“Achieving universal access within 15 years for the low-access countries (those with under 50 percent
coverage) requires a quantum leap from their present pace of 1.6 million connections per year to 14.6 million
per year until 2030.” (ibid)
Once again, the language is a call for a something other than business as usual. The World Bank
conceives of this as a step change in investment. It estimates that the investment needed to really
address global electricity access targets would be about $37 billion per year, including erasing
generation deficits and additional electrical infrastructure to meet demand from economic growth. “By
comparison, in recent years, low-access countries received an average of $3.6 billion per year for their
electricity sectors from public and private sources” (ibid). The document calls for the Bank Group‘s

eCook Myanmar Cooking Diaries | October 2019 Working Paper
[email protected] | PV-ecook.org
This research is funded by DfID/UK Aid and Gamos through the Innovate UK Energy Catalyst and the MECS programme.
78
energy practice to adopt a new and transformative strategy to help country clients orchestrate a
national, sustained, sector-level engagement for universal access.
In the following paragraphs, we explore how increasing access to electricity could include the use of
solar electric cooking systems, meeting the needs of both supplying electricity and clean cooking to a
number of households in developing countries with sufficient income.
6.1.2 Building on previous research
Gamos first noted the trends in PV and battery prices in May 2013. We asked ourselves the question, is
it now cost effective to cook with solar photovoltaics? The answer in 2013 was ‘no’, but the trends
suggested that by 2020 the answer would be yes. We published a concept note and started to present
the idea to industry and government. Considerable interest was shown but uncertainty about the cost
model held back significant support. Gamos has since used its own funds to undertake many of the
activities, as well as IP protection (a defensive patent application has been made for the battery/cooker
combination) with the intention is to make all learning and technology developed in this project open
access, and awareness raising amongst the electrification and clean cooking communities (e.g. creation
of the infographic shown in Figure 24 to communicate the concept quickly to busy research and policy
actors).
Gamos has made a number of strategic alliances, in particular with the University of Surrey (the Centre
for Environmental Strategy) and Loughborough University Department of Geography and seat of the
Low Carbon Energy for Development Network). In October 2015, DFID commissioned these actors to
explore assumptions surrounding solar electric cooking13 (Batchelor 2015b; Brown & Sumanik-Leary
2015; Leach & Oduro 2015; Slade 2015). The commission arose from discussions between consortium
members, DFID, and a number of other entities with an interest in technological options for cleaner
cooking e.g. Shell Foundation and the Global Alliance for Clean Cookstoves.
Drawing on evidence from the literature, the papers show that the concept is technically feasible and
could increase household access to a clean and reliable modern source of energy. Using a bespoke
economic model, the Leach and Oduro paper also confirm that by 2020 a solar based cooking system
could be comparable in terms of monthly repayments to the most common alternative fuels, charcoal
and LPG. Drawing on published and grey literatures, many variables were considered (e.g. cooking
energy needs, technology performance, component costs). There is uncertainty in many of the
13 The project has been commissioned through the PEAKS framework agreement held by DAI Europe Ltd.

eCook Myanmar Cooking Diaries | October 2019 Working Paper
[email protected] | PV-ecook.org
This research is funded by DfID/UK Aid and Gamos through the Innovate UK Energy Catalyst and the MECS programme.
79
parameter values, including in the assumptions about future cost reductions for PV and batteries, but
the cost ranges for the solar system and for the alternatives overlap considerably. The model includes
both a conservative 5% discount rate representing government and donor involvement, and a 25%
discount rate representing a private sector led initiative with a viable return. In both cases, the solar
system shows cost effectiveness in 2020.
Figure 24 Infographic summarising the concept in order to lobby research and policy actors.

eCook Myanmar Cooking Diaries | October 2019 Working Paper
[email protected] | PV-ecook.org
This research is funded by DfID/UK Aid and Gamos through the Innovate UK Energy Catalyst and the MECS programme.
80
The Brown and Sumanik-Leary paper in the series examines the lessons learned from four transitions –
the uptake of electric cooking in South Africa, the roll out of Improved Cookstoves (ICS), the use of LPG
and the uptake of Solar Home Systems (SHS). They present many behavioural concerns, none of which
preclude the proposition as such, but all of which suggest that any action to create a scaled use of solar
electric cooking would need in depth market analysis; products that are modular and paired with locally
appropriate appliances; the creation of new, or upgrading of existing, service networks; consumer
awareness raising; and room for participatory development of the products and associated equipment.
A synthesis paper summarising the above concludes by emphasising that the proposition is not a single
product – it is a new genre of action and is potentially transformative. Whether solar energy is utilised
within household systems or as part of a mini, micro or nano grid, linking descending solar PV and
battery costs with the role of cooking in African households (and the Global South more broadly) creates
a significant potential contribution to SDG7. Cooking is a major expenditure of 500 million households. It
is a major consumer of time and health. Where households pay for their fuelwood and charcoal
(approximately 300 Million) this is a significant cash expense. Solar electric cooking holds the potential
to turn this (fuelwood and charcoal) cash into investment in modern energy. This “consumer
expenditure” is of an order of magnitude more than current investment in modern energy in Africa and
to harness it might fulfil the calls for a step change in investment in electrical infrastructure.

eCook Myanmar Cooking Diaries | October 2019 Working Paper
[email protected] | PV-ecook.org
This research is funded by DfID/UK Aid and Gamos through the Innovate UK Energy Catalyst and the MECS programme.
81
6.1.3 Summary of related projects
A series of inter-related projects have led to and will follow on from the research presented in this report:
• Gamos Ltd.’s early conceptual work on eCook (Batchelor 2013). o The key CONCEPT NOTE can be found here. o An early infographic and a 2018 infographic can be found here.
• Initial technical, economic and behavioural feasibility studies on eCook commissioned by DfID (UK Aid) through the CEIL-PEAKS Evidence on Demand service and implemented by Gamos Ltd., Loughborough University and University of Surrey.
o The key FINAL REPORTS can be found here. • Conceptual development, stakeholder engagement & prototyping in Kenya & Bangladesh during
the “Low cost energy-efficient products for the bottom of the pyramid” project from the USES programme funded by DfID (UK Aid), EPSRC & DECC (now part of BEIS) & implemented by University of Sussex, Gamos Ltd., ACTS (Kenya), ITT & UIU (Bangladesh).
o The key PRELIMINARY RESULTS (Q1 2019) can be found here. • A series of global & local market assessments in Myanmar, Zambia and Tanzania under the
“eCook - a transformational household solar battery-electric cooker for poverty alleviation” project funded by DfID (UK Aid) & Gamos Ltd. through Innovate UK’s Energy Catalyst Round 4, implemented by Loughborough University, University of Surrey, Gamos Ltd., REAM (Myanmar), CEEEZ (Zambia) & TaTEDO (Tanzania).
o The key PRELIMINARY RESULTS (Q1 2019) can be found here. • At time of publication (Q1 2019), a new DfID (UK Aid) funded research programme ‘Modern
Energy Cooking Services’ (MECS) lead by Prof. Ed Brown at Loughborough University is just beginning and will take forward these ideas & collaborations.
This data and material have been funded by UK AID from the UK government; however, the views
expressed do not necessarily reflect the UK government’s official policies.

eCook Myanmar Cooking Diaries | October 2019 Working Paper
[email protected] | PV-ecook.org
This research is funded by DfID/UK Aid and Gamos through the Innovate UK Energy Catalyst and the MECS programme.
82
6.1.4 About the Modern Energy Cooking Services (MECS) Programme.
Sparking a cooking revolution: catalysing Africa’s transition to clean electric/gas cooking.
www.mecs.org.uk | [email protected]
Modern Energy Cooking Services (MECS) is a five-year research and innovation programme funded by
UK Aid (DFID). MECS hopes to leverage investment in renewable energies (both grid and off-grid) to
address the clean cooking challenge by integrating modern energy cooking services into the planning for
access to affordable, reliable and sustainable electricity.
Existing strategies are struggling to solve the problem of unsustainable, unhealthy but enduring cooking
practices which place a particular burden on women. After decades of investments in improving
biomass cooking, focused largely on increasing the efficiency of biomass use in domestic stoves, the
technologies developed are said to have had limited impact on development outcomes. The Modern
Energy Cooking Services (MECS) programme aims to break out of this “business-as-usual” cycle by
investigating how to rapidly accelerate a transition from biomass to genuinely ‘clean’ cooking (i.e. with
electricity or gas).
Worldwide, nearly three billion people rely on traditional solid fuels (such as wood or coal) and
technologies for cooking and heating14. This has severe implications for health, gender relations,
economic livelihoods, environmental quality and global and local climates. According to the World
Health Organization (WHO), household air pollution from cooking with traditional solid fuels causes to
3.8 million premature deaths every year – more than HIV, malaria and tuberculosis combined15. Women
and children are disproportionally affected by health impacts and bear much of the burden of collecting
firewood or other traditional fuels.
Greenhouse gas emissions from non-renewable wood fuels alone total a gigaton of CO2e per year (1.9-
2.3% of global emissions)16. The short-lived climate pollutant black carbon, which results from
incomplete combustion, is estimated to contribute the equivalent of 25 to 50 percent of carbon dioxide
14 http://www.who.int/indoorair/health_impacts/he_database/en/
15 https://www.who.int/en/news-room/fact-sheets/detail/household-air-pollution-and-health
https://www.who.int/gho/hiv/epidemic_status/deaths_text/en/, https://www.who.int/en/news-room/fact-
sheets/detail/malaria, https://www.who.int/en/news-room/fact-sheets/detail/tuberculosis
16 Nature Climate Change 5, 266–272 (2015) doi:10.1038/nclimate2491
eCook Myanmar Cooking Diaries | October 2019 Working Paper
[email protected] | PV-ecook.org
This research is funded by DfID/UK Aid and Gamos through the Innovate UK Energy Catalyst and the MECS programme.
83
warming globally – residential solid fuel burning accounts for up to 25 percent of global black carbon
emissions17. Up to 34% of woodfuel harvested is unsustainable, contributing to climate change and local
forest degradation. In addition, approximately 275 million people live in woodfuel depletion ‘hotspots’ –
concentrated in South Asia and East Africa – where most demand is unsustainable18.
Africa’s cities are growing – another Nigeria will be added to the continent’s total urban population by
202519 which is set to double in size over the next 25 years, reaching 1 billion people by 2040. Within
urban and peri-urban locations, much of Sub Saharan Africa continues to use purchased traditional
biomass and kerosene for their cooking. Liquid Petroleum Gas (LPG) has achieved some penetration
within urban conurbations, however, the supply chain is often weak resulting in strategies of fuel
stacking with traditional fuels. Even where electricity is used for lighting and other amenities, it is rarely
used for cooking (with the exception of South Africa). The same is true for parts of Asia and Latin
America. Global commitments to rapidly increasing access to reliable and quality modern energy need
to much more explicitly include cooking services or else household and localized pollution will continue
to significantly erode the well-being of communities.
Where traditional biomass fuels are used, either collected in rural areas or purchased in peri urban and
urban conurbations, they are a significant economic burden on households either in the form of time or
expenditure. The McKinsey Global Institute outlines that much of women’s unpaid work hours are
spent on fuel collection and cooking20. The report shows that if the global gender gap embodied in such
activities were to be closed, as much as $28 trillion, or 26 percent, could be added to the global annual
GDP in 2025. Access to modern energy services for cooking could redress some of this imbalance by
releasing women’s time into the labour market.
17 http://cleancookstoves.org/impact-areas/environment/
18 Nature Climate Change 5, 266–272 (2015) doi:10.1038/nclimate2491
19 https://openknowledge.worldbank.org/handle/10986/25896
20 McKinsey Global Institute. The Power of Parity: How Advancing Women’s Equality can add $12 Trillion to Global
Growth; McKinsey Global Institute: New York, NY, USA, 2015.

eCook Myanmar Cooking Diaries | October 2019 Working Paper
[email protected] | PV-ecook.org
This research is funded by DfID/UK Aid and Gamos through the Innovate UK Energy Catalyst and the MECS programme.
84
To address this global issue and increase access to clean cooking services on a large scale, investment
needs are estimated to be at least US$4.4 billion annually21. Despite some improvements in recent
years, this cross-cutting sector continues to struggle to reach scale and remains the least likely SE4All
target to be achieved by 203022, hindering the achievement of the UN’s Sustainable Development Goal
(SDG) 7 on access to affordable, reliable, sustainable and modern energy for all.
Against this backdrop, MECS draws on the UK’s world-leading universities and innovators with the aim
of sparking a revolution in this sector. A key driver is the cost trajectories that show that cooking with
(clean, renewable) electricity has the potential to reach a price point of affordability with associated
reliability and sustainability within a few years, which will open completely new possibilities and
markets. Beyond the technologies, by engaging with the World Bank (ESMAP), MECS will also identify
and generate evidence on other drivers for transition including understanding and optimisation of multi-
fuel use (fuel stacking); cooking demand and behaviour change; and establishing the evidence base to
support policy enabling environments that can underpin a pathway to scale and support well
understood markets and enterprises.
The five-year programme combines creating a stronger evidence base for transitions to modern energy
cooking services in DFID priority countries with socio-economic technological innovations that will drive
the transition forward. It is managed as an integrated whole; however, the programme is contracted
via two complementary workstream arrangements as follows:
• An Accountable Grant with Loughborough University (LU) as leader of the UK University Partnership.
• An amendment to the existing Administrative Arrangement underlying DFID’s contribution to the ESMAP Trust Fund managed by the World Bank.
The intended outcome of MECS is a market-ready range of innovations (technology and business
models) which lead to improved choice of affordable and reliable modern energy cooking services for
21 The SE4ALL Global Tracking Report shows that the investment needed for universal access to modern
cooking (not including heating) by 2030 is about $4.4 billion annually. In 2012 investment was in cooking
was just $0.1 billion. Progress toward Sustainable Energy: Global Tracking Report 2015, World Bank.
22 The 2017 SE4All Global Tracking Framework Report laments that, “Relative to electricity, only a small
handful of countries are showing encouraging progress on access to clean cooking, most notably
Indonesia, as well as Peru and Vietnam.”

eCook Myanmar Cooking Diaries | October 2019 Working Paper
[email protected] | PV-ecook.org
This research is funded by DfID/UK Aid and Gamos through the Innovate UK Energy Catalyst and the MECS programme.
85
consumers. Figure 25 shows how the key components of the programme fit together. We will seek to
have the MECS principles adopted in the SDG 7.1 global tracking framework and hope that participating
countries will incorporate modern energy cooking services in energy policies and planning.
Figure 25: Overview of the MECS programme.
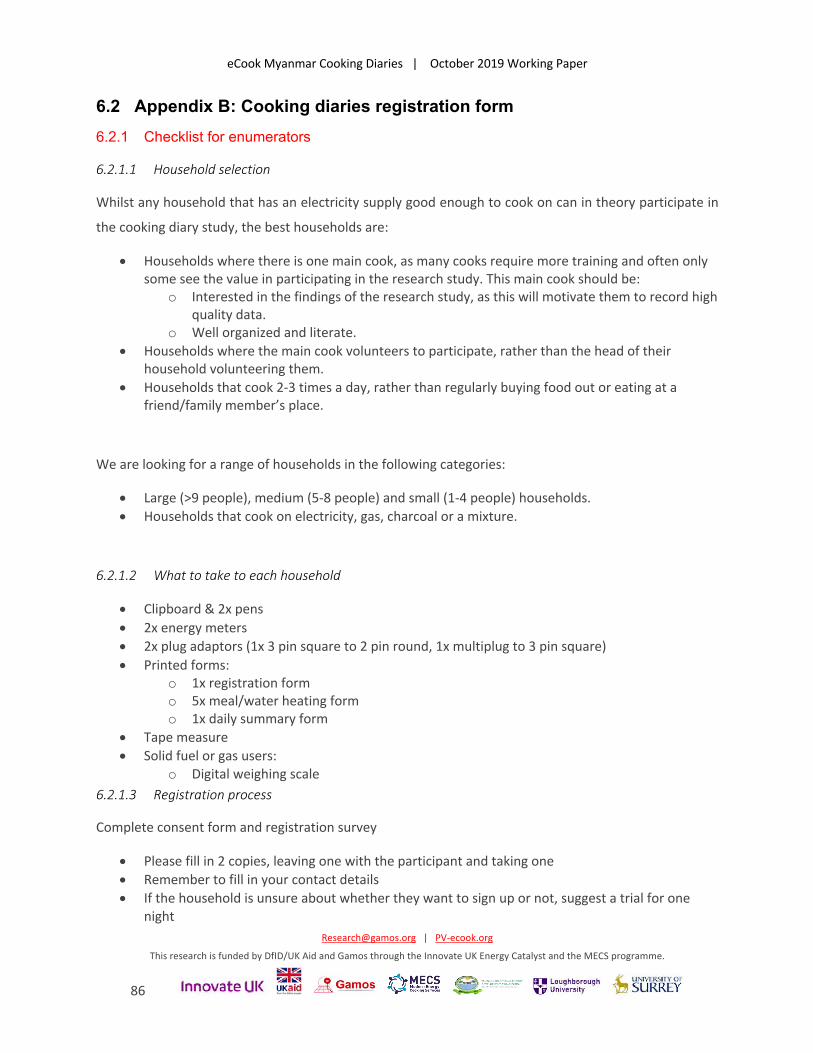
eCook Myanmar Cooking Diaries | October 2019 Working Paper
[email protected] | PV-ecook.org
This research is funded by DfID/UK Aid and Gamos through the Innovate UK Energy Catalyst and the MECS programme.
86
6.2 Appendix B: Cooking diaries registration form
6.2.1 Checklist for enumerators
6.2.1.1 Household selection
Whilst any household that has an electricity supply good enough to cook on can in theory participate in
the cooking diary study, the best households are:
• Households where there is one main cook, as many cooks require more training and often only some see the value in participating in the research study. This main cook should be:
o Interested in the findings of the research study, as this will motivate them to record high quality data.
o Well organized and literate. • Households where the main cook volunteers to participate, rather than the head of their
household volunteering them. • Households that cook 2-3 times a day, rather than regularly buying food out or eating at a
friend/family member’s place.
We are looking for a range of households in the following categories:
• Large (>9 people), medium (5-8 people) and small (1-4 people) households. • Households that cook on electricity, gas, charcoal or a mixture.
6.2.1.2 What to take to each household
• Clipboard & 2x pens • 2x energy meters • 2x plug adaptors (1x 3 pin square to 2 pin round, 1x multiplug to 3 pin square) • Printed forms:
o 1x registration form o 5x meal/water heating form o 1x daily summary form
• Tape measure • Solid fuel or gas users:
o Digital weighing scale 6.2.1.3 Registration process
Complete consent form and registration survey
• Please fill in 2 copies, leaving one with the participant and taking one • Remember to fill in your contact details • If the household is unsure about whether they want to sign up or not, suggest a trial for one
night

eCook Myanmar Cooking Diaries | October 2019 Working Paper
[email protected] | PV-ecook.org
This research is funded by DfID/UK Aid and Gamos through the Innovate UK Energy Catalyst and the MECS programme.
87
Talk through cooking diary forms:
• Meal/water heating form: o Cooks should fill out one form every time they use a cooking appliance.
§ A cooking appliance is defined as a device that cooks food or heats water. o Fill out sample form for the last meal you cooked and last time you used a cooking
appliance in between meals to demonstrate o Ask participant to fill out sample form from last meal they cooked and last time you
used a cooking appliance in between meals whilst you are there to help § Make sure they are aware of the fuel measurements, which must be collected
both BEFORE and AFTER each time they use a cooking appliance • Daily summary form
o Cooks fill out one form at the end of each day.
Practice taking fuel measurements
• Electricity: o The aim is to work out how much energy was used by cooking appliances during that
meal o We need TIME and ENERGY both BEFORE and AFTER cooking o Readings must be taken BEFORE cooking appliances are turned on
• Solid fuel: o The aim is to calculate the weight of charcoal, wood etc. burnt during that meal o We need the weigh of the bag of fuel BEFORE and AFTER the meal o We will subtract the AFTER weight from the BEFORE to calculate the charcoal burnt on
the stove o Ask people to show you the bag they store their fuel in
§ If it is a box or a big sack, ask the household to put more charcoal out than they think they will use into a plastic bag and weigh this before and after cooking
§ Make sure they know to put any remaining charcoal that has not gone onto the fire back into the bag before weighing
o Gas: § If a household has a big gas cylinder that is too heavy to weigh, we should
purchase a small cylinder and ask them to use that instead. § Weigh the cylinder before and after cooking, as with solid fuel. § Make sure the hose does not pull or push the cylinder, altering the weight
readings. If you think it will be a problem, ask the household to detach the regulator and weigh the cylinder by itself.
Remember to measure and photograph pots/pans/buckets/kettles and photograph all cooking
appliances, taking measurements of all hotplate diameters and noting the power rating of all electrical
cooking appliances.
6.2.2 Cooking Diaries Registration Form
Good (morning/afternoon). My name is ____________________ from the Renewable Energy
Association Myanmar (REAM). We are doing a project with Loughborough University and Gamos (UK)

eCook Myanmar Cooking Diaries | October 2019 Working Paper
[email protected] | PV-ecook.org
This research is funded by DfID/UK Aid and Gamos through the Innovate UK Energy Catalyst and the MECS programme.
88
on cooking practices in low income countries (in both Africa and Asia). I understand you have kindly
volunteered to participate in the household cooking survey. This is part of an international research
programme that aims to promote a transition from hazardous and polluting biomass fuels to clean,
modern cooking fuels.
How you can assist:
• You will be asked some basic information on your household as part of this registration process.
• You will be asked to keep a diary of all you cook and how you cook it over the next 6 weeks. • During the first two weeks, please cook as you always do and simply record what you are
doing in the data sheets. • After two weeks, you will be asked to try cooking only with electricity in order to see how
quickly you can adapt, and how practical this is. If you are already cooking solely with electricity, we may ask you to change your practices in some way.
• At the end of the exercise, a short exit survey will ask you how you got on.
How we will support you:
• I will visit tomorrow and then at least once a week (at a time that suits you) to see how you are getting on, answer any questions you may have, and collect the data sheets. If you are able to send copies of the data sheets to us electronically using WhatsApp or equivalent, we can offer remote assistance.
• If you do not own an electric hob, we will provide one for the second part of the trial. • We will pay for any additional electricity that you use for cooking during the survey.
The project meets the criteria for ethical research contained within the Code of Practice of
Loughborough University’s Ethical Advisory Committee. Your name will not appear in any data that shall
be made publicly available and the information you provide will be strictly used for research purposes. It
is up to you to decide whether to take part or not. Choosing not to take part or withdrawing at any point
will not disadvantage you in any way. If there are questions that you would prefer not to answer then
we respect your right not to answer them.
Do you consent to be part of this study? (Yes/No)______________
We will produce reports, guidance materials and academic papers detailing the findings from the
research, which will be used to inform manufacturers and policy-makers in Myanmar and
internationally.

eCook Myanmar Cooking Diaries | October 2019 Working Paper
[email protected] | PV-ecook.org
This research is funded by DfID/UK Aid and Gamos through the Innovate UK Energy Catalyst and the MECS programme.
89
Do you consent to any photos taken during the course of this study being used in such publications?
(Yes/No) ______________
Name: __________________________ Signature: _____________ Contact No.: _____________
Date: ______________ Location:_____________
Enumerator to give the participant details of who to contact with queries (or complaints).
Enumerator name: _____________ Enumerator phone number: _____________

eCook Myanmar Cooking Diaries | October 2019 Working Paper
[email protected] | PV-ecook.org
This research is funded by DfID/UK Aid and Gamos through the Innovate UK Energy Catalyst and the MECS programme.
90
DETAILS OF PARTICIPANT
1. Name of participant:……………………………………………………………….. 2. Age:………………………………. 3. Gender: c Male c Female c Other 4. What is the highest level of school you have attended?
c None c Incomplete primary c Completed primary c Incomplete secondary c Completed
secondary c Higher than secondary
INFORMATION ON YOUR HOUSEHOLD
5. Type of area:
c Urban c Peri-urban c Rural
6. How many people live in the household? ______________ 7. How many rooms in the dwelling? _______________ 8. Type of dwelling (options to be edited to suit country context):
c Compound house c Flat/apartment c Semi-detatched house c Separate house
9. Construction a. Walls
c Wood / mud / thatch c Mud bricks (traditional) c Corrugated iron sheet c Cement
block (plastered or unplastered) c Bricks (burnt) c Other………………………………………….
b. Roof
c Thatch/palm leaf c Wood c Corrugated iron / cement sheet c Cement c Tiles
c Other _____________
c. Floor
c Dirt/Mud/Dung c Cement screed c Tiles c Wood c Other _____________
10. Where is the kitchen located? • c Outdoor c Indoor, no outdoor area for solid fuel stoves c Indoor, with outdoor area for
solid fuel stoves 11. Where do you cook?
c Indoors c Outdoors c Sometimes indoors, sometimes outdoors
12. Please indicate how many of the following appliances are owned (even if not used).
Please take a photo of all appliances.
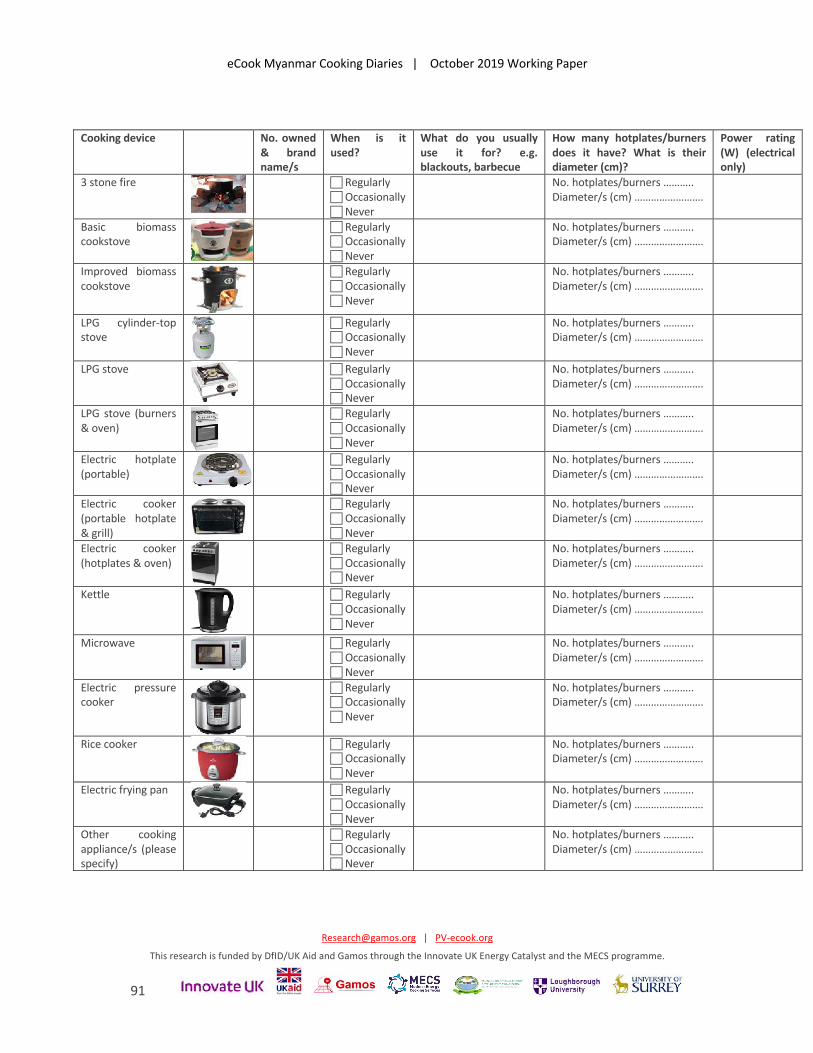
eCook Myanmar Cooking Diaries | October 2019 Working Paper
[email protected] | PV-ecook.org
This research is funded by DfID/UK Aid and Gamos through the Innovate UK Energy Catalyst and the MECS programme.
91
Cooking device No. owned & brand name/s
When is it used?
What do you usually use it for? e.g. blackouts, barbecue
How many hotplates/burners does it have? What is their diameter (cm)?
Power rating (W) (electrical only)
3 stone fire
c Regularly c Occasionally c Never
No. hotplates/burners ……….. Diameter/s (cm) …………………….
Basic biomass cookstove
c Regularly c Occasionally c Never
No. hotplates/burners ……….. Diameter/s (cm) …………………….
Improved biomass cookstove
c Regularly c Occasionally c Never
No. hotplates/burners ……….. Diameter/s (cm) …………………….
LPG cylinder-top stove
c Regularly c Occasionally c Never
No. hotplates/burners ……….. Diameter/s (cm) …………………….
LPG stove
c Regularly c Occasionally c Never
No. hotplates/burners ……….. Diameter/s (cm) …………………….
LPG stove (burners & oven)
c Regularly c Occasionally c Never
No. hotplates/burners ……….. Diameter/s (cm) …………………….
Electric hotplate (portable)
c Regularly c Occasionally c Never
No. hotplates/burners ……….. Diameter/s (cm) …………………….
Electric cooker (portable hotplate & grill)
c Regularly c Occasionally c Never
No. hotplates/burners ……….. Diameter/s (cm) …………………….
Electric cooker (hotplates & oven)
c Regularly c Occasionally c Never
No. hotplates/burners ……….. Diameter/s (cm) …………………….
Kettle
c Regularly c Occasionally c Never
No. hotplates/burners ……….. Diameter/s (cm) …………………….
Microwave
c Regularly c Occasionally c Never
No. hotplates/burners ……….. Diameter/s (cm) …………………….
Electric pressure cooker
c Regularly c Occasionally c Never
No. hotplates/burners ……….. Diameter/s (cm) …………………….
Rice cooker
c Regularly c Occasionally c Never
No. hotplates/burners ……….. Diameter/s (cm) …………………….
Electric frying pan
c Regularly c Occasionally c Never
No. hotplates/burners ……….. Diameter/s (cm) …………………….
Other cooking appliance/s (please specify)
c Regularly c Occasionally c Never
No. hotplates/burners ……….. Diameter/s (cm) …………………….

eCook Myanmar Cooking Diaries | October 2019 Working Paper
[email protected] | PV-ecook.org
This research is funded by DfID/UK Aid and Gamos through the Innovate UK Energy Catalyst and the MECS programme.
92
• Measurement of pots/pans/pressure cookers/kettles
Please take a photo of all pots/pans/pressure cookers/kettles
Is it a pressure cooker, kettle or a
big/medium/small pot or pan? Diameter (cm) and Height (cm) OR Volume (litres)
13. Fuel Measurements
Charcoal/pellets/wood/LPG users & fuel stackers only:
Charcoal Pellets Wood LPG
How often do you usually buy
charcoal/pellets/wood/LPG?
What quantity do you usually purchase (viss)?

eCook Myanmar Cooking Diaries | October 2019 Working Paper
[email protected] | PV-ecook.org
This research is funded by DfID/UK Aid and Gamos through the Innovate UK Energy Catalyst and the MECS programme.
93
How much does this cost (kyats)?
All households:
• What is your average monthly electricity bill? ________________ • Do you know how many units this is? ________________ • Are there different rates according to how many units you purchase?
Units Rate

eCook Myanmar Cooking Diaries | October 2019 Working Paper
[email protected] | PV-ecook.org
This research is funded by DfID/UK Aid and Gamos through the Innovate UK Energy Catalyst and the MECS programme.
94
6.3 Appendix C: Cooking diary form

eCook Myanmar Cooking Diaries | October 2019 Working Paper
[email protected] | PV-ecook.org
This research is funded by DfID/UK Aid and Gamos through the Innovate UK Energy Catalyst and the MECS programme.
95

eCook Myanmar Cooking Diaries | October 2019 Working Paper
[email protected] | PV-ecook.org
This research is funded by DfID/UK Aid and Gamos through the Innovate UK Energy Catalyst and the MECS programme.
96
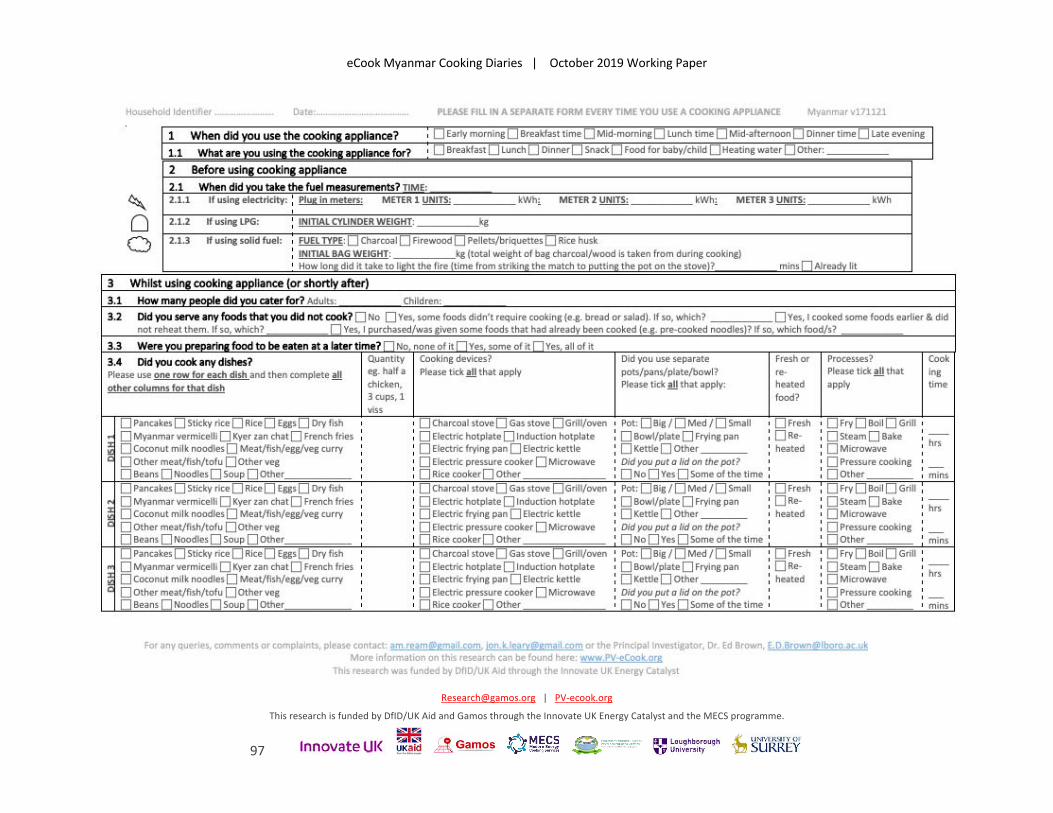
eCook Myanmar Cooking Diaries | October 2019 Working Paper
[email protected] | PV-ecook.org
This research is funded by DfID/UK Aid and Gamos through the Innovate UK Energy Catalyst and the MECS programme.
97
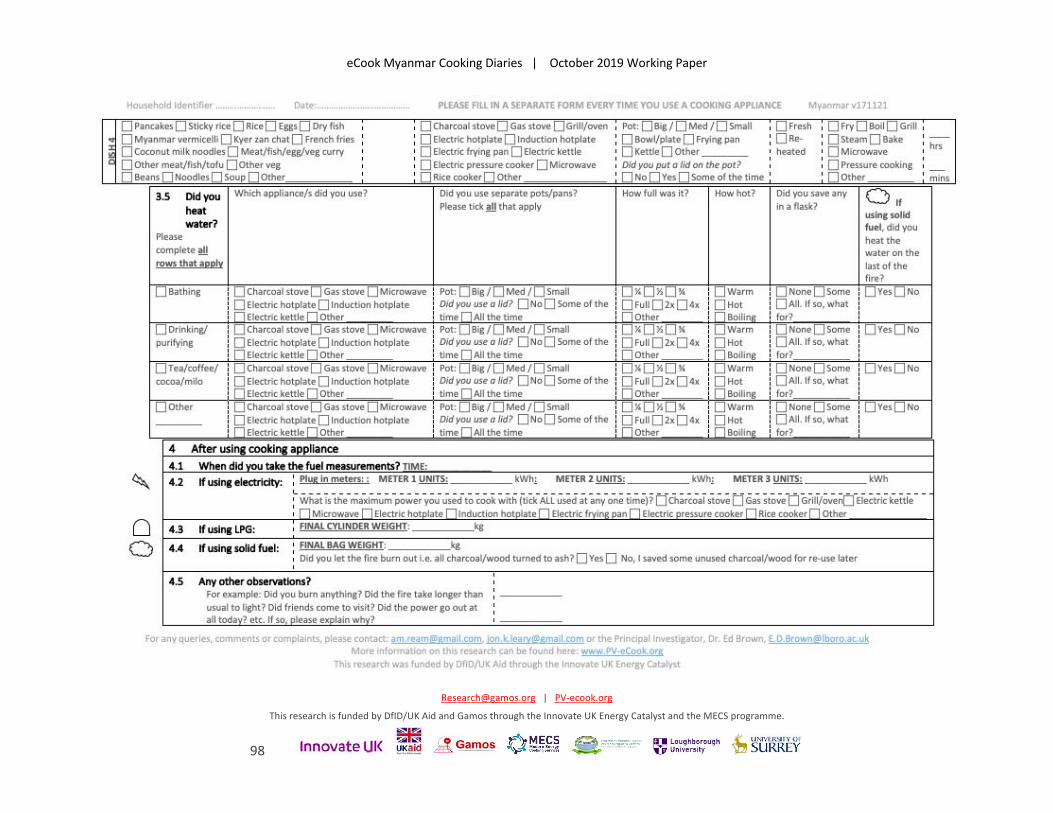
eCook Myanmar Cooking Diaries | October 2019 Working Paper
[email protected] | PV-ecook.org
This research is funded by DfID/UK Aid and Gamos through the Innovate UK Energy Catalyst and the MECS programme.
98

eCook Myanmar Cooking Diaries | October 2019 Working Paper
[email protected] | PV-ecook.org
This research is funded by DfID/UK Aid and Gamos through the Innovate UK Energy Catalyst and the MECS programme.
99
6.4 Appendix D: Daily summary form
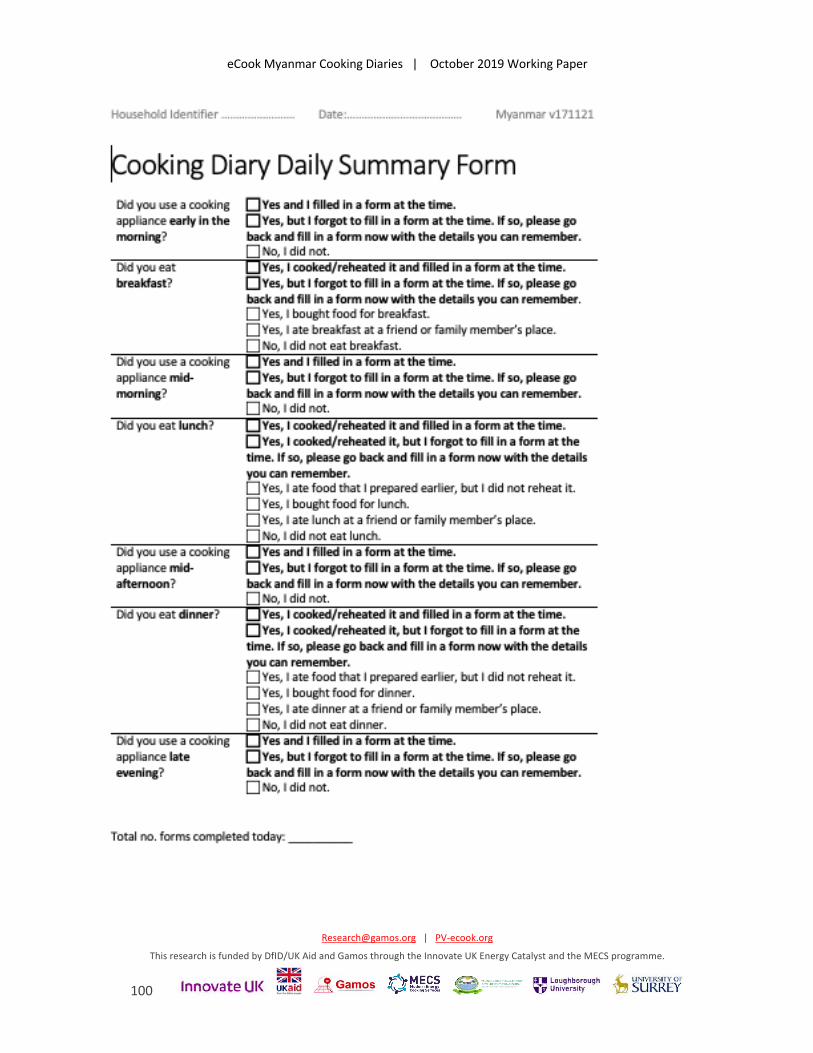
eCook Myanmar Cooking Diaries | October 2019 Working Paper
[email protected] | PV-ecook.org
This research is funded by DfID/UK Aid and Gamos through the Innovate UK Energy Catalyst and the MECS programme.
100

eCook Myanmar Cooking Diaries | October 2019 Working Paper
[email protected] | PV-ecook.org
This research is funded by DfID/UK Aid and Gamos through the Innovate UK Energy Catalyst and the MECS programme.
101
6.5 Appendix E: Cooking diaries exit survey
COOKING DIARY MYANMAR- EXIT INTERVIEW
Name: _________________________ HH ID: Date: ______________ Location:_____________
Fuel/s before survey:……………………………………………………………………………………………………
Pressure cooker (electric or not) before survey:…………………………………………………………..
As we come to the end of the survey, we take this opportunity to thank you for your endurance throughout the
period. We are glad that all went well from our side, however we wish to hear from you with a few questions
below.
Before we get on with the questions, I would like to ask that you prepare the chicken with potatoes and pressure
cooker for the Chicken Curry Challenge I had informed you about some weeks back. The competition is judged
solely on energy use, so as long as the chicken are judged by the enumerator/s to be as tasty as they expect
chicken to be (i.e. soft and accompanied by the usual pounded onion, garlic with chilli powder and oil), then the
winning household is simply the one that uses the lowest number of units to cook 0.25 viss of chicken. You are
permitted to marinate them an hour or overnight.
Your experience of cooking with electricity
1. How did the induction stove, rice cooker, therma-pot and pressure cooker suit the way you cook in your home?
(score:1 = strongly disagree; 2 = disagree; 3 = no opinion; 4 = agree; 5 = strongly agree)
Induction Stove
Rice Cooker Pressure Cooker
Therma -Pot
QUESTION 1 2 3 4 5 1 2 3 4 5 1 2 3 4 5 1 2 3 4 5 Comment It was easy to control heat
Ecooker could cook fast enough
Long cooking dishes were cooked much faster
Ecooker was hot enough
Ecooker burnt the food
My pots didn’t fit on the ecooker
Curries/rice/tea cooked on electric stoves just didn’t

eCook Myanmar Cooking Diaries | October 2019 Working Paper
[email protected] | PV-ecook.org
This research is funded by DfID/UK Aid and Gamos through the Innovate UK Energy Catalyst and the MECS programme.
102
taste the same
Food cooked using the ecooker tasted better than usual
I missed the smokey flavor of food
Pots were unstable on electric stoves
The ecooker didn’t make the pots dirty
The ecooker looked good in my kitchen
There is nowhere to put the ecooker
Operating the ecooker was easy
Ecooker was safe to use
I prefer to use an electric kettle for water boiling
2. How many hobs (rings) do you need for cooking?
[ ] 1 [ ] 2 [ ] 3 [ ] 4 3. What were the best things about cooking with electricity?
……………………………………………………………………………………………………………………………………………………………………………
……………………………………………………………………………………………………………………………………………………………………………
……………………………………………………………………………………………………………………………………………………………………………
…………………………………………………………………………………………………………………………………………………………………………..
4. And what were the worst things about cooking with electricity?
……………………………………………………………………………………………………………………………………………………………………………
……………………………………………………………………………………………………………………………………………………………………………
……………………………………………………………………………………………………………………………………………………………………………
…………………………………………………………………………………………………………………………………………………………………………..
5. What do you like most about cooking with charcoal/ firewood?
……………………………………………………………………………………………………………………………………………………………………………
……………………………………………………………………………………………………………………………………………………………………………
……………………………………………………………………………………………………………………………………………………………………………
…………………………………………………………………………………………………………………………………………………………………………..

eCook Myanmar Cooking Diaries | October 2019 Working Paper
[email protected] | PV-ecook.org
This research is funded by DfID/UK Aid and Gamos through the Innovate UK Energy Catalyst and the MECS programme.
103
6. What do you like most about cooking with LPG?
……………………………………………………………………………………………………………………………………………………………………………
……………………………………………………………………………………………………………………………………………………………………………
……………………………………………………………………………………………………………………………………………………………………………
…………………………………………………………………………………………………………………………………………………………………………..
7. What are the best things about not cooking with charcoal/ firewood?
……………………………………………………………………………………………………………………………………………………………………………
……………………………………………………………………………………………………………………………………………………………………………
……………………………………………………………………………………………………………………………………………………………………………
…………………………………………………………………………………………………………………………………………………………………………..
8. What are the best things about not cooking with LPG?
……………………………………………………………………………………………………………………………………………………………………………
……………………………………………………………………………………………………………………………………………………………………………
……………………………………………………………………………………………………………………………………………………………………………
…………………………………………………………………………………………………………………………………………………………………………..
9. Did you change your cooking behavior? If yes, how and why? ……………………………………………………………………………………………………………………………………………………………………………………………………………………………………………………………………………………………………………………………………………………………………………………………………………………………………………………………………………………………………………………………………………………………………………………………………………………………………………………………………………………………..
10. Your feeling about cooking with electricity in comparison to other fuels Do you think electric cooking is affordable? ………………………………………………………………………………………………………………………………………………………………………………………………………………………………………………………………………………………………………………………………………………………………………………………………………………………………………………………………………………………………………………………………………………………………………………………………………………………………………………………………………………………………
11. Do you think cooking with electricity is cheaper or more expensive than cooking with the fuels you normally use?
……………………………………………………………………………………………………………………………………………………………………………
……………………………………………………………………………………………………………………………………………………………………………
……………………………………………………………………………………………………………………………………………………………………………
……………………………………………………………………………………………………………………………………………………………………………
12. Were there times when the electricity was off and you wanted to cook or heat water? If so, what did you do?

eCook Myanmar Cooking Diaries | October 2019 Working Paper
[email protected] | PV-ecook.org
This research is funded by DfID/UK Aid and Gamos through the Innovate UK Energy Catalyst and the MECS programme.
104
………………………………………………………………………………………………………………………………………………………………………………
………………………………………………………………………………………………………………………………………………………………………………
………………………………………………………………………………………………………………………………………………………………………………
………………………………………………………………………………………………………………………………………………
13. Do you feel that cooking with the electric cooker is safer or more dangerous than cooking with your normal stove, and why? (e.g. risk of fires, burns)
Induction Stove ……………..………………………………………………………………………………………………………………………………….. ……………………………………………………………………………………………………………………………………………………………………………
Rice cooker………………………………………………………………………………………………………………………………………………………... ……………………………………………………………………………………………………………………………………………………………………………
Therma-Pot ……………………………………………………………………………………………………………………………………………………….. ……………………………………………………………………………………………………………………………………………………………………………
Pressure cooker………………………………………………………………………………………………………………………………………………….. …………………………………………………………………………………………………………………………………………………………………………… 14. How easy is it to learn to cook on an electric stove?
Induction Stove ……………..………………………………………………………………………………………………………………………………….. ……………………………………………………………………………………………………………………………………………………………………………
Rice cooker………………………………………………………………………………………………………………………………………………………... ……………………………………………………………………………………………………………………………………………………………………………
Therma-Pot ……………………………………………………………………………………………………………………………………………………….. ……………………………………………………………………………………………………………………………………………………………………………
Pressure cooker………………………………………………………………………………………………………………………………………………….. …………………………………………………………………………………………………………………………………………………………………………… 15. Would people need training on how to use an ecooker, or would they be able to learn by
themselves?
Induction Stove ……………..…………………………………………………………………………………………………………………………………. ……………………………………………………………………………………………………………………………………………………………………………
Rice cooker………………………………………………………………………………………………………………………………………………………... ……………………………………………………………………………………………………………………………………………………………………………
Therma-Pot ……………………………………………………………………………………………………………………………………………………….. ……………………………………………………………………………………………………………………………………………………………………………
Pressure cooker…………………………………………………………………………………………………………………………………………………. ……………………………………………………………………………………………………………………………………………………………………………
16. Would you ever cook using only electricity and no other fuels - and explain why?
…………………………………………………………………………………………………………………………………………………………………………………
…………………………………………………………………………………………………………………………………………………………………………………
…………………………………………………………………………………………………………………………………………………………………………………
…………………………………………………………………………………………………………………………………………………………..

eCook Myanmar Cooking Diaries | October 2019 Working Paper
[email protected] | PV-ecook.org
This research is funded by DfID/UK Aid and Gamos through the Innovate UK Energy Catalyst and the MECS programme.
105
17. What would you change about the design of the electric stoves you have been using?
Induction Stove ……………..…………………………………………………………………………………………………………………………………. ……………………………………………………………………………………………………………………………………………………………………………
Rice cooker………………………………………………………………………………………………………………………………………………………... ……………………………………………………………………………………………………………………………………………………………………………
Therma-Pot ……………………………………………………………………………………………………………………………………………………….. ……………………………………………………………………………………………………………………………………………………………………………
Pressure cooker…………………………………………………………………………………………………………………………………………………. …………………………………………………………………………………………………………………………………………………………………………… 18. We are done with our survey and are leaving the cookers with you. Will you continue using the e-
cookers or will you switch back to your old stove?
Induction Stove ……………..…………………………………………………………………………………………………………………………………. ……………………………………………………………………………………………………………………………………………………………………………
Rice cooker………………………………………………………………………………………………………………………………………………………... ……………………………………………………………………………………………………………………………………………………………………………
Therma-Pot ……………………………………………………………………………………………………………………………………………………….. ……………………………………………………………………………………………………………………………………………………………………………
Pressure cooker………………………………………………………………………………………………………………………………………………….
……………………………………………………………………………………………………………………………………………………………………………
19. We are not going to ask you to pay for the cooker. Would you buy this cooker if you saw one in a shop now? If so, how much would you be prepared to pay for this cooker (Myanmar Kyat)?
Induction Stove ……………..…………………………………………………………………………………………………………………………………. ……………………………………………………………………………………………………………………………………………………………………………
Rice cooker………………………………………………………………………………………………………………………………………………………... ……………………………………………………………………………………………………………………………………………………………………………
Therma-Pot ……………………………………………………………………………………………………………………………………………………….. ……………………………………………………………………………………………………………………………………………………………………………
Pressure cooker………………………………………………………………………………………………………………………………………………….
……………………………………………………………………………………………………………………………………………………………………………
Missing data
We have tried our best to learn as much as we can about how you cook, but we appreciate that the
tools we are using are limited. Please help us to understand what we may have missed.
20. Are there any meals that were cooked in your household since the beginning of the study that were not recorded on the forms you have given to us?
………………………………………………………………………………………………………………………………………………………………………………
………………………………………………………………………………………………………………………………………………………………………………
………………………………………………………………………………………………………………………………………………………………………………
…………………………………………………………………………………………………………………………………………………………………..

eCook Myanmar Cooking Diaries | October 2019 Working Paper
[email protected] | PV-ecook.org
This research is funded by DfID/UK Aid and Gamos through the Innovate UK Energy Catalyst and the MECS programme.
106
21. Is there anything else that you think is important about the way you cook that we have not yet captured?
………………………………………………………………………………………………………………………………………………………………………………
………………………………………………………………………………………………………………………………………………………………………………
………………………………………………………………………………………………………………………………………………………………………………
…………………………………………………………………………………………………………………………………………………………………..
How you feel about the survey
22. In the table below, tick where appropriate, where 1 is the lowest and 5 being the highest
QUESTION 1(Low) 2 3 4 5(High)
Overall cooking survey
Choice of appliance to trial (induction stove)
Choice of appliance to trial (pressure cooker)
Choice of appliance to trial (rice cooker)
Choice of appliance to trial (therma-pot)
Training on how to use induction stove
Training on how to use pressure cooker
Training on how to use rice cooker
Training on how to use therma-pot
Relevance of questions
Duration of survey

eCook Myanmar Cooking Diaries | October 2019 Working Paper
[email protected] | PV-ecook.org
This research is funded by DfID/UK Aid and Gamos through the Innovate UK Energy Catalyst and the MECS programme.
107
23. When you were approached to be part of the electric cooking survey were you hesitant? Has it been different to what you expected? ……………………………………………...……………………………………………………………………………………………...……………………………………………………………………………………...……………………………………………………………………………………………………………………………………………………………………………………………………………………………………………………………………………………………………………………………………………………………………………………………………………………………………………………..
24. At the beginning of the e-cooking, what was your expectation and was it met? ……………………………………………………………………………………………..………………………………………………………………………………………………..………………………………………………………………………………………………..……………………………………………………………………………………………………………………………………………………………………………………………………………………………………………………………………………………………………………………………………………………………………………………………
25. What do you think we could have done better in the survey? ……………………………………………………………………………………………………………………………………………………………………………………………………………………………………………………………………………………………………………………………………………………………………………………………………………………………………………………………………………………………………………………………………………………………………………………………………………………………………………………………………………………………….
26. Were the enumerator’s visits helpful or did you feel it was too much or too little?
……………………………………………………………………………………………………………………………………………………………
……………………………………………………………………………………………………………………………………………………………
……………………………………………………………………………………………………………………………………………………………
……………………………………………………………………………………………………………………………………………………………
…………………………………………………………………………………………………………………………………………………………
27. If we were to do another similar survey in the future would you be willing to be part of it?
……………………………………………………………………………………………………………………………………………………………
………….....................................................................................................................................................
END OF QUESTIONS

eCook Myanmar Cooking Diaries | October 2019 Working Paper
[email protected] | PV-ecook.org
This research is funded by DfID/UK Aid and Gamos through the Innovate UK Energy Catalyst and the MECS programme.
108
Chicken Curry eCooking Challenge
Wait for the chicken curry to be completed and then note down the total number of units used and the key energy saving tips the households used.
Total units used to cook 0.25 viss of chicken with 0.2 viss of potatoes and pounded garlic, onion, chilli powder and oil: ________kWh
Energy saving techniques employed: 1. c Marinating meat 2. c Adding correct amount of salt at beginning to allow it to soften ingredients as much as
possible 3. c Avoiding frying 4. c Putting a lid on the pan and turning the heat down to simmer rather than boil 5. c Avoid having to thicken the sauce by adding the correct amount of water from the beginning 6. c Choosing quicker cooking breed of chicken/variety of potatoes 7. c Using hot/warm water from the kettle (or other appliance) that had been boiled for
something else (please make a note if they boil the kettle especially for the chicken curry, as this energy should ne included in the total)
8. c Chopping up the ingredients as small as possible 9. c Correctly judging the cooking time, so avoiding depressurising and re-pressurising 10. c Adding all ingredients at the beginning, so avoiding cooking with the lid off (frying/boiling) 11. c Other/s. Please describe
_________________________________________________________ ________________________________________________________________________________
Thank the household for participating in the survey and the Chicken Curry Challenge.
The Prize will be presented to the winner after all exit survey interviews have been completed.