Economics325:(Public(Economics( Sections(A01,A02...
14
1 Economics 325: Public Economics Sections A01, A02 University of Victoria Midterm Examination #2 VERSION 2 SOLUTIONS Fall 2014 Instructor: Martin Farnham Midterm Exam #2 Assume competitive markets and “regular” preferences (indifference curves exhibit diminishing marginal rate of substitution) unless otherwise stated. Section 1: Multiple Choice (3 points each) Select the most appropriate answer, and fill in the matching letter on your bubble form. Assume that, unless otherwise indicated, markets are competitive. 1) Which of the following statements about the role of different levels of government in policymaking is/are true? I. Local government is likely to be more responsive to local needs than higher levels of government. II. Higher levels of government (provincial or federal government) are better able to redistribute income than is local government. III. Higher levels of government (provincial or federal government) are better able to manage externalities than is local government. A) I and II only. B) I and III only. C) I, II, and III D) I only. E) II only. 2) Which of the following statements about public pensions is/are true? I. Public pensions can solve a missing market problem in the market for annuities. II. The Canada Pension Plan is likely to pay a high return per dollar contributed for people of your generation (twentysomethings). III. The retirement of Baby Boomers is causing financial stress for many public pension systems in developed countries. A) I only.
Transcript of Economics325:(Public(Economics( Sections(A01,A02...

1
Economics 325: Public Economics Sections A01, A02
University of Victoria Midterm Examination #2
VERSION 2 SOLUTIONS
Fall 2014 Instructor: Martin Farnham Midterm Exam #2 Assume competitive markets and “regular” preferences (indifference curves exhibit diminishing marginal rate of substitution) unless otherwise stated. Section 1: Multiple Choice (3 points each) Select the most appropriate answer, and fill in the matching letter on your bubble form. Assume that, unless otherwise indicated, markets are competitive. 1) Which of the following statements about the role of different levels of government in policymaking is/are true? I. Local government is likely to be more responsive to local needs than higher levels of government. II. Higher levels of government (provincial or federal government) are better able to redistribute income than is local government. III. Higher levels of government (provincial or federal government) are better able to manage externalities than is local government. A) I and II only. B) I and III only. C) I, II, and III D) I only. E) II only. 2) Which of the following statements about public pensions is/are true? I. Public pensions can solve a missing market problem in the market for annuities. II. The Canada Pension Plan is likely to pay a high return per dollar contributed for people of your generation (twenty-‐somethings). III. The retirement of Baby Boomers is causing financial stress for many public pension systems in developed countries. A) I only.
2
B) II only. C) III only. D) I and III only. E) I and II only. 3) Which of the following statements about health insurance markets is/are true? I. Asymmetric information is likely to have important effects on health insurance markets. II. Health insurance markets are subject to adverse selection. III. The market for health insurance for unhealthy people is likely to be missing. A) I and II only. B) I and III only. C) I, II, and III D) I only. E) II only. 4) Which of the following statements about public spending on K-‐12 (primary and secondary) education is/are true? I. Public spending on K-‐12 education can be justified by the presence of positive externalities. II. Public spending on K-‐12 education can be justified on the basis of its usefulness in redistribution. III. Government spending on K-‐12 education tends to have the overall effect of redistributing from the poor to the middle class. A) I and II only. B) I and III only. C) I, II, and III D) I only. E) II only. 5) Health expenditures in Canada have risen as a share of GDP over the past few decades. Which of the following is NOT a likely contributor to this trend? A) Development of new, expensive drugs. B) The fact that healthcare is an inferior good. C) Development of new, expensive treatment technologies. D) The aging of the Baby Boom generation. E) The expansion of universal public healthcare.
3
6) Public spending on early childhood (pre-‐school) education is thought to yield a high return per dollar spent for all of the following reasons, EXCEPT: A) pre-‐school education develops non-‐cognitive skills. B) pre-‐school education leads to better learning in later school years. C) pre-‐school education leads to lower rates of incarceration (going to prison). D)pre-‐school education leads to lower rates of welfare takeup (participation in welfare programs). E) Actually, all of the above are reasons why returns to early childhood education are thought to be high. For questions 7 and 8, consider a market in which the supply curve slopes up, and the demand curve slopes down. 7) Which of the following statements is/are true? I. A per unit tax on the good will raise the price paid by consumers. II. A per unit tax on the good will lower the price received by producers. III. A tax paid to the government by producers will lead to a lower producer price than a tax paid to the government by consumers. A) II and III only. B) I, II, and III. C) I only. D) II only. E) I and II only. 8) Which of the following statements is/are true? I. The incidence of a per unit tax paid to the government by consumers will fall entirely on consumers. II. The incidence of a per unit tax paid to the government by producers will fall entirely on producers. III. The incidence of a per unit tax paid to the government by producers will fall on both producers and consumers. A) III only. B) II and III only. C) I, and II only. D) I only. E) II only. END SECTION 1.
4
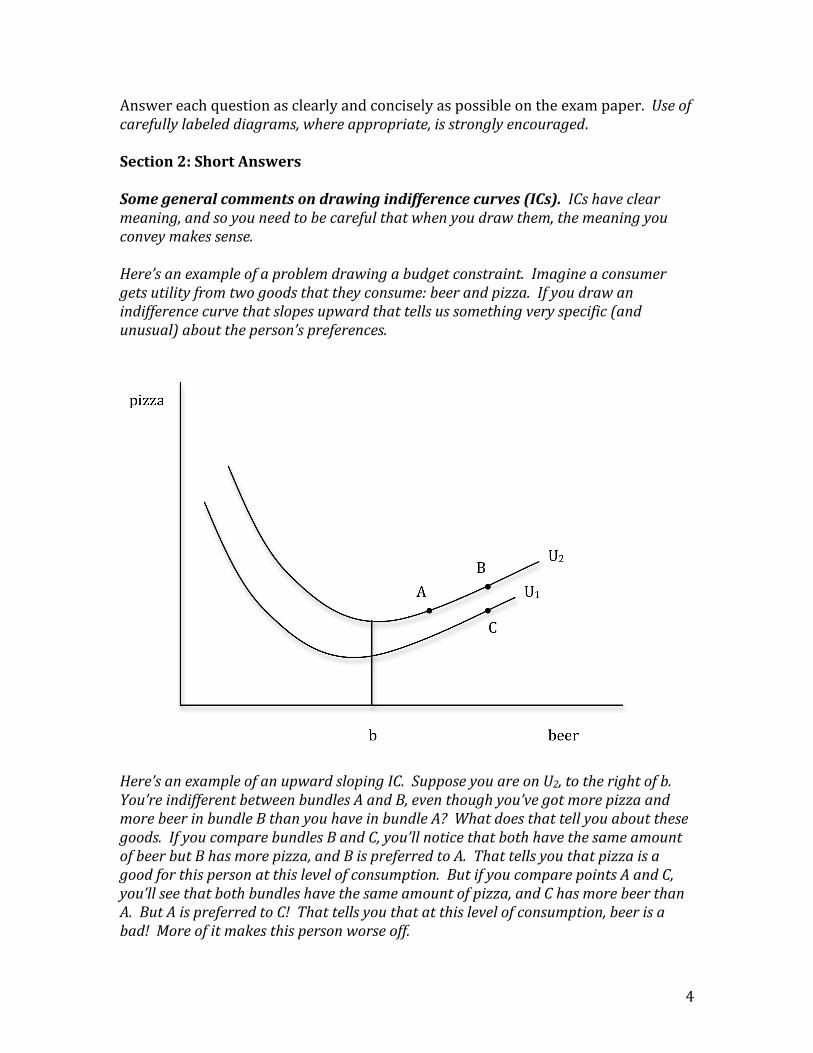
Answer each question as clearly and concisely as possible on the exam paper. Use of carefully labeled diagrams, where appropriate, is strongly encouraged. Section 2: Short Answers Some general comments on drawing indifference curves (ICs). ICs have clear meaning, and so you need to be careful that when you draw them, the meaning you convey makes sense. Here’s an example of a problem drawing a budget constraint. Imagine a consumer gets utility from two goods that they consume: beer and pizza. If you draw an indifference curve that slopes upward that tells us something very specific (and unusual) about the person’s preferences.
Here’s an example of an upward sloping IC. Suppose you are on U2, to the right of b. You’re indifferent between bundles A and B, even though you’ve got more pizza and more beer in bundle B than you have in bundle A? What does that tell you about these goods. If you compare bundles B and C, you’ll notice that both have the same amount of beer but B has more pizza, and B is preferred to A. That tells you that pizza is a good for this person at this level of consumption. But if you compare points A and C, you’ll see that both bundles have the same amount of pizza, and C has more beer than A. But A is preferred to C! That tells you that at this level of consumption, beer is a bad! More of it makes this person worse off.

5
Could it be true that more beer makes you worse off? It depends on what exactly we mean by more beer. Having more beer shouldn’t make you worse off as long as you’re not forced to drink it. You can always pour out a beer, so it shouldn’t really harm you to have more. It might not make you any better off, but a flat indifference curve can reflect that more realistic relationship between well-being and quantity of a good you have. Why do I bring this up? Because lots of people drew upward sloping ICs on the exam. If you draw ICs that slope up, it indicates a certain lack of understanding of what ICs are and what information they convey. It’s not to say we can’t have bads as well as goods, but there’d better be a good reason for you to treat something as a bad. There was no reason to treat anything as a bad on this exam. Here’s another problem that I saw WAY too much of on the exam:
Crossing indifference curves create an automatic logical contradiction. Consider that D, B, and E all give the same utility as each other (U2) and that A, B, and C all give the same utility as each other (U1). Because B is on both curves that means that all bundles should give the same utility as each other. And yet E lies on a higher curve than C and A lies on a higher curve than D, which implies that all bundles DON’T give the same utility. Crossing ICs make no sense. They are a logical contradiction. And yet
6
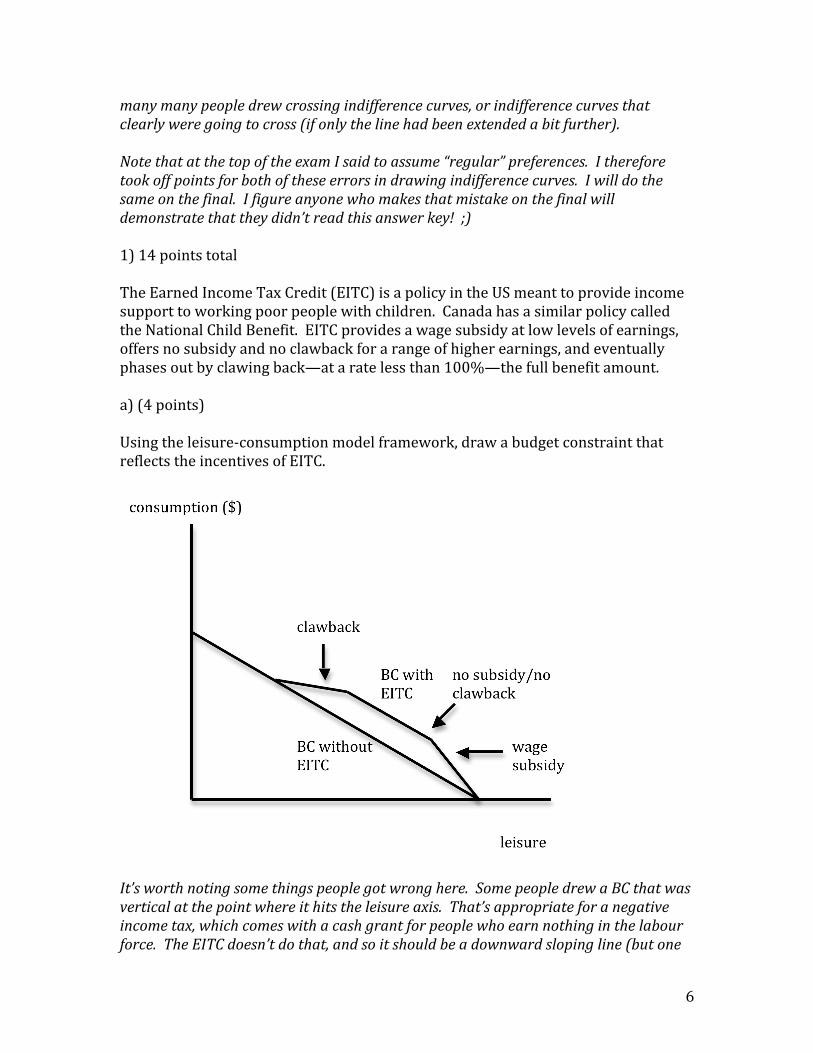
many many people drew crossing indifference curves, or indifference curves that clearly were going to cross (if only the line had been extended a bit further). Note that at the top of the exam I said to assume “regular” preferences. I therefore took off points for both of these errors in drawing indifference curves. I will do the same on the final. I figure anyone who makes that mistake on the final will demonstrate that they didn’t read this answer key! ;) 1) 14 points total The Earned Income Tax Credit (EITC) is a policy in the US meant to provide income support to working poor people with children. Canada has a similar policy called the National Child Benefit. EITC provides a wage subsidy at low levels of earnings, offers no subsidy and no clawback for a range of higher earnings, and eventually phases out by clawing back—at a rate less than 100%—the full benefit amount. a) (4 points) Using the leisure-‐consumption model framework, draw a budget constraint that reflects the incentives of EITC.
It’s worth noting some things people got wrong here. Some people drew a BC that was vertical at the point where it hits the leisure axis. That’s appropriate for a negative income tax, which comes with a cash grant for people who earn nothing in the labour force. The EITC doesn’t do that, and so it should be a downward sloping line (but one

7
steeper than the original budget constraint) where it hits the leisure axis. That implies a wage subsidy, whereas a vertical line implies a grant. Also, I said that the clawback was less than 100%. Several people drew a flat section of the EITC budget constraint to represent clawback. But flat indicates 100% clawback which is specifically not what I asked for. Those were the most common errors. A lot of people drew a budget constraint representing a negative income tax. That’s a different policy with different incentives. You want to understand the differences between these policies because they have different implications for effects on the labour market, which can be nicely illustrated with this model. b) (3 points) Using the leisure-‐consumption model, illustrate how the EITC could cause some people to increase their hours worked (compared to a world with no welfare policy).
Consider first the move from A to B as the policy is introduced (ignore A’ and B’ for now). This is someone who values leisure a lot and chooses not to work at all, in the absence of EITC. The wage subsidy part of EITC induces (through a substitution effect) the worker to join the labour force. They’re better off at point B than at A, so when
8
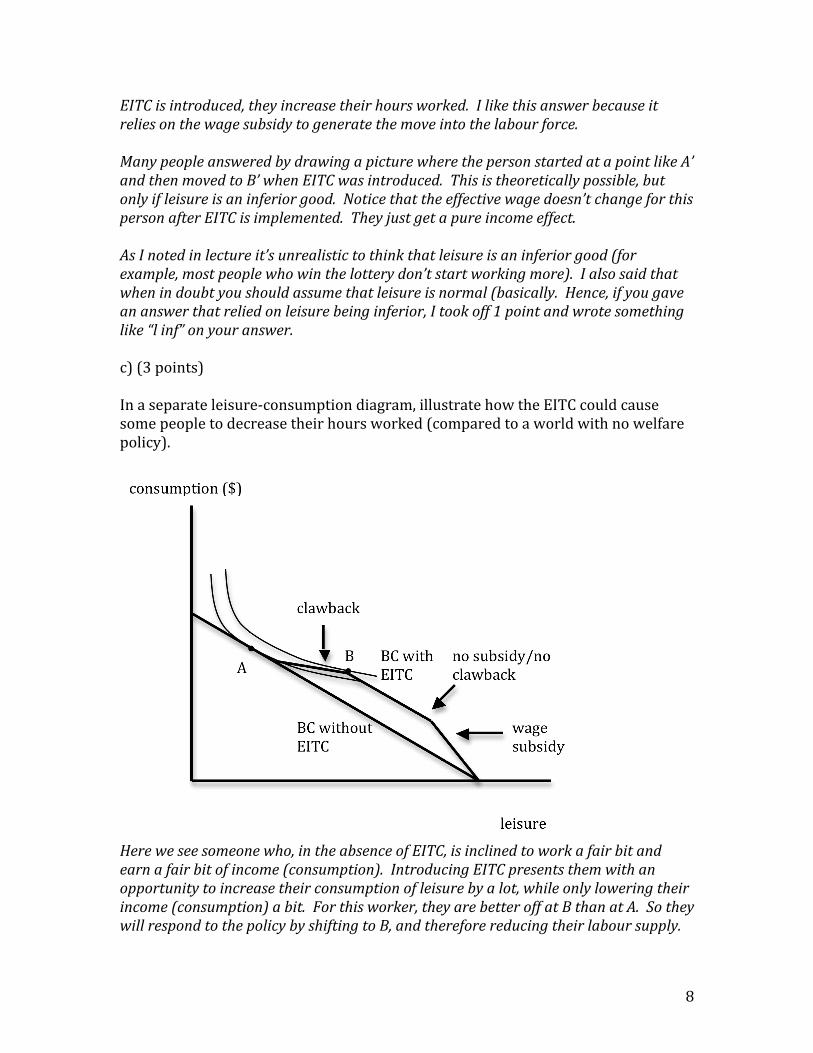
EITC is introduced, they increase their hours worked. I like this answer because it relies on the wage subsidy to generate the move into the labour force. Many people answered by drawing a picture where the person started at a point like A’ and then moved to B’ when EITC was introduced. This is theoretically possible, but only if leisure is an inferior good. Notice that the effective wage doesn’t change for this person after EITC is implemented. They just get a pure income effect. As I noted in lecture it’s unrealistic to think that leisure is an inferior good (for example, most people who win the lottery don’t start working more). I also said that when in doubt you should assume that leisure is normal (basically. Hence, if you gave an answer that relied on leisure being inferior, I took off 1 point and wrote something like “l inf” on your answer. c) (3 points) In a separate leisure-‐consumption diagram, illustrate how the EITC could cause some people to decrease their hours worked (compared to a world with no welfare policy).
Here we see someone who, in the absence of EITC, is inclined to work a fair bit and earn a fair bit of income (consumption). Introducing EITC presents them with an opportunity to increase their consumption of leisure by a lot, while only lowering their income (consumption) a bit. For this worker, they are better off at B than at A. So they will respond to the policy by shifting to B, and therefore reducing their labour supply.

9
Can you draw a case where the person starts off at A without EITC and remains at A when EITC is introduced? That sort of person is probably out there as well. d) (4 points) Consider the two effects you addressed in parts (b) and (c) above. What does the Chetty, Friedman, and Saez (2012) paper discussed in lecture suggest about the overall effect of EITC on labour supply? CF&S (2012) provide evidence that the overall effect of EITC on labour supply is to increase labour supply. (That statement was sufficient for 4 points, so long as nothing wrong was said along with it) The examples above show that—theoretically—the effect of EITC on labour supply is ambiguous. Given heterogeneous preferences, we can expect that some people will respond by increasing labour supply, while others will respond by decreasing labour supply. This is why we need empirical economists—they test our theories and can resolve such ambiguities in such cases. By the way, if you think I was ungenerous in my grading, I’ll note that I gave full points to people who drew a negative income tax for (b) and (c) so long as they were correctly illustrating some aspect of the negative income tax that also exists under EITC. For instance, clawback, or income effects of the policy.

10
2) 12 points total Consider a government that is trying to provide financial assistance to a poor individual. Use the consumer choice model to illustrate your answers below. Assume that consumers allocate their income between two goods: 1) Food (on the horizontal axis), and 2) Other Consumption (on the vertical axis). a) 3 points Illustrate a case where a cash transfer is as good for the poor individual as a non-‐transferrable food voucher (of equal cost to the government as the cash transfer).
I did this at the board in lecture, but you could figure this out if you practiced looking at the effects of policies on people with different preferences, as I suggested several times. Here someone chooses B if they’re offered a cash transfer. Since the budget constraint for the voucher perfectly overlaps the budget constraint for an equivalent-cost cash transfer in this region of the graph, the consumer also chooses B if they’re offered the voucher. The intuition is as follows. If someone is inclined to spend a fair bit of money on food, then as long as the voucher is smaller than the amount they intend to spend on food, the voucher is as good as cash. It’s like my friend I gave a Shell gift certificate to (as a thankyou gift). I thought it was crass to give him cash, and I knew he drove a big

11
pickup, so I figured giving him a voucher for gas at a Shell station was as good as giving him cash. b) 3 points Illustrate a case where a cash transfer is better for the poor individual than a non-‐transferrable food voucher (of equal cost to the government as the cash transfer).
This is straight from the lecture notes. Note which budget constraint is which, and why they’re shaped the way they are. Note that the person chooses to consume at A when there’s no policy. They choose to consume at B’ if they’re offered the voucher. And they choose to consume at B if offered the cash transfer. B clearly puts them on a higher indifference curve than B’ so they are better off with a cash transfer. Here the voucher basically forces the person to spend money on food that they’d rather spend on other consumption. That’s why the person is better off with the cash transfer of equivalent cost to the voucher.

12
c) 3 points Show how the poor individual would prefer a cash transfer to a food subsidy that costs the government the same amount as the cash transfer.
In my view this was the hardest question on the exam. You have to have pretty good command of this model to make this argument cleanly (though it was in the notes and discussed in lecture). Only a few people got it completely right. Let me walk you through it: The person starts at A (no subsidy) and ends up at C (with subsidy). Note that they start on indifference curve (IC) U1, and end up on U2.

13
In order to argue that a cash transfer is better than a subsidy (where the cash transfer is of same cost as the subsidy) we first need to assess the cost of the subsidy. To do this move to point C, where the consumer would be if the subsidy were offered. Note that the cost of the subsidy (the expenditure on the subsidy) is distance CD. How do we know this? Well, at point C the person is consuming f units of food. At point D they’re consuming the same amount of food, but they have (y-y’) less income in their pocket. So when the person chooses to consume f units of food with the subsidy, the government must be handing them y-y’ in extra money to allow them to afford point C. The distance y-y’ is the same as distance CD. So the subsidy that puts this person at C costs the government distance CD. Now we just need to offer this person a cash transfer equal to distance CD and compare the consumer’s utility under that cash transfer and under the subsidy. Notice that the cash transfer gives us a budget constraint that is parallel to the original BC. This is because cash transfers (lump sum transfers) don’t distort prices. Notice also (this is critical) that the cash transfer budget constraint passes through point C, and in doing so it cuts through indifference curve U2. This means that it spends some time above U2. It therefore allows the consumer to reach an even higher level of utility at C’, where the consumer receives utility U3. This graphically proves that utility is higher under an equivalent-cost cash transfer than it is under the subsidy. This is clearly a higher level of reasoning than you are asked to do in (a) and (b). That’s why I only made it worth 3 points. But notice that it’s a nice, clean, logical argument. This is the sort of skill that is very useful to hone if you want to be persuasive in work and other situations. And to get full credit, all you needed was the picture. Still, learn the written argument because that’s how you’ll understand the picture. d) 3 points Explain briefly why—in spite of your answers to parts (a) through (c), the government might often prefer not to assist poor people with cash transfers. More (good) reasons given will earn more points. There are good reasons and bad reasons for the government to choose in kind transfers. Some good reasons: Because the government may be trying to correct an externality by directing consumption towards a particular good. Examples of this would be if the government fears poor people will spend the transfer on drugs or alcohol instead of food.

14
Because the government wishes to target the transfer just to poor people. If the food voucher buys inferior food (that the rich don’t like) or if using the voucher carries some stigma so that the rich don’t want to be seen using it, then this may allow for better targeting (making sure those who should be getting the transfer are getting it, and making sure that those who shouldn’t be getting the transfer aren’t getting it). Some people mentioned LS distortions but the question was really about cash transfers vs. other types of transfers, so LS distortions are less of an issue than they would be in a case of comparing some transfer to no transfer. Though it’s fair to say that if cash transfers are “better” for the individual it might tempt them to quit work more than some less desirable transfer would. Some bad reasons: The government is paternalistic. Several people said, “Well maybe the government thinks people would be better off consuming more food and less other stuff”. Well, that’s the government telling people what’s best for them, which isn’t arguably desirable policy in many circumstances (some would say that paternalism is bad under any circumstances). END SECTION 2. END OF EXAM