ECONOMICS THE IMPACT OF EXTERNAL DEBT ON … · the impact of external debt on economic growth:...
33
ECONOMICS THE IMPACT OF EXTERNAL DEBT ON ECONOMIC GROWTH: EMPIRICAL EVIDENCE FROM HIGHLY INDEBTED POOR COUNTRIES by Abu Siddique Business School University of Western Australia E A Selvanathan Griffith Business School Griffith University and Saroja Selvanathan Griffith Business School Griffith University DISCUSSION PAPER 15.10
Transcript of ECONOMICS THE IMPACT OF EXTERNAL DEBT ON … · the impact of external debt on economic growth:...

ECONOMICS THE IMPACT OF EXTERNAL DEBT ON ECONOMIC GROWTH: EMPIRICAL EVIDENCE FROM HIGHLY
INDEBTED POOR COUNTRIES
by
Abu Siddique Business School
University of Western Australia
E A Selvanathan Griffith Business School
Griffith University
and
Saroja Selvanathan Griffith Business School
Griffith University
DISCUSSION PAPER 15.10

THE IMPACT OF EXTERNAL DEBT ON ECONOMIC GROWTH: EMPIRICAL EVIDENCE FROM HIGHLY INDEBTED POOR
COUNTRIES
Abu Siddique, Business School, The University of Western Australia E A Selvanathan, Griffith Business School, Griffith University, and Saroja Selvanathan, Griffith Business School, Griffith University
27 March 2015
DISCUSSION PAPER 15.10
ABSTRACT During the 1970s and 1980s, the external debt levels of poor countries rose to a level constituting a ‘debt crisis.’ The main source of the supply of external debt was the surplus revenue generated by the OPEC through significant increases in the price of oil during the 1970s. Unfortunately, many of the countries failed to use the external debt wisely and prudently. When the revenue from oil sales started to decline due to low oil prices during the 1980s, heavily indebted countries experienced difficulty servicing the debt. This paper analyses the extent to which the external debt burden impacts on a country’s gross domestic product (GDP) using data from HIPC over the period 1970-2007. The findings of empirical analysis suggest that, in the short-run as well as in the long-run, a reduction in debt stock would have significantly increased the growth performance of the indebted nations. Key words: External debt, Economic growth, Highly indebted poor countries, Debt relief. JEL Codes: O10, F34, H12, H63, O47, O55

1. Introduction
External debt is an important source of finance mainly used to supplement the domestic
sources of funds for supporting development and other needs of a country. Usually external
debt is incurred by a country which suffers from shortages of domestic savings and foreign
exchange needed to achieve its developmental and other national objectives. However, if the
external debt is not used in income-generating and productive activities, the ability of a
debtor nation to repay the debt is significantly reduced. It is often argued that the excessive
debt constitutes an obstacle to sustainable economic growth and poverty reduction
(Berensmann, 2004; and Maghyereh and Hashemite, 2003). Over the 1970s and 1980s, the
external debt levels of highly indebted poor countries (HIPC)1 rose to a level constituting a
‘debt crisis.’ The bulk of this debt is made up of public and publicly guaranteed debt (PPG).
The main source of the supply of external debt was the emergence of the Eurodollar market
resulting from the surplus revenue generated by the OPEC through significant increases in
the price of oil between 1973 and 1979. Cheap ‘petrodollars’ were recycled to the countries
which needed external debt. Unfortunately, many of the countries failed to use the external
debt wisely and prudently. A number of interrelated factors contributed to the rise in external
debt including macroeconomic policy, increases in the price of a number of primary
commodities encouraging countries to borrow, low real interest rates and a favourable world
environment. Unfortunately, the favourable conditions were short-lived and when they did
change over the 1980s, heavily indebted countries experienced difficulty in servicing the debt
(for details, see Abbott, 1993; Abrego and Ross, 2001; Altvater, 1991; Barro, 1989; Barro
and Lee, 1994; Clements et al, 2003; and Siddique, 1996).
In 1996, the International Monetary Fund (IMF) launched the HIPC initiative in an attempt to
reduce the external debt burden of low-income countries to sustainable levels in a reasonably
short period of time2. The HIPC initiative has generated a lot of attention and has been hailed
1 HIPC countries have 3 main common characteristics: (a) they incurred heavy debt mainly in the 1970s but the symptoms of HIPCs emerged in 1980s; (b) debt ratio of these countries is much higher than other low income or developing countries; and (c) they are poor countries with a lower economic growth (Birdsall et al., 2002). 2 In order to qualify for HIPC Initiative assistance, a country must meet the following four conditions: “1. Be eligible to borrow from the World Bank’s International Development Agency, which provides interest-free loans and grants to the world’s poorest countries, and from the IMF’s Poverty Reduction and Growth Trust, which provides loans to low-income countries at subsidized rates; 2. Face an unsustainable debt burden that cannot be addressed through traditional debt relief mechanisms; 3. Have established a track record of reform and sound policies through IMF- and World Bank-supported programs; and
1

by many as a significant event, promising economic opportunities for the debt ridden poor
countries. How much benefit did this Initiative bring for the HIPC? Literature examining the
relationship between reduction in external debt and economic growth gives mixed signals to
the policy makers in both the developed and the developing countries. Claessens (1990)
concludes that the actions taken by creditors to reduce a debtor’s burden of debt will benefit
both parties. But Clements et al. (2003) suggest that debt relief may have detrimental effects
on indebted countries and that reform may be more effective than relief. Similarly,
Berensmann (2004) argues debt relief is a necessary but not a sufficient condition for
development.
The main objective of this paper is to examine the influence of a change in external debt on
economic growth in the HIPC countries over the period 1970 to 2007 using recent
developments in time series and cross-sectional analysis. Standard growth accounting process
by decomposing the sources of economic growth will be employed for this purpose. In
addition, the paper will analyse the extent to which the external debt held by heavily indebted
poor countries has impacted on their economic growth. This will involve an analysis of
various debt ratios over time.
2. The Relationship between External Debt and Economic Growth: A Brief Review
In this section we briefly review the literature examining the impact of external debt on
economic growth. As discussed in Section 1, the results are inconclusive.
In an IMF Working Paper, Pattillo et al. (2002) analyse the effect debt burden has on
developing economies. Their empirical work covers 93 developing countries over the period
1969 to 1998. They estimate both linear and non-linear regressions controlling for a set of
variables common in the growth literature, including trade openness, schooling, population
and government budget. For robustness, they use four different definitions of debt burden,
namely the ratios of nominal and net present values of external debt to both exports and gross
domestic product. They conduct estimations by ordinary least squares, two-stage least
squares, fixed effects and system generalised method of moments, and their results are
appropriately consistent throughout. In summary, they find that for a country with average
4. Have developed a Poverty Reduction Strategy Paper (PRSP) through a broad-based participatory process in the country.” (IMF, 2014).
2

indebtedness, a doubling of the debt ratio would reduce annual per capita growth by between
a half and a full percentage point. They find that the average impact of debt only becomes
negative at debt ratios above 160-170 percent of exports or 35-40 percent of gross domestic
product, and that the marginal impact of debt starts becoming negative at about half of these
levels. Their results are robust to different period length samples, the inclusion of time
effects, and the removal of both investment as a control variable and outliers of observations.
The removal of investment as an explanatory variable also implies that high debt levels
appear to reduce growth by lowering the efficiency of investment more so than the volume of
investment.
In another IMF Working Paper, Clements et al. (2003) seek to analyse the channels through
which external debt impacts economic growth in low-income countries. They estimate a
reduced form growth equation for 55 low-income countries from 1970 to 1999, using both
fixed effects and system generalised method of moments. Like their colleagues at the IMF,
Pattillo et al. (2002), Clements et al. adjust their sample into 3 year averages to net out any
short-term fluctuations and also try four different definitions of debt burden (nominal debt
over exports and gross domestic product, and net present value debt over exports and gross
domestic product). Both estimation procedures and all four debt burden definitions give
broadly similar results. Namely, their estimation results support the debt overhang
hypothesis; however they estimate a threshold level of debt to exports of 100-105 percent and
a threshold level of debt to gross domestic product of 20-25 percent. Clements et al. also seek
to examine the relationship investment has on raising per capita growth. They first
disaggregate the investment control variable in their initial growth equation into private and
public investment, and find that it is public investment that impacts growth in low-income
countries. They then run a separate regression with pubic investment as the dependent
variable and assess the impact that debt service has on it. Essentially, they conclude that a
reduction in debt service of about 6 percentage points of gross domestic product would raise
public investment by between 0.75 and 1 percentage point of gross domestic product, which
would hence raise per capita income growth by about 0.2 percentage points.
Contrary to the above findings, Jayaraman and Lau (2009) find that higher debt levels can
promote higher economic growth. Their study involves six Pacific island countries between
1988 and 2004 and is based on regressing external debt stock, exports and the budget deficit
(all as a percentage of gross domestic product) against gross domestic product. Jayaraman
3

and Lau estimates a regression model by the panel group mean fully modified ordinary least
squares, and find that a 1 percent increase in the external debt stock leads to a 0.25 percent
increase in national output. Jayaraman and Lau also test for causality by a panel-based vector
error correction model with a dynamic error correction term, and find that whilst there is no
Granger causality relationship between real gross domestic product and external debt in the
long-run, there is a significant causal relationship running from external debt to gross
domestic product in the short-run.
Hameed et al. (2008) analyse the relationship between external debt and economic growth in
Pakistan. By using a production function model for time series data of gross domestic
product, debt service, capital stock and labour force from 1970 to 2003, the study examines
the dynamic effects that these variables have on economic performance. Multiple
cointegration procedures were employed to identify long-run relationships between the
variables. The long-run relationship shows that debt service affects gross domestic product
negatively, most likely through its adverse impacts on capital and labour productivity.
Granger causality was also estimated through a vector error correction model, and further
indicates that short-run and long-run negative causality runs from debt service to gross
domestic product.
In another single country study, Adegbite et al. (2008) investigate the impact that Nigeria’s
huge external debt stock had on its economic growth between 1975 and 2005. They use a
Solow-type neoclassical growth model to regress the ratio of external debt to gross domestic
product (along with several other macroeconomic and external sector exogenous variables)
against the annual gross domestic product growth rate. Using both ordinary least squares and
generalised least squares and estimating both linear and non-linear relationships, they study
the debt overhang theory for Nigeria. Their results find that external debt contributes
positively to growth up to a certain point, after which its contribution becomes negative. They
also investigate the “crowding out” effect of debt servicing by regressing debt service
requirements against private investment and find that Nigeria’s large debt burden did indeed
“crowd out” private investment.
Fonchamnyo (2009) studies the effect of economic and social performance in 60 low-income
countries to assess the relative effectiveness of the HIPC Initiative. He divides the 60 low-
income countries into four groups based on their 2005 HIPC status: non HIPCs, pre-decision
4

point, decision point and completion point HIPCs. He hypothesises that those countries
included in the HIPC Initiative will show better improvement in economic and social
development than those countries not included. To regress this he estimates an investment
function and an economic growth function, both by generalised method of moments, and
finds that his HIPC dummy is positive and significant in both. Thus, he concludes that this
shows that investment and growth have improved in HIPCs since the institution of the HIPC
Initiative, and there is also evidence that health care and education enrolment experienced
some improvement in countries that had reached the completion point of the HIPC Initiative.
Fosu (1999) studies the effect of external debt on the growth of 35 countries in sub-Saharan
Africa using World Bank data for the period 1980 to 1990. By regressing GDP growth on the
growth rates of labour, capital, exports, and external debt, Fosu shows that net outstanding
debt has a negative effect on economic growth (for given levels of production inputs).
Furthermore, he also finds that growth across these sub-Saharan African nations would have
been 50% higher during the period of study in the absence of the debt burden. Fosu also finds
little evidence of a negative correlation between external debt and investment levels.
Faini and de Melo (1990) assess the success of adjustment packages to developing countries
supported by loans from the World Bank and IMF, which focus on a series of microeconomic
reforms to assure supply-side improvement whilst simultaneously pursuing sharp real
exchange rate depreciation. The authors find that high external debt burdens, in conjunction
with macroeconomic instability, impede investment in developing countries. They argue that,
for such adjustment packages to result in the levels of investment necessary for the packages
to succeed, appropriate relief of external debt is required.
Froot (1989) compares different market-based debt reduction schemes, and argues that the
optimal approach to debt relief is a package that is part debt forgiveness, and part new
lending. In particular, Froot finds that debtor nations that finance buybacks using current
resources can impede incentives for new investment, and can therefore prolong the debt relief
process.
Fry (1989) examines the effect of foreign debt accumulation on the balance of the current
account using data from 28 countries identified to be heavily indebted to the World Bank in
1986. He argues that as long as an increase in foreign debt increases investment by less than
5
it increases saving – or reduces investment by more than it reduces saving – then the current
account will enter a state of equilibrium with a maintainable ratio of foreign debt to gross
national product. In particular, Fry identifies public and publically guaranteed debt as
reducing saving by more than it reduces investment, hence worsening the current account
deficit over time.
Hofman and Reisen (1991) compare responses to debt overhang from countries facing
liquidity constraints to those with access to new investment opportunities. They find that
direct debt reduction from the creditor would lead to a greater boost to the debtor nation than
new investment, but note that countries constrained by liquidity require new sources of funds
to be able to take advantage of profitable investment opportunities when they arise. They
conclude that in such circumstances, reducing the stock of external debt without
compensating with new lending will not lead to a tangible improvement to investment.
Krugman (1988) examines the choice of creditors to either finance or forgive a debt overhang
as a trade-off. He argues that while financing provides creditors with an option value should
the debtor nation do well in the future, it also weakens the incentive for the debtor nation to
attempt to improve the size of its debt stock, as the potential positive benefits would go
largely to the creditors. Krugman also finds that the trade-off is improved if both approaches,
financing and forgiving, are made contingent on factors that are beyond the direct control of
the debtor nation, such as prices of relevant commodities or world interest rates.
3. Emergence of the Debt Problem
3.1 Factors Contributing to the Emergence of the HIPC Countries The emergence of unsustainable debt in the HIPC countries can be analysed from both the
demand and supply side. From the demand side, the group of countries which are now
classified as HIPCs needed external debt to meet their development and other needs. Most of
these countries were poor with relatively lower economic growth and lower per capita
income. Hence national rates of savings were also very low with domestic savings being
insufficient to finance their developmental and national goals. Moreover, as most of these
countries were dependent on the exports of primary commodities, their export earnings were
not enough to finance import bills as they mostly imported capital intensive goods which
were relatively more expensive. Hence, there arose the need for external borrowing.
6

Fortunately (or, unfortunately) due to the significant increase in the price of oil between 1973
and 1979, the foreign reserve of the oil exporting countries dramatically increased with
deposited being mainly with the European banks. Thus there sprung a market for external
debt or borrowing from overseas sources.
During the 1970s most of the governments of the developing and poor countries heavily
borrowed money primarily to finance their industrial and infrastructure development. There
was a popular belief amongst many of the developing nations that the economic success
depended on industrial development which needed protection from overseas competition
during the initial stages of development. Thus industrial development was pursued with the
aid of the import substitution industrialisation strategy. Unfortunately, many of these
countries, especially the sub-Saharan African countries failed to invest their borrowed funds
in income generating activities and hence failed to enhance their ability to repay their
accumulated debt.
Based on the results reported in Siddique (1996), which analyses the external debt problem
facing 32 sub-Saharan African nations over the period 1971 to 1990, the following three
major interdependent factors were found to be contributing to the accumulation of external
debt.
The first is the trade policy. It is argued that governments seeking to address burgeoning
external debt should pursue trade policies that would result in significantly large export
earnings to meet additional debt obligations or to reduce the total stock of external debt in the
long term. Otherwise, the trade policy is considered inappropriate. Siddique (1996) finds that
approximately 21% of growth in the stock of external debt among the low-income countries
in question was due to inappropriate trade policy for the period 1971 to 1979.
The second is macroeconomic policy. Unsustainable expansionary monetary policy can result
in a chronic current account deficit and fiscal imbalance leading to a build-up of external
debt. Furthermore, Krueger (1987) identifies unrealistic macroeconomic policy as having the
potential to induce capital flight, forcing countries to engage in further borrowing not just to
meet existing debt obligations, but also to offset the impact of capital flight. Siddique (1996)
identifies a number of countries during the period 1971 to 1979 for which poor
macroeconomic policy was almost solely responsible for growth in net debt, but also
7

identifies cases in which macroeconomic policy designed to achieve high economic growth
enhanced the ability of debt-stricken low-income countries to meet their debt obligations.
The third is external and global shocks. This accounts for the contribution to external debt
from factors beyond the direct control of policymakers in low-income countries, such as real
interest rates, the onset of anti-inflationary monetary policy resulting in recession, and other
global economic conditions.
Giersch (1985) identified the following three factors which contributed to the emergence of
HIPCs:
• The 1973 oil price increase led to an increase in import bills of the indebted oil importing
countries which led to balance of payment deficit, causing the need for adjustment of the
production and consumption structures.
• Interest rates remained relatively lower in the 1960s and the 1970s which prompted the
developing countries to borrow more than they could afford once interest rates went up.
• The second oil shock in 1979 led to global recession in the early 1980s. Export incomes
of the indebted nations shrank considerably resulting in an increase in the need for more
borrowing for oil importing countries.
3.2 Trends and Patterns of the External Debt of the HIPCs To understand the movements in the overall trade and debt of the heavily indebted poor
countries (HIPCs), we aggregate the annual data for the 40 HIPCs for each of the sample
periods from 1970 to 2007. For selected years, columns 2-5 of Table 1 present the aggregate
total of Public and Public Guaranteed Debt (PPG Debt), Service Debt, Other Debt and the
Total Debt. As can be seen, a large share of the total debt is made up of the PPG debt. The
data shows strong growth in total debt from 1974 onwards, before peaking in 1998 and then it
is on a declining path but with a slight increase in 2007. The last two columns of the table
present the Total Merchandised Exports (TME) and the Gross Domestic Product (GDP)
aggregated over the 40 HIPCs. As can be seen, there is significant improvement in the
Merchandise Exports and GDP of the HIPCs during the last four decades.
8

Table 1 Debt, Output and Export Statistics of HIPCs, 1970-2007, selected years ($US millions, current)
Figure 1 plots the complete time series data of the variables listed in Table 1 for the whole
sample period. As can be seen, the total GDP, merchandise exports as well as the total debt of
the HIPCs, all continue to increase until the late 1990’s and, since 2000, while TME and
GDP has taken a sharp upward trend, PPG debt and total debt of the HIPCs has been on the
decline.
Figure 1 Aggregate PPG Debt, Service Debt, Other Debt, Total Debt, Merchandise Exports and GDP of HIPCs, 1970-2007 ($US millions, current)
To analyse the depth of the debt problem, we convert the data for the debt variables listed in
Table 1 in the form of relative measures with respect to GDP and merchandise exports. In
columns 2-3 of Table 2, we provide the ratios of PPG debt and total debt to GDP and
YearPPG Debt Service Debt Other Debt Total Debt
Total Merchandise
Exports (TME)
Gross Domestic
Product (GDP) (1) (2) (3) (4) (5) (6) (7)1970 5403.1 240.4 558.4 6201.9 5971.8 26259.41974 12338.4 606.0 1585.0 14529.3 10909.3 44846.81978 27521.0 1568.2 7630.7 36719.9 13458.7 73668.81982 49704.4 3622.7 13293.7 66620.9 15787.0 96816.11986 80593.8 4220.2 17350.2 102164.2 16291.0 115507.41990 111657.5 4734.7 24296.1 140688.3 20133.0 133790.11994 128268.7 3870.9 30443.6 162583.2 19199.4 105721.41998 130308.8 4253.1 31034.5 165596.5 25443.0 141116.22002 124355.9 3802.3 25515.4 153673.7 29010.6 149686.82006 92973.6 3123.1 23890.9 119987.6 66584.9 265230.02007 95704.6 3879.9 24403.0 123987.5 75522.1 311411.7
0
50000
100000
150000
200000
250000
300000
350000
1970
1971
1972
1973
1974
1975
1976
1977
1978
1979
1980
1981
1982
1983
1984
1985
1986
1987
1988
1989
1990
1991
1992
1993
1994
1995
1996
1997
1998
1999
2000
2001
2002
2003
2004
2005
2006
2007
US$
mill
ions
PPG Debt Service Debt Other Debt Total Debt TME GDP
9

columns 4-5 of the table presents the PPG debt and total debt to exports for selected years
between 1970 and 2007. The associated diagram, Figure 2, shows the complete time series
plot of these ratios from 1970 to 2007. As can be seen, the ratios of the PPG debt and total
debt to GDP (columns 2-3) and PPG debt and total debt to exports (columns 4-5), all rose to a
peak in the mid-1990s, before declining to close to their 1970 levels in 2007. Clearly, it
appears that some progress has been made by the HIPCs in reducing their debt level as a
percentage of GDP over the last century. Table 2 External Debt to GDP and Exports Ratios of HIPCs, 1970-2007, selected years
Figure 2 External Debt to GDP and External Debt to Exports Ratios of HIPCs, 1970-2007 In Table 3, we present the average annual growth rate of aggregated PPG debt, total debt,
GDP and exports in the 40 HIPC counties during four subsample periods and over the whole
YearPPG Debt/
GDPTotal
Debt/GDPPPG
Debt/ExportsTotal
Debt/Exports (1) (2) (3) (4) (5)1970 0.206 0.236 0.905 1.0391974 0.275 0.324 1.131 1.3321978 0.374 0.498 2.045 2.7281982 0.513 0.688 3.148 4.2201986 0.698 0.884 4.947 6.2711990 0.835 1.052 5.546 6.9881994 1.213 1.538 6.681 8.4681998 0.923 1.173 5.122 6.5092002 0.831 1.027 4.287 5.2972006 0.351 0.452 1.396 1.8022007 0.307 0.398 1.267 1.642
0.0
0.2
0.4
0.6
0.8
1.0
1.2
1.4
1.6
1.8
1970
1972
1974
1976
1978
1980
1982
1984
1986
1988
1990
1992
1994
1996
1998
2000
2002
2004
2006
Debt
to G
DP r
atio
PPG Debt/GDP Total Debt/GDP
0
1
2
3
4
5
6
7
8
9
10
1970
1972
1974
1976
1978
1980
1982
1984
1986
1988
1990
1992
1994
1996
1998
2000
2002
2004
2006
Debt
to E
xpor
ts ra
tio
PPG Debt/Exports Total Debt/Exports
10

Table 3 Average Annual Growth Rates of PPG Debt, Total Debt, GDP and Exports in HIPCs, 1970-2007
sample period. During the sub-period 1971-1979, PPG debt, total debt, GDP and exports, all
had a positive double-digit growth, while during 1980-1989, the PPG and total debts grew at
a higher rate but below the 1971-1979 level, and the GDP and exports had a positive but
much smaller growth rate. During 1990-1999, the debts, GDP and exports, all had
experienced a lower but positive growth ratio, but the sign has changed during 2000-2007.
The growth rates for the debts were negative but the growth rates of GDP and exports had
recovered and were in the double-digit level of the 1970s. Figure 3 plots the annual growth
rate of aggregated debt over the complete sample period. As is clearly evident, the growth
rate of total debt has been declining since the late 1970s, from high double digit growth to
negative growth in the 2000s, while the GDP and export growth has been excellent
throughout the whole sample period.
Figure 3 Annual Growth Rates of Total Debt in HIPCs, 1970-2007
Period PPG Debt Total Debt GDPMerchandise
Exports (1) (2) (3) (4) (5)1971-1979 22.15 24.15 13.49 12.701980-1989 12.06 11.55 4.85 1.951990-1999 2.22 2.35 0.49 3.042000-2007 -2.36 -2.47 11.66 15.39
1971-2007 8.74 9.10 7.25 7.76
-30
-20
-10
0
10
20
30
40
1971 1975 1979 1983 1987 1991 1995 1999 2003 2007
Total Debt Trend, Total Debt
11

4. Preliminary Data Analysis
The data on the following variables for the 40 HIPCs for the period 1970-2007 were obtained
from the World Development Indicators, World Bank. The variables used in our analysis are:
gross domestic product; gross capital formation; total debt; total trade; expenditure on
education and population. All the variables, except population, are in current $US. We
consider the following form of the above variables, (1) per capita GDP (GDP); (2) gross
capital formation per unit GDP (CF); (3) total debt per unit GDP (DB); (4) total trade per unit
GDP (TR); and (5) population (P) for our analysis3.
Data Summary
Table 4 presents a summary of the panel data set (40 HIPCs over the 38 year period, 1970-
2007) of the variables defined above. As can be seen, per capita GDP ranges between
US$57.2 and US$2095.6 with a sample mean of US$375.7 per annum, average gross capital
formation per dollar GDP is US$0.178 (range: US$-0.238 – US$0.603), average debt per
dollar GDP is US$1.046 (range: US$0 – US$15.98), average trade per dollar GDP is
US$60.82 (range: US$6.32 – US$280.36) and the average population of the HIPCs is about
9.5 million (range: 0.07 million – 79.1 million). The corresponding standard deviations are,
US$254.3, US$0.089, US$1.298, US$32.88 and 10.9 million, respectively. Table 4: Summary statistics for the variables, 40 HIPCs, 1970-2007
Test for stationarity and cointegration of the model variables Before estimation, we investigate the time series properties of each time series variable at the
individual country level and as a panel.
3 We also included Education as a variable in our analysis, however, due to reasons given in footnote 4, Education was dropped from the analysis.
Variable Mean MedianStandard deviation Min Max
(1) (2) (3) (4) (5) (6)GDP (in $) 375.7 302.8 254.3 57.2 2095.6
Capital formation (CF in $) 0.179 0.177 0.089 -0.238 0.603
Debt (DB in $) 1.046 0.731 1.298 0.000 15.982
Trade (TR in $) 60.82 52.21 32.88 6.32 280.36
Population (P in '000) 9505998 6080340 10900000 73728 79100000
12

Individual country unit root test and test of cointegration
First we apply Augmented Dicky Fuller (ADF) test (Dickey and Fuller, 1979; 1981) to test
the stationarity of each of the five variables GDP, CF, DB, TR and P. The null hypothesis of
the ADF test is that the time series has a unit root (or the time series is non-stationary). Table
5 presents the unit root test results. As can be seen, the p-value for testing the null hypothesis
of the existence of a unit root is mostly less than the level of significance, α = 0.05, thus we
reject the null hypothesis. This means that, almost all time series are stationary, that is I(0),
except GDP for Kyrgrz Republic and Tanzania; capital formation for Liberia; debt for
Eritrea, Madagascar and São Tomé and Príncipe; and, population for Benin and Comoros.
Panel unit root test and test of co-integration
Now we test for the existence of a unit root in each panel data time series variable. We
present here, the results from five such panel unit root tests known as LLC test, IPS test, ADF
test, PP test and Hadri test, developed by Levin, Lin and Chu (2002); Im, Pesaran and Shin
(2003); Dickey and Fuller (1981); Phillips and Perron (1988); and Hadri (2000), respectively.
The null hypothesis of all these tests is that the panel series has a unit root (or the time series
is non-stationary), except for the Hadri test which tests the opposite hypothesis of the series
and has no unit roots (or the time series is stationary). These test results are presented in
Table 6. As can be seen, the results indicate that capital formation and trade variables are
stationary in level form (that is, I(0)), whilst all the remaining variables are stationary in their
first differences, that is, I(1). In addition, we also use the Kao Residual co-integration test to
test for cointegration between GDP, capital formation, debt, trade and population. The value
of the test statistic to test the null hypothesis of no co-integration is -1.96 with a p-value of
0.0253, indicating that there is some support for co-integration between our variables of
interest. The above results show that an Auto Regressive Distributed Lags (ARDL) approach
would be more suitable to model the relationship between GDP and capital formation, debt,
trade and population.
5. Modelling the Relationship between Economic Performance and External Debt
To examine the influence of external debt on the economic performance of the HIPCs, we
first consider the stationarity and cointegration test results obtained in the previous section.
The results of Tables 5 and 6 suggest that a dynamic model such as an Auto Regressive
13

Distributed Lag (ARDL) model would be most suitable (see, Pesaran and Shin, 1999; and
Pesaran et al, 2001) for our analysis, as some of the variables are I(0) and others are I(1), and
Table 5 Value of the ADF test statistic and its p-value (in parentheses) from the Unit root test for each variable in each country
a: Insufficient observations; b: near-singular; highlighted cells represent insignificant coefficient estimates at the 5 percent level.
Country1 Benin -5.841 (0.000) -7.910 (0.000) -7.954 (0.000) -6.782 (0.000) -1.832 (0.355)2 Bolivia -4.860 (0.000) -6.080 (0.000) -4.560 (0.000) -5.330 (0.000) -6.266 (0.000)3 Burkina Faso -6.830 (0.000) -7.640 (0.000) -4.890 (0.000) -7.030 (0.000) -5.688 (0.000)4 Burundi -6.950 (0.000) -8.930 (0.000) -4.500 (0.000) -5.870 (0.000) -6.255 (0.000)5 Cameroon -4.350 (0.000) -6.840 (0.000) -5.340 (0.000) -6.080 (0.000) -5.718 (0.000)6 Central African Republic -6.874 (0.000) -7.559 (0.000) -7.190 (0.000) -6.874 (0.000) -6.264 (0.000)7 Chad -5.116 (0.000) -5.004 (0.000) -4.949 (0.000) -9.090 (0.000) -3.768 (0.007)8 Comoros -4.694 (0.000) -6.827 (0.000) -4.553 (0.000) -2.715 (0.009) 0.767 (0.991)9 Congo, Dem. Rep. -6.599 (0.000) -9.103 (0.000) -5.777 (0.000) -8.223 (0.000) -6.621 (0.000)10 Congo, Rep. -5.341 (0.000) -5.313 (0.000) -5.222 (0.000) -6.472 (0.000) -6.341 (0.000)11 Cote d'Ivoire -6.240 (0.000) -5.513 (0.000) -2.953 (0.004) -4.896 (0.000) -8.735 (0.000)12 Eritrea -2.145 (0.035) -6.018 (0.000) -1.840 (0.065) -4.646 (0.000) -6.250 (0.000)13 Ethiopia -6.600 (0.000) -8.385 (0.000) -4.315 (0.000) -2.990 (0.004) -4.098 (0.000)14 Gambia, The -6.609 (0.000) -5.751 (0.000) -5.367 (0.000) -8.218 (0.000) -6.319 (0.000)15 Ghana -5.653 (0.000) -6.260 (0.000) -4.733 (0.000) -4.828 (0.000) -6.603 (0.000)16 Guinea -2.873 (0.006) -3.936 (0.001) -4.067 (0.000) -3.611 (0.001) -6.231 (0.000)17 Guinea-Bissau -8.945 (0.000) -6.977 (0.000) -5.602 (0.000) -6.946 (0.000) -6.272 (0.000)18 Guyana -4.145 (0.000) -6.102 (0.000) -5.061 (0.000) -5.586 (0.000) -6.530 (0.000)19 Haiti -7.104 (0.000) -5.320 (0.000) -5.469 (0.000) -9.381 (0.000) -6.480 (0.000)20 Honduras -4.888 (0.000) -5.599 (0.000) -4.420 (0.000) -6.240 (0.000) -6.161 (0.000)21 Kyrgyz Republic -0.509 (0.480) -3.112 (0.004) -2.305 (0.025) -3.332 (0.003) -6.288 (0.000)22 Liberia -7.494 (0.000) -0.855 (0.297) -3.180 (0.002) -6.478 (0.000) -6.037 (0.000)23 Madagascar -6.189 (0.000) -7.141 (0.000) -1.812 (0.067) -6.108 (0.000) -6.655 (0.000)24 Malawi -7.845 (0.000) -8.419 (0.000) -5.463 (0.000) -7.090 (0.000) -6.208 (0.000)25 Mali -5.392 (0.000) -9.632 (0.000) -7.156 (0.000) -7.956 (0.000) -6.278 (0.000)26 Mauritania -6.127 (0.000) -9.789 (0.000) -4.576 (0.000) -8.257 (0.000) -6.337 (0.000)27 Mozambique -4.889 (0.000) -7.221 (0.000) -4.088 (0.000) -3.167 (0.003) -6.391 (0.000)28 Nepal -6.414 (0.000) -7.499 (0.000) -3.045 (0.003) -5.870 (0.000) -6.010 (0.000)29 Nicaragua -5.893 (0.000) -7.565 (0.000) -5.241 (0.000) -6.015 (0.000) -6.253 (0.000)30 Niger -6.435 (0.000) -5.957 (0.000) -5.201 (0.000) -6.620 (0.000) -4.797 (0.000)31 Rwanda -7.253 (0.000) -9.864 (0.000) -6.996 (0.000) -9.781 (0.000) -6.204 (0.000)32 Sao Tome and Principe -4.317 (0.000) a a -1.630 (0.096) a a -6.345 (0.000)33 Senegal -6.517 (0.000) -7.163 (0.000) -8.768 (0.000) -7.537 (0.000) -6.570 (0.000)34 Sierra Leone -7.088 (0.000) -8.371 (0.000) -4.767 (0.000) -7.777 (0.000) -6.299 (0.000)35 Somalia -5.319 (0.000) -10.053 (0.000) -4.245 (0.000) -4.658 (0.000) -5.009 (0.000)36 Sudan -3.574 (0.001) -5.086 (0.000) -5.692 (0.000) -5.840 (0.000) -6.805 (0.000)37 Tanzania -1.657 (0.091) -2.797 (0.009) -3.167 (0.003) -3.119 (0.004) -6.120 (0.000)38 Togo -6.088 (0.000) -5.621 (0.000) -5.382 (0.000) -6.565 (0.000) -6.300 (0.000)39 Uganda -5.553 (0.000) -7.667 (0.000) -4.827 (0.000) -5.973 (0.000) -5.947 (0.000)40 Zambia -4.020 (0.000) -7.190 (0.000) -5.224 (0.000) -6.237 (0.000) -6.349 (0.000)
GDP Capital formation Debt PopulationTrade
14

we can write an ARDL(p,q,q,…,q) dynamic panel specification for country i and period t of
the form
', ,
1 0,
p qit ij i t j ij i t j i it
j jy yλ µ ε− −
= == + + +∑ ∑ δ X t=1,2, …, T and i =1,2, …, N, (1)
Table 6 Panel unit root and cointegration test results
There exists a cointegrating relationship between the variables, assuming a long-run
relationship of the form
', ,it i i t ity uθ= +X t=1,2, …, T and i =1,2, …, N, (2)
where T is the number of time periods; N is the number of countries; Xit is a (k×1) vector of
explanatory variables for country i; µi, is the country-specific fixed effect; λij’s are scalars
and δij are (k×1) vectors of parameters of the model to be estimated. In addition, if the
variables in equation (2) are (1) and cointegrated, then the error term is a stationary process
for each country equation. This means that an error correction model can be formed in which
short-term dynamics can be combined with an error correction term to take care of the
Individual EffectsGDP 5.250 (1.000) 3.196 (1.000) 68.965 (0.806) 52.346 (0.993) 14.654 (0.000) -Capital Formation -4.376 (0.000) -4.893 (0.000) 165.547 (0.000) 143.550 (0.000) 9.337 (0.000) I(0)Debt -1.707 (0.044) -0.372 (0.355) 72.866 (0.701) 58.800 (0.964) 9.505 (0.000) -Trade -1.908 (0.028) -2.367 (0.009) 123.291 (0.001) 119.453 (0.002) 12.889 (0.000) I(0)Population 8.759 (1.000) 21.705 (1.000) 69.619 (0.623) 7.771 (1.000) 24.479 (0.000) -Individual Effects + TrendGDP 4.496 (1.000) 2.648 (0.996) 70.232 (0.774) 36.920 (1.000) 8.065 (0.000) -Capital Formation -5.606 (0.000) -4.615 (0.000) 157.729 (0.000) 137.432 (0.000) 9.586 (0.000) I(0)Debt 8.601 (1.000) 9.824 (1.000) 32.036 (1.000) 15.303 (1.000) 10.245 (0.000) -Trade -2.745 (0.003) -2.681 (0.004) 131.994 (0.000) 139.284 (0.000) 9.097 (0.000) I(0)Population 5.559 (1.000) 12.868 (1.000) 154.118 (0.000) 28.564 (1.000) 19.195 (0.000) -
Individual EffectsGDP -19.023 (0.000) -20.094 (0.000) 539.616 (0.000) 549.998 (0.000) 1.413 (0.079) I(1)Capital Formation -33.096 (0.000) -31.743 (0.000) 876.490 (0.000) 1008.72 (0.000) -0.213 (0.584) -Debt -22.533 (0.000) -21.676 (0.000) 599.549 (0.000) 588.157 (0.000) 0.659 (0.255) I(1)Trade -31.008 (0.000) -31.172 (0.000) 855.570 (0.000) 974.278 (0.000) 3.247 (0.001) -Population 3.800 (1.000) 1.383 (0.917) 229.581 (0.000) 335.473 (0.000) 16.798 (0.000) I(1)Individual Effects + TrendGDP -17.206 (0.000) -17.015 (0.000) 419.852 (0.000) 442.905 (0.000) 9.829 (0.000) I(1)Capital Formation -26.041 (0.000) -22.947 (0.000) 795.185 (0.000) 2485.330 (0.000) 2.891 (0.002) -Debt -20.929 (0.000) -20.374 (0.000) 547.499 (0.000) 813.104 (0.000) 3.121 (0.001) I(1)Trade -26.202 (0.000) -27.212 (0.000) 729.441 (0.000) 2578.390 (0.000) 12.157 (0.000) -Population 8.297 (1.000) -0.778 (0.218) 214.845 (0.000) 391.952 (0.000) 5.221 (0.000) I(1)
Data-based value of the test statistic (p-value in parenthesis) ConclusionLLC IPS ADF PP HADRI
B. First Differences
A. Levels
15

deviation from the long-run equilibrium. Therefore, we can parameterise equation (2) in the
form of an error correction (EC) model given by
1 1' * '*, 1 1 , ,
1 0( ) ,
p qit i i t i it ij i t j ij i t j i it
j jy y yφ θ λ µ ε
− −− − − −
= =∆ = − + ∆ + ∆ + +∑ ∑X δ X (3)
where 1(1 );pi ijjφ λ== − −∑ 0 / (1 );q
i ij ikkjθ δ λ== −∑ ∑ *1 ,p
ij imm jλ λ= += −∑ j=1,2,…,p-1; and
1* ,qij imm jδ δ−
== −∑ j=0,1,…,q.
The parameter φi is the error correcting speed of adjustment term. If φi =0, then there would
be no evidence for a long-run relationship. We would expect the estimated value of φi to be
significantly negative as variables are cointegrated implying that the variables should show a
return to long-run equilibrium. The θi coefficients measure the long-run relationship between
the variables and, *ijλ and *
ijδ measure the short-run relationship between the variables.
There are three approaches suggested in the literature (see Pesaran and Smith, 1995; and
Pesaran et al, 1997 and 1999) for the estimation of dynamic heterogeneous panel equation of
the form of equation (3) when both T and N are large.
The first approach is the dynamic fixed effects (DFE) estimation where time series data for
each country are pooled and only the intercept coefficients are allowed to vary across
countries, and the speed of adjustment coefficient and the slope (short-run) coefficients are
treated as equal across countries. It has been shown that if the slope coefficients are in fact
not identical, then such DFE estimation will produce inconsistent estimates and potentially
misleading results. DFE estimation is also subject to a simultaneous equation bias due to the
endogeneity between the error term and the lagged dependent variable (see Baltagi et al,
2000).
The second is the mean group (MG) estimation method proposed by Pesaran and Smith
(1995) in order to resolve the bias due to heterogeneous slopes in dynamic panels. Under this
approach, the model will be estimated separately for each country and a simple unweighted
arithmetic average of the coefficients will be calculated as the final (MG) estimates. MG
16

estimation allows for all intercept and slope coefficients to vary and be heterogeneous (error
variances are allowed to vary across countries) in the long-run as well as in the short-run.
The third approach is the pooled mean group (PMG) estimation introduced by Pesaran et al
(1997; 1999) which combines both pooling and averaging. The PMG estimator, as with the
MG estimator, allows the intercept, short-run coefficients and error variances to differ across
countries, but restricts the long-run (co-integrating) coefficients to be the same across
countries as with the DFE estimation method.
One advantage of the PMG over the traditional DFE is that PMG allows for the short-run
dynamic specification to differ from country to country. In terms of selecting the preferred
estimates between MG and PMG, one could use the Hausman test to see whether there is any
significant difference between the two sets of estimates. The null hypothesis of such a
hypothesis test can be defined as the difference between MG and PMG estimates is not
significant. If the null hypothesis is not rejected then we conclude that there is no significant
difference between the two set of estimates and select PMG estimates as they are efficient
estimates. If the null hypothesis is rejected then we conclude that there is significant
difference between the two set of estimates. One possible solution in this situation is to use
the average of the two estimators.
Model for Estimation
Assuming a long-run relationship between GDP and variables, capital formation (CF), debt
(DB), trade (TR) and population (P), in the form
GDPit = θoi + θ1iCFit + θ2iDBit + θ3iTRit + θ4iPit + µi + εit, (4)
We use an autoregressive distributed lag model, ARDL(p,q,q,q,q) of the form given by
equation (2) for estimation. Initial analysis indicates that an ARDL(1,1,1,1,1) dynamic panel
specification of the following form is suitable for our study:
GDPit = λi1GDPit-1 + δ10iCFit + δ20iDBit + δ30iTRit + δ40iPit
+ δ11iCFit-1 + δ21iDBit-1 + δ31iTRit-1 + δ41iPit-1 + µi + εit, (5)
17

where the number of countries, i=1,2,…, 40; number of periods, t = 1,2,..., 38; and µi is the
country-specific effect.
The re-parameterization of equation (5) into the error correction equation in the form of
equation (3) takes the form
∆GDPit = φi(GDPit-1 - θ0i - θ1iCFit-1 - θ2iDBit-1- θ3iTRit-1 - θ4iPit-1)
+ *01iδ ∆CFit+ *
02iδ ∆DBit + *03iδ ∆TRit + *
04iδ ∆Pit + µi + εit-1, (6)
where i=1,2,…, 40; φi = -(1-λi1); 0 1/ (1 );i i iθ µ λ= − 0 1 1( ) / (1 ), 1, 2,3, 4;ki k i k i i kθ δ δ λ= + − =
*1 ,p
ij imm jλ λ= += −∑ j=1,2,…,p-1; and 1* ,qkli klmm jδ δ−
== −∑ j=0,1,…,q-1, k=1,2,3,4, l=1,2.
The coefficient φi is the error correction speed of adjustment parameter, θki’s (k=1,2,3,4) are
the long-run coefficients, and *0i jδ ’s (j=1,2,3,4) are the short-run coefficients. These
coefficients are of primary interest in this study. The term θ0i allows for a non-zero mean
cointegrating relationship.
6. Empirical Results
Table 7 presents the three sets of alternative pooled estimates, namely, (1) MG estimates
which imposes no restrictions; (2) PMG estimates, which imposes common long-run effects;
and, (3) the DFE estimates which constrains all of the slope coefficients and error variances
to be the same. As can be seen, the signs of the coefficients are mostly the same, however,
some differences can also be noticed between the three sets of estimates; the standard errors
of the estimated long-run coefficients are also generally lower for the PMG estimates than
MG and DFE estimates. Across all three sets of estimates the speed of adjustment (the error
correction term) is negative and statistically significant. As expected, from econometric
theory, the MG error correction estimate presented in Table 7 indicates a much faster
adjustment than the PMG or DEF error correction estimates (-0.253 vs -0.039 and -0.046).
The individual country short-run PMG estimates are given in Table A1, Appendix. For a
long-run relationship to exist, we require φi to be non-zero. As can be seen, all but one of the
individual error correction coefficients is negative and less than one in absolute value. This
18

means that, for a majority of the individual countries, the hypothesis of no long-run
relationship would not be rejected (for theoretical results, see Pesaran et al, 1999).
Comparing the long-run standard errors of the three sets of estimates, we could see in the
case of PMG that imposing a long-run homogeneity reduces the standard errors of the long-
run coefficients. Furthermore, all of the estimated short-run and long-run debt coefficients are
negative and statistically significant at the 5% level.
Table 7 Panel ARDL Estimation Results from 40 HIPCs, 1970-20074
4 We also included Education as a variable in the model and the results are presented in Table A2 in the Appendix. Since the estimated coefficient for education has the incorrect sign and is insignificant, education was dropped from the model estimation.
VariablePooled Mean Group (PMG) Mean Group (MG)
Dynamic Fixed Effect (DFE)
Error Correction term -0.039 -0.253 -0.046Standard error (0.01) (0.06) (0.02)
p-value (0.00) (0.00) (0.01)
Short-runCapital formation 59.78 39.45 -3.35
Standard error (34.54) (50.55) (35.30)p-va lue (0.08) (0.44) (0.92)
Debt -218.36 -180.18 -94.29Standard error (25.39) (27.06) (21.38)
p-va lue (0.00) (0.00) (0.00)Trade -0.96 -0.95 -0.90
Standard error (0.32) (0.30) (0.37)p-va lue (0.00) (0.00) (0.02)
Population ( x 106) 124.00 -107.70 -21.30Standard error (287.60) (98.40) (17.00)
p-va lue (0.67) (0.27) (0.21)
Long-runCapital formation 2855.324 2384.174 1882.189
Standard error (659.76) (1003.36) (835.06)p-va lue (0.00) (0.02) (0.02)
Debt -559.224 -393.977 -315.779Standard error (118.99) (158.13) (152.45)
p-va lue (0.00) (0.01) (0.04)Trade 4.778 -1.658 7.829
Standard error (2.03) (4.16) (5.63)p-va lue (0.02) (0.69) (0.17)
Population ( x 106) 30.400 264.900 20.900Standard error (10.20) (147.70) (18.80)
p-va lue (0.00) (0.07) (0.27)Constant 17.20 -25.79 3.69
Standard error (9.62) (62.15) (11.81)p-va lue (0.07) (0.68) (0.76)
19
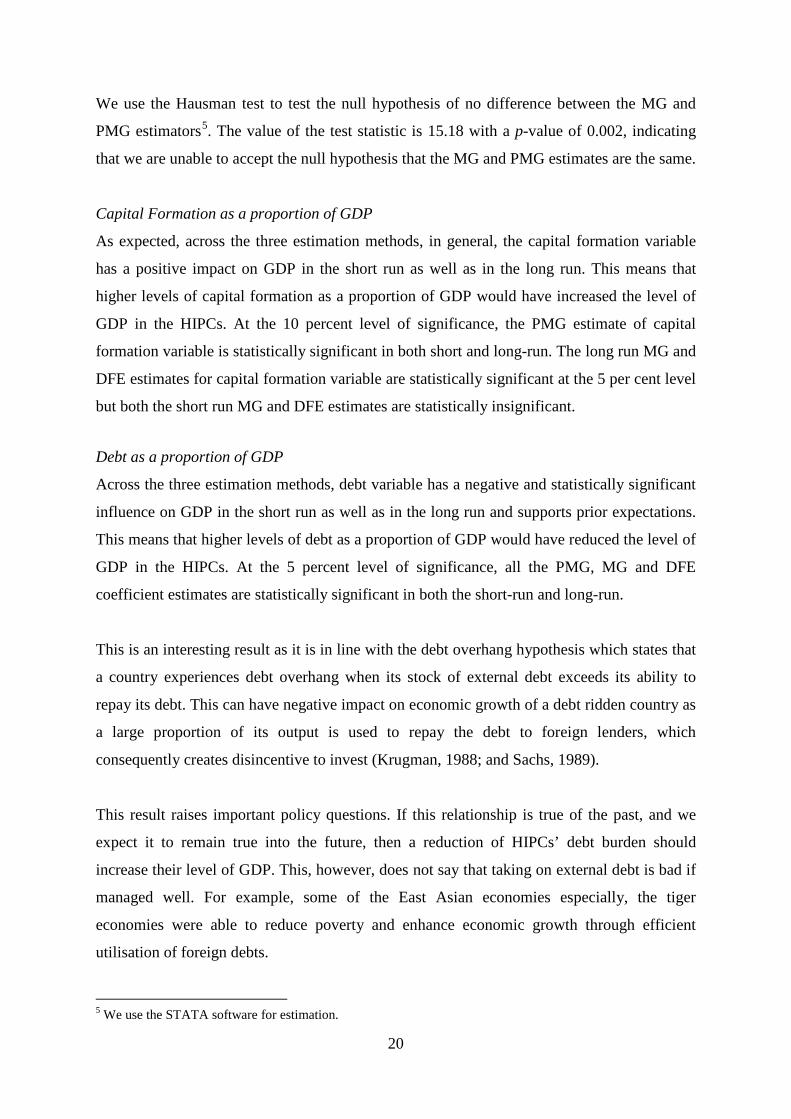
We use the Hausman test to test the null hypothesis of no difference between the MG and
PMG estimators5. The value of the test statistic is 15.18 with a p-value of 0.002, indicating
that we are unable to accept the null hypothesis that the MG and PMG estimates are the same.
Capital Formation as a proportion of GDP
As expected, across the three estimation methods, in general, the capital formation variable
has a positive impact on GDP in the short run as well as in the long run. This means that
higher levels of capital formation as a proportion of GDP would have increased the level of
GDP in the HIPCs. At the 10 percent level of significance, the PMG estimate of capital
formation variable is statistically significant in both short and long-run. The long run MG and
DFE estimates for capital formation variable are statistically significant at the 5 per cent level
but both the short run MG and DFE estimates are statistically insignificant.
Debt as a proportion of GDP
Across the three estimation methods, debt variable has a negative and statistically significant
influence on GDP in the short run as well as in the long run and supports prior expectations.
This means that higher levels of debt as a proportion of GDP would have reduced the level of
GDP in the HIPCs. At the 5 percent level of significance, all the PMG, MG and DFE
coefficient estimates are statistically significant in both the short-run and long-run.
This is an interesting result as it is in line with the debt overhang hypothesis which states that
a country experiences debt overhang when its stock of external debt exceeds its ability to
repay its debt. This can have negative impact on economic growth of a debt ridden country as
a large proportion of its output is used to repay the debt to foreign lenders, which
consequently creates disincentive to invest (Krugman, 1988; and Sachs, 1989).
This result raises important policy questions. If this relationship is true of the past, and we
expect it to remain true into the future, then a reduction of HIPCs’ debt burden should
increase their level of GDP. This, however, does not say that taking on external debt is bad if
managed well. For example, some of the East Asian economies especially, the tiger
economies were able to reduce poverty and enhance economic growth through efficient
utilisation of foreign debts.
5 We use the STATA software for estimation.
20

Total Trade as a proportion of GDP
The three sets of short-run negative estimates for the trade variable coefficient suggest that
increasing total merchandise exports as a proportion of GDP has a statistically significant
negative effect on increasing the level of GDP in the HIPCs. The long-run PMG coefficient
estimate for the trade variable is positive and significant but the long-run MG and DFE
coefficient estimates for trade variable are statistically insignificant.
This result could give rise to a change in development assistance policy. It also suggests that
the best way to help HIPC country economic performance is not to give more aid, but to
promote more exports.
Population
None of the short-run population coefficients are statistically significant. However, the long-
run PMG and MG population coefficient estimates are both positive and statistically
significant. This means that, in the long-run, an increase in population would impact
positively on the GDP, which may be due to the increase in the work force or human capital.
6. Conclusion
This paper examines short-run and long-run relationships between external debt and
economic growth in 40 HIPC countries over the period of 1970-2007 with the aid of the
growth accounting process. In addition, the impact of capital formation, trade and population
growth on economic growth in these countries is also examined. We use panel data
estimation of an ARDL model. The results indicate that capital formation has a positive
impact on GDP in the short run as well as in the long-run; debt has a negative influence in the
short run as well as in the long-run; and population increase has a positive influence on the
economic growth.
21

References
Abbott, G. (1993). Debt Relief and Sustainable Development in Sub-Saharan Africa. Edward Elgar Publishing, USA.
Abrego, L., and Ross, D. (2001). “Debt Relief Under the HIPC Initiative: Context and Outlook for Debt Sustainability and Resource Flow”, IMF Working Paper Series, Working Paper No. 144, IMF, Washington.
Adegbite, E.O., Ayadi, F.S., and Ayadi, O.F. (2008). “The Impact of Nigeria’s External Debt on Economic Development”, International Journal of Emerging Market 3(3): 285-301.
Altvater, E. (1991). The Poverty of Nations: A Guide to the Debt Crisis from Argentina to Zaire, Zed Books, London.
Baltagi, B.H., Griffin, J.M, and Xiong, W. (2000). “To Pool or Not To Pool: Homogeneous Versus Heterogeneous Estimators Applied to Cigarette Demand”, Review of Economics and Statistics 82(1): 117-126.
Barro, R. (1989). “Economic Growth in a Cross-Section of Countries”, NBER Working Paper Series, No. 3120, National Bureau of Economic Research, USA, September 1989.
Barro, R., and Lee, J. (1994). “Sources of Economic Growth”, Carnegie-Rochester Conference Series on Public Policy 40(9): 1-36.
Berensmann, K. (2004). “New Ways of Achieving Debt Sustainability beyond the Enhanced HIPC Initiative”, Intereconomics 39(6): 321-330.
Birdsall, N., Williamson, J., and Deese, B. (2002). Delivering on Debt Relief: From IMF Gold to a New Aid Architecture. Co-published by the Center for Global Development and the Institute for International Economics, Washington.
Claessens, S. (1990). “The Debt Laffer Curve: Some Estimates”, World Development 18(12):
Clements, B., Bhattacharya, R., and Nguyen, T. (2003). “External Debt, Public Investment, and Growth in Low-Income Countries”, IMF Working Paper No. 249, WP/03/249, IMF, Washington.
Dickey, D.A., and Fuller, W.A. (1979). "Distribution of the Estimators for Autoregressive Time Series with a Unit Root", Journal of the American Statistical Association 74 (366): 427–431.
Dickey, D.A., and Fuller, W.A. (1981). “Distribution of the Estimators for Autoregressive Time Series with a Unit Root”, Econometrica 49: 1057-1072.
Easterly, W. (2001). “The Lost Decades: Developing Countries’ Stagnation in Spite of Policy Reform 1980-1998”, Journal of Economic Growth 6: 135-157
Faini, R. and DeMelo, J. (1990). “Adjustment, Investment, and Real Exchange Rate in Developing Countries”, Economic Policy 11: 492-512.
22

Fonchamnyo, D.C. (2009). “Debt Relief Incentives in Highly Indebted Poor Countries (HIPC): An Empirical Assessment”, International Advances in Economic Research 15: 322-335.
Fosu, A.K. (1999). “The External Debt Burden and Economic Growth in the 1980s: Evidence from Sub-Saharan Africa”, Canadian Journal of Development Studies 20(2): 307-318.
Froot, K. (1989). “Buybacks, Exit Bonds, and the Optimality of Debt and Liquidity Relief”, International Economic Review 30: 49-70.
Fry, M.J. (1989). “Foreign Debt Instability: An Analysis of National Saving and Domestic Investment Response to Foreign Debt Accumulation in 28 Developing Countries”, Journal of International Money and Finance 8: 315-344.
Giersch, H. (1985). International Debt Problem: Lesson for the Future, Institute of World Economics, University of Kiel, Westview Press.
Hadri, K. (2000). “Testing for Stationarity in Heterogeneous Panel Data”, The Econometrics Journal 3(2): 148–161.
Hameed, A., Ashraf, H., and Chaudhary, M.A. (2008). “External Debt and Its Impact on Economic and Business Growth in Pakistan”, International Research Journal of Finance and Economics 20: 132-140.
Hoffman, B. and H. Reisen (1991). “Some Evidence on Debt-Related Determinants on Investment and Consumption in Heavily Indebted Countries”, Weltwirschaftliches Archive 127(2): 280-297.
Im, K.S., Pesaran, M.H., and Shin, Y. (2003): “Testing for Unit Roots in Heterogeneous
Panels”, Journal of Econometrics 115: 53-74. Jayaraman, T.K., and Lau, E. (2009). “Does External Debt Lead to Economic Growth in
Pacific Island Countries”, Journal of Policy Modelling 31: 272-288.
IMF (2014). International Monetary Fund, “Debt Relief under the Heavily Indebted Poor Countries (HIPC) Initiative”, Factsheet, September 30, 2014, available at: ttps://www.imf.org/external/np/exr/facts/hipc.htm-accessed on 24 March, 2015.
Kao, C. and McCoskey, S. (1998) “A Residual-Based Test of the Null of Cointegration in Panel Data”, Econometric Reviews 17: 57-84.
Kraay, A. and Nehru, V., (2006). “When Is External Debt Sustainable?”, The World Bank Economic Review 20(3): 341-365.
Krueger, A.O. (1987). “Origins of the Developing Countries’ Debt Crisis 1970 to 1982”, Journal of Development Economics 27: 165-187.
Krugman, P. (1988). “Financing vs. Forgiving a Debt Overhang: Some Analytical Notes”, Journal of Development Economics 29: 253-268.
23

Leipziger, D. and Allen, M., (2008) “Heavily Indebted Poor Countries (HIPC) Initiative and Multilateral Debt Relief Initiative (MDRI) – Status of Implementation”, International Development Association and International Monetary Fund.
Levin, A., Lin, C.F., and Chu, C. (2002). “Unit Root Tests in Panel Data: Asymptotic and Finite Sample Properties”, Journal of Econometrics 108: 1-24.
Maddala, G.S., and Wu, S. (1999). “A comparative study of unit root tests with panel data and New Simple Test”, Oxford Bulletin of Economics and Statistics 61: 631-652
Maghyereh, A., and Hashemite, U., (2003) “External Debt and Economic Growth in Jordan: The Threshold Effect”, Economia Internazionale/International Economics 56(3): 337-355.
Pattillo, C., Poirson, H., and Ricci, L. (2002). “External Debt and Growth”, IMF Working Paper No. 2, IMF, Washington.
Pesaran, M.H., and Shin, Y., (1999). “An autoregressive distributed lag modelling approach to cointegration analysis”, Chapter 11 in Econometrics and Economic Theory in the 20th Century: The Ragnar Frisch Centennial Symposium, Strom, S. (ed.), Cambridge University Press, Cambridge.
Pesaran, M.H., and Shin, Y. (2003). “Testing for Unit Roots in Heterogeneous Panels”, Journal of Econometrics 115: 53-74.
Pesaran, M.H., Shin, Y., and Smith, R.P. (1997). “Estimating Long-run Relationships in Dynamic Heterogeneous Panels”, DAE Working Papers Amalgamated Series 9721.
Pesaran, M.H., Shin, Y. and Smith, R.P. (1999). “Pooled Mean Group Estimation of Dynamic Heterogeneous Panels”, Journal of the American Statistical Association 94: 621-634.
Pesaran, M.H., Shin, Y. and Smith, R.P. (2001). “Bounds Testing Approaches to the Analysis of Level Relationships”, Journal of Applied Econometrics 16: 289–326.
Pesaran, M.H., and Smith, R.P. (1995) “Estimating Long-run Relationships from Dynamic Heterogeneous Panels”, Journal of Econometrics 68: 79-113.
Phillips, P.C.B., and Perron, P. (1988). “Testing for a Unit Root in Time Series Regression”, Biometrika 75(2): 335–346.
Sachs, J. (1989). “The Debt Overhang of Developing Countries”, in Calvo, G, R Findlay, P Kouri and J Macedo, eds., Debt, Stabilisation and Development: Essays in Memory of Carlos Diaz Alejandro, Oxford, Basic Blackwell, pp. 80-102.
Siddique, M. A. B. (1996). “The External Debt Problem of Sub-Saharan Africa: 1971-1990”, the South African Journal of Economics 64(2): 100-124.
24

APPENDIX
The individual country short-run PMG estimates for equation (6) are given in Table A1. Table A1 Panel ARDL Estimation Results, Individual HIPCs, 1970-2007
Table A2 presents the corresponding estimation results to Table 7 with Education (education
expenditure as a proportion of GDP) included as an additional variable in equation (6).
Across the three sets of short-run estimates, the coefficient attached to the education variable
is mostly negative but statistically insignificant. The long run PMG coefficient estimate for
education is negative and statistically significant, and the long-run MG and DFE coefficient
estimates of education are insignificant. These results suggest that expenditure on education
as a proportion of GDP is detrimental to the level of GDP in the HIPCs. The direction of this
relationship is markedly different from rational expectation.
EC Capform Trade Debt Pop Constant1 -0.039 0.171 79.482 0.520 -0.130 0.876 -293.424 0.000 -38.700 0.660 10.252 0.6042 -0.080 0.055 -198.324 0.170 0.550 0.750 -307.575 0.000 718.300 0.203 -65.276 0.3933 -0.029 0.410 -170.788 0.216 1.479 0.250 -504.665 0.000 -99.700 0.001 19.341 0.4054 -0.014 0.041 55.945 0.361 0.324 0.478 -55.189 0.002 -17.700 0.426 4.606 0.2285 -0.040 0.002 -373.487 0.203 -7.670 0.000 -487.700 0.000 -105.400 0.002 47.348 0.0216 -0.031 0.055 -97.133 0.540 -0.528 0.428 -314.442 0.000 -135.300 0.396 18.558 0.1327 -0.034 0.006 -189.431 0.000 -0.149 0.556 -308.199 0.000 24.500 0.459 -3.747 0.6138 -0.083 0.002 -17.194 0.878 -0.526 0.646 -426.175 0.000 10702.000 0.104 -88.315 0.2149 -0.038 0.109 -29.561 0.811 -1.074 0.096 -70.299 0.013 -24.100 0.184 -3.192 0.878
10 -0.009 0.650 199.430 0.363 1.343 0.203 -356.225 0.000 -1635.500 0.000 160.247 0.00011 -0.092 0.011 703.942 0.185 -4.140 0.051 -314.488 0.000 37.800 0.810 29.951 0.61212 0.006 0.639 41.122 0.301 -0.090 0.808 -157.078 0.000 23.500 0.737 16.786 0.32813 -0.011 0.074 -23.134 0.786 -4.326 0.000 -43.257 0.008 2.910 0.388 -17.292 0.08814 -0.048 0.007 39.797 0.718 0.118 0.713 -150.239 0.000 -121.700 0.429 3.678 0.74715 -0.018 0.220 162.449 0.289 -1.031 0.150 -258.686 0.000 -63.200 0.200 27.133 0.12716 -0.071 0.195 231.802 0.324 -1.457 0.104 -433.105 0.000 -77.800 0.126 13.750 0.31217 -0.004 0.336 36.543 0.367 -0.660 0.009 -43.397 0.000 -249.100 0.331 14.574 0.04418 -0.020 0.448 14.523 0.926 0.055 0.893 -106.765 0.000 -1456.600 0.783 32.539 0.09119 -0.083 0.014 -36.360 0.851 -0.288 0.698 -648.575 0.000 -13.200 0.728 -17.207 0.26420 -0.034 0.138 378.140 0.085 -1.442 0.197 -412.861 0.000 -620.800 0.000 112.837 0.00021 -0.091 0.023 3.464 0.979 1.881 0.004 -291.171 0.000 645.800 0.020 -31.726 0.12222 -0.009 0.085 210.122 0.554 -0.173 0.655 -26.862 0.002 -48.400 0.511 17.830 0.00823 -0.044 0.030 343.721 0.147 -1.059 0.157 -50.701 0.157 -94.600 0.077 26.705 0.12524 -0.013 0.144 -32.048 0.418 -0.694 0.007 -74.488 0.000 -21.700 0.370 3.892 0.66925 -0.050 0.095 -24.690 0.813 -1.061 0.055 -129.799 0.001 -23.400 0.041 -2.815 0.81026 -0.035 0.001 -44.590 0.109 -0.323 0.265 -216.179 0.000 -897.300 0.000 69.938 0.00027 -0.034 0.030 -112.937 0.316 -5.214 0.000 -10.247 0.605 7.890 0.746 10.629 0.35028 -0.041 0.042 -156.179 0.078 0.203 0.716 -213.158 0.000 -75.300 0.029 2.363 0.82229 -0.020 0.038 643.611 0.000 -5.437 0.000 -48.806 0.000 -145.500 0.467 53.307 0.01730 -0.046 0.045 222.482 0.057 -0.139 0.862 -158.614 0.002 -42.800 0.404 1.668 0.92631 -0.071 0.002 -1.165 0.994 -1.739 0.001 -106.360 0.000 -13.200 301.000 -13.903 0.1553233 -0.053 0.035 84.798 0.709 -2.602 0.008 -439.302 0.000 -161.900 0.267 40.870 0.22734 -0.006 0.729 -100.898 0.535 0.342 0.545 -104.582 0.000 -49.700 0.506 9.685 0.28335 -0.020 0.080 -67.181 0.170 -0.513 0.002 -79.378 0.000 -35.800 0.092 10.747 0.03636 -0.111 0.004 321.057 0.172 -0.413 0.846 -173.956 0.000 104.400 0.083 -88.281 0.02137 -0.027 0.059 -116.499 0.311 -0.518 0.262 -77.707 0.002 -6.340 0.704 -16.698 0.42538 -0.065 0.002 68.197 0.364 0.055 0.895 -186.839 0.000 96.600 0.487 -23.269 0.30239 -0.005 0.863 260.493 0.252 -1.540 0.133 -273.885 0.000 -26.200 0.494 18.475 0.21640 0.040 0.078 21.973 0.888 1.091 0.295 -161.534 0.000 -1226.700 0.000 264.846 0.000
25

Table A2 Panel ARDL Estimation Results (including Education) from 40 HIPCs, 1970-2007
For each estimate the first row in parentheses are the standard errors and the second row provides the corresponding p-values for testing the statistical significance of the estimates.
VariablePooled Mean Group (PMG) Mean Group (MG)
Dynamic Fixed Effect (DFE)
Short-runError Correction -0.07 -0.34 -0.04
(0.02) (0.15) (0.02)(0.00) (0.03) (0.01)
Capital formation 81.88 13.94 16.82(39.87) (53.73) (41.54)
(0.04) (0.80) (0.69)Debt -233.18 -167.60 -98.63
(27.02) (39.96) (24.36)(0.00) (0.00) (0.00)
Trade -0.83 -0.94 -1.03(0.33) (0.33) (0.46)(0.01) (0.01) (0.03)
Education -5.23 -10.61 -10.29(4.53) (7.17) (7.60)(0.25) (0.14) (0.18)
Population ( x 106) 169.00 -368.10 -18.10(428.90) (261.90) (15.20)
(0.69) (0.16) (0.23)Constant 49.64 -49.36 11.92
(9.99) (141.02) (14.53)(0.00) (0.73) (0.41)
Long-runCapital formation 1016.842 1420.102 1945.135
(146.68) (442.78) (1003.79)(0.00) (0.00) (0.05)
Debt -95.197 -316.774 -460.706(13.06) (168.56) (271.40)
(0.00) (0.06) (0.09)Trade 2.183 -15.315 12.923
(0.64) (11.73) (8.60)(0.00) (0.19) (0.13)
Education -56.393 36.123 -105.000(13.01) (89.97) (95.34)
(0.00) (0.69) (0.27)
Population ( x 106) -4.890 -31.200 19.000(2.68) (313.70) (20.50)(0.07) (0.92) (0.35)
26

Editor, UWA Economics Discussion Papers: Sam Hak Kan Tang University of Western Australia 35 Sterling Hwy Crawley WA 6009 Australia Email: [email protected] The Economics Discussion Papers are available at: 1980 – 2002: http://ecompapers.biz.uwa.edu.au/paper/PDF%20of%20Discussion%20Papers/ Since 2001: http://ideas.repec.org/s/uwa/wpaper1.html Since 2004: http://www.business.uwa.edu.au/school/disciplines/economics
ECONOMICS DISCUSSION PAPERS 2013
DP NUMBER AUTHORS TITLE
13.01 Chen, M., Clements, K.W. and Gao, G.
THREE FACTS ABOUT WORLD METAL PRICES
13.02 Collins, J. and Richards, O. EVOLUTION, FERTILITY AND THE AGEING POPULATION
13.03 Clements, K., Genberg, H., Harberger, A., Lothian, J., Mundell, R., Sonnenschein, H. and Tolley, G.
LARRY SJAASTAD, 1934-2012
13.04 Robitaille, M.C. and Chatterjee, I. MOTHERS-IN-LAW AND SON PREFERENCE IN INDIA
13.05 Clements, K.W. and Izan, I.H.Y. REPORT ON THE 25TH PHD CONFERENCE IN ECONOMICS AND BUSINESS
13.06 Walker, A. and Tyers, R. QUANTIFYING AUSTRALIA’S “THREE SPEED” BOOM
13.07 Yu, F. and Wu, Y. PATENT EXAMINATION AND DISGUISED PROTECTION
13.08 Yu, F. and Wu, Y. PATENT CITATIONS AND KNOWLEDGE SPILLOVERS: AN ANALYSIS OF CHINESE PATENTS REGISTER IN THE US
13.09 Chatterjee, I. and Saha, B. BARGAINING DELEGATION IN MONOPOLY
13.10 Cheong, T.S. and Wu, Y. GLOBALIZATION AND REGIONAL INEQUALITY IN CHINA
13.11 Cheong, T.S. and Wu, Y. INEQUALITY AND CRIME RATES IN CHINA
13.12 Robertson, P.E. and Ye, L. ON THE EXISTENCE OF A MIDDLE INCOME TRAP
13.13 Robertson, P.E. THE GLOBAL IMPACT OF CHINA’S GROWTH
13.14 Hanaki, N., Jacquemet, N., Luchini, S., and Zylbersztejn, A.
BOUNDED RATIONALITY AND STRATEGIC UNCERTAINTY IN A SIMPLE DOMINANCE SOLVABLE GAME
13.15 Okatch, Z., Siddique, A. and Rammohan, A.
DETERMINANTS OF INCOME INEQUALITY IN BOTSWANA
13.16 Clements, K.W. and Gao, G. A MULTI-MARKET APPROACH TO MEASURING THE CYCLE
27

13.17 Chatterjee, I. and Ray, R. THE ROLE OF INSTITUTIONS IN THE INCIDENCE OF CRIME AND CORRUPTION
13.18 Fu, D. and Wu, Y. EXPORT SURVIVAL PATTERN AND DETERMINANTS OF CHINESE MANUFACTURING FIRMS
13.19 Shi, X., Wu, Y. and Zhao, D. KNOWLEDGE INTENSIVE BUSINESS SERVICES AND THEIR IMPACT ON INNOVATION IN CHINA
13.20 Tyers, R., Zhang, Y. and Cheong, T.S.
CHINA’S SAVING AND GLOBAL ECONOMIC PERFORMANCE
13.21 Collins, J., Baer, B. and Weber, E.J. POPULATION, TECHNOLOGICAL PROGRESS AND THE EVOLUTION OF INNOVATIVE POTENTIAL
13.22 Hartley, P.R. THE FUTURE OF LONG-TERM LNG CONTRACTS
13.23 Tyers, R. A SIMPLE MODEL TO STUDY GLOBAL MACROECONOMIC INTERDEPENDENCE
13.24 McLure, M. REFLECTIONS ON THE QUANTITY THEORY: PIGOU IN 1917 AND PARETO IN 1920-21
13.25 Chen, A. and Groenewold, N. REGIONAL EFFECTS OF AN EMISSIONS-REDUCTION POLICY IN CHINA: THE IMPORTANCE OF THE GOVERNMENT FINANCING METHOD
13.26 Siddique, M.A.B. TRADE RELATIONS BETWEEN AUSTRALIA AND THAILAND: 1990 TO 2011
13.27 Li, B. and Zhang, J. GOVERNMENT DEBT IN AN INTERGENERATIONAL MODEL OF ECONOMIC GROWTH, ENDOGENOUS FERTILITY, AND ELASTIC LABOR WITH AN APPLICATION TO JAPAN
13.28 Robitaille, M. and Chatterjee, I. SEX-SELECTIVE ABORTIONS AND INFANT MORTALITY IN INDIA: THE ROLE OF PARENTS’ STATED SON PREFERENCE
13.29 Ezzati, P. ANALYSIS OF VOLATILITY SPILLOVER EFFECTS: TWO-STAGE PROCEDURE BASED ON A MODIFIED GARCH-M
13.30 Robertson, P. E. DOES A FREE MARKET ECONOMY MAKE AUSTRALIA MORE OR LESS SECURE IN A GLOBALISED WORLD?
13.31 Das, S., Ghate, C. and Robertson, P. E.
REMOTENESS AND UNBALANCED GROWTH: UNDERSTANDING DIVERGENCE ACROSS INDIAN DISTRICTS
13.32 Robertson, P.E. and Sin, A. MEASURING HARD POWER: CHINA’S ECONOMIC GROWTH AND MILITARY CAPACITY
13.33 Wu, Y. TRENDS AND PROSPECTS FOR THE RENEWABLE ENERGY SECTOR IN THE EAS REGION
13.34 Yang, S., Zhao, D., Wu, Y. and Fan, J.
REGIONAL VARIATION IN CARBON EMISSION AND ITS DRIVING FORCES IN CHINA: AN INDEX DECOMPOSITION ANALYSIS
28

ECONOMICS DISCUSSION PAPERS 2014
DP NUMBER AUTHORS TITLE
14.01 Boediono, Vice President of the Republic of Indonesia
THE CHALLENGES OF POLICY MAKING IN A YOUNG DEMOCRACY: THE CASE OF INDONESIA (52ND SHANN MEMORIAL LECTURE, 2013)
14.02 Metaxas, P.E. and Weber, E.J. AN AUSTRALIAN CONTRIBUTION TO INTERNATIONAL TRADE THEORY: THE DEPENDENT ECONOMY MODEL
14.03 Fan, J., Zhao, D., Wu, Y. and Wei, J. CARBON PRICING AND ELECTRICITY MARKET REFORMS IN CHINA
14.04 McLure, M. A.C. PIGOU’S MEMBERSHIP OF THE ‘CHAMBERLAIN-BRADBURY’ COMMITTEE. PART I: THE HISTORICAL CONTEXT
14.05 McLure, M. A.C. PIGOU’S MEMBERSHIP OF THE ‘CHAMBERLAIN-BRADBURY’ COMMITTEE. PART II: ‘TRANSITIONAL’ AND ‘ONGOING’ ISSUES
14.06 King, J.E. and McLure, M. HISTORY OF THE CONCEPT OF VALUE
14.07 Williams, A. A GLOBAL INDEX OF INFORMATION AND POLITICAL TRANSPARENCY
14.08 Knight, K. A.C. PIGOU’S THE THEORY OF UNEMPLOYMENT AND ITS CORRIGENDA: THE LETTERS OF MAURICE ALLEN, ARTHUR L. BOWLEY, RICHARD KAHN AND DENNIS ROBERTSON
14.09
Cheong, T.S. and Wu, Y. THE IMPACTS OF STRUCTURAL RANSFORMATION AND INDUSTRIAL UPGRADING ON REGIONAL INEQUALITY IN CHINA
14.10 Chowdhury, M.H., Dewan, M.N.A., Quaddus, M., Naude, M. and Siddique, A.
GENDER EQUALITY AND SUSTAINABLE DEVELOPMENT WITH A FOCUS ON THE COASTAL FISHING COMMUNITY OF BANGLADESH
14.11 Bon, J. UWA DISCUSSION PAPERS IN ECONOMICS: THE FIRST 750
14.12 Finlay, K. and Magnusson, L.M. BOOTSTRAP METHODS FOR INFERENCE WITH CLUSTER-SAMPLE IV MODELS
14.13 Chen, A. and Groenewold, N. THE EFFECTS OF MACROECONOMIC SHOCKS ON THE DISTRIBUTION OF PROVINCIAL OUTPUT IN CHINA: ESTIMATES FROM A RESTRICTED VAR MODEL
14.14 Hartley, P.R. and Medlock III, K.B. THE VALLEY OF DEATH FOR NEW ENERGY TECHNOLOGIES
14.15 Hartley, P.R., Medlock III, K.B., Temzelides, T. and Zhang, X.
LOCAL EMPLOYMENT IMPACT FROM COMPETING ENERGY SOURCES: SHALE GAS VERSUS WIND GENERATION IN TEXAS
14.16 Tyers, R. and Zhang, Y. SHORT RUN EFFECTS OF THE ECONOMIC REFORM AGENDA
14.17 Clements, K.W., Si, J. and Simpson, T. UNDERSTANDING NEW RESOURCE PROJECTS
14.18 Tyers, R. SERVICE OLIGOPOLIES AND AUSTRALIA’S ECONOMY-WIDE PERFORMANCE
29

ECONOMICS DISCUSSION PAPERS 2014
DP NUMBER AUTHORS TITLE
14.19 Tyers, R. and Zhang, Y. REAL EXCHANGE RATE DETERMINATION AND THE CHINA PUZZLE
14.20 Ingram, S.R. COMMODITY PRICE CHANGES ARE CONCENTRATED AT THE END OF THE CYCLE
14.21 Cheong, T.S. and Wu, Y. CHINA'S INDUSTRIAL OUTPUT: A COUNTY-LEVEL STUDY USING A NEW FRAMEWORK OF DISTRIBUTION DYNAMICS ANALYSIS
14.22 Siddique, M.A.B., Wibowo, H. and Wu, Y.
FISCAL DECENTRALISATION AND INEQUALITY IN INDONESIA: 1999-2008
14.23 Tyers, R. ASYMMETRY IN BOOM-BUST SHOCKS: AUSTRALIAN PERFORMANCE WITH OLIGOPOLY
14.24 Arora, V., Tyers, R. and Zhang, Y. RECONSTRUCTING THE SAVINGS GLUT: THE GLOBAL IMPLICATIONS OF ASIAN EXCESS SAVING
14.25 Tyers, R. INTERNATIONAL EFFECTS OF CHINA’S RISE AND TRANSITION: NEOCLASSICAL AND KEYNESIAN PERSPECTIVES
14.26 Milton, S. and Siddique, M.A.B. TRADE CREATION AND DIVERSION UNDER THE THAILAND-AUSTRALIA FREE TRADE AGREEMENT (TAFTA)
14.27 Clements, K.W. and Li, L. VALUING RESOURCE INVESTMENTS
14.28 Tyers, R. PESSIMISM SHOCKS IN A MODEL OF GLOBAL MACROECONOMIC INTERDEPENDENCE
14.29 Iqbal, K. and Siddique, M.A.B. THE IMPACT OF CLIMATE CHANGE ON AGRICULTURAL PRODUCTIVITY: EVIDENCE FROM PANEL DATA OF BANGLADESH
14.30 Ezzati, P. MONETARY POLICY RESPONSES TO FOREIGN FINANCIAL MARKET SHOCKS: APPLICATION OF A MODIFIED OPEN-ECONOMY TAYLOR RULE
14.31 Tang, S.H.K. and Leung, C.K.Y. THE DEEP HISTORICAL ROOTS OF MACROECONOMIC VOLATILITY
14.32 Arthmar, R. and McLure, M. PIGOU, DEL VECCHIO AND SRAFFA: THE 1955 INTERNATIONAL ‘ANTONIO FELTRINELLI’ PRIZE FOR THE ECONOMIC AND SOCIAL SCIENCES
14.33 McLure, M. A-HISTORIAL ECONOMIC DYNAMICS: A BOOK REVIEW
14.34 Clements, K.W. and Gao, G. THE ROTTERDAM DEMAND MODEL HALF A CENTURY ON
30

ECONOMICS DISCUSSION PAPERS 2015
DP NUMBER
AUTHORS TITLE
15.01 Robertson, P.E. and Robitaille, M.C. THE GRAVITY OF RESOURCES AND THE TYRANNY OF DISTANCE
15.02 Tyers, R. FINANCIAL INTEGRATION AND CHINA’S GLOBAL IMPACT
15.03 Clements, K.W. and Si, J. MORE ON THE PRICE-RESPONSIVENESS OF FOOD CONSUMPTION
15.04 Tang, S.H.K. PARENTS, MIGRANT DOMESTIC WORKERS, AND CHILDREN’S SPEAKING OF A SECOND LANGUAGE: EVIDENCE FROM HONG KONG
15.05 Tyers, R. CHINA AND GLOBAL MACROECONOMIC INTERDEPENDENCE
15.06 Fan, J., Wu, Y., Guo, X., Zhao, D. and Marinova, D.
REGIONAL DISPARITY OF EMBEDDED CARBON FOOTPRINT AND ITS SOURCES IN CHINA: A CONSUMPTION PERSPECTIVE
15.07 Fan, J., Wang, S., Wu, Y., Li, J. and Zhao, D.
BUFFER EFFECT AND PRICE EFFECT OF A PERSONAL CARBON TRADING SCHEME
15.08 Neill, K. WESTERN AUSTRALIA’S DOMESTIC GAS RESERVATION POLICY THE ELEMENTAL ECONOMICS
15.09 Collins, J., Baer, B. and Weber, E.J. THE EVOLUTIONARY FOUNDATIONS OF ECONOMICS
15.10 Siddique, A., Selvanathan, E. A. and Selvanathan, S.
THE IMPACT OF EXTERNAL DEBT ON ECONOMIC GROWTH: EMPIRICAL EVIDENCE FROM HIGHLY INDEBTED POOR COUNTRIES
15.11 Wu, Y. LOCAL GOVERNMENT DEBT AND ECONOMIC GROWTH IN CHINA
15.12 Tyers, R. and Bain, I. THE GLOBAL ECONOMIC IMPLICATIONS OF FREER SKILLED MIGRATION
15.13 Chen, A. and Groenewold, N. AN INCREASE IN THE RETIREMENT AGE IN CHINA: THE REGIONAL ECONOMIC EFFECTS
31