Competitiveness, External Deficit and External Debt of … Mar… · · 2011-05-121 Volume VI |...
14
1 Volume VI | Issue7 | April 2011 Competitiveness, External Deficit and External Debt of the Greek Economy Introduction Greek economy’s over-consumption and loss of competitiveness have led, over the past decade, to large and persistent Current Account (CA) deficits and to the subsequent rapid accumulation of gross external debt. Our study examines the relationship among competitiveness, external deficits and external debt. Our analysis shows that competitiveness loss and, consequently, the deterioration of the country’s CA over the past decade, reflects four factors: (1) the increase of unit labour cost vis-à-vis Greece’s trading partners, (2) the appreciation of the Euro, especially during the first three years after its introduction (3) the low structural competitiveness of the Greek economy, which is translated into low technology content and low quality competitiveness of exports and (4) the rise of non-tradable goods’ and services’ prices vis-à-vis tradables. The first three factors affect directly the competitiveness of Greek exports in the international market. The fourth factor affects the allocation of the country’s productive resources between the sector of tradables (i.e. exportable goods and services) and the sector of non-tradables, directed towards domestic consumption. One of our main conclusions is that the competitiveness loss of the Greek economy between 2000 - 2009 is not only due to an increase in country’s wages and relative prices of exports. International organizations and the Bank of Greece estimate that during this period real appreciation of approximately 20% was accumulated. We find that 70% of this loss in price competitiveness is due to an increase in wages and relative prices in sectors of non-tradable goods and services (public sector, services for domestic consumption, constructions, etc) in comparison to wages and prices in sectors which produce exportable goods and services (industry, tourism, shipping, etc). This change of relative prices within the country was the result –but also reinforced- a relocation of productive activities and resources (capital and labour) from export-oriented sectors to sectors of services for domestic consumption, among which the public sector. The remaining 30% (i.e. approximately 6.5 percentage points of price competitiveness loss according to official estimates) is due to the increase of prices and wages in the export sector vis-à-vis the country’s trading partners. A portion of this loss in price competitiveness is due to the nominal appreciation of the Euro. Indisputably, the deterioration of the CA and the subsequent rapid increase of the country’s external debt during the past decade are to a large extent due to competitiveness loss. In order to maintain net external debt at a long-term sustainable level, Greece has to cease generating external deficits. To be precise, trade surpluses have to be made in the future so that the structural negative developments taking place in Incomes and Transfers Balances can be offset. Important among the latter the increase of interest payable on outstanding external debt. Improving the competitiveness of the Greek economy is a necessary precondition so that the external sector can create jobs to substitute positions which will be lost due to the public sector’s shrinkage in the future and, subsequently, to contribute in repaying some of the external debt. As a consequence, the country’s efforts to recoup competitiveness lost should be focused on three factors. First, reducing production cost vis-à-vis Greece’s trading partners through restraining wages and profit shares. Second, raising productivity and focusing on sectors of higher value added and with export orientation, which requires investments in production equipment and new technologies. Third, lowering relative prices (and wages) within the country in the sector of non- tradable goods and services vis-à-vis tradables, in order to create motives for firms and employees to switch into the tradable sector. Written by: Professor Dimitrios Malliaropulos Research Advisor [email protected] Dr. Tasos Anastasatos Senior Economist [email protected] DISCLAIMER This report has been issued by EFG Eurobank Ergasias S.A. (Eurobank EFG), and may not be reproduced or publicized in any manner. The information contained and the opinions expressed herein are for informative purposes only and they do not constitute a solicitation to buy or sell any securities or effect any other investment. EFG Eurobank Ergasias S.A. (Eurobank EFG), as well as its directors, officers and employees may perform for their own account, for clients or third party persons, investments concurrent or opposed to the opinions expressed in the report. This report is based on information obtained from sources believed to be reliable and all due diligence has been taken for its process. However, the data have not been verified by EFG Eurobank Ergasias S.A. (Eurobank EFG), and no warranty expressed or implicit is made as to their accuracy, complete-ness, or timeliness. All opinions and estimates are valid as of the date of the report and remain subject to change without notice. Investment decisions must be made upon investor’s individual judgement and based on own information and evaluation of undertaken risk. The investments mentioned or suggested in the report may not be suitable for certain investors depending on their investment objectives and financial condition. The aforesaid brief statements do not describe comprehensively the risks and other significant aspects relating to an investment choice. EFG Eurobank Er- gasias S.A. (Eurobank EFG), as well as its directors, officers and employees accept no liability for any loss or damage, direct or indirect that may occur from the use of this report.
Transcript of Competitiveness, External Deficit and External Debt of … Mar… · · 2011-05-121 Volume VI |...
1
Volume VI | Issue7 | April 2011
Competitiveness, External Deficit and External Debt of the Greek Economy
Introduction
Greek economy’s over-consumption and loss of competitiveness have led, over the past decade, to large and persistent Current Account (CA) deficits and to the subsequent rapid accumulation of gross external debt. Our study examines the relationship among competitiveness, external deficits and external debt.
Our analysis shows that competitiveness loss and, consequently, the deterioration of the country’s CA over the past decade, reflects four factors: (1) the increase of unit labour cost vis-à-vis Greece’s trading partners, (2) the appreciation of the Euro, especially during the first three years after its introduction (3) the low structural competitiveness of the Greek economy, which is translated into low technology content and low quality competitiveness of exports and (4) the rise of non-tradable goods’ and services’ prices vis-à-vis tradables. The first three factors affect directly the competitiveness of Greek exports in the international market. The fourth factor affects the allocation of the country’s productive resources between the sector of tradables (i.e. exportable goods and services) and the sector of non-tradables, directed towards domestic consumption.
One of our main conclusions is that the competitiveness loss of the Greek economy between 2000 - 2009 is not only due to an increase in country’s wages and relative prices of exports. International organizations and the Bank of Greece estimate that during this period real appreciation of approximately 20% was accumulated. We find that 70% of this loss in price competitiveness is due to an increase in wages and relative prices in sectors of non-tradable goods and services (public sector, services for domestic consumption, constructions, etc) in comparison to wages and prices in sectors which produce exportable goods and services (industry, tourism, shipping, etc). This change of relative prices within the country was the result –but also reinforced- a relocation of productive activities and resources (capital and labour) from export-oriented sectors to sectors of services for domestic consumption, among which the public sector. The remaining 30% (i.e. approximately 6.5 percentage points of price competitiveness loss according to official estimates) is due to the increase of prices and wages in the export sector vis-à-vis the country’s trading partners. A portion of this loss in price competitiveness is due to the nominal appreciation of the Euro.
Indisputably, the deterioration of the CA and the subsequent rapid increase of the country’s external debt during the past decade are to a large extent due to competitiveness loss. In order to maintain net external debt at a long-term sustainable level, Greece has to cease generating external deficits. To be precise, trade surpluses have to be made in the future so that the structural negative developments taking place in Incomes and Transfers Balances can be offset. Important among the latter the increase of interest payable on outstanding external debt.
Improving the competitiveness of the Greek economy is a necessary precondition so that the external sector can create jobs to substitute positions which will be lost due to the public sector’s shrinkage in the future and, subsequently, to contribute in repaying some of the external debt. As a consequence, the country’s efforts to recoup competitiveness lost should be focused on three factors. First, reducing production cost vis-à-vis Greece’s trading partners through restraining wages and profit shares. Second, raising productivity and focusing on sectors of higher value added and with export orientation, which requires investments in production equipment and new technologies. Third, lowering relative prices (and wages) within the country in the sector of non-tradable goods and services vis-à-vis tradables, in order to create motives for firms and employees to switch into the tradable sector.
Written by:
Professor Dimitrios Malliaropulos
Research Advisor [email protected]
Dr. Tasos Anastasatos Senior Economist
DISCLAIMER This report has been issued by EFG Eurobank Ergasias S.A. (Eurobank EFG), and may not be reproduced or publicized in any manner. The information contained and the opinions expressed herein are for informative purposes only and they do not constitute a solicitation to buy or sell any securities or effect any other investment. EFG Eurobank Ergasias S.A. (Eurobank EFG), as well as its directors, officers and employees may perform for their own account, for clients or third party persons, investments concurrent or opposed to the opinions expressed in the report. This report is based on information obtained from sources believed to be reliable and all due diligence has been taken for its process. However, the data have not been verified by EFG Eurobank Ergasias S.A. (Eurobank EFG), and no warranty expressed or implicit is made as to their accuracy, complete-ness, or timeliness. All opinions and estimates are valid as of the date of the report and remain subject to change without notice. Investment decisions must be made upon investor’s individual judgement and based on own information and evaluation of undertaken risk. The investments mentioned or suggested in the report may not be suitable for certain investors depending on their investment objectives and financial condition. The aforesaid brief statements do not describe comprehensively the risks and other significant aspects relating to an investment choice. EFG Eurobank Er-gasias S.A. (Eurobank EFG), as well as its directors, officers and employees accept no liability for any loss or damage, direct or indirect that may occur from the use of this report.
April 2011
2
In order for the net external debt to cease its upward trend (e.g. stabilize around 80-85% of GDP, close to the current 97.3%), the trade balance has to generate surpluses of the order of 0.5-1.5% of GDP per annum in the future, from its current deficit of 8%. If the country manages to zero its trade balance until 2014 and to generate sustainable trade surpluses of 1.5% p.a. after 2015, external debt will drop to 80% of GDP in 2040 under quite conservative assumptions on real GDP growth, interest rates and inflation. Hence, the effort will be long-term.
In order to create the necessary trade surpluses, Greece has to raise its price competitiveness by approximately 10-12% from today. This implies two things.
Firstly, the relative prices of Greek exports (industry, agriculture and tourism) have to be reduced vis-à-vis competitors in international markets. This will be achieved by keeping nominal wage increases below the sum of inflation plus productivity change, as well as a moderation in profit margins. These should be accompanied by an increase in productivity of export-oriented sectors of the economy through investments and innovation. We estimate that the competitiveness shortfall in the external sector of the economy in terms of relative prices is currently around 5.5 percentage points and can be rapidly eliminated within the next two to three years. The Euro’s trend is an imponderable factor. If the Euro is appreciated by 10% from its current (already high) level, the country’s effort necessary for restoring its competitiveness in 2000 level is approximately doubled. This holds especially because nominal appreciation hurts more countries like Greece, which do not have goods and services of recognizable brand name.
Secondly, prices and wages in non-tradable sectors have to be reduced vis-à-vis prices and wages in sectors of tradable goods and services. This means that if, for example, wages and profit margins of exportable sectors drop (jointly) by 5%, the overall reduction of wages and profit margins in sectors of non-tradables (public sector, constructions, services) has to total to 10% in order for prices and wages to return to the 2000 level. Investment in technology and productivity will help significantly so that the burden of adjustment will not fall exclusively on employees.
A part of the necessary adjustment has already been accomplished in 2010, when wages in the public sector were significantly reduced. We believe that this adjustment was not fully visible as it coincided with the VAT increase by four percentage points and the subsequent sharp increase in inflation, mainly in consumer goods and services. Given that the VAT hike was one-off and will not affect 2011 inflation, we believe that the effect of public sector’s wage cuts on competitiveness will be more pronounced in 2011-12.
Given that competitiveness is a function as much of labour cost as of productivity and pricing policies of firms, part of the adjustment should be undertaken also by companies, which should reduce their profit margins. Public sector, which is anyway
loss-making, has to reduce waste, which is already on track. As a consequence, overall adjustment in terms of competitiveness should be split into wages, productivity and profit margins.
1. Greek Current Account’s Features and Trends: A qualitative analysis2
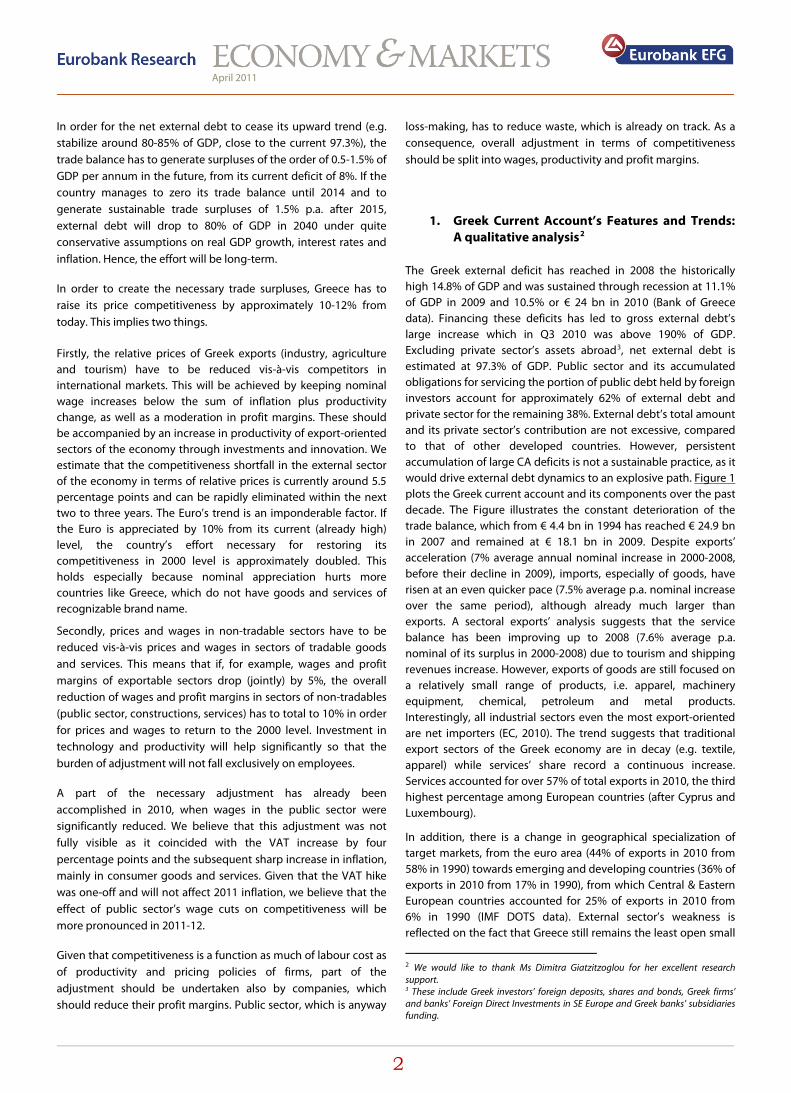
The Greek external deficit has reached in 2008 the historically high 14.8% of GDP and was sustained through recession at 11.1% of GDP in 2009 and 10.5% or € 24 bn in 2010 (Bank of Greece data). Financing these deficits has led to gross external debt’s large increase which in Q3 2010 was above 190% of GDP. Excluding private sector’s assets abroad3, net external debt is estimated at 97.3% of GDP. Public sector and its accumulated obligations for servicing the portion of public debt held by foreign investors account for approximately 62% of external debt and private sector for the remaining 38%. External debt’s total amount and its private sector’s contribution are not excessive, compared to that of other developed countries. However, persistent accumulation of large CA deficits is not a sustainable practice, as it would drive external debt dynamics to an explosive path. Figure 1
In addition, there is a change in geographical specialization of target markets, from the euro area (44% of exports in 2010 from 58% in 1990) towards emerging and developing countries (36% of exports in 2010 from 17% in 1990), from which Central & Eastern European countries accounted for 25% of exports in 2010 from 6% in 1990 (IMF DOTS data). External sector’s weakness is reflected on the fact that Greece still remains the least open small
plots the Greek current account and its components over the past decade. The Figure illustrates the constant deterioration of the trade balance, which from € 4.4 bn in 1994 has reached € 24.9 bn in 2007 and remained at € 18.1 bn in 2009. Despite exports’ acceleration (7% average annual nominal increase in 2000-2008, before their decline in 2009), imports, especially of goods, have risen at an even quicker pace (7.5% average p.a. nominal increase over the same period), although already much larger than exports. A sectoral exports’ analysis suggests that the service balance has been improving up to 2008 (7.6% average p.a. nominal of its surplus in 2000-2008) due to tourism and shipping revenues increase. However, exports of goods are still focused on a relatively small range of products, i.e. apparel, machinery equipment, chemical, petroleum and metal products. Interestingly, all industrial sectors even the most export-oriented are net importers (EC, 2010). The trend suggests that traditional export sectors of the Greek economy are in decay (e.g. textile, apparel) while services’ share record a continuous increase. Services accounted for over 57% of total exports in 2010, the third highest percentage among European countries (after Cyprus and Luxembourg).
2 We would like to thank Ms Dimitra Giatzitzoglou for her excellent research support. 3 These include Greek investors’ foreign deposits, shares and bonds, Greek firms’ and banks’ Foreign Direct Investments in SE Europe and Greek banks’ subsidiaries funding.
April 2011
3
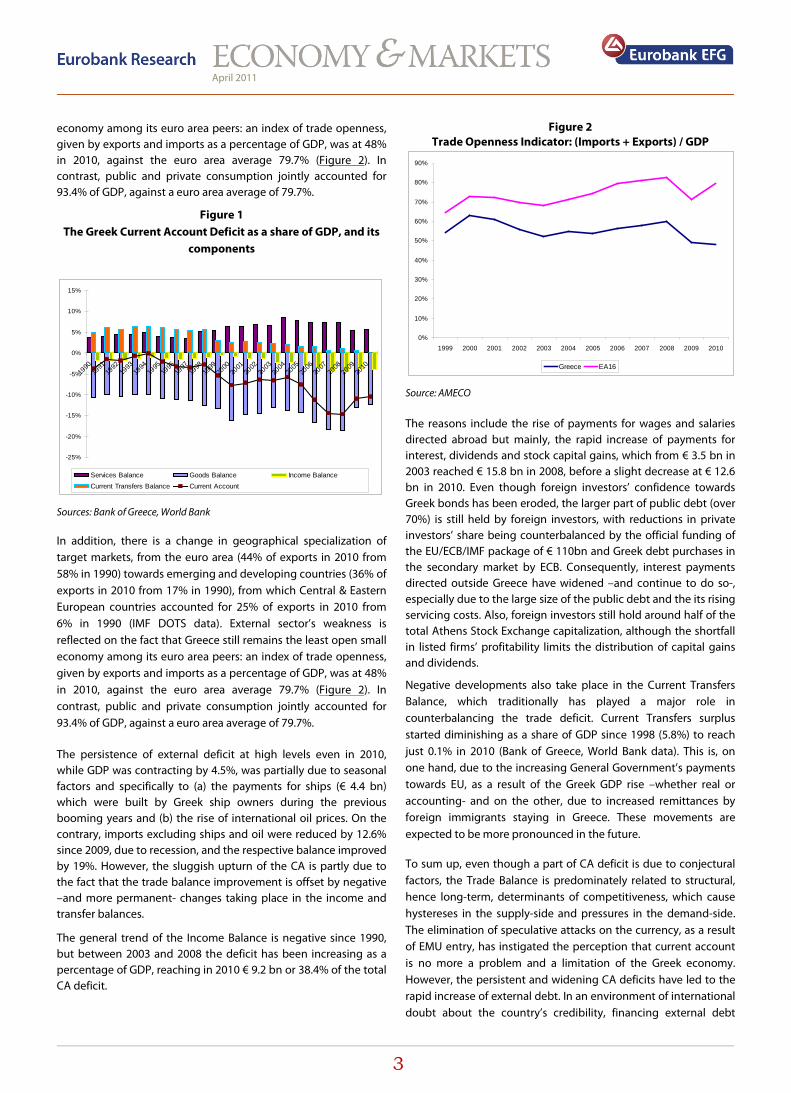
economy among its euro area peers: an index of trade openness, given by exports and imports as a percentage of GDP, was at 48% in 2010, against the euro area average 79.7% (Figure 2
Figure 1
). In contrast, public and private consumption jointly accounted for 93.4% of GDP, against a euro area average of 79.7%.
The Greek Current Account Deficit as a share of GDP, and its components
-25%
-20%
-15%
-10%
-5%
0%
5%
10%
15%
1990
1991
1992
1993
1994
1995
1996
1997
1998
1999
2000
2001
2002
2003
2004
2005
2006
2007
2008
2009
2010
Services Balance Goods Balance Income BalanceCurrent Transfers Balance Current Account
Sources: Bank of Greece, World Bank
In addition, there is a change in geographical specialization of target markets, from the euro area (44% of exports in 2010 from 58% in 1990) towards emerging and developing countries (36% of exports in 2010 from 17% in 1990), from which Central & Eastern European countries accounted for 25% of exports in 2010 from 6% in 1990 (IMF DOTS data). External sector’s weakness is reflected on the fact that Greece still remains the least open small economy among its euro area peers: an index of trade openness, given by exports and imports as a percentage of GDP, was at 48% in 2010, against the euro area average 79.7% (Figure 2
The persistence of external deficit at high levels even in 2010, while GDP was contracting by 4.5%, was partially due to seasonal factors and specifically to (a) the payments for ships (€ 4.4 bn) which were built by Greek ship owners during the previous booming years and (b) the rise of international oil prices. On the contrary, imports excluding ships and oil were reduced by 12.6% since 2009, due to recession, and the respective balance improved by 19%. However, the sluggish upturn of the CA is partly due to the fact that the trade balance improvement is offset by negative –and more permanent- changes taking place in the income and transfer balances.
). In contrast, public and private consumption jointly accounted for 93.4% of GDP, against a euro area average of 79.7%.
The general trend of the Income Balance is negative since 1990, but between 2003 and 2008 the deficit has been increasing as a percentage of GDP, reaching in 2010 € 9.2 bn or 38.4% of the total CA deficit.
Figure 2 Trade Openness Indicator: (Imports + Exports) / GDP
0%
10%
20%
30%
40%
50%
60%
70%
80%
90%
1999 2000 2001 2002 2003 2004 2005 2006 2007 2008 2009 2010
Greece EA16
Source: AMECO
The reasons include the rise of payments for wages and salaries directed abroad but mainly, the rapid increase of payments for interest, dividends and stock capital gains, which from € 3.5 bn in 2003 reached € 15.8 bn in 2008, before a slight decrease at € 12.6 bn in 2010. Even though foreign investors’ confidence towards Greek bonds has been eroded, the larger part of public debt (over 70%) is still held by foreign investors, with reductions in private investors’ share being counterbalanced by the official funding of the EU/ECB/IMF package of € 110bn and Greek debt purchases in the secondary market by ECB. Consequently, interest payments directed outside Greece have widened –and continue to do so-, especially due to the large size of the public debt and the its rising servicing costs. Also, foreign investors still hold around half of the total Athens Stock Exchange capitalization, although the shortfall in listed firms’ profitability limits the distribution of capital gains and dividends.
Negative developments also take place in the Current Transfers Balance, which traditionally has played a major role in counterbalancing the trade deficit. Current Transfers surplus started diminishing as a share of GDP since 1998 (5.8%) to reach just 0.1% in 2010 (Bank of Greece, World Bank data). This is, on one hand, due to the increasing General Government’s payments towards EU, as a result of the Greek GDP rise –whether real or accounting- and on the other, due to increased remittances by foreign immigrants staying in Greece. These movements are expected to be more pronounced in the future.
To sum up, even though a part of CA deficit is due to conjectural factors, the Trade Balance is predominately related to structural, hence long-term, determinants of competitiveness, which cause hystereses in the supply-side and pressures in the demand-side. The elimination of speculative attacks on the currency, as a result of EMU entry, has instigated the perception that current account is no more a problem and a limitation of the Greek economy. However, the persistent and widening CA deficits have led to the rapid increase of external debt. In an environment of international doubt about the country’s credibility, financing external debt

April 2011
4
became difficult and costly. The crisis may have mitigated domestic demand and imports, but the improvement is neither adequately large nor necessarily sustainable once the recession is over. In addition, generation of additional surpluses in the balance of goods and services will be required over the next years in order to counter the structural worsening of income and transfer balances, and thus to balance the current account.
2. Theoretical explanations
As an identity, the deterioration of external balance reflects the decoupling of national saving and investment. Indeed, Greece during 2000-2008 was characterised as much by increasing investment as by diminishing private saving (in fact with an increase in borrowing) and constantly negative public saving. However, a continually important portion of investment was allocated in residential building activity. The rapid expansion of consumption and the real-estate reveals that the choice of the Greek model of growth has been endogenous: the enlargement of domestic demand reflects a structural deficit in external competitiveness.
There is a host of factors that contributed to the loss of competitiveness of Greek exports. Firstly, the restrictive monetary policy which was implemented since 1994 in order to achieve the EMU entry criteria (high interest rates, restriction of the nominal depreciation of the drachma). The so-called “policy of the strong drachma” had a key contribution in achieving deflation and, along with it, the –defined as national- goal of the country’s entry into the euro area. However, it is thought that it has contributed in Greece entering the Euro with a relatively appreciated conversion rate, which was not favouring the competitiveness of Greek exports. More importantly, the economy had not carried out the structural reforms in product and labour markets which would counter the chronic problem of Greek inflation’s persistence. As a result, since the entry in the common currency, Greece maintained positive inflation differentials vis-à-vis the euro area average, usually above 1 percentage point. This was translated into a significant real appreciation against the rest of the EMU members, which, after the adoption of the common currency, could not be accommodated by a devaluation.
The erosion of the Greek competitiveness was augmented by the continuous nominal appreciation of the Euro after the early years of its creation. This trend is predominantly the result of ECB’s commitment in the objective of price stability. Greek external deficits cannot be attributed solely to –up until the debt crisis- strong Euro, as countries such as Germany, Belgium or the Netherlands systematically record external surpluses. However, the relative burden by the nominal appreciation of the currency is more important for countries like Greece, which does not have products and services of recognizable brand name. The non-recognizable products have higher price elasticity and hence, are more exchange-rate sensitive.
Greece has, indeed, been appreciated in real terms by approximately 10% more than its euro area partners during 2000-2010. This happened because the increase of productivity in Greece compared to the euro area average was over-counterbalanced by the relatively larger increase of unit labour cost4. In parallel, the imperfections in the functioning of product markets has allowed firms operating in the Greek market to pass this augmented cost into the prices, while keeping intact or even increasing their profit margins. This practice, however, had an impact on exports (EC, 2006 & 2010b)5
Another significant cause of the price competitiveness loss of the Greek economy is related to the large fiscal deficits, which decreased total saving, expanded total demand and contributed to the accumulation of positive inflation differentials vis-à-vis the rest of EMU member-states. However, even during the years in which fiscal deficits, as a percentage of GDP, were decreasing, CA deficits kept on growing. Hence, explanations related also to the private sector of the economy should be explored.
. Evidence of this is the shrinkage of the Greek exports’ share directed towards euro area. It is obvious that these trends were not sustainable.
The theoretical literature proposes three basic lines of thought. The first explanation is known as the Balassa-Samuelson hypothesis. According to that, as the productivity of the tradables sectors increase, employees in these sectors will earn higher wages. However, there are some sectors that produce non-tradable goods. These are labour-intensive and are characterized by smaller sensitivity of productivity in changes of technology. Wage increases in these sectors, however, should be in line with increases in wages in tradables sectors, otherwise employees would switch sector. As a result, as a country grows, the general level of wages –and hence, the general level of product prices- will increase. This holds specifically because real convergence raises the demand for services, which are predominantly non-tradeable. Also, given that the exchange rate corresponds fully to productivity differentials in tradables sectors, it will tend to appreciate more than the percentage justified by the average productivity of the economy. In the case of the euro area, where a common currency exists, this equals a deterioration in the terms of trade vis-à-vis the wealthier countries, i.e. a real appreciation.
In Greece, the Balassa-Samuelson effect should not be that large, given that the tradables’ sector is relatively small and hence, plays a limited role in wage determination. On the contrary, the public sector, which is a typical non-tradable activity, is a powerful wage
4 According to AMECO data, total productivity in Greece increased by 7.8% in 2002-2009, while in the euro area it decreased by 1.2% over the same period. Nevertheless, unit labour cot, which already incorporates productivity, increased during 2002-2009 by 25.3% in Greece, against 15.2% in the euro area. 5 Data on profit margins are insufficient. A proxy could be constructed, using AMECO data, as the ratio of net revenues (after labour costs, taxes and depreciations) to total value added of the firm. This index was at 26.8% in 2008 in Greece, against 7.7% in the euro area, from 27.4% and 8.4% respectively in 2002. However, this metric does not take into account the cross-country differentiation of costs which stems from factors such as public administration and bureaucracy, the institutional environment, transport, intermediaries’ gains and economic structures.
April 2011
5
setter. Also, productivity differential between tradables and non-tradables is small.
The next approach begins from the paper of Blanchard and Giavazzi (2002). These authors suggest that EMU participation has created expectations about the convergence of productivity levels to that of more developed countries and thus higher future growth. As in the Balassa-Samuelson hypothesis, the increase of the growth rate requires increase of the level of total investment, a fact which deteriorates the CA. In addition, however, higher growth leads to higher expected future income per capita. In anticipation of this income rise, rational individuals would transfer funds into the present, i.e. borrow, in order to increase their current consumption and achieve intertemporal consumption smoothing in the new –higher- levels. This puts an extra burden on the CA given that a part of consumption is related to imports.
The Monetary Union has favoured undertaking of external debt as it made its financing easier, despite the increased demand for loans, and without any divergences being punished by higher interest rates. The integration of financial markets, as well as the elimination of exchange rate risk and restrictions in capital movement, facilitated the access of less developed countries into the more liquid European markets. The rise in consumption became possible, but it was also magnified, by the decrease of the borrowing interest rates in Southern European countries as a result of EMU entry. Fagan and Gaspar (2005, 2007) used simulations to show that an interest rate decrease can cause a sizeable rise in demand and a deterioration in the CA. This effect is augmented by the wealth effect caused by an increase in firms’ value and higher wages. However, the inability of supply to adjust with the same pace to the rapid increase of demand instigates the switch of domestic production towards non-tradable goods and rise of imports. This raises wage inflation and unit labour cost in a quicker pace than the euro area average and real exchange rate appreciates, thereby raising external deficits and external debt.
Blanchard and Giavazzi (2002) suggested that the external deficit is not a threat because, to the extent that less developed countries’ productivity converges to that of the rest, future income will indeed increase and, hence, will allow the repayment of the debt accumulated due to increased current consumption. This belief was proved to be false. The inability of automatic adjustment was explained by the third approach, of Blanchard (2006), who employed the notion of wage rigidity. As in the previous approaches, the author describes that lower EMU interest rates and expectations for higher future incomes have led to an increase in consumption and external deficits. Internal demand, stimulated also by an expansionary fiscal policy, pushed wages upwards, as unemployment was falling. The rise of the unit labour cost hit competitiveness, further aggravating the CA. While, however, in Portugal the expected increase in labour productivity did not materialize, wages kept on growing with rates higher than those of the EMU. This increased the demand for imports and undermined competitiveness. Likewise, in Greece,
productivity increased but, as mentioned, nominal wages increased even faster.
Blanchard (2006) attributes this fact to the presence of rigidities in wages. If there is rigidity in the real wage, the labour market does not clear and the nominal wage keeps on rising even in the presence of high unemployment rate. If there is downward rigidity in the nominal wage, wages correspond to price and unemployment changes (and the reverse) with large lags or not at all. Under those circumstances, the CA may continue to deteriorate explosively for a significant period after the competitiveness loss is confirmed.
The absence of an automatic adjustment of the external imbalance is related to two more factors: a) the limited transparency in the flow of macroeconomic information, on the basis of which loans were allotted within Europe; this was especially true in the case of Greece b) the fact that the common monetary policy of the ECB sets average targets, which suit the euro area as a whole and not the condition of each individual member. Hence, its stance over the past years may have been expansionary, while the Greek economy displayed symptoms of overheating, and was not affected by the Greek external deficit, given that euro area’s overall trade balance was not at deficit.
3. Competitiveness of the Greek economy
It is a common view among economists and analysts that price competitiveness of the Greek economy has deteriorated significantly since EMU entry due to high wage and price inflation, which made Greek exports more expensive both in terms of prices and unit labour costs (ULCs) relative to trading partners. Although estimates of this deterioration between 2000 and 2009 vary widely, the average estimate ranges between 18-20%.
Given that Greece cannot devalue its currency, the country faces the need for a substantial “internal devaluation”, i.e. an outright decline in wages and prices to 2000 levels in order to restore competitiveness. In a previous study (Malliaropulos, 2010) we have shown that, between 2000 and 2009, competitiveness of the Greek export sector has declined by 10% in terms of relative unit labour costs and by 6.5% in terms of relative prices, considerably less than most common REER (Real Effective Exchange Rate) indices suggest. There are two main differences between our competitiveness index and common REER indices. First, our index measures the competitiveness of Greek exports, in contrast to common REER indices that measure competitiveness of the “aggregate economy”. Second, we measure competitiveness of the Greek service sector against a different set of countries than for goods exports, reflecting the fact that Greece’s competitors in tourism –its main export sector– are different from Greece’s trading partners in manufacturing. The main conclusion of that study was that the “internal devaluation” needed in order for Greece to return to a growth trajectory is not as large as common measures of competitiveness suggest.

April 2011
6
Our estimate of the deterioration of the competitiveness of Greek exports (6.5-10%) is in line with the estimate of international institutions that the loss in competitiveness of the Greek economy over the period 2000-2009 is much bigger (18-20%). This is because the REER of the total economy can be defined as the product of the relative price of tradable goods and services in international markets (“external exchange rate”, REERT) and the relative price of non-tradable goods and services (“internal exchange rate” REERΝΤ
REER = REER
):
T x REER
EP/P* = (EP
NT
T/P*T) x (P/PT)/( P*/P*T
where Ε is the effective nominal exchange rate of the euro, P is the domestic price index (GDP deflator or Consumer Price Index), P* is the weighted price index of trading partners and P
) (1)
T (P*T
International institutions measure the competitiveness of the total economy (the REER), while Malliaropulos (2010) measured the competitiveness of Greek exports (the REER
) the price index of tradable goods and services in Greece (trading partners). As tradable we define goods and services that the country exports, while as non-tradable we define goods and services that are produced for domestic consumption (public services, construction, retail trade, personal services, etc).
T). The difference is the relative price of non-tradable goods and services (the “internal exchange rate”, REERNT). This difference has important implications for the type of adjustment needed in order for Greece to regain the loss in competitiveness of the last 10 years. If, for example, the loss in competitiveness is exclusively due to Greek exporters, the adjustment requires a generalized deflation, i.e. an outright decline in wages and prices in Greece relative to its competitors in international markets. If, however, the loss in competitiveness is mainly due to an increase in the relative prices of non-tradable goods and services, then the adjustment requires a reduction in wages and prices of non-tradable goods and services relative to tradables, i.e. a change of relative
4. Competitiveness of Greek exports
prices within the country and not a generalized deflation in all sectors. The following analysis shows that the problem of competitiveness of the Greek economy is mainly due to the inflation of non-tradables relative to tradables (which, according to our estimates, accounts for 2/3 of the total loss in competitiveness) and, secondly, the deterioration in the competitiveness of Greek exporters relative to trading partners (which accounts for the remaining 1/3). Consequently, the restoration of equilibrium in the external sector requires policies which, over time, provide incentives to producers and workers to shift from the production of non-tradables to sectors with strong export orientation or to sectors whose products can substitute for the country’s imports. This will increase the production capacity of potentially exportable goods and services. To the extent that the average production cost of these goods and services is not greater than prevailing international prices, their sale in international markets is potentially profitable and, thus, sustainable. Given that at the same time producer prices of tradable goods and services will be on a declining path (due to lower ULC growth), this condition is increasingly likely to be met.
In order to measure competitiveness of the Greek export sector in terms of relative wages and prices, we construct sectoral competitiveness indices for the industrial, the service and the agricultural sector. In turn, we weight the individual indices with the share of each sector in total Greek exports to obtain a competitiveness index of total exports.6 It should be noted that we estimated competitiveness of the Greek service sector against Greece’s major competitors in tourism (six Mediterranean countries) and not against Greece’s trading partners in manufacturing and agriculture.7 We use annual data on ULCs and prices from the Ameco database which are comparable across countries and sectors.
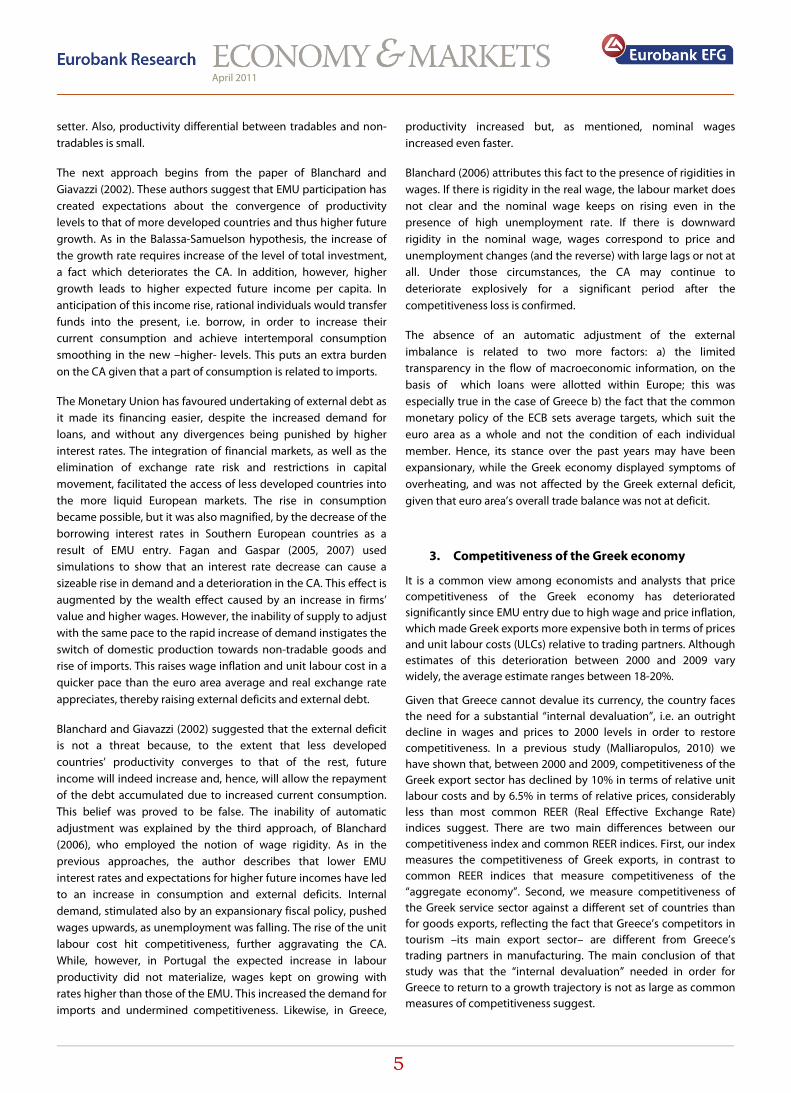
Figure 3
The loss in competitiveness of Greek exports during the first two to four years of EMU entry is attributed to a large extent to the appreciation of the euro. According to data from the European Central Bank (ECB), the euro appreciated from December 2000 to December 2003 by 17% against Euro area’s 20 major trading partners and by a total of 20% from 2000 to end-2010.
depicts the evolution of two competitiveness indices of Greek exports from 2000 to 2010. The first index (REER prices) measures competitiveness of Greek exports based on relative prices. The second index (REER wages) measures competitiveness of Greek exports based on ULCs. An increase in the indices suggests loss in competitiveness of Greek exports. Our indices suggest that over the period 2000-2010, competitiveness of Greek exports has declined by 5.5% in terms of prices and by 7.5% in terms of ULCs. In particular, it appears that ULCs in Greece have increased strongly relative to Greece’s trading partners during the first three years of EMU participation (2001-2003) and have been on a declining trend since 2004. Competitiveness of Greek exports in terms of relative prices has declined by 6% during the first two years of EMU participation and has remained relatively unchanged after 2002.
Since a large share of Greek exports (approximately 55% of exports of manufacturing and agricultural products) is directed outside the Euro area, the appreciation of the euro weighs on export competitiveness both in terms of prices and in terms of relative ULCs.
Figure 4 depicts the evolution of the real effective exchange rate for the Greek economy against 36 trading partners based on the ULCs (REER) and the nominal effective exchange rate for the euro against the same trading partners (ΝΕΕR). Note that REER=NEER*(ULCGR / ULCROW), where ULCGR is the ULC in Greece and ULCROW
is the ULC in the 36 trading partners.
6 For more details see Malliaropulos (2010). 7 Common competitiveness indices compute the competitiveness of the service sector comparing the ULCs (or the prices) in the Greek service sector with the ULCs (or the prices) against the same set of countries as for manufacturing exports, as they use the same weights. Since Greece’s main competitors in the service sector, such as tourism, are different from its competitors in exports of manufacturing goods, common indicators of competitiveness are likely biased.
April 2011
7
Figure 3 Export competitiveness (REERT
95
100
105
110
115
120
2000 2001 2002 2003 2004 2005 2006 2007 2008 2009 2010
REER prices REER wages
) (Greece relative to main trading partners)
Source: Eurostat and Eurobank EFG Research calculations.
As a result, if relative ULCs (in local currency) remain unchanged, the two indices will move together, i.e. the deterioration in competitiveness is due to euro’s appreciation. The common path of the two indices over the period 2000-2004 confirms that the loss in competitiveness during these years was mainly due to the appreciation of the euro. After EMU entry, Greek exporters apparently have not managed to adjust timely to the challenges of a hard currency, such as the euro and, consequently, lost competitiveness and market share at the very beginning of EMU entry.
The deviation of the real exchange rate of the euro from the nominal one after 2004 is attributed both to an increase in labour costs in Greece relative to its trading partners and an increase in the relative prices of non-tradable goods and services within the country.8
Figure 4
Below we will attempt to estimate the latter factor.
Real exchange rate based on the relative ULC (REER) and nominal exchange rate for the euro (NEER)
(Greece relative to 36 major trading partners)
95
100
105
110
115
120
125
2000 2001 2002 2003 2004 2005 2006 2007 2008 2009 2010
REER NEER
Source: Eurostat, Ameco.
8 This real appreciation hurt the competitiveness of Greek goods and services, not only within the Euro area, but also outside the region, as far as Euro area countries compete each other in third markets.
5. The relative price of non-tradable goods and services
As explained above, the deterioration in the current account deficit by about eight percentage points of GDP over the last decade is not only due to the loss in international competitiveness of Greek exports, but also due to the transfer of productive resources and domestic demand from the tradable to the non-tradable sector of goods and services (government sector, construction sector, services for domestic consumption, etc.).
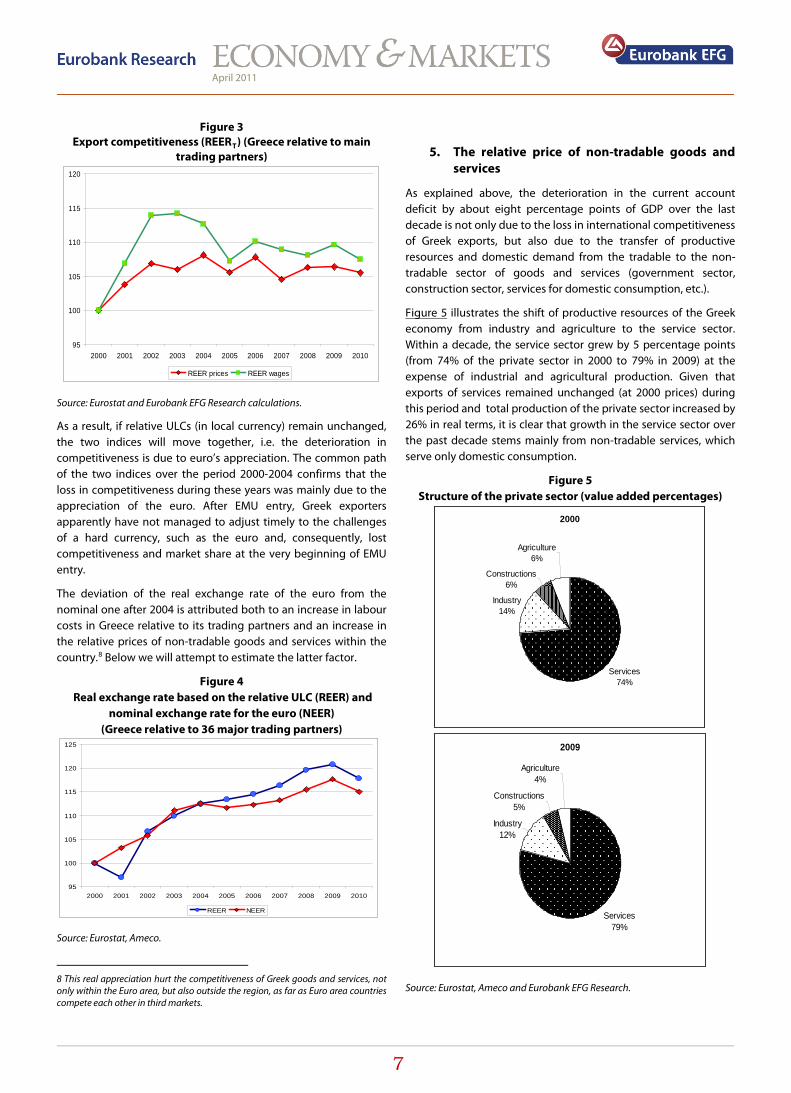
Figure 5
Figure 5
illustrates the shift of productive resources of the Greek economy from industry and agriculture to the service sector. Within a decade, the service sector grew by 5 percentage points (from 74% of the private sector in 2000 to 79% in 2009) at the expense of industrial and agricultural production. Given that exports of services remained unchanged (at 2000 prices) during this period and total production of the private sector increased by 26% in real terms, it is clear that growth in the service sector over the past decade stems mainly from non-tradable services, which serve only domestic consumption.
Structure of the private sector (value added percentages)
2000
Agriculture6%
Constructions6%
Industry14%
Services74%
2009
Services79%
Industry12%
Constructions5%
Agriculture4%
Source: Eurostat, Ameco and Eurobank EFG Research.
April 2011
8
According to economic theory, the allocation of productive resources and domestic demand between tradable and non tradable goods and services is determined by their relative price.9
Assessing the rate of deterioration in international competitiveness of the Greek economy over the last decade, which is attributed to the rising relative price of non-tradables, is not easy. The construction of an index of relative prices between tradable and non tradable goods and services is impeded by the fact that for many non-tradable goods and services (e.g. government services) there are no market prices. Nevertheless, we can estimate an indirect indicator of relative prices from the competitiveness indicators of the total economy and the export sector, since the real exchange rate of the total economy (REER) -according to equation (1)- can be defined as the product of the relative price of tradable goods and services in international markets (REER
From the supply side, an increase in the price of non-tradable relative to the price of tradable goods and services leads to a transfer of capital and labour force to the non-tradable sector. An effect of relative prices exists on the demand side as well. In particular, the relative decrease in the price of tradables makes consumption of imported goods more attractive, leading to a deterioration in the current account balance. In addition, there is also an income effect. Demand for services, which have high income elasticity, increase with higher per capita income. Since, however, services are predominantly non-internationally tradable, the increase in demand triggers the depletion of good quality human resources. As lower quality human resources are used for services, productivity drops, the level of prices increases and competitiveness suffers.
T) and the relative price of non-tradable goods and services ("internal exchange rate" REERΝΤ
If we weight the sectoral competitiveness indicators with the shares of the export sectors, we obtain an indicator of the relative price of tradable goods and services in international markets (REER
)
T). We can use the index of the European Central Bank based on relative prices as an indicator of the real exchange rate of the total economy (REER).10
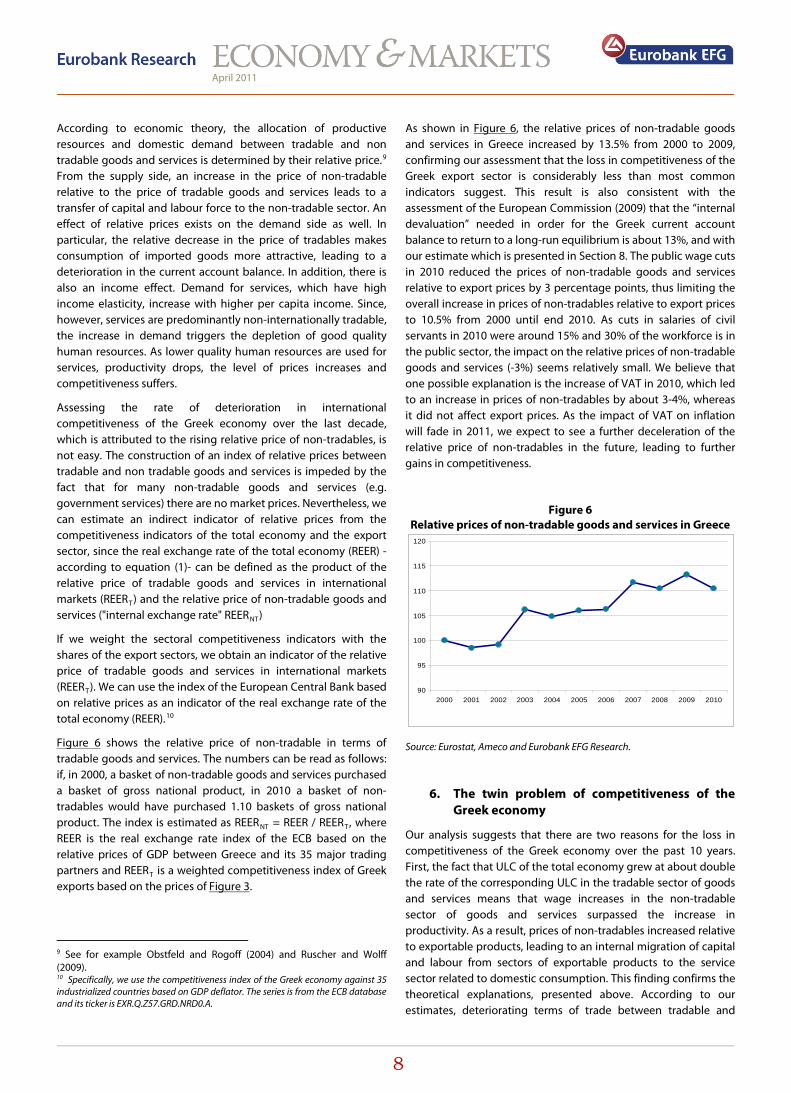
Figure 6 shows the relative price of non-tradable in terms of tradable goods and services. The numbers can be read as follows: if, in 2000, a basket of non-tradable goods and services purchased a basket of gross national product, in 2010 a basket of non-tradables would have purchased 1.10 baskets of gross national product. The index is estimated as REERNT = REER / REERT, where REER is the real exchange rate index of the ECB based on the relative prices of GDP between Greece and its 35 major trading partners and REERT is a weighted competitiveness index of Greek exports based on the prices of Figure 3
9 See for example Obstfeld and Rogoff (2004) and Ruscher and Wolff (2009).
.
10 Specifically, we use the competitiveness index of the Greek economy against 35 industrialized countries based on GDP deflator. The series is from the ECB database and its ticker is EXR.Q.Z57.GRD.NRD0.A.
As shown in Figure 6
, the relative prices of non-tradable goods and services in Greece increased by 13.5% from 2000 to 2009, confirming our assessment that the loss in competitiveness of the Greek export sector is considerably less than most common indicators suggest. This result is also consistent with the assessment of the European Commission (2009) that the “internal devaluation” needed in order for the Greek current account balance to return to a long-run equilibrium is about 13%, and with our estimate which is presented in Section 8. The public wage cuts in 2010 reduced the prices of non-tradable goods and services relative to export prices by 3 percentage points, thus limiting the overall increase in prices of non-tradables relative to export prices to 10.5% from 2000 until end 2010. As cuts in salaries of civil servants in 2010 were around 15% and 30% of the workforce is in the public sector, the impact on the relative prices of non-tradable goods and services (-3%) seems relatively small. We believe that one possible explanation is the increase of VAT in 2010, which led to an increase in prices of non-tradables by about 3-4%, whereas it did not affect export prices. As the impact of VAT on inflation will fade in 2011, we expect to see a further deceleration of the relative price of non-tradables in the future, leading to further gains in competitiveness.
Figure 6 Relative prices of non-tradable goods and services in Greece
90
95
100
105
110
115
120
2000 2001 2002 2003 2004 2005 2006 2007 2008 2009 2010
Source: Eurostat, Ameco and Eurobank EFG Research.
6. The twin problem of competitiveness of the Greek economy
Our analysis suggests that there are two reasons for the loss in competitiveness of the Greek economy over the past 10 years. First, the fact that ULC of the total economy grew at about double the rate of the corresponding ULC in the tradable sector of goods and services means that wage increases in the non-tradable sector of goods and services surpassed the increase in productivity. As a result, prices of non-tradables increased relative to exportable products, leading to an internal migration of capital and labour from sectors of exportable products to the service sector related to domestic consumption. This finding confirms the theoretical explanations, presented above. According to our estimates, deteriorating terms of trade between tradable and
April 2011
9
non-tradable goods and services explains 70% of the total loss in competitiveness of the Greek economy over the past 10 years.
Secondly, the strong appreciation of the euro during the first years after its birth, in combination with higher growth rates of labour costs relative to productivity, led to a loss in export competitiveness relative to the country’s trading partners. This factor explains 30% of the loss in aggregate competitiveness of the Greek economy.
Figure 7 shows the path of the total competitiveness index (REER) of the total economy and the export competitiveness index (REER tradables). For the competitiveness index of the total economy we use the ECB index based on GDP deflators, as in Figure 4.11
While the export competitiveness in terms of relative prices fell by 5.5%, the overall competitiveness of the economy fell by 16.5% by 2010. The difference is exactly the increase in prices of non-tradable over tradable goods and services by 11%. As we have already mentioned, the gap between the prices of non-tradables and tradables has narrowed by 3 percentage points in 2010. If the gap continues to narrow at the same pace in the future, it will take another four years for total competitiveness of the Greek economy to return to 2000 levels.
Figure 7 Total competitiveness of the economy and export
competitiveness in terms of relative prices
95
100
105
110
115
120
125
2000 2001 2002 2003 2004 2005 2006 2007 2008 2009 2010
REER REER tradables
Source: ECB, Eurostat, Ameco and Eurobank EFG Research
7. External debt Sustainability
Figure 8 presents some scenarios for the dynamics of the net external debt (net investment position of the country, bs
) as a percentage of GDP for years to come. The evolution of external debt can be expressed as:
1111 )( ++++ +−−+= ttttttt cabgrbb π
Where ca is the balance (deficit/surplus) of CA/GDP for each year, r the mean nominal interest rate of the external debt (for
11 The picture does not change if we use the Eurostat index from the Ameco database.
simplification assumed equal for bid and ask), gt
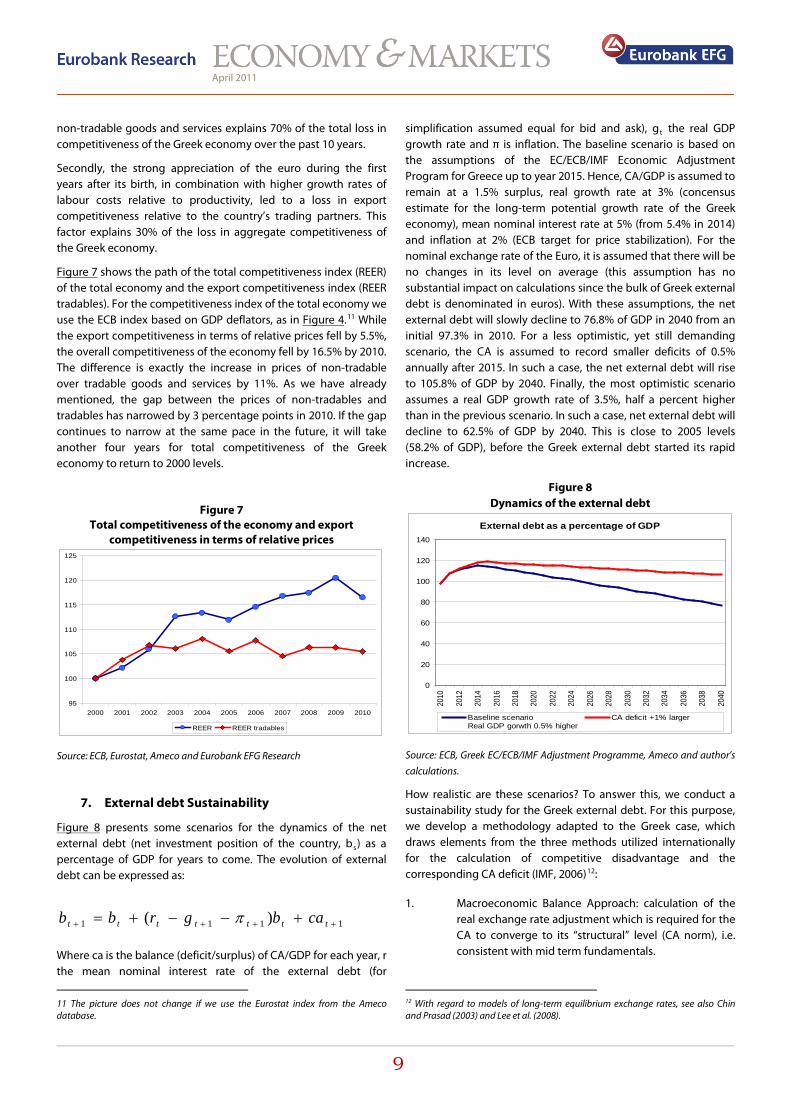
Figure 8
the real GDP growth rate and π is inflation. The baseline scenario is based on the assumptions of the EC/ECB/IMF Economic Adjustment Program for Greece up to year 2015. Hence, CA/GDP is assumed to remain at a 1.5% surplus, real growth rate at 3% (concensus estimate for the long-term potential growth rate of the Greek economy), mean nominal interest rate at 5% (from 5.4% in 2014) and inflation at 2% (ECB target for price stabilization). For the nominal exchange rate of the Euro, it is assumed that there will be no changes in its level on average (this assumption has no substantial impact on calculations since the bulk of Greek external debt is denominated in euros). With these assumptions, the net external debt will slowly decline to 76.8% of GDP in 2040 from an initial 97.3% in 2010. For a less optimistic, yet still demanding scenario, the CA is assumed to record smaller deficits of 0.5% annually after 2015. In such a case, the net external debt will rise to 105.8% of GDP by 2040. Finally, the most optimistic scenario assumes a real GDP growth rate of 3.5%, half a percent higher than in the previous scenario. In such a case, net external debt will decline to 62.5% of GDP by 2040. This is close to 2005 levels (58.2% of GDP), before the Greek external debt started its rapid increase.
Dynamics of the external debt
External debt as a percentage of GDP
0
20
40
60
80
100
120
140
2010
2012
2014
2016
2018
2020
2022
2024
2026
2028
2030
2032
2034
2036
2038
2040
Baseline scenario CA deficit +1% largerReal GDP gorwth 0.5% higher
Source: ECB, Greek EC/ECB/IMF Adjustment Programme, Ameco and author’s calculations.
How realistic are these scenarios? To answer this, we conduct a sustainability study for the Greek external debt. For this purpose, we develop a methodology adapted to the Greek case, which draws elements from the three methods utilized internationally for the calculation of competitive disadvantage and the corresponding CA deficit (IMF, 2006)12
1. Macroeconomic Balance Approach: calculation of the real exchange rate adjustment which is required for the CA to converge to its “structural” level (CA norm), i.e. consistent with mid term fundamentals.
:
12 With regard to models of long-term equilibrium exchange rates, see also Chin and Prasad (2003) and Lee et al. (2008).
April 2011
10
2. Equilibrium Real Exchange Rate Approach: calculation of the real exchange rate which is consistent with fundamentals (external debt, terms of trade, productivity differential between tradables and non-tradables)
3. External Sustainability Approach: calculation of the level of CA/GDP which stabilizes external debt at a specific percentage of GDP.
First, we calibrate the CA norm by subtracting two factors of seasonal nature from the total trade deficit (of the balance of goods and services, 7.3% of GDP) or the CA deficit (10.5%) of 2010:
(a) Ship purchases: the ships balance was around zero till 2004, while in 2010 it represented 15.1% of the total CA deficit, or 1.6% of GDP13
(b) The deviation of the average real price of oil for 2010 (79.6$ per barrel for Brendt) from its mean value throughout the entire time series available (1983 – 2009, $30.84). This is equivalent to say that the balance of fuels will continue in a negative value but at a ratio consistent with its long term trend. In 2010, fuels contributed 35.9% of the total CA deficit with the real price of oil being 158.2% above its long term average. Therefore, the seasonal component is 22% of CA deficit, or 2.3% of GDP.
.
Hence, the remaining trade deficit for 2010 is equal to 3.4% of GDP (7.3% -1.6% - 2.3%). As for CA, the remaining deficit is 6.6% of GDP.
The level of trade deficit, tbs
, which ensures external sustainability, is derived from a variation of the previous formula as:
ss bg
gtbπ
π++
+=
1
where bs
With these assumptions, the sustainability condition dictates the generation of surpluses of 0.5% of GDP, i.e. a 3.9% of GDP correction relative to the 2010 Trade Balance, or 7.1% of GDP
the reference rate to which the real external debt as a percentage of GDP will stabilize. However, the theoretical literature does not provide a theoretically consistent estimation of which level of the external debt should be considered to be sustainable. Therefore, we assume that the objective is to stabilize b to pre-crisis levels (85.8% of GDP in 2009 for Greece). As for long term g and π, the assumptions of the MoU for nominal growth rate after 2020 are used, hence g+π =4,8% (3% real growth rate, 1.8% inflation), taking into account that adjustments will be underway in previous years.
13 The data management of the trade on oil and ships in the national accounts system is neither too familiar nor too clear. Hence, the relevant calculations of the BoG are approximations.
correction to the CA respectively. This must be achieved by adjustments of competitiveness and domestic demand.
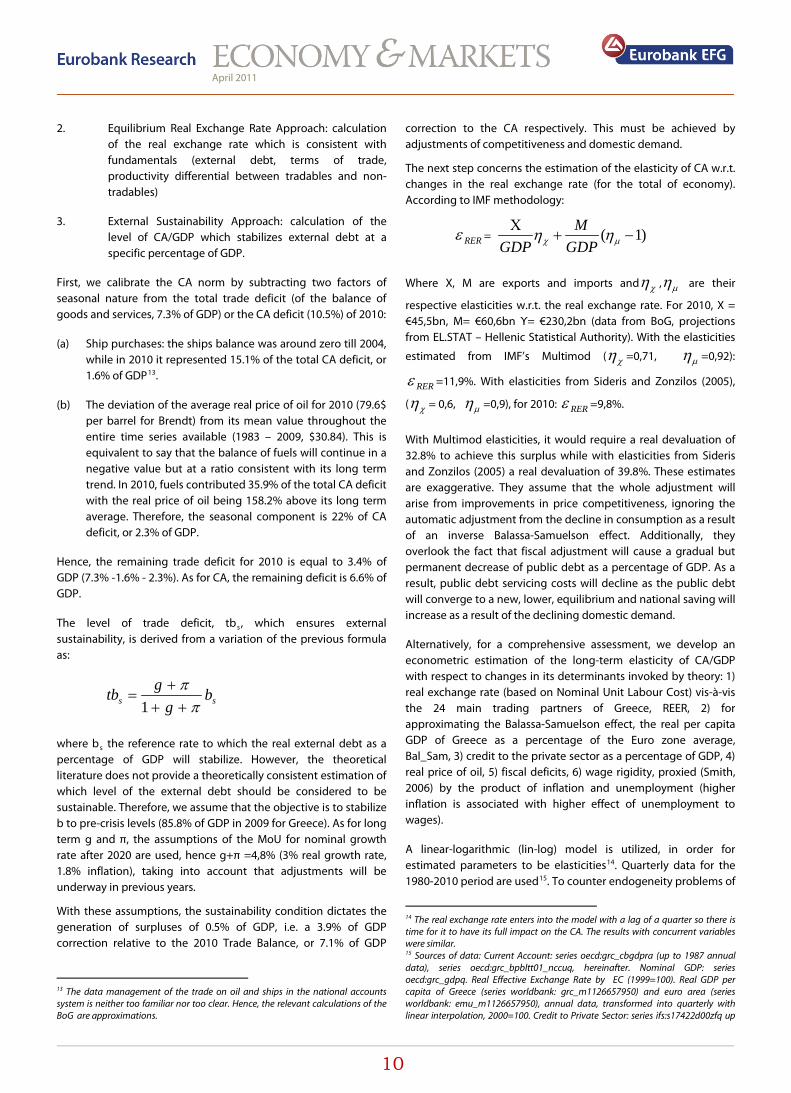
The next step concerns the estimation of the elasticity of CA w.r.t. changes in the real exchange rate (for the total of economy). According to IMF methodology:
RERε = )1( −+Χ
µχ ηηGDP
MGDP
Where X, M are exports and imports and χη , µη are their
respective elasticities w.r.t. the real exchange rate. For 2010, X = €45,5bn, M= €60,6bn Υ= €230,2bn (data from BoG, projections from EL.STAT – Hellenic Statistical Authority). With the elasticities
estimated from IMF’s Multimod ( χη =0,71, µη =0,92):
RERε =11,9%. With elasticities from Sideris and Zonzilos (2005),
( χη = 0,6, µη =0,9), for 2010: RERε =9,8%.
With Multimod elasticities, it would require a real devaluation of 32.8% to achieve this surplus while with elasticities from Sideris and Zonzilos (2005) a real devaluation of 39.8%. These estimates are exaggerative. They assume that the whole adjustment will arise from improvements in price competitiveness, ignoring the automatic adjustment from the decline in consumption as a result of an inverse Balassa-Samuelson effect. Additionally, they overlook the fact that fiscal adjustment will cause a gradual but permanent decrease of public debt as a percentage of GDP. As a result, public debt servicing costs will decline as the public debt will converge to a new, lower, equilibrium and national saving will increase as a result of the declining domestic demand.
Alternatively, for a comprehensive assessment, we develop an econometric estimation of the long-term elasticity of CA/GDP with respect to changes in its determinants invoked by theory: 1) real exchange rate (based on Nominal Unit Labour Cost) vis-à-vis the 24 main trading partners of Greece, REER, 2) for approximating the Balassa-Samuelson effect, the real per capita GDP of Greece as a percentage of the Euro zone average, Bal_Sam, 3) credit to the private sector as a percentage of GDP, 4) real price of oil, 5) fiscal deficits, 6) wage rigidity, proxied (Smith, 2006) by the product of inflation and unemployment (higher inflation is associated with higher effect of unemployment to wages).
A linear-logarithmic (lin-log) model is utilized, in order for estimated parameters to be elasticities14. Quarterly data for the 1980-2010 period are used15
14 The real exchange rate enters into the model with a lag of a quarter so there is time for it to have its full impact on the CA. The results with concurrent variables were similar.
. To counter endogeneity problems of
15 Sources of data: Current Account: series oecd:grc_cbgdpra (up to 1987 annual data), series oecd:grc_bpbltt01_nccuq, hereinafter. Nominal GDP: series oecd:grc_gdpq. Real Effective Exchange Rate by EC (1999=100). Real GDP per capita of Greece (series worldbank: grc_m1126657950) and euro area (series worldbank: emu_m1126657950), annual data, transformed into quarterly with linear interpolation, 2000=100. Credit to Private Sector: series ifs:s17422d00zfq up
April 2011
11
the explanatory variables that characterize reduced form estimations, the 2-stages least squares – TSLS method is used with the 1st lag of each variable (2nd for REER) as the instrumental variable16
Results have showed that CA deterioration is positively and strongly correlated with the appreciation of the real exchange rate, the convergence of per capita incomes and credit expansion to the private sector. Positive correlation is also evident in oil price increases, fiscal deficits and labour market rigidity, although these findings show a higher sensitivity of their statistical significance. However, multicollinearity among explanatory variables and low quality of primary data affects statistical significance. Therefore, we present the results of a more parsimonious model which focuses on the two most important variables, the real exchange rate and the Balassa-Samuelson effect [standard errors in brackets, (*) stands for statistical significance at the 1% level]
.
CA/GDP = 0,924 – 0,163 ln(REER) * – 0,389 (Bal_Sam)*
(0,16) (0,038) (0.097)
Model test F(prob) = 32.13 (.00)
According to Ameco projections, the 2012 per capita income of Greece in Purchasing Power Parity terms will be 82% of the Euro zone equivalent, against 86.9% in 2010. With a 38.9% elasticity of the Balassa-Samuelson effect, this will lower the trade deficit by 1,9pp of GDP. Hence, a trade deficit of 2% of GDP remains to be corrected via internal devaluation. With the estimated elasticity of 16.3%, this necessitates a real devaluation is 12.3%.17
These results agree with estimates on the total size of required adjustment that accrue from our abovementioned analysis on relative prices of internationally tradable and non-tradable products and services, as well as with estimates of Malliaropulos (2010). The results confirm and update previous estimates (Anastasatos, 2008).
18
to 2000 with conversion in euro and for sequent years series ifs:s17422d0uzwq. Real oil brendt price: series econwin:com20020, monthly data average. Inflation: series oecd:grc_cpiq, 4th differences of quarterly data to eliminate seasonality (2000=100). Unemployment Rate: series oecd:grc_unrtsutt_stq. Fiscal Deficit: series oecd:grc_nlgqa (annual data up to 1999).
This agreement lends support to the conclusion that competitiveness losses are smaller than previous estimates suggested. The real economic policy question is the degree to which this adjustment will be accomplished via an improvement in the price competitiveness of tradables, a relocation of resources from non-tradables or the enhancement of
16 Cochrane-Orcutt method to address autocorrelation, White covariance matrix for standard errors robust to heteroskedasticity, CUSUM and CUSUMSQ tests for the intertemporal stability of the estimated coefficients. Although the time-series utilized are long and incorporate many structural breaks, they can be assumed to be asymptotically stationary. 17 In order to ensure the sustainability of the entire CA, the Income and Current Transfers Balances should be adjusted in a way analogous to the Trade Balance. 18 Qualitative comparable results had been reached by Brissimis et al (2010) afterwards.
the tradables’ quality competitiveness (enhancing of technological content and value added of exports).
8. Quality Competitiveness
In the explanations analyzed above, the notion of competitiveness refers to unit labour cost or prices vis-à-vis the trading partners / competitors in international markets. This definition ignores significant structural factors that affect competitiveness. In developed economies, competitiveness is not based mainly on the pursue of cost minimization but on factors relevant to innovation, high technology, production quality and the creation of recognizable brand names. These factors allow the production of goods and services of high value added and reputation of quality. These can create markets with features of monopolistic competition, i.e. can be sold in higher prices than similar standardized products of lower-cost countries without loosing large market shares. This quality strategy allows countries with high labour cost or even with a persistent exchange rate appreciation to record CA surpluses.
The Greek economy continues to lean towards low-tech sectors (Gibson, 2010). Respectively, it exports goods and services of low-tech content and quality and hence, of low value (Felipe & Kumar, 2011). These are no longer competitive in terms of minimum cost and lose market shares. The exports of “high-tech” goods (mostly chemicals, electrical apparatus, office and telecommunications equipment) have been doubled over the past years, reaching 10% of total goods’ exports. However, a large portion of these exports regards the assembling of imported intermediary goods and their re-exportation in the Balkans. As these products do not incorporate sufficient domestic know-how, the Greek value added is relatively small and its effect on the CA limited. Also, intra-industry trade and cross-sectional investment (by firms of the same sector internationally) remain in low levels.
In the medium to long term, switch of the Greek economy towards goods and services of higher quality and technologic innovation is the only way forward. On one hand, the global demand for these products rises at a quicker pace and is more inelastic than that of lower-tech products. On the other, efforts to constantly reducing labour cost are ineffective, as there will always be developing countries with lower labour cost.
The accumulation of technology and ultimately, the economic growth depend crucially on the quality of institutions. Acemoglu et al (2001), among others, have shown the importance of factors such as law compliance, level of bureaucracy, corruption, structure of property rights -including intellectual property- and ensuring the proper functioning of markets. International organizations (World Bank, World Economic Forum, International Institute For Management Development) measure total competitiveness with the use of indicators which take into account such aspects as a friendly business environment, the
April 2011
12
quality of infrastructure, education and public administration. It is indicative that all EA-16 countries with CA deficits have low rankings in these measures, contrary to those with surpluses. Especially the low ranking of Greece19
The extent of the problem, however, also gives a measure of improvement that can take place if symptoms are addressed. A positive factor is that 30% of firms in Greece export part of their production, a percentage larger compared to that of the rest of the euro area (EC, 2010). Hence, once various obstacles are lifted, exports can recoup more quickly, since distribution channels and the knowledge of the markets already exist. The Adjustment Program dictates the downsizing of the public sector. This is a crucial structural reform as a large and ineffective state crowds out private investment and exports, rises the borrowing cost and contributes to the external debt. Horizontal interventions by the Program systematically address, for the first time, chronic deficiencies, such as the high in terms of time and money cost of starting a business, the creation of a level playing field, the excessively restrictive provisions of labour legislation, institutional and bureaucratic dysfunctions, the high transportation cost, which hinders exports and the provision of capital equipment for Greek firms.
reflects the inherent problems of the economy (rigidities, numerous administrative restrictions) that hurt total productivity and export performance, beyond the pricing factor.
Foreign Direct Investment (FDI) can also contribute in dealing with external deficits. However, while in the short-run FDI contributes in financing CA deficits through capital inflows, in the medium-term they put pressure in it through profit repatriation (sometimes also with illegitimate transfer pricing). Hence, the net effect on CA depends on the kind of FDI. FDI which is export-oriented generate a positive effect on the CA and enhance the country’s competitive advantage, while trade-substituting FDI may crowd out domestic export-oriented firms. Aggregate prosperity benefits more if FDI instigate sectoral restructuring in line with a dynamic competitive advantage, i.e. switch towards high-tech and hence, high value added goods.
However, this was never accomplished. Throughout the post-war period, the level of FDI has been exceptionally low, and it almost exclusively concerned labour-intensive and natural resources-intensive activities (Kyrklilis, 2002). In recent years, the majority of FDI was in low-tech sectors, particularly in retail trade and in activities servicing the –expanding- domestic market. The oligopolistic nature of many sectors of the Greek economy fostered this tendency. Furthermore, appreciation of the real exchange rate created wider profit margins for products and services produced abroad, with a given cost. Finally, the majority of FDI concerned the acquisition of domestic corporations and not the creation of new companies (Greenfield investment). As a
19 For example, the Ease of Doing Business index by World Bank for 2010 ranks Greece as 109th among 183 countries. To compare with other countries bearing external deficits, Bulgaria registered 44th, Portugal 48th, Romania 55th, Spain 62nd and Turkey 73rd.
result, the basis of production of the economy does not expand but rather the nationality of capital ownership changes.
Attracting corporations operating in high-tech sectors requires a general strategy of transforming the country into a Centre of Excellence. The creation of a business and investor friendly environment, as well as the improvement of structural aspects of competitiveness, can trigger self-fulfilling expectations of efficiency. These expectations motivate geographical clustering and spatial agglomeration with consequent spillover effects of technology and managerial skills in domestic corporations. Hence, external economies of scale and scope (Marshall Type) can spawn a competitive advantage to an entire sector, rather than to individual companies (Krugman, 1991). A qualitative upgrade of the production basis of the economy will bolster competition (price decrease), widen the occupational opportunities of specialized workforce and increase the productivity of the entire economy.
9. Conclusions
Our study examined the nature and the size of competitiveness losses in the Greek economy, as well as the adjustments in the CA that are necessary for ensuring a sustainable external debt. A main conclusion of the analysis is that the loss in competitiveness pertinent to the Greek exports’ prices is smaller than previously estimated. The adjustment can be achieved through a combination of improvement in the price competitiveness of tradable goods and services, relocation of resources from non-tradables and ameliorating quality competitiveness of tradables (improvement of exports’ technology content and value added). This is the actual policy question. The more rapid is the switch of the supply towards internationally tradables and of the domestic demand from imports to Greek goods, the less pressing is the need for a generalized internal devaluation. The more dynamic is specialization in goods and services of higher technology –and hence, of higher value added- and in expanding markets, the more bearable will be the burden that will fall onto the wages. The restraining in the state’s borrowing needs, as well as the fight against oligopolistic conditions and rigidities in product and labour markets have to proceed in any case. The reason is that these constitute vital ingredients of the necessary structural transformation of the Greek economy’s growth model. Given the inability –even temporal- to mitigate the loss in price competitiveness through depreciations, structural reforms which enhance total productivity are the most substantial policy tool for stimulating growth and external competitiveness. In the long-term, the new growth model should be based on investment in education, research and technology, development of innovative managerial methods, a public administration that can support the production process, a healthy banking system, a new, more productive culture of economic agents and individuals.
April 2011
13
Acemoglu, D., S. Johnson and J.A. Robinson (2001), Reversal of Fortune: Geography and Institutions in the Making of the Modern World Income Distribution, NBER Working Paper 8460.
Literature References
Agenor, P.R. (1995), Competitiveness and External Trade Performance of the French Manufacturing Industry. IMF Working Paper No 95/137.
Anastasatos, T. (2008), The Deterioration of the Greek Current Account: Causes, Consequences and Adjustment Scenaria (in Greek), Economy &Markets, Eurobank Research, Vol ΙΙΙ, No 6, June
Blanchard O. and Giavazzi F. (2002), Current Account Deficits in the Euro Area: The End οf the Feldstein-Horioka Puzzle?, Brookings Papers on Economic Activity 2, p.p. 147-209.
Brissimis, S.N., G.Hondroyiannis, C. Papazoglou, N.T. Tsaveas and M.A. Vasardani (2010), Current Account Determinants and External Sustainability in Periods of Structural Change, ECB Working Paper Series No 1243, September.
Chin, M.D. and E.S. Prasad (2003), Medium Term Determinants of Current Accounts in Industrial and Developing Countries: An Empirical Exploration. Journal of International Economics, vol. 59, pp. 47-76.
EC (2010), Quarterly Report on the Euro Area, Volume 9, No 3.
EC (2010β), European Economy, No 1/2010, p. 69.
EC (2006), European Economy, No 6/2006, p. 107.
European Commission (2009): Competitiveness Developments within the Euro Area. In: European Commission, Quarterly Report on the Euro Area, vol 8, No 1.
Fagan G. and V. Gaspar (2005), Adjusting to the Euro Area: Some issues inspired by the Portuguese experience, mimeo, Banco de Portugal and ECB.
Fagan G. and V. Gaspar (2007), Adjusting to the Euro Area, ECB Working Paper No 716.
Felipe, J. and U. Kumar, (2011), Do Some Countries In The Eurozone Need An Internal Devaluation? A Reassessment Of What Unit Labour Costs Really Mean, VoxEU, 31 March, http://www.voxeu.org/index.php?q=node/6299
Gibson, H. (2010), Sectoral Growth of the Greek Economy in 1995—2003 (in Greek), in The Greek Current Account: Causes of Imbalances and Policy Suggestions, Bank of Greece, July.
IMF (2006), Methodology for CGER Exchange Rate Assessments, November.
Krugman, P. (1991), Increasing Returns and Economic Geography, Journal of Political Economy, 99, 483-99.
Kirkilis, D. (2002), Foreign Direct Investment (in Greek), Kritiki Publishing.
Lee, J., G.M. Milesi-Perretti, J. Ostry, A. Prati, and L. Ricci (2008), Exchange Rate Assessments: CGER Nethodologies. IMF Occasional Paper No 261.
Lipschitz, L. and D. McDonald (1992), Real Exchange Rates and Competitiveness: A Clarification of Concepts, and Some Measurements for Europe. Empirica, vol. 19, pp. 37-69.
Malliaropulos (2010): How much did competitiveness of the Greek economy decline since EMU entry? In: Economy and Markets, Eurobank EFG, Ιούλιος 2010.
Marsch, I.W. and S.P. Tokarick (1996), An Assessment of Three Measures of Competitiveness. Weltwirtschaftliches Archiv, vol. 132, pp. 700-732.
Manassakis, A. C. Katiforis and M. Vasardani (2010), The International Competitiveness and the Current Account of Greece (in Greek), in The Greek Current Account: Causes of Imbalances and Policy Suggestions, Bank of Greece, July.
Obstfeld, M. and K. Rogoff (2004), The unsustainable US current account position revisited. NBER Working Paper No 10869.
Ruscher, E. and G.B. Wolff (2009), External Rebalancing is not an Exporters’ Story: Real Exchange Rates, the Non-tradable Sector and the Euro. European Commission, European Economy – Economic Paper No 375.
Sideris, D and N. Zonzilos (2005), “The Greek Model of the European System of Central Banks Multi-Country Model”, Bank of Greece Working Paper 20.
Smith, J. (2006), How costly is downward nominal rigidity in the United Kingdom?, DTI Economics Paper, August & University of Warwick Working Paper.
Turner, P. and J. Van t’dack (1993), Measuring International Competitiveness. BIS Economic Papers No 39.
April 2011
14
Eurobank EFG, 20 Amalias Av & 5 Souri Str, 10557 Athens, tel: +30.210.333 .7365, fax: +30.210.333.7687, contact email: [email protected]
Editor, Professor Gikas Hardouvelis Chief Economist & Director of Research Eurobank EFG Group
Eurobank EFG Economic Research More research editions available at http://www.eurobank.gr/research • New Europe: Economics & Strategy Monthly edition on the economies and the markets of New Europe • Economy & Markets: Monthly economic research edition • Global Economic & Market Outlook: Quarterly review of the international economy and financial markets
Subscribe electronically at http://www.eurobank.gr/research
Research Team
Financial Markets Research Division Platon Monokroussos, Head of Financial Markets Research Division
Paraskevi Petropoulou, G10 Markets Analyst Galatia Phoka, Emerging Markets Analyst
Economic Research & Forecasting Division Dimitris Malliaropulos, Economic Research Advisor Tasos Anastasatos, Senior Economist Ioannis Gkionis, Research Economist Stella Kanellopoulou, Research Economist Vassilis Zarkos, Economic Analyst Olga Kosma, Economic Analyst Maria Prandeka, Economic Analyst Theodosios Sampaniotis, Senior Economic Analyst Theodoros Stamatiou, Research Economist
Sales Team Nikos Laios, Head of Sales
Vassillis Gulbaxiotis, Head of International Sales Yiannis Seimenis, Ioannis Maggel, Corporate Sales
Stogioglou Achilleas, Private Banking Sales Alexandra Papathanasiou, Institutional Sales