Thayne Bruszewski Rebecca Donahoe English 602 Project Fall 2011.

1
00M61SF.000 0000 0406 PPT1
Economics of Technology and the Engineering Career
Daniel N. Donahoe, Ph.D., P.E.Michelle Poliskie, Ph.D.
April 12, 2006April 12, 2006
2
00M61SF.000 0000 0406 PPT1
Introduction to Economics and Technology
ProblemThe central question is how should GOLD members face economic challenges in our modern technology-driven market system?
Approach Tools
The coincidence of technology and economicsHow technology evolves in product marketsHow understanding the market requires embracing irrationality
DataEmployment and economic data analysisExperimental data

3
00M61SF.000 0000 0406 PPT1
Technology and Economics

4
00M61SF.000 0000 0406 PPT1
Model of Population Growth
Rdtdy
= R is the net population growth [number/year]
ryRdtdy
== r is per capita population growth [number/(person/year)]
∫∫ =ty
yo
rdty
dy
0
rtyy
=⎟⎟⎠
⎞⎜⎜⎝
⎛
0
ln
( ) rteyty 0= Malthus’ Law of Growth
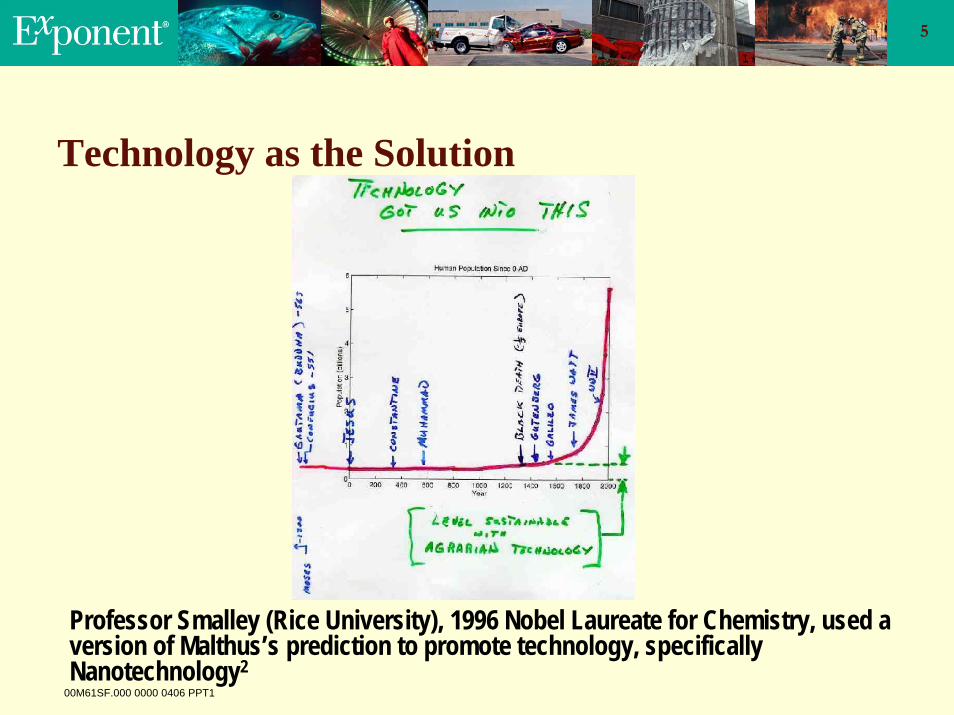
Because Malthus1 painted a gloomy population prediction of mass starvation, Economics was named “The Dismal Science”Technology is the answer, as explained by a Nobel Laureate
5
00M61SF.000 0000 0406 PPT1
Technology as the Solution
Professor Smalley (Rice University), 1996 Nobel Laureate for Chemistry, used a version of Malthus’s prediction to promote technology, specifically Nanotechnology2
6
00M61SF.000 0000 0406 PPT1
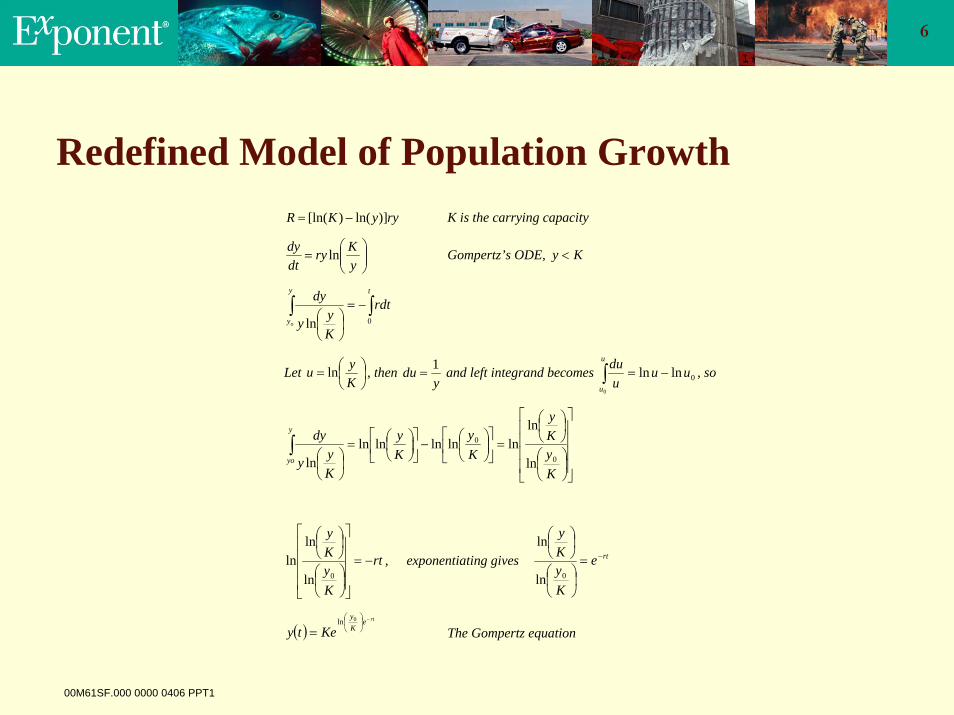
Redefined Model of Population GrowthryyKR )]ln()[ln( −= K is the carrying capacity
⎟⎟⎠
⎞⎜⎜⎝
⎛=
yKry
dtdy ln Gompertz’s ODE, Ky <
∫∫ −=⎟⎠⎞
⎜⎝⎛
ty
y
rdt
Kyy
dy
o 0ln
Let ⎟⎠⎞
⎜⎝⎛=
Kyu ln , then
ydu 1
= and left integrand becomes 0lnln0
uuuduu
u
−=∫ , so
⎥⎥⎥⎥
⎦
⎤
⎢⎢⎢⎢
⎣
⎡
⎟⎠⎞
⎜⎝⎛
⎟⎠⎞
⎜⎝⎛
=⎥⎦
⎤⎢⎣
⎡⎟⎠⎞
⎜⎝⎛−⎥
⎦
⎤⎢⎣
⎡⎟⎠⎞
⎜⎝⎛=
⎟⎠⎞
⎜⎝⎛∫
KyKy
Ky
Ky
Kyy
dyy
yo 0
0
ln
lnlnlnlnlnln
ln
rt
KyKy
−=
⎥⎥⎥⎥
⎦
⎤
⎢⎢⎢⎢
⎣
⎡
⎟⎠⎞
⎜⎝⎛
⎟⎠⎞
⎜⎝⎛
0ln
lnln , exponentiating gives rte
KyKy
−=⎟⎠⎞
⎜⎝⎛
⎟⎠⎞
⎜⎝⎛
0ln
ln
( )rte
Ky
Kety−⎟
⎠
⎞⎜⎝
⎛
=0ln
The Gompertz equation
7
00M61SF.000 0000 0406 PPT1
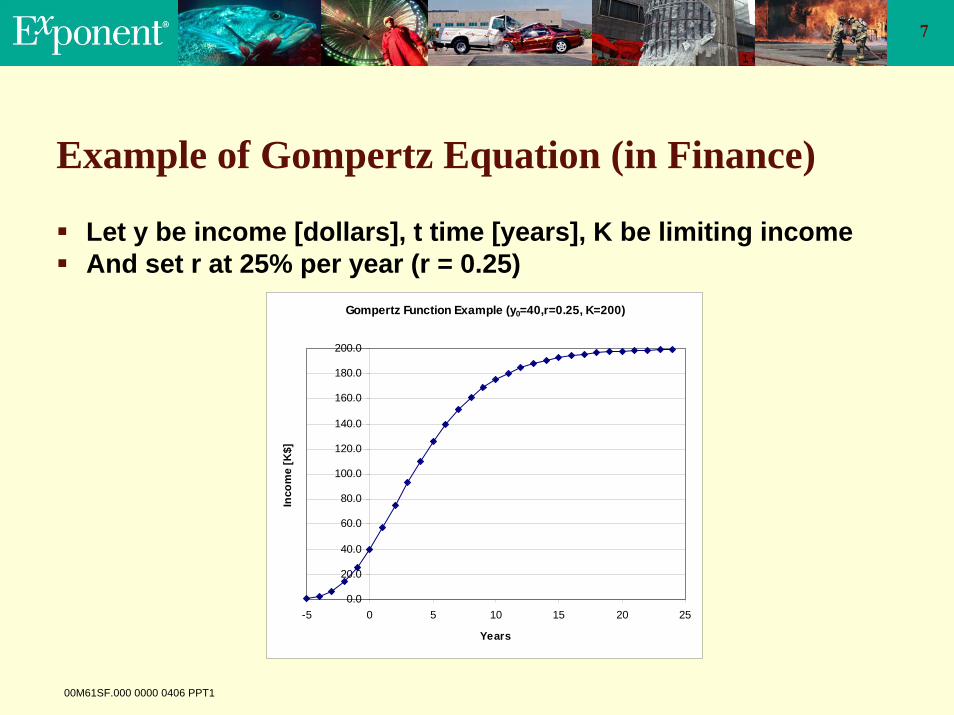
Example of Gompertz Equation (in Finance)
Let y be income [dollars], t time [years], K be limiting incomeAnd set r at 25% per year (r = 0.25)
Gompertz Function Example (y0=40,r=0.25, K=200)
0.0
20.0
40.0
60.0
80.0
100.0
120.0
140.0
160.0
180.0
200.0
-5 0 5 10 15 20 25
Years
Inco
me
[K$]

8
00M61SF.000 0000 0406 PPT1
Technology and Product Evolution

9
00M61SF.000 0000 0406 PPT1
Economics: Technology Shocks and Diffusion
Technology shocks create business cycles (Kondratieff cycles)3
It takes time for acceptance of new technology, “diffusion”4
Old technology declines with the rise of the new technology
Units of a substitute com
modity
Examples of Substitute Technologies:
time
Uni
ts o
f a c
omm
odityhorses automobiles
calculatorslide rule
flash memoryfloppy

10
00M61SF.000 0000 0406 PPT1
Technology Trends (curves within curves)
Once new technology creates new markets, new inventions come along that are substitutable for the previous technologies; this sequence of inventions can be viewed as a mathematical progression or, more appropriately, as a series of superimposed Gompertz curves
In business school jargon, theseare called “S curves”Prof. Christensen5 pointed out thatthese cycles defy what managers often think of as “good management”such as the mantra “being close to the customer”

11
00M61SF.000 0000 0406 PPT1
The Influence of Business Cycles on Technical Jobs

12
00M61SF.000 0000 0406 PPT1
Market Psychology: Speculation
Business SpeculationThe boom and bust cycle created by speculation is not studied inengineering school An early historical example of speculation is the growth of the tulip trade in Holland at the end of the 17th century6
Recent technology speculation has been captured in “Gartner’s Hype Cycle of Emerging Technology”7
Timeline
Introduction oftulips into Holland
Early 1600sEarly 1600s 16331633
Wild speculation
16371637
Bankruptcy results as the bottom falls
out of the market
13
00M61SF.000 0000 0406 PPT1
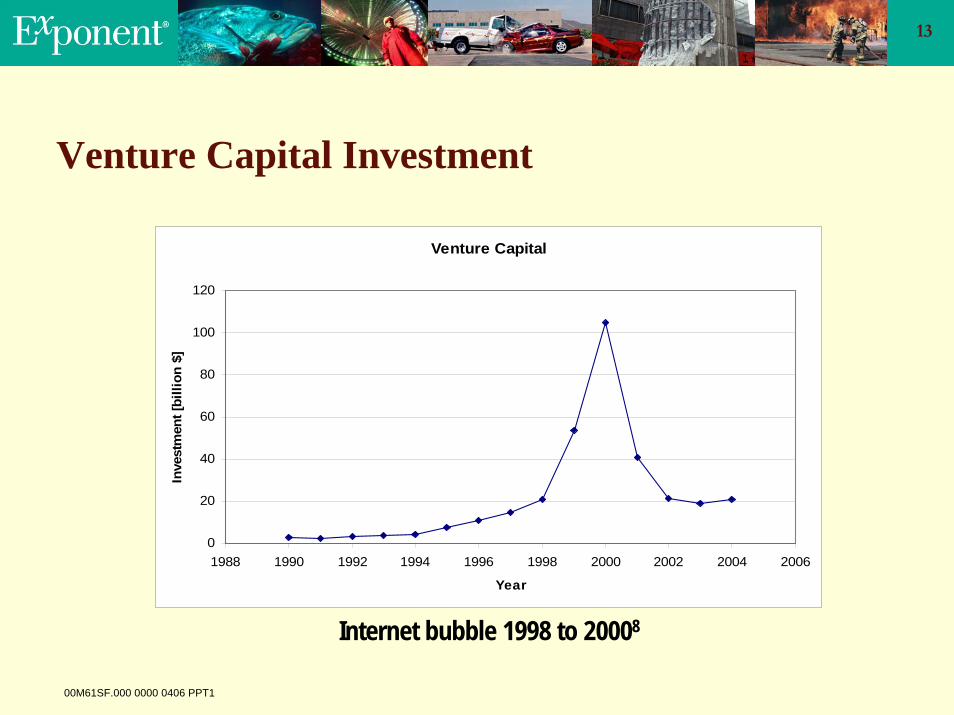
Venture Capital Investment
Venture Capital
0
20
40
60
80
100
120
1988 1990 1992 1994 1996 1998 2000 2002 2004 2006
Year
Inve
stm
ent [
billi
on $
]
Internet bubble 1998 to 20008

14
00M61SF.000 0000 0406 PPT1
The Dow Jones Average
The Dow reflects the boom-bust of the internet bubble; the Dow had been almost monotonic for decades until 2000
Dow at Year Start
0
2000
4000
6000
8000
10000
12000
1970 1975 1980 1985 1990 1995 2000 2005 2010
Year
Dow

15
00M61SF.000 0000 0406 PPT1
Business Cycles
time
Average 4.5 years (1857)peak
tough
peak
business activity
There have been 32 business cycles in the U.S. since 1854 and 10 business cycles since WWII 9In 2003, EE unemployment reached 6.7% due to a downturn in thebusiness cycle10
16
00M61SF.000 0000 0406 PPT1
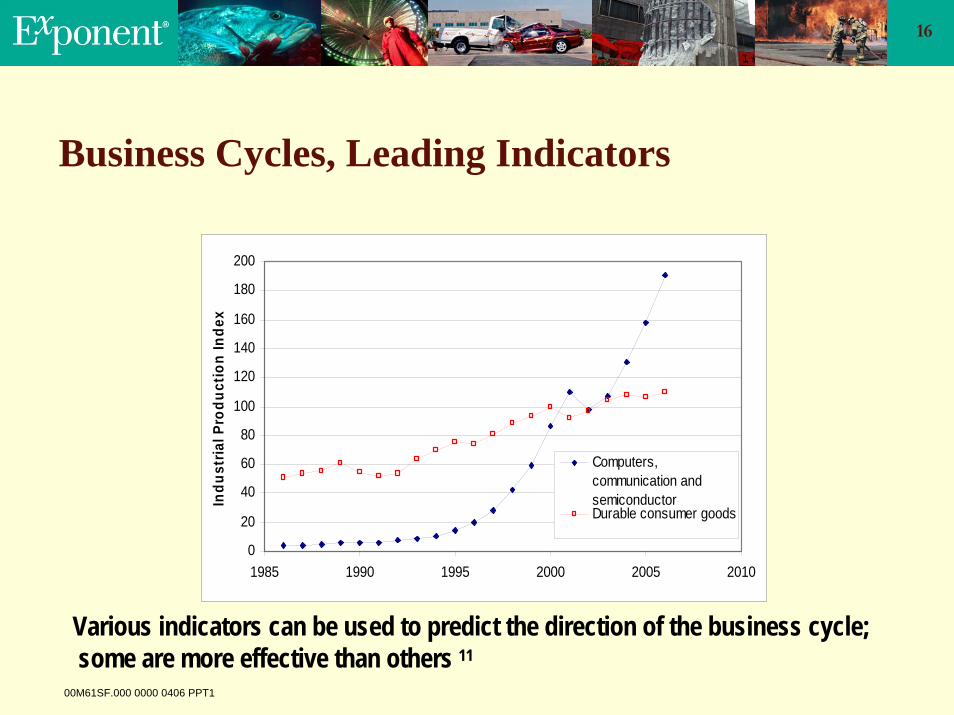
Business Cycles, Leading Indicators
Various indicators can be used to predict the direction of the business cycle; some are more effective than others 11
0
20
40
60
80
100
120
140
160
180
200
1985 1990 1995 2000 2005 2010
Indu
stria
l Pro
duct
ion
Inde
x
Computers,communication andsemiconductorDurable consumer goods

17
00M61SF.000 0000 0406 PPT1
Areas for Concentrated Venture Capital Spending
0
50
100
150
200
250
Biotechnology Medical/Health Internet Specific Semiconductors
Tota
l Ven
ture
-Bac
ked
Off
erin
g Si
ze (M
illio
ns o
f Dol
lars
) Q1 2006
Venture Capitol Funding Today12

18
00M61SF.000 0000 0406 PPT1
Engineering Job Market
19
00M61SF.000 0000 0406 PPT1
Topics in Engineering Salaries
Engineering salaries are plotted on the following slide by discipline
The salaries are contrasted to a Family Practice MD which almostoverlies the compensation of “executives;” the explanation for the difference in compensation is multifaceted, but one underpinningreason for the difference is the number of medical doctors in private practice However, this is a snapshot in time; may the difference decrease as HMOs become more prevalent?
Salary observations related to employer sizeLarger employers appear attractive due to the perception of job security; however, there are trade-offsLong term engineering employees in large firms sometimes suffer “salary compression” defined as the narrowing pay differentials between new people and senior people
A personal salary historyI am going to be bold and plot my normalized salary history for 30 years

20
00M61SF.000 0000 0406 PPT1
Business Cycle Indicators: Supply Changes
The higher the degree of attainment the lower the anticipated unemployment
It is believed that the higher the level the degree of educationattainment the less susceptible to changes in the business cycleHowever, “white collar engineers” are not immune
0
1
2
3
4
5
6
7
8
9
10
No Diplomas High SchoolDiploma
Some College Associate degree Bachelor's degree Master's degree Doctorate
Perc
enta
ge o
f Une
mpl
oym
ent (
%) Workers over 25 years of age, 200313
4.8% National Unemployment Rate

21
00M61SF.000 0000 0406 PPT1
US Engineering Degrees
Graduation trends plotted below14
The increasing percentage of graduates are foreign nationals and who return home after graduation?Will baby boomer retirements create a shortage of engineers?
U.S. Engineering Degrees
0
10000
20000
30000
40000
50000
60000
70000
80000
90000
1965 1970 1975 1980 1985 1990 1995 2000 2005
Year
Num
ber BS
MSPhD

22
00M61SF.000 0000 0406 PPT1
Engineering Starting Salaries
Salaries decreasing for graduates from 2000 to 200115
Engineering Field 2000 2001Aerospace 51 46Chemical 55 50Civil 45 44Electrical 55 51Mechanical 52 46
Graduation (BS)

23
00M61SF.000 0000 0406 PPT1
Engineering Wages versus Professional
A wise man sets expectations consistent with observations16
U.S. Professional Compensation
0.000
0.050
0.100
0.150
0.200
0.250
0.300
0.350
0.400
0.450
0 20000 40000 60000 80000 100000 120000 140000
Annual Income
Freq
uenc
y
CompEEEMatEMEMD

24
00M61SF.000 0000 0406 PPT1
Number of Employed Engineers in US17
Labor Level Engineers
0
500
1000
1500
2000
2500
1980 1985 1990 1995 2000 2005
Year
Ann
ual [
K]
25
00M61SF.000 0000 0406 PPT1
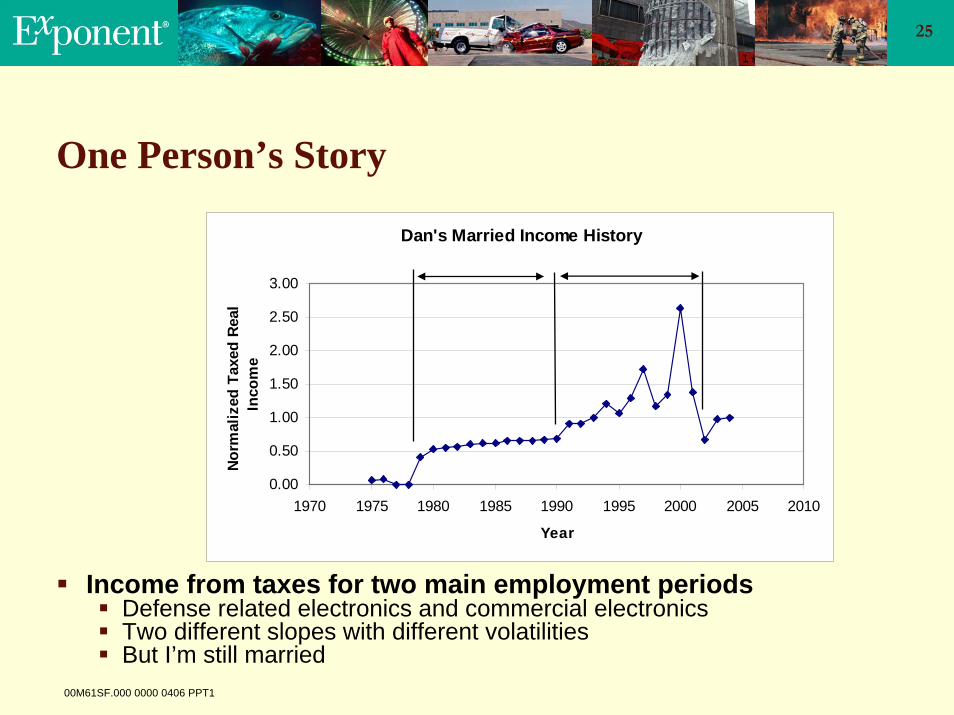
One Person’s Story
Dan's Married Income History
0.00
0.50
1.00
1.50
2.00
2.50
3.00
1970 1975 1980 1985 1990 1995 2000 2005 2010
Year
Norm
aliz
ed T
axed
Rea
l In
com
e
Income from taxes for two main employment periods Defense related electronics and commercial electronicsTwo different slopes with different volatilitiesBut I’m still married

26
00M61SF.000 0000 0406 PPT1
Psychology of Picking a Career
Why do people pick an engineering career over other alternatives?
One reason lies in psychology: People balance their attitudes (beliefs about outcomes) and internalized norms (societal expectations) to determine shape their intentions and, thereby, their behavior
What should a reasonable person do in making career decision?
The best simple metric is the one proposed by social scientists:minimization of regret18
normsattitudes

27
00M61SF.000 0000 0406 PPT1
Summary
A poem by Richard Hodgetts quoted by Norman Augustine before the Committee on Science, Engineering and Public Policy of the US Congress in Oct. 200519
Every morning in Africa a gazelle wakes up.It knows it must outrun the fastest lion or it will be killed.
Every morning in Africa a lion wakes up.It knows it must outrun the slowest gazelle or it will be starve.
It doesn’t matter whether you’re a lion or gazelle-when the sun comes up, you’d better be running.
28
00M61SF.000 0000 0406 PPT1
References
1. Malthus, T., An Essay on the Principal of Population, 1798. 2. Smalley, R., Nanotechnology and the Next 50 Years, Presentation to the University of
Dallas Board of Councilors, Rice University, 7 Dec. 1995 (http://smalley.rice.edu).3. Miller, H., How Economics of Business Cycles Impact the Electronics Industry, Chip
Scale Review Sept.-Oct. 1999, http:www.chipscalereview.com (25 Feb. 2006).4. Stoneman, Paul The Economics of Technological Diffusion, Oxford: Blackwell
Publishers, 2002.5. Christianson, C., The Inventors Dilemma: When New Technologies Cause Great Firms to
Fail, Harvard Press, 1997, p 45. 6. Dash, M., Tulipomania: The Story of the World’s Most Coveted Flower & the
Extraordinary Passions it Aroused, Three Rivers Press, NY, 1999.7. Twist, J., Peering Beyond the Technology Hype, BBC News, 30 Aug 2004,
http:newsvote.bbc.co.uk (26 Mar 2006).8. National Venture Capital Association, Industry Statistics, 28 March 2008,
http://www.nvca.org (28 March 2006).9. National Bureau of Economic Research NBER), Business Cycle Expansions and
Contractions, 26 Feb. 2006, http://www.nber.org/cycles.html (26 Feb. 2006). 10. McManes, C., U.S. EE Unemployment Moves Upward as Thousands of Non-US Workers
Continue to Flood the Job Market, 14 Oct 2003, http://www.ieeeusa.org (8 April 2006).

29
00M61SF.000 0000 0406 PPT1
References (cont’d)
11. U.S. Department of Federal Reserve, Industrial Production and Capacity Utilization, February 2006, http://www.federalreserve.gov/releases/g17/ipdisk/ip.sa (9 Apr 2006).
12. Mendell, E. and Raddler, J., Venture-Backed IPO Market Languished while Sacquisition Market Maintained Bullish Pace in First Quarter of 2006, 3 April 2006, http://www.nvca.org/pdf/2006Q1exitpollreleasefinal.pdf (8 April 2006).
13. More Education; Lower Unemployment, Higher Pay, Occupational Outlook Quarterly, Fall 2004, http://www.bls.gov/opub/ooq/2004/fall/oochart.pdf (8 April 2006).
14. Hill, S and Johnson, J., Science and Engineering Degrees: 1966-2001, National Science Foundation, Arlington, VA, March 2004.
15. Tsapogas, J., Recent Engineering and Computer Science Graduates Continue to Earn the Highest Salaries, NSF, Arlington, VA http://www.nsf.gov/statistics/inbrief/nsf060303 (1 April 2006).
16. U.S. Department of Labor Bureau of Labor Statistics, Occupational Employment and Wages, November 2004, http://www.bls.gov (24 Feb. 2006).
17. Labor Force Statistics From the Current Population Survey, Series LFU42511000 (1), http://data.bls.gov/cgi-bin/dsrv (2 Apr 2006).
18. Janis, I. and Mann, L., Decision Making: A Psychological Analysis of Conflict, Choice and Commitment, Free Press, NY, 1977.
19. Augustine, N., National Academy of Engineering, For Congress, 20 Oct. 2005, http://www7.national academies.org (4 March 2006).