Economics of Energy Efficiency - dartmouth.educushman/courses/engs44/images/... · Performed an...
104
Economics of Energy Efficiency ENGS 44 Sustainable Design | Dara Goldberg ‘08, LEED AP BD+C
Transcript of Economics of Energy Efficiency - dartmouth.educushman/courses/engs44/images/... · Performed an...

Economics of Energy EfficiencyENGS 44 Sustainable Design | Dara Goldberg ‘08, LEED AP BD+C

experience
economics of efficiency
case studies

Economics of Energy Efficiency Dara Goldberg ‘08 | 3
Experience
EDUCATIONHong Kong University (2015)
MSc in Urban Planning
Ecosa InstituteCertificate in Sustainable & Ecological Design
Dartmouth Major: Engineering Science mod. Studio ArtMinor: Digital Arts
PROFESSIONALHR&A Advisors
Research Analyst, Analyst
Kohn Pedersen FoxArchitect I, Sustainability Analyst
Economics of Energy Efficiency Dara Goldberg ‘08 | 4
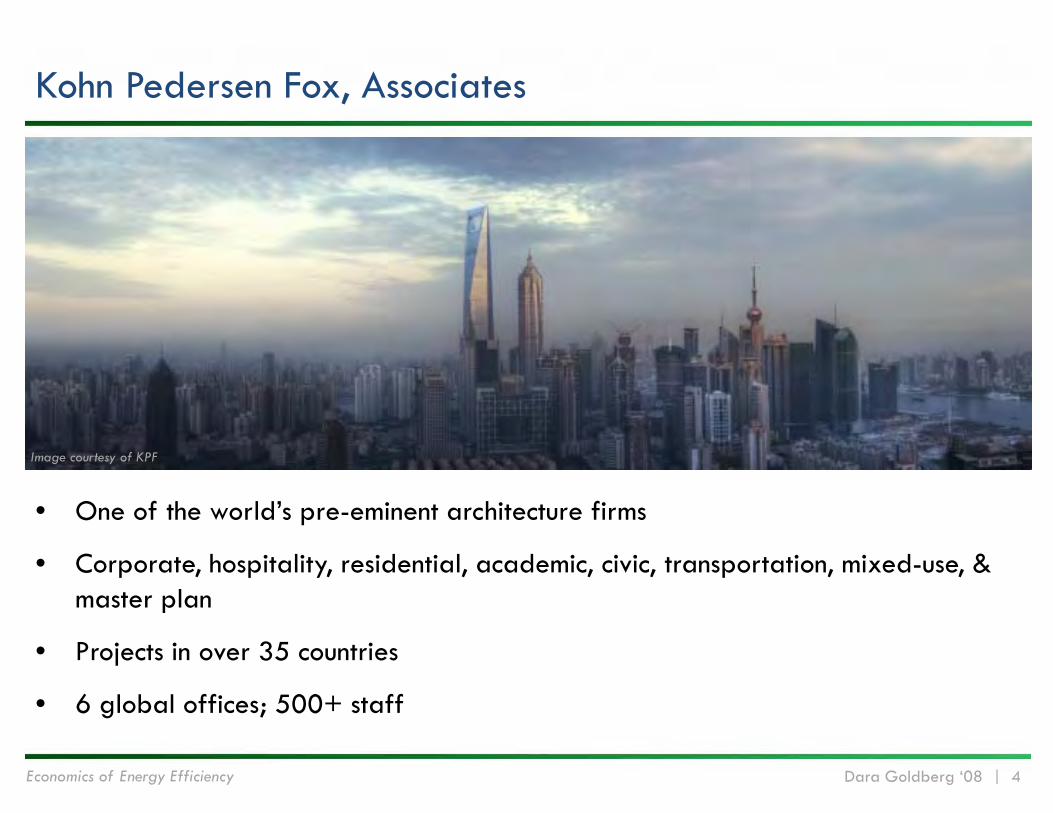
Kohn Pedersen Fox, Associates
• One of the world’s pre-eminent architecture firms
• Corporate, hospitality, residential, academic, civic, transportation, mixed-use, & master plan
• Projects in over 35 countries
• 6 global offices; 500+ staff
Image courtesy of KPF

Economics of Energy Efficiency Dara Goldberg ‘08 | 5
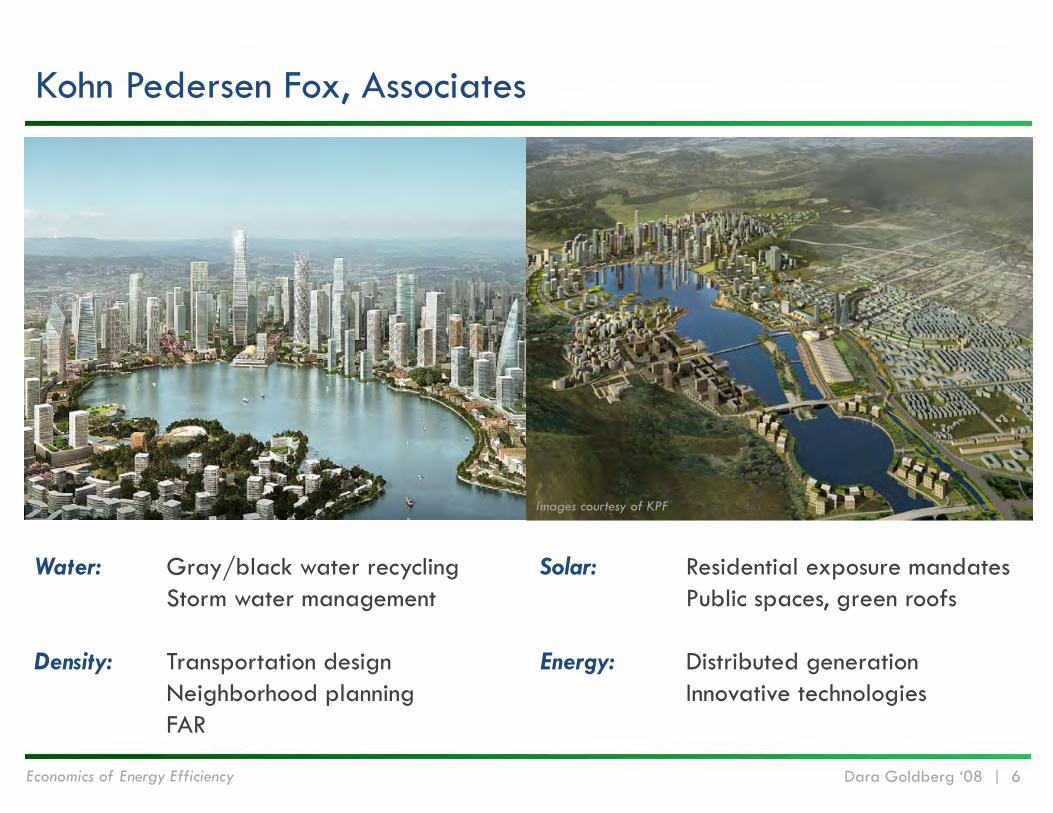
Kohn Pedersen Fox, Associates
Horizontal Fin
200mm
Rotating Fin
500mm 600mm
S N
Image courtesy of KPF
E/W
Economics of Energy Efficiency Dara Goldberg ‘08 | 6
Kohn Pedersen Fox, Associates
Water: Gray/black water recyclingStorm water management
Density: Transportation designNeighborhood planningFAR
Solar: Residential exposure mandatesPublic spaces, green roofs
Energy: Distributed generationInnovative technologies
Images courtesy of KPF
Economics of Energy Efficiency Dara Goldberg ‘08 | 7
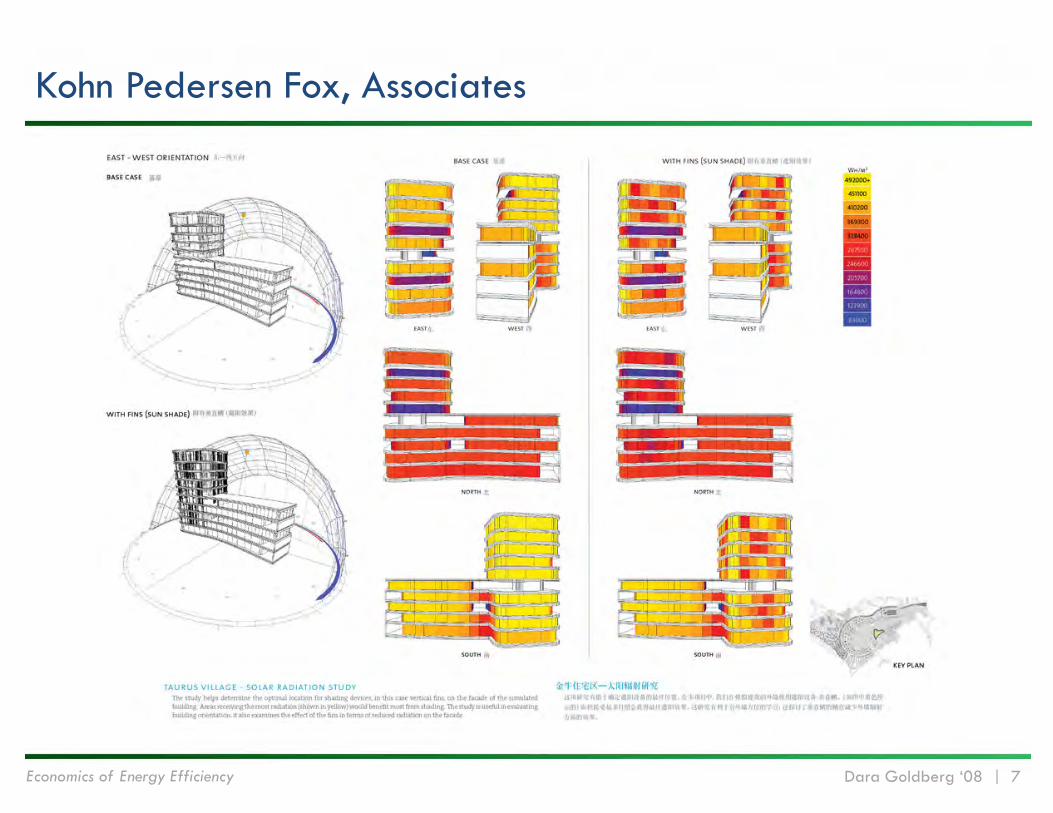
Kohn Pedersen Fox, Associates
Economics of Energy Efficiency Dara Goldberg ‘08 | 8
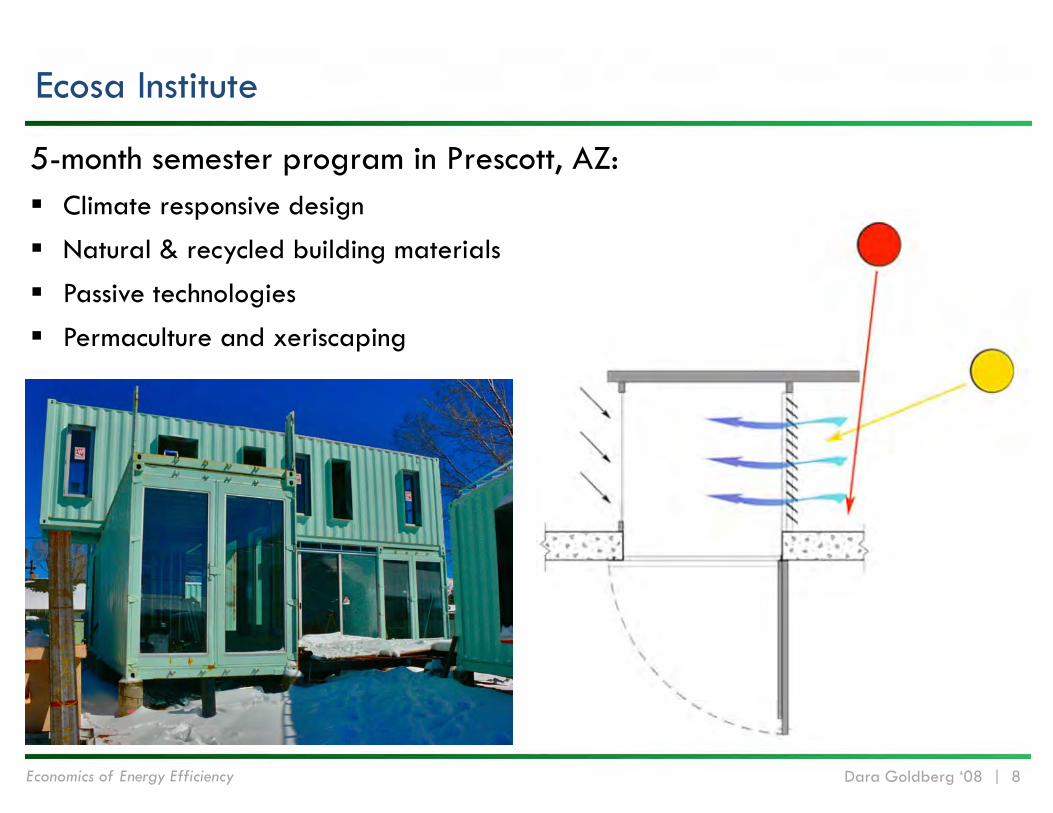
Ecosa Institute
5-month semester program in Prescott, AZ: Climate responsive design
Natural & recycled building materials
Passive technologies
Permaculture and xeriscaping
Economics of Energy Efficiency Dara Goldberg ‘08 | 9
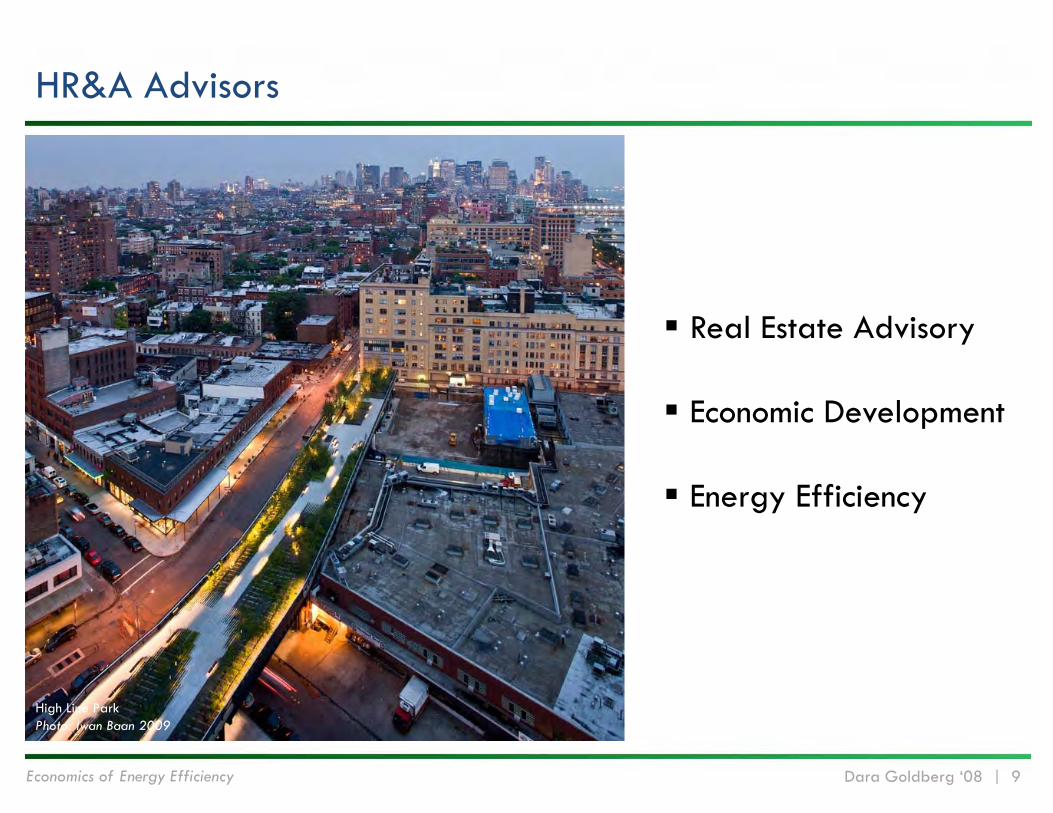
HR&A Advisors
Real Estate Advisory
Economic Development
Energy Efficiency
High Line ParkPhoto: Iwan Baan 2009
Economics of Energy Efficiency Dara Goldberg ‘08 | 10
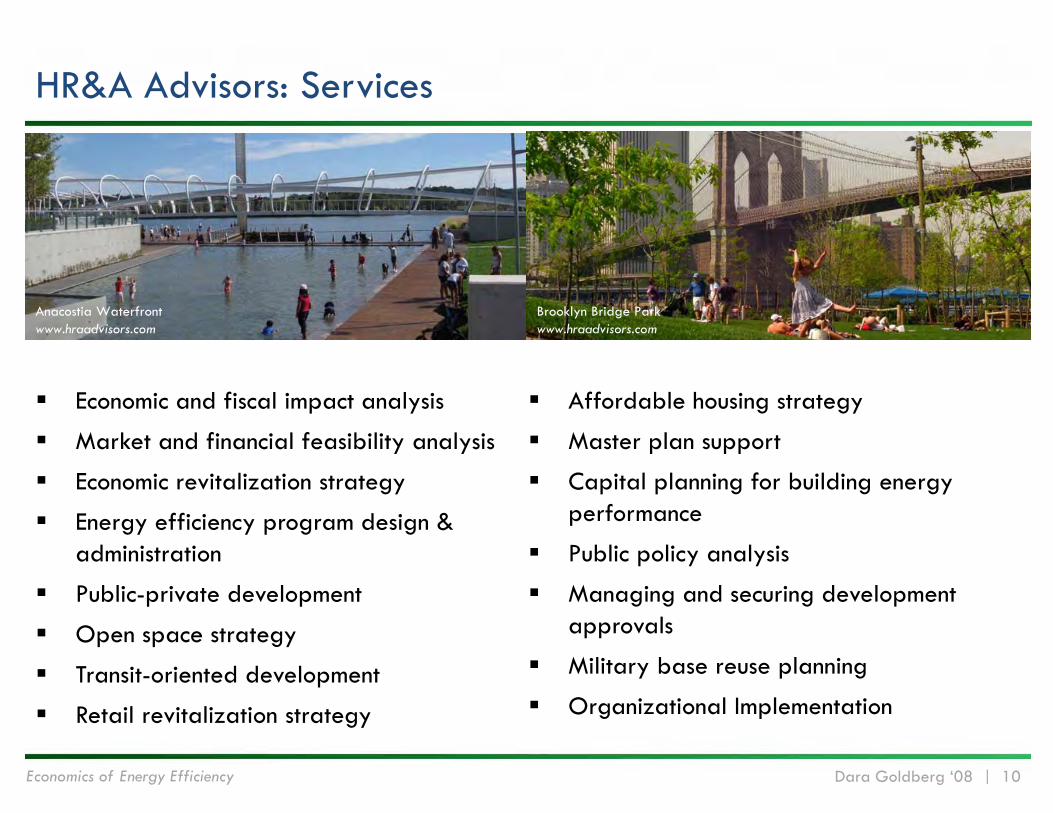
HR&A Advisors: Services
Economic and fiscal impact analysis
Market and financial feasibility analysis
Economic revitalization strategy
Energy efficiency program design & administration
Public-private development
Open space strategy
Transit-oriented development
Retail revitalization strategy
Affordable housing strategy
Master plan support
Capital planning for building energy performance
Public policy analysis
Managing and securing development approvals
Military base reuse planning
Organizational Implementation
Anacostia Waterfrontwww.hraadvisors.com
Brooklyn Bridge Parkwww.hraadvisors.com
Economics of Energy Efficiency Dara Goldberg ‘08 | 11
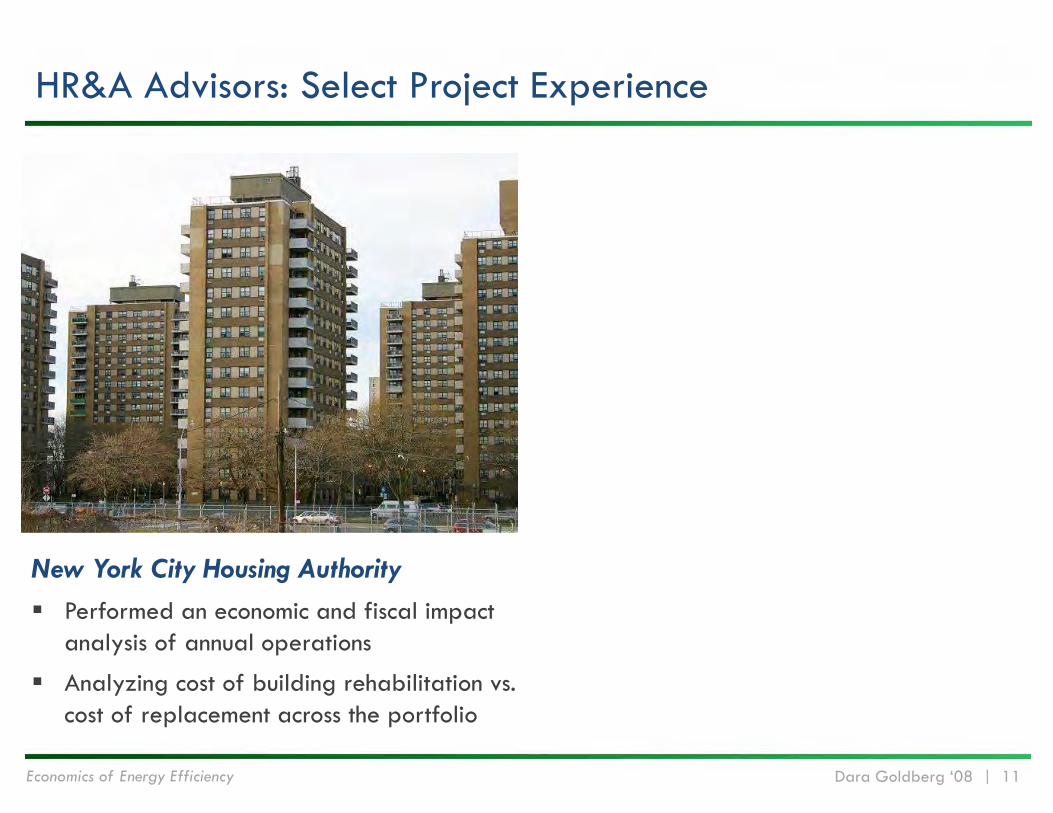
HR&A Advisors: Select Project Experience
New York City Housing Authority Performed an economic and fiscal impact
analysis of annual operations
Analyzing cost of building rehabilitation vs. cost of replacement across the portfolio
Economics of Energy Efficiency Dara Goldberg ‘08 | 12
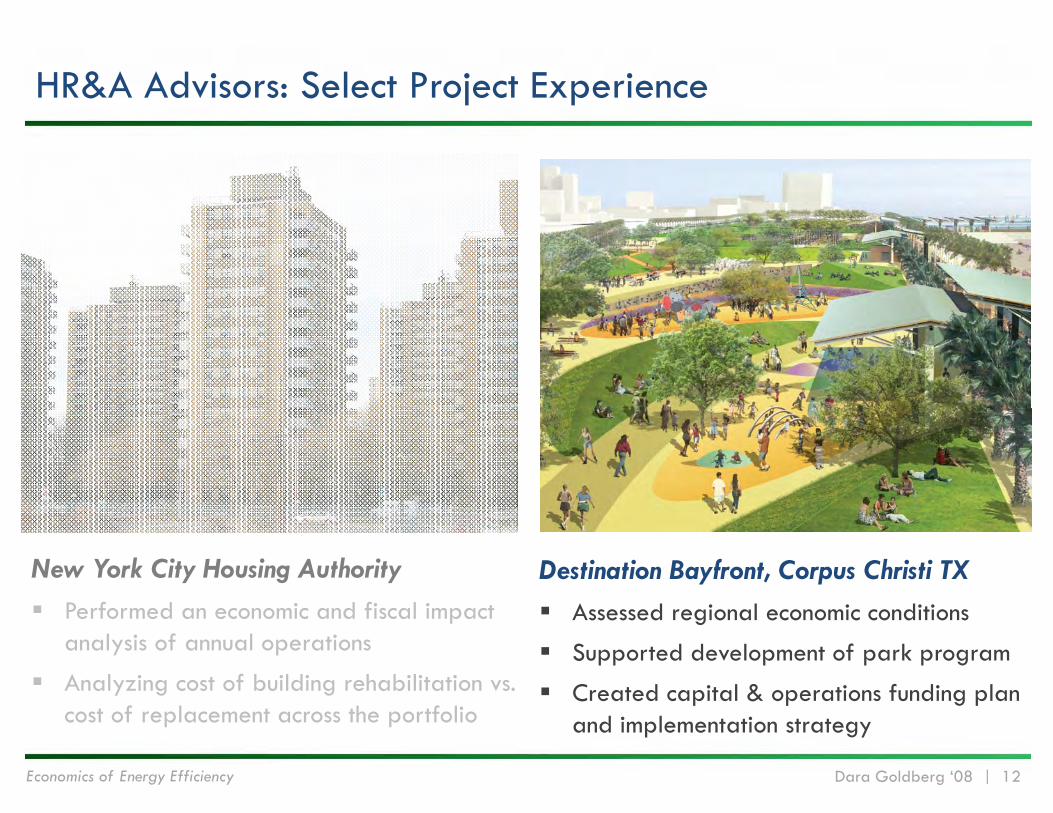
HR&A Advisors: Select Project Experience
New York City Housing Authority Performed an economic and fiscal impact
analysis of annual operations
Analyzing cost of building rehabilitation vs. cost of replacement across the portfolio
Destination Bayfront, Corpus Christi TX Assessed regional economic conditions
Supported development of park program
Created capital & operations funding plan and implementation strategy
Economics of Energy Efficiency Dara Goldberg ‘08 | 13
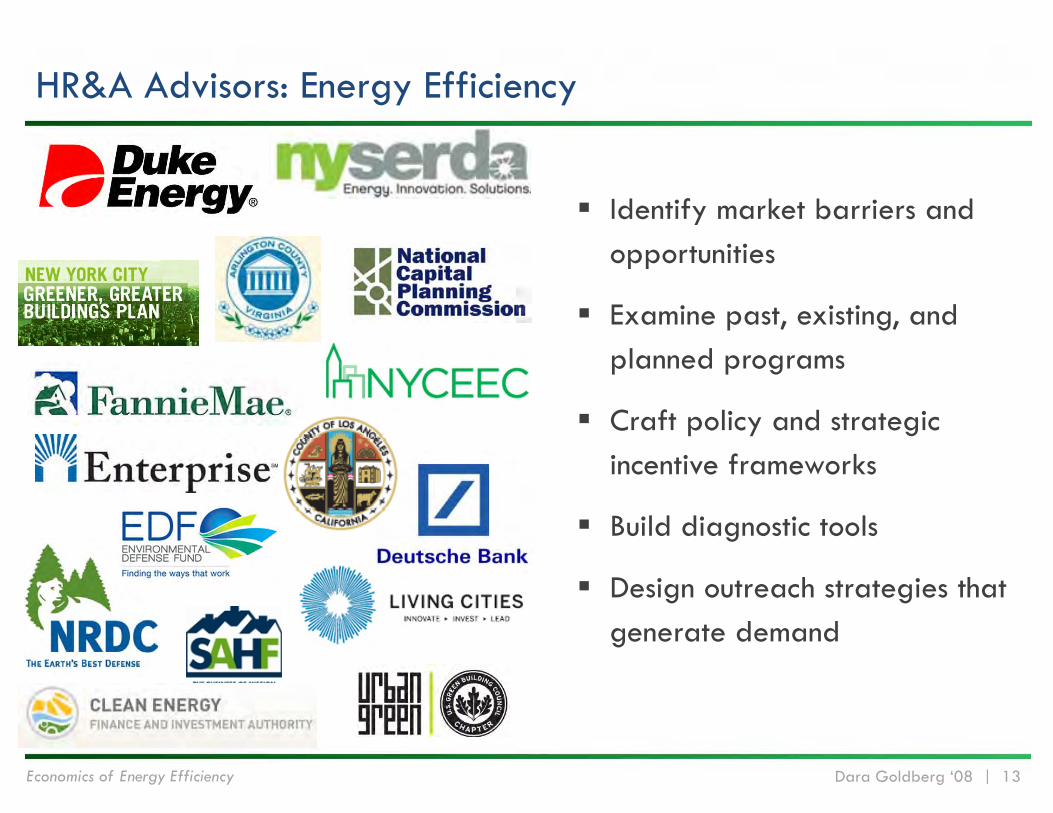
HR&A Advisors: Energy Efficiency
Identify market barriers and opportunities
Examine past, existing, and planned programs
Craft policy and strategic incentive frameworks
Build diagnostic tools
Design outreach strategies that generate demand

experience
economics of efficiency
case studies
Economics of Energy Efficiency Dara Goldberg ‘08 | 15
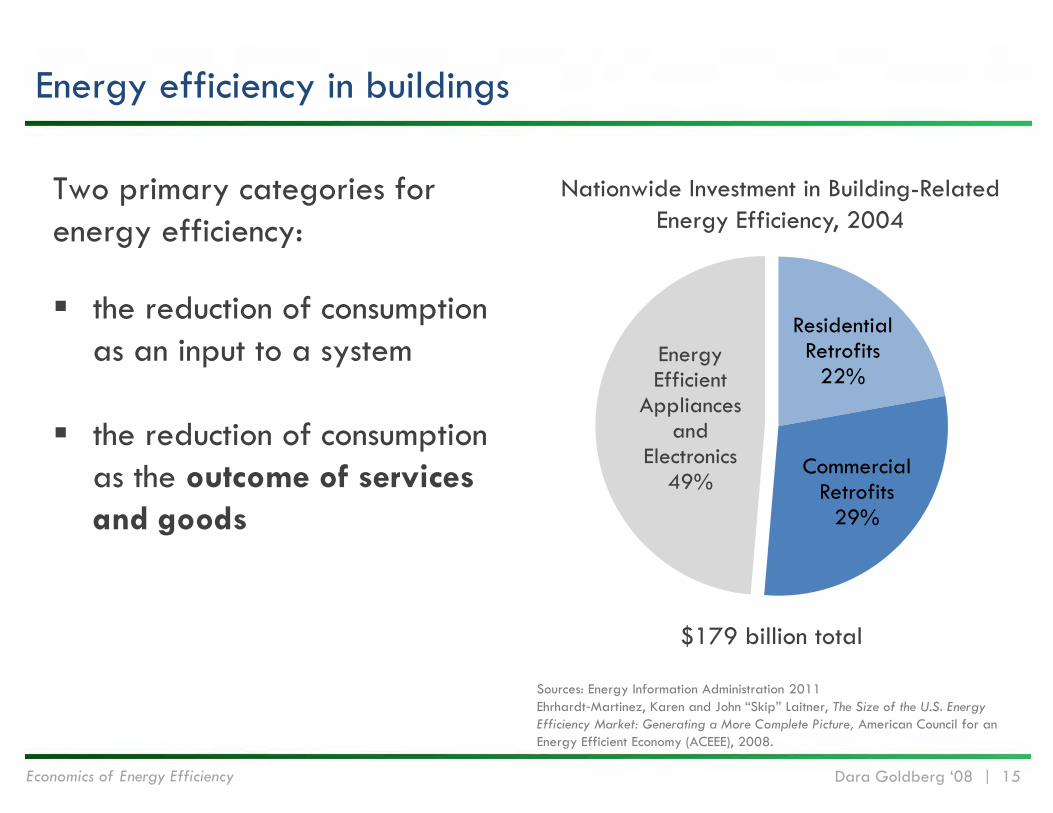
Energy efficiency in buildings
Two primary categories for energy efficiency:
the reduction of consumption as an input to a system
the reduction of consumption as the outcome of services and goods
Residential Retrofits
22%
Commercial Retrofits
29%
Energy Efficient
Appliances and
Electronics49%
Nationwide Investment in Building-Related Energy Efficiency, 2004
$179 billion total
Sources: Energy Information Administration 2011Ehrhardt‐Martinez, Karen and John “Skip” Laitner, The Size of the U.S. Energy Efficiency Market: Generating a More Complete Picture, American Council for an Energy Efficient Economy (ACEEE), 2008.
Economics of Energy Efficiency Dara Goldberg ‘08 | 16
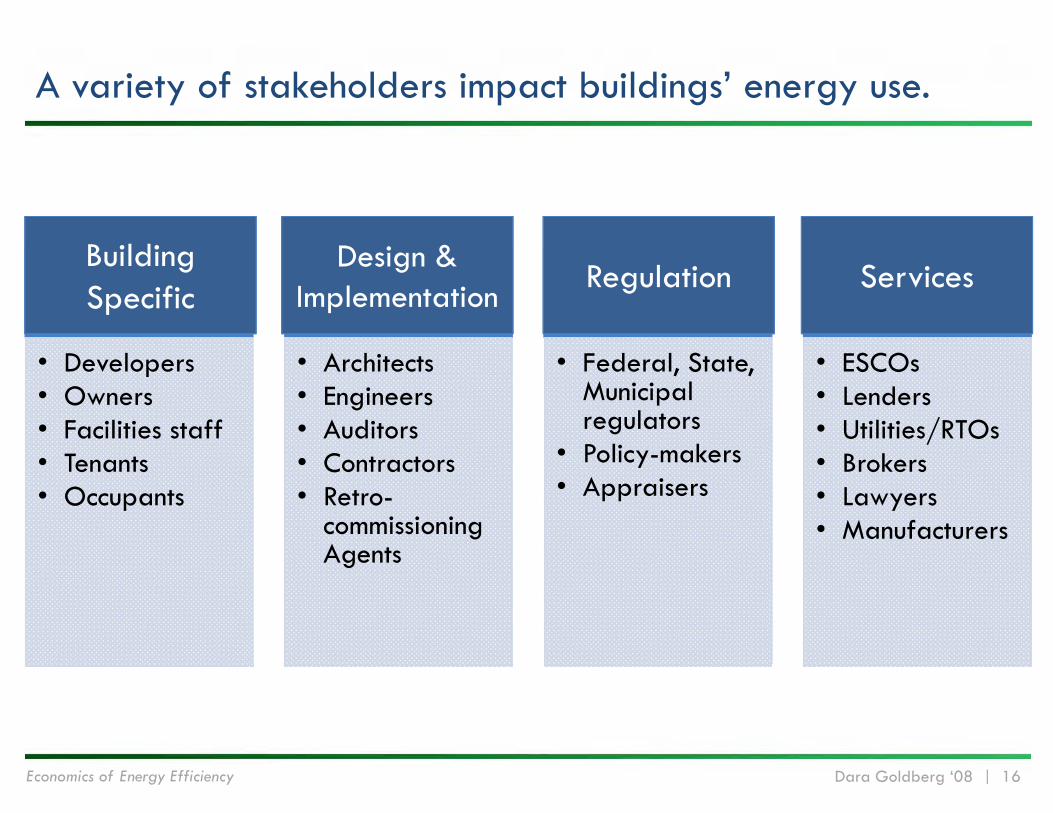
A variety of stakeholders impact buildings’ energy use.
• Developers• Owners• Facilities staff• Tenants• Occupants
• Architects• Engineers• Auditors• Contractors• Retro-
commissioning Agents
• Federal, State, Municipal regulators
• Policy-makers• Appraisers
• ESCOs• Lenders• Utilities/RTOs• Brokers• Lawyers• Manufacturers
Building Specific
Design & Implementation Regulation Services
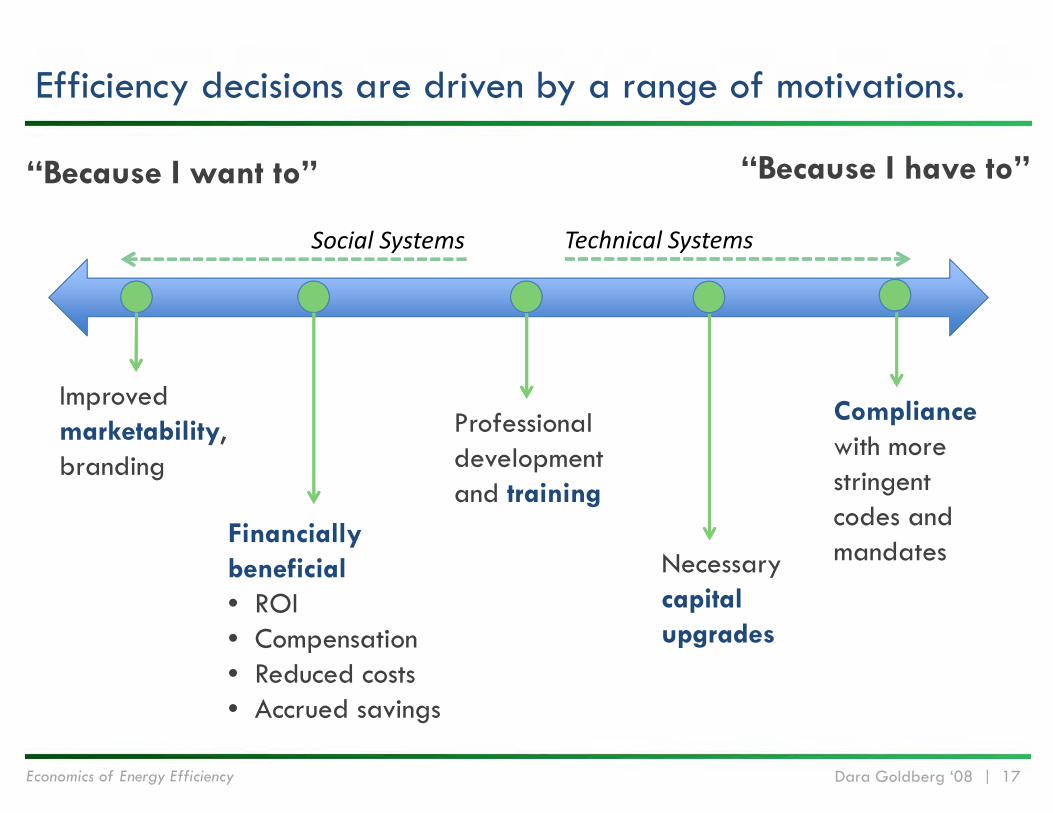
Economics of Energy Efficiency Dara Goldberg ‘08 | 17
Efficiency decisions are driven by a range of motivations.
“Because I want to” “Because I have to”
Improved marketability, branding
Financially beneficial• ROI• Compensation• Reduced costs• Accrued savings
Professional development and training
Necessary capital upgrades
Compliancewith more stringent codes and mandates
Social Systems Technical Systems
Economics of Energy Efficiency Dara Goldberg ‘08 | 18
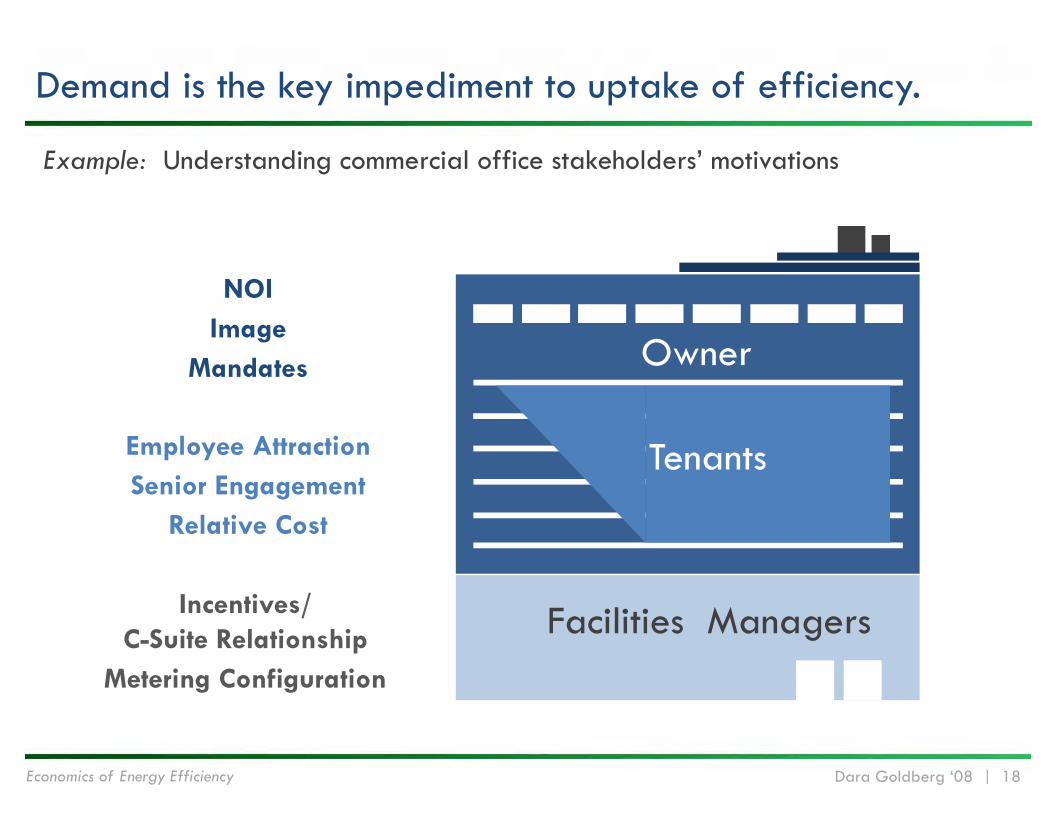
Demand is the key impediment to uptake of efficiency.
Tenants
Owner
Facilities Managers
Example: Understanding commercial office stakeholders’ motivations
NOIImage
Mandates
Incentives/C-Suite Relationship
Metering Configuration
Employee AttractionSenior Engagement
Relative Cost
Economics of Energy Efficiency Dara Goldberg ‘08 | 19
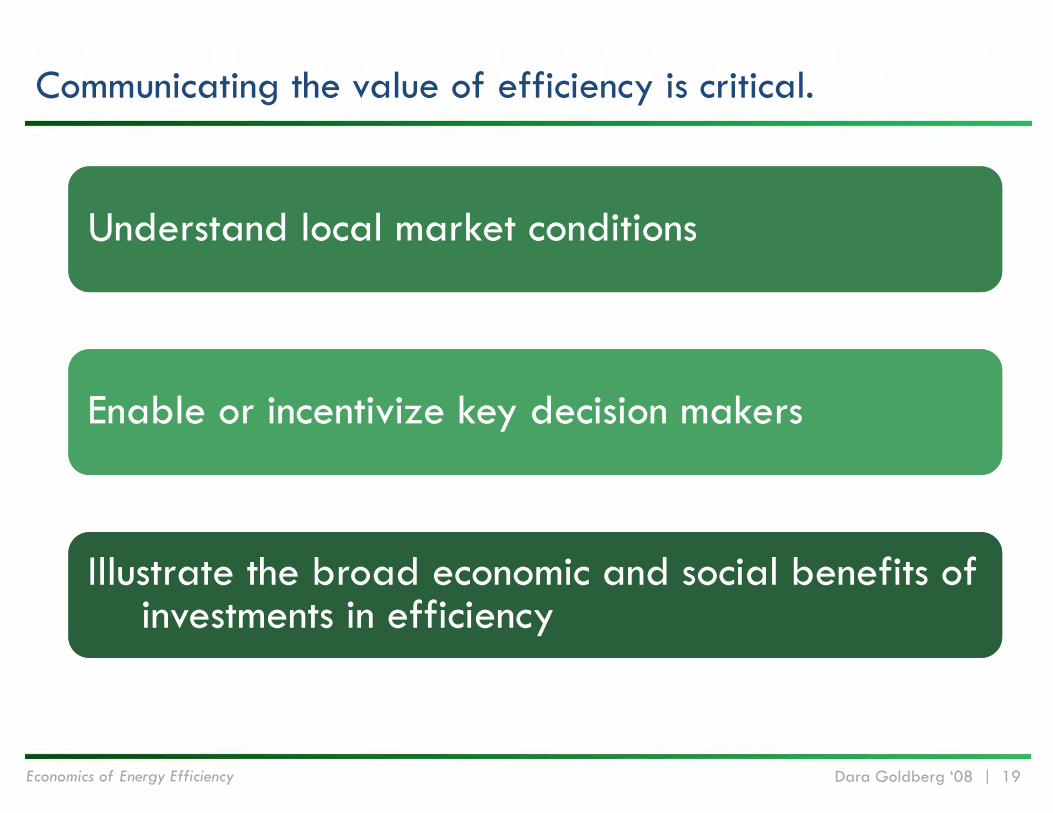
Communicating the value of efficiency is critical.
Understand local market conditionsUnderstand local market conditions
Enable or incentivize key decision makersEnable or incentivize key decision makers
Illustrate the broad economic and social benefits of investments in efficiency
Illustrate the broad economic and social benefits of investments in efficiency

experience
economics of efficiency
case studies
Economics of Energy Efficiency Dara Goldberg ‘08 | 21
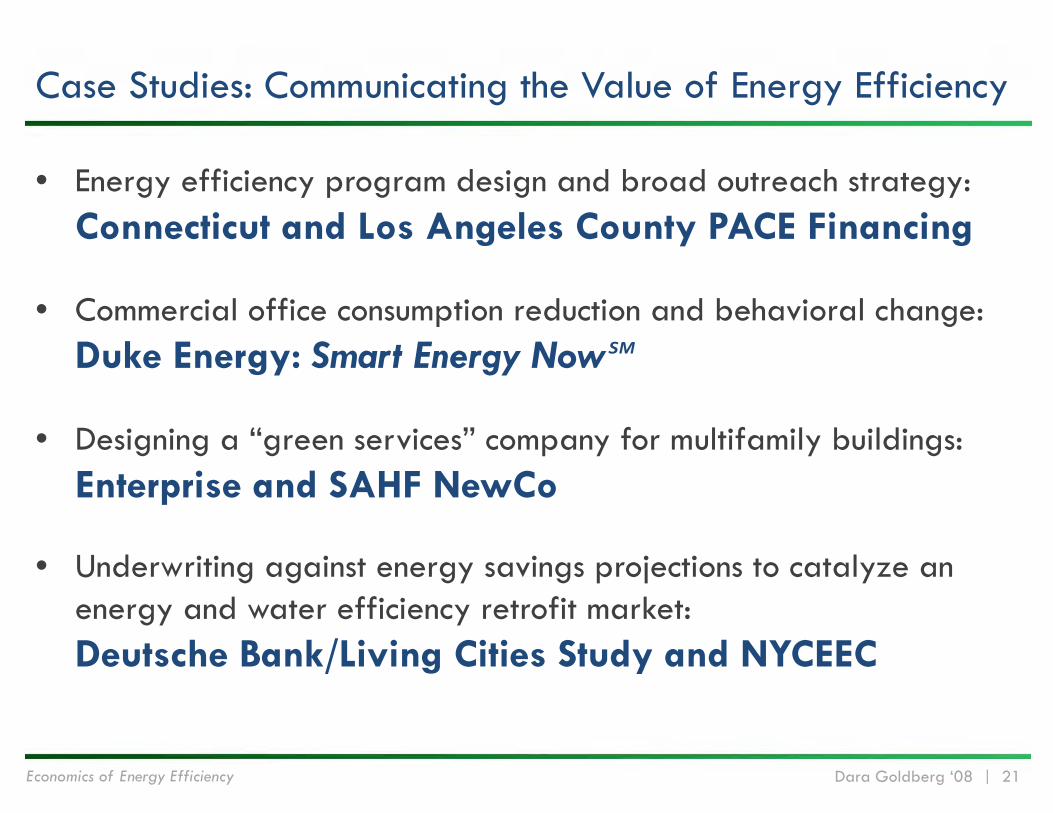
Case Studies: Communicating the Value of Energy Efficiency
• Energy efficiency program design and broad outreach strategy: Connecticut and Los Angeles County PACE Financing
• Commercial office consumption reduction and behavioral change:Duke Energy: Smart Energy Now℠
• Designing a “green services” company for multifamily buildings:Enterprise and SAHF NewCo
• Underwriting against energy savings projections to catalyze an energy and water efficiency retrofit market:Deutsche Bank/Living Cities Study and NYCEEC

CASE STUDYConnecticut and Los Angeles PACE Financing
Economics of Energy Efficiency Dara Goldberg ‘08 | 23
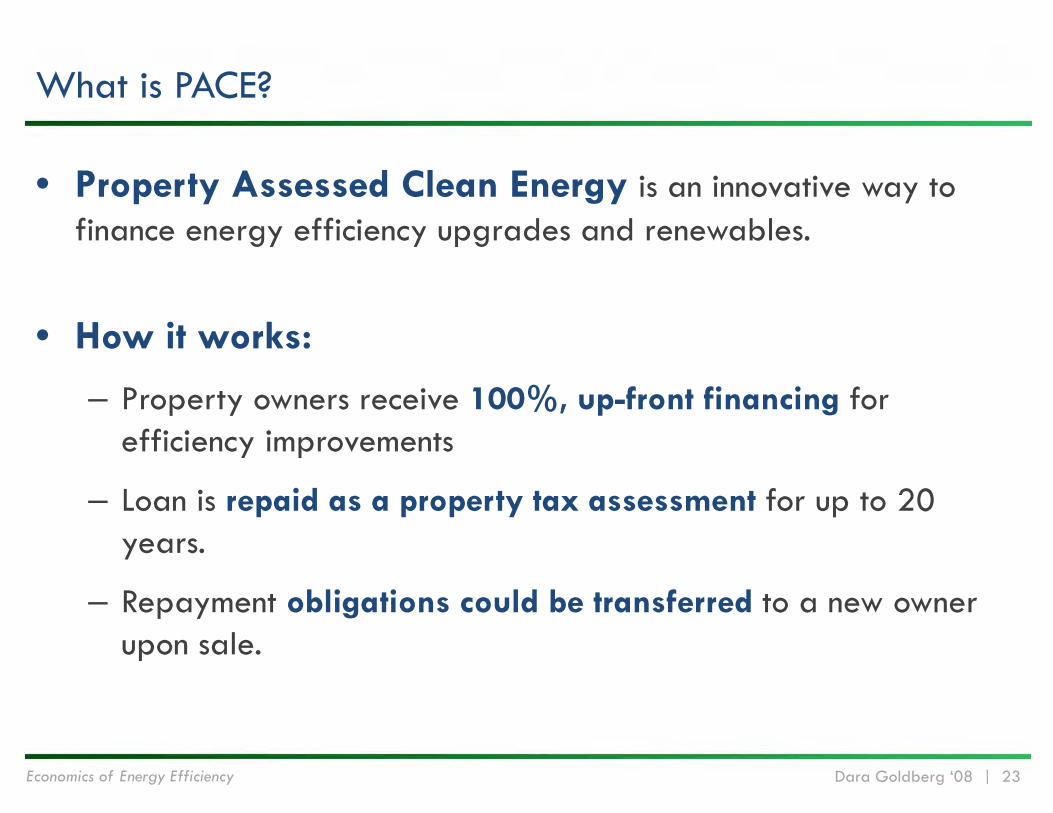
What is PACE?
• Property Assessed Clean Energy is an innovative way to finance energy efficiency upgrades and renewables.
• How it works:
– Property owners receive 100%, up-front financing for efficiency improvements
– Loan is repaid as a property tax assessment for up to 20 years.
– Repayment obligations could be transferred to a new owner upon sale.
Economics of Energy Efficiency Dara Goldberg ‘08 | 24
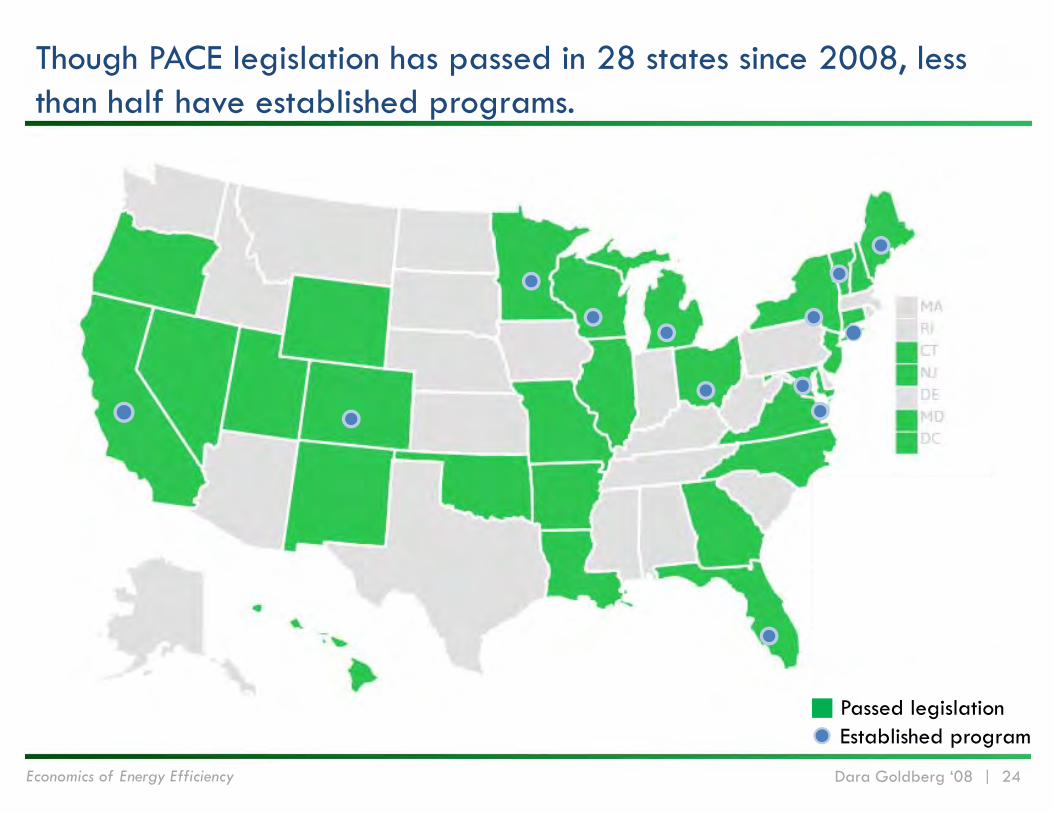
Though PACE legislation has passed in 28 states since 2008, less than half have established programs.
Passed legislationEstablished program
Economics of Energy Efficiency Dara Goldberg ‘08 | 25
Our goal was to help CT and LA County to:
• Segment the market to determine ownership and geographic concentration.
• Identify opportunity targets based on physical characteristics and financial health.
• Triage opportunities and design an outreach strategy that helps nascent programs with limited capacity market financial products to most likely participants.
• Create a searchable database of target properties and relative characteristics.
Economics of Energy Efficiency Dara Goldberg ‘08 | 26
Good candidates for PACE financing are:
Properties in good financial health
Owners that use 3rd party financing
Owners that make capital investment decisions locally (and borrow locally)
Owners willing to borrow at or above market rate
Owners that pay property taxes
Large tenants with interest in reducing operating expenses

Economics of Energy Efficiency Dara Goldberg ‘08 | 27
Size Medium to large properties tend to have more sophisticated owners, who are more likely to be convinced of the benefits of EE investment.
Owner Owners of large portfolios or those more likely to use 3rd party financing to upgrade a number of properties.
Mgmt Self-managed properties are usually better incentivized to invest in EE.
Age Owners of aging buildings in need of capital repair might already be contemplating investment, upon which EE financing could be piggy-backed.
Vacancy In a price-sensitive market, EE improvements might be marketed as a cost effective means to reduce vacancy.
RE experience-based rules of thumb helped to further sort for target owners and properties.
Economics of Energy Efficiency Dara Goldberg ‘08 | 28
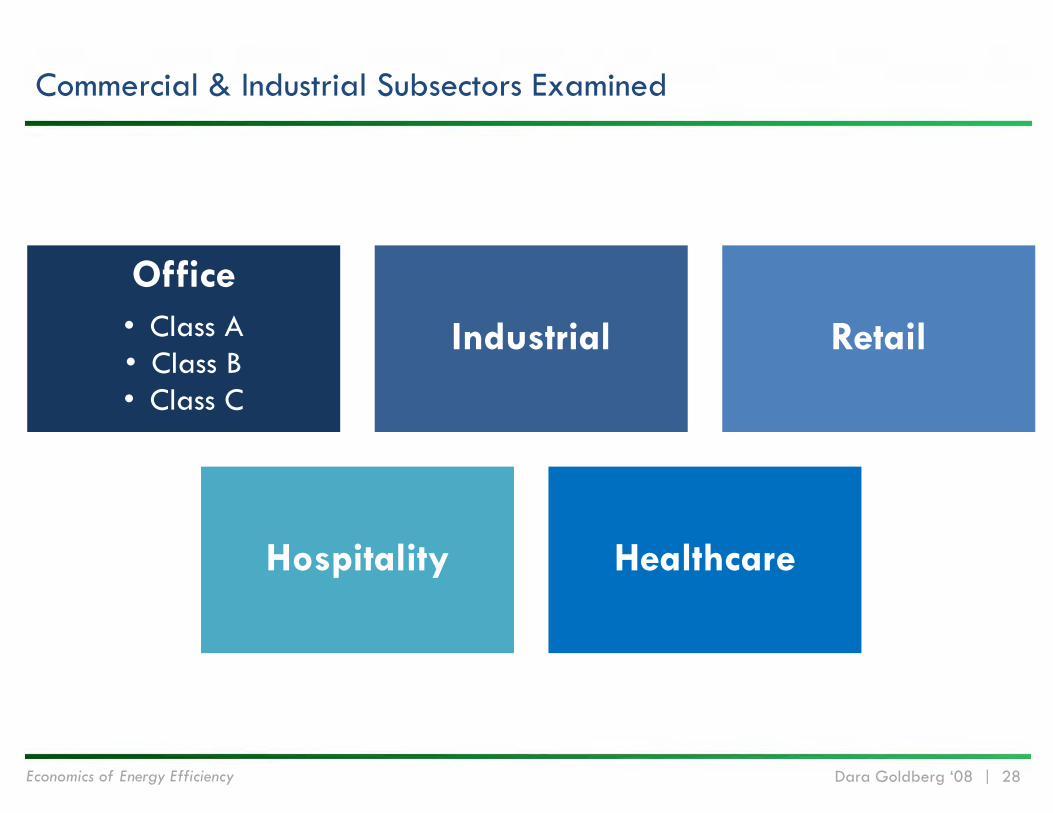
Office• Class A • Class B• Class C
Industrial Retail
Hospitality Healthcare
Commercial & Industrial Subsectors Examined
Economics of Energy Efficiency Dara Goldberg ‘08 | 29
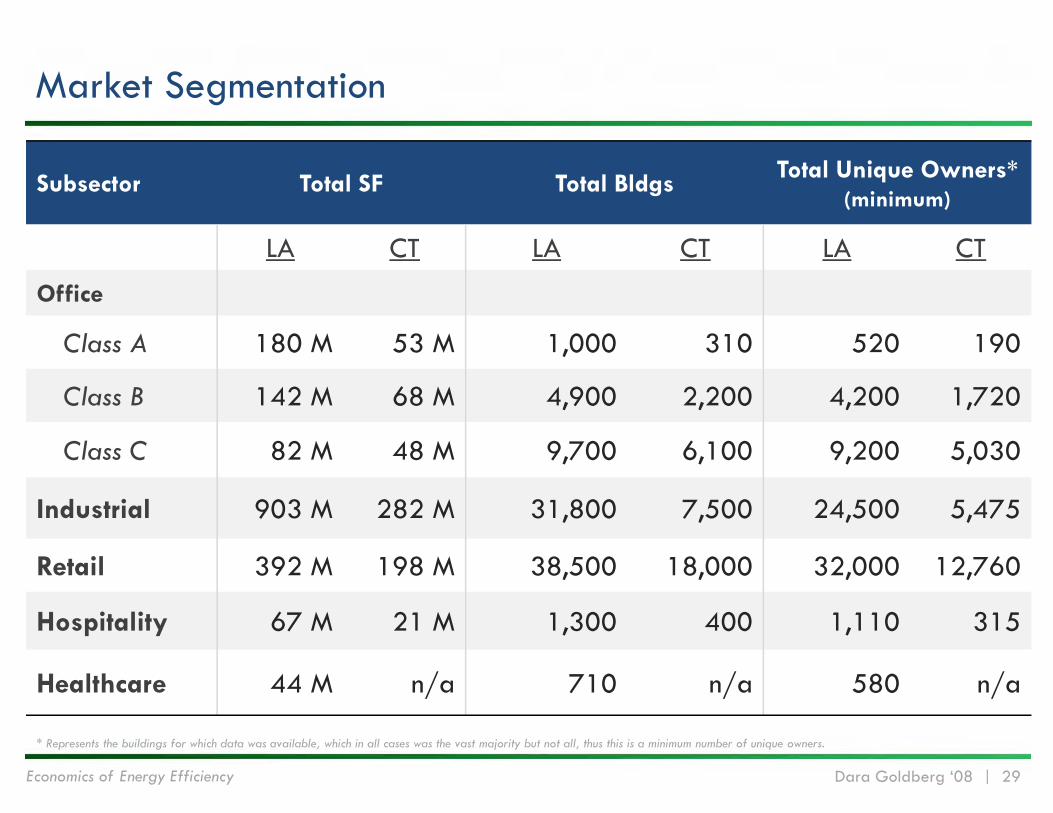
Market Segmentation
Subsector Total SF Total Bldgs Total Unique Owners*(minimum)
LA CT LA CT LA CT
Office
Class A 180 M 53 M 1,000 310 520 190
Class B 142 M 68 M 4,900 2,200 4,200 1,720
Class C 82 M 48 M 9,700 6,100 9,200 5,030
Industrial 903 M 282 M 31,800 7,500 24,500 5,475
Retail 392 M 198 M 38,500 18,000 32,000 12,760
Hospitality 67 M 21 M 1,300 400 1,110 315
Healthcare 44 M n/a 710 n/a 580 n/a
* Represents the buildings for which data was available, which in all cases was the vast majority but not all, thus this is a minimum number of unique owners.
Economics of Energy Efficiency Dara Goldberg ‘08 | 30
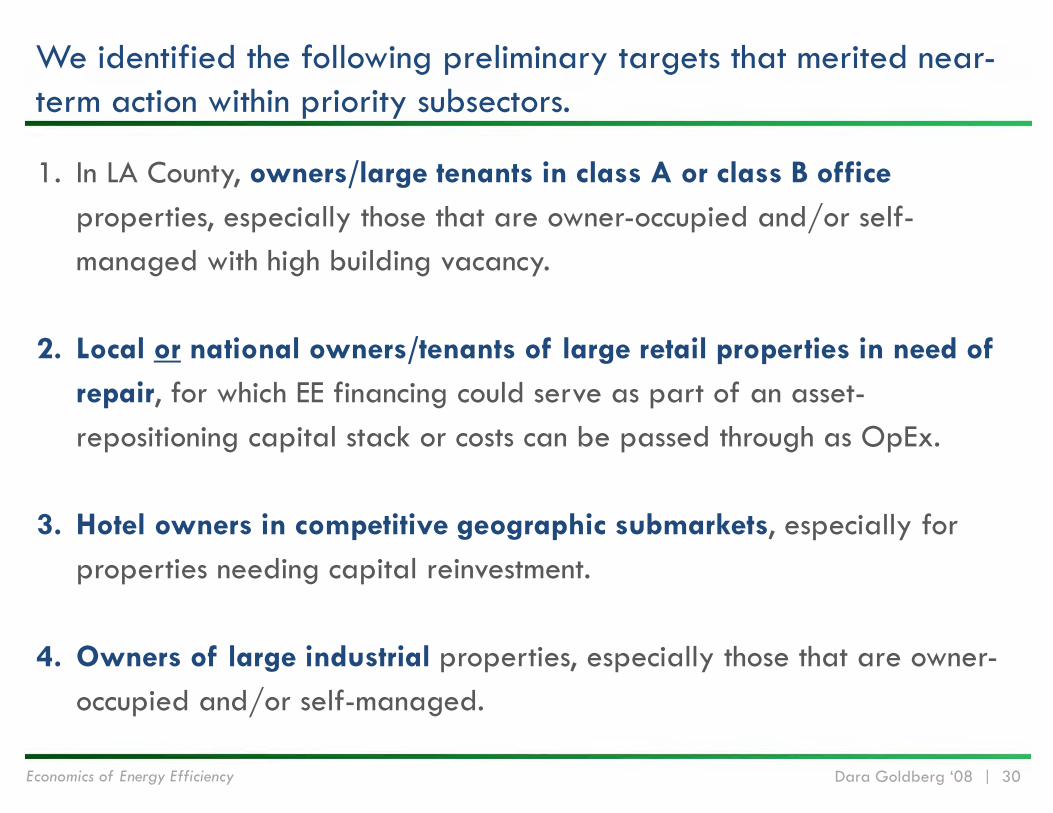
We identified the following preliminary targets that merited near-term action within priority subsectors.
1. In LA County, owners/large tenants in class A or class B office properties, especially those that are owner-occupied and/or self-managed with high building vacancy.
2. Local or national owners/tenants of large retail properties in need of repair, for which EE financing could serve as part of an asset-repositioning capital stack or costs can be passed through as OpEx.
3. Hotel owners in competitive geographic submarkets, especially for properties needing capital reinvestment.
4. Owners of large industrial properties, especially those that are owner-occupied and/or self-managed.
Economics of Energy Efficiency Dara Goldberg ‘08 | 31
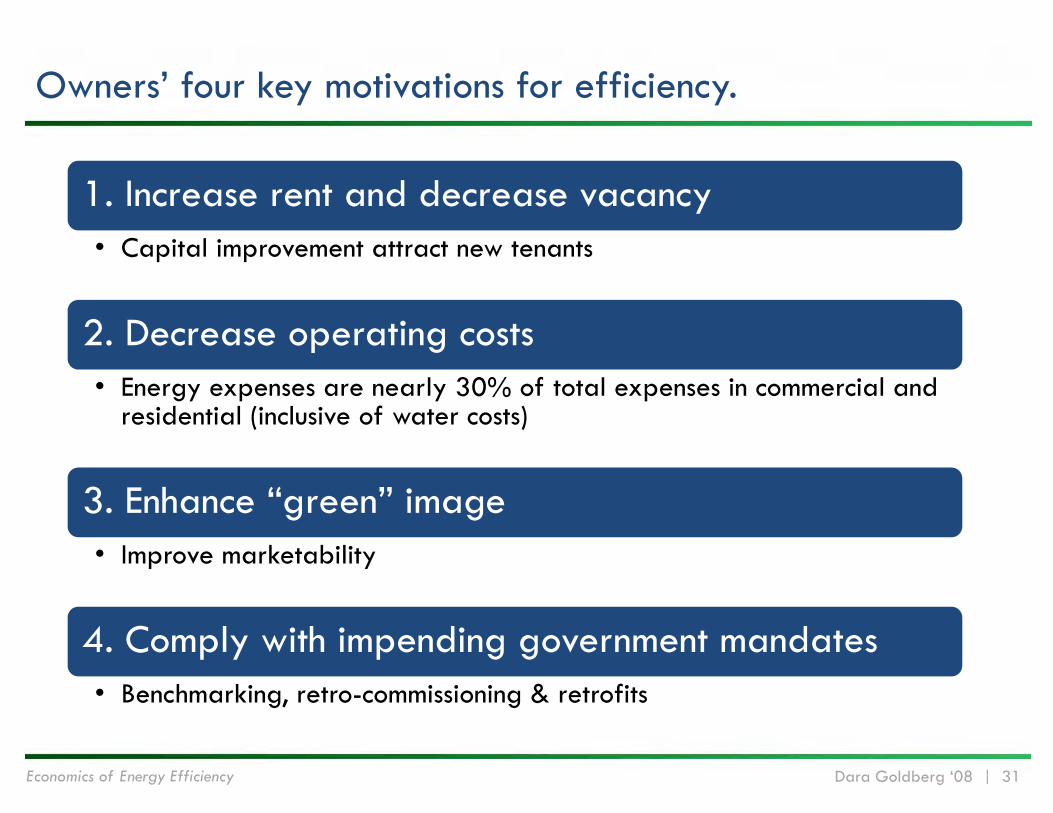
Owners’ four key motivations for efficiency.
1. Increase rent and decrease vacancy• Capital improvement attract new tenants
2. Decrease operating costs• Energy expenses are nearly 30% of total expenses in commercial and
residential (inclusive of water costs)
3. Enhance “green” image• Improve marketability
4. Comply with impending government mandates• Benchmarking, retro-commissioning & retrofits
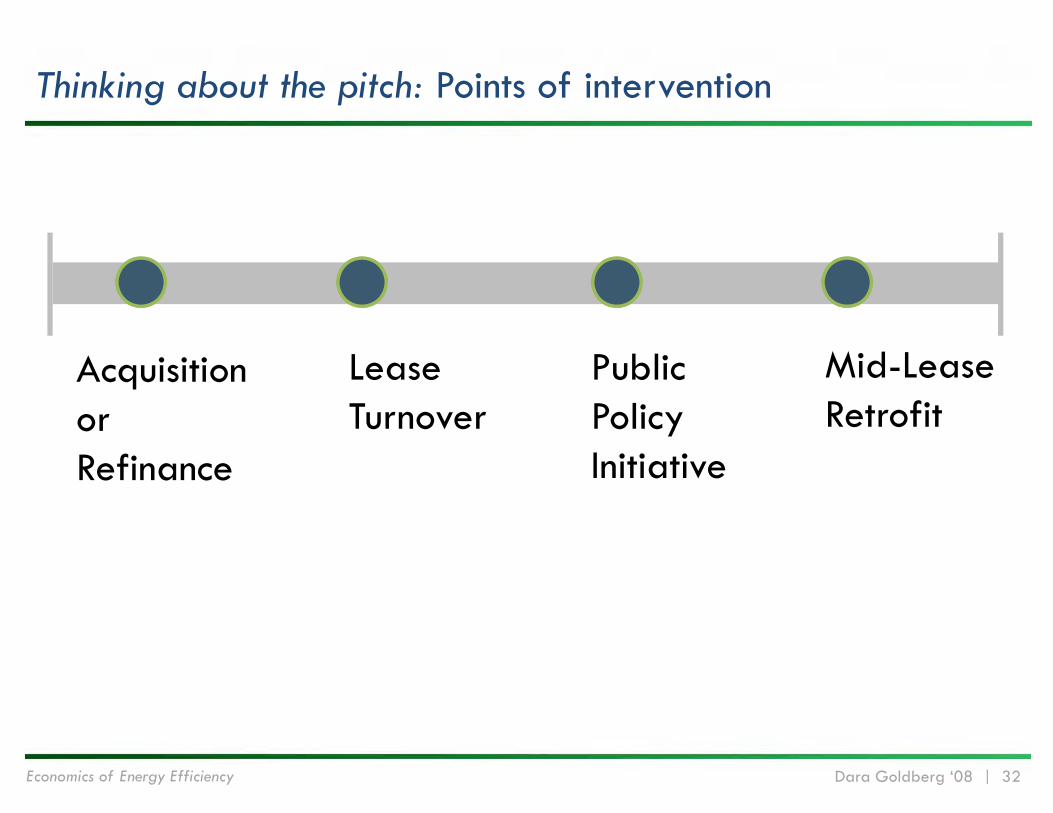
Economics of Energy Efficiency Dara Goldberg ‘08 | 32
Thinking about the pitch: Points of intervention
Mid-LeaseRetrofit
LeaseTurnover
PublicPolicyInitiative
AcquisitionorRefinance
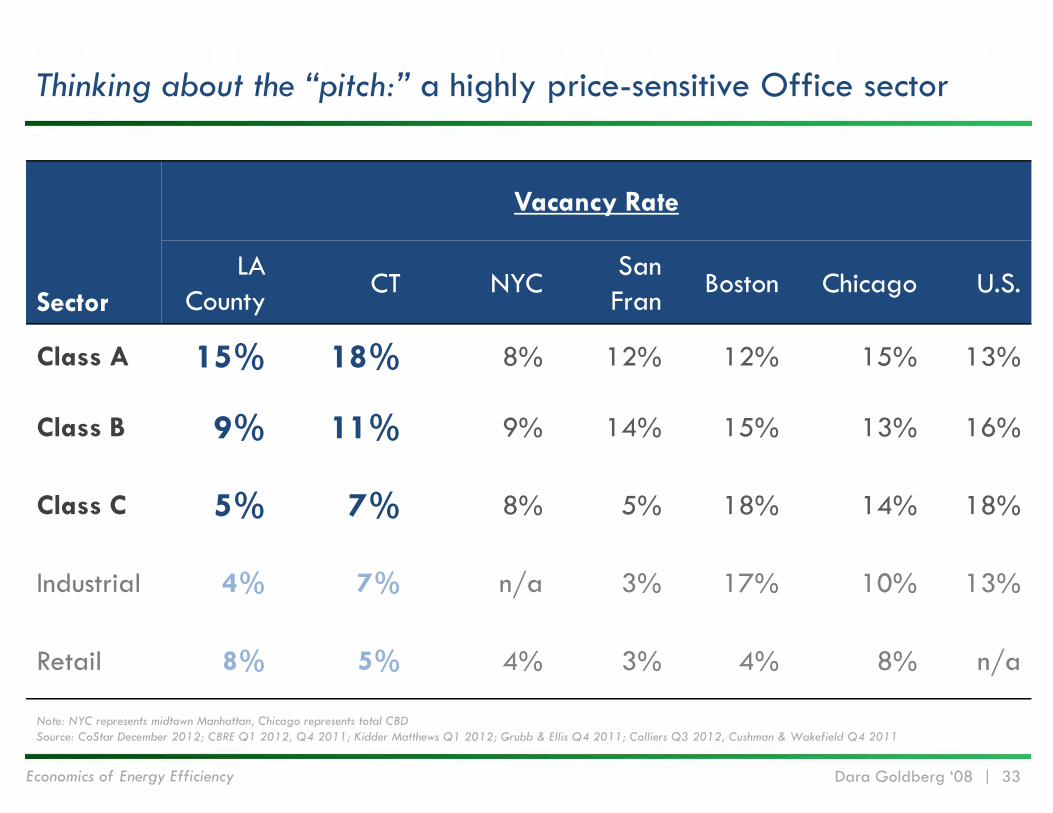
Economics of Energy Efficiency Dara Goldberg ‘08 | 33
Thinking about the “pitch:” a highly price-sensitive Office sector
Note: NYC represents midtown Manhattan, Chicago represents total CBDSource: CoStar December 2012; CBRE Q1 2012, Q4 2011; Kidder Matthews Q1 2012; Grubb & Ellis Q4 2011; Colliers Q3 2012, Cushman & Wakefield Q4 2011
Sector
Vacancy Rate
LA County
CT NYCSan Fran
Boston Chicago U.S.
Class A 15% 18% 8% 12% 12% 15% 13%
Class B 9% 11% 9% 14% 15% 13% 16%
Class C 5% 7% 8% 5% 18% 14% 18%
Industrial 4% 7% n/a 3% 17% 10% 13%
Retail 8% 5% 4% 3% 4% 8% n/a
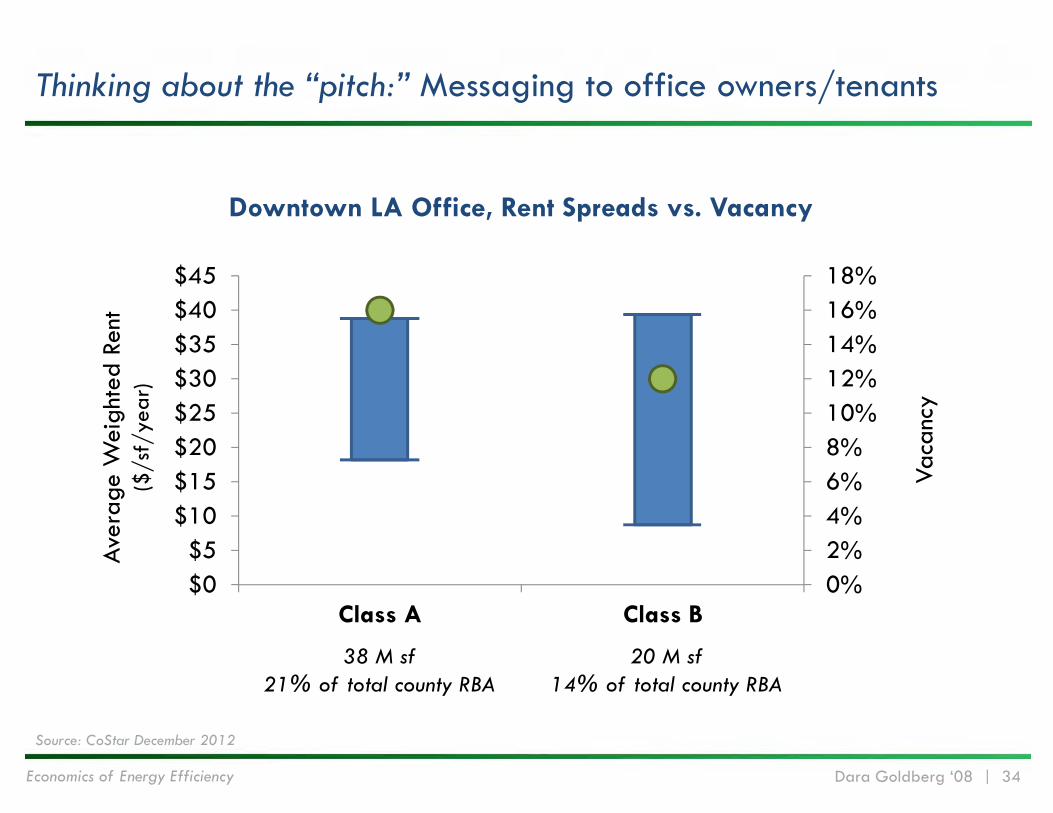
Economics of Energy Efficiency Dara Goldberg ‘08 | 34
Thinking about the “pitch:” Messaging to office owners/tenantsAv
erag
e W
eigh
ted
Rent
($
/sf/
year
)
Vaca
ncy
Downtown LA Office, Rent Spreads vs. Vacancy
0%2%4%6%8%10%12%14%16%18%
$0$5
$10$15$20$25$30$35$40$45
Class A Class B
38 M sf21% of total county RBA
20 M sf14% of total county RBA
Source: CoStar December 2012
Economics of Energy Efficiency Dara Goldberg ‘08 | 35
Thinking about the “pitch:” Working with retail owners and tenants
Consider viability of large-scale retail owners as pass-through vehicles for financing to large, national tenants with complex processes for securing capital funds.
Devise messaging that is sensitive to nature of space conditioning, lease structure and energy use cost sharing in malls vs. strip-centers vs. freestanding structures.
Identify financial thresholds at which owners (or large tenants) would be interesting in participating in PACE program
Communicate prerequisites for collaboration with a start-up public program, e.g., regarding transparency of decision-making, timing of receipt funds, simplicity of application, etc.
CASE STUDYDuke Energy: Smart Energy Now℠
Economics of Energy Efficiency Dara Goldberg ‘08 | 37
Envision Charlotte and Smart Energy Now℠
“A first-of-its-kind collaborative partnership in Charlotte’s center city to create the most environmentally sustainable urban core in the nation.”
Announced Sept ’10 at Clinton Global Initiative
Economics of Energy Efficiency Dara Goldberg ‘08 | 38
Smart Energy Now℠ Overview
• 20% electric consumption reduction in Uptown offices by 2016
• 5% due to information sharing and behavioral changes
Goal
• All buildings over 10,000 SF office space
• ~67 buildings, 20M SFLogistics

Economics of Energy Efficiency Dara Goldberg ‘08 | 39
Task: design a community engagement strategy.
Develop community engagement strategy to reach 75,000 workers
Design lobby display and web content
Create energy champions program
Achieve 5% energy savings

Economics of Energy Efficiency Dara Goldberg ‘08 | 40
Lobby displays are an essential part, but can’t do it all.
Messaging Strategy Facilitated by display?
Senior-level engagement
Duke leading by example
Access to capital incentives
Education/technical support
Information feedback
Energy champions
Actionable tips
Commitments and recognition
Social norm messaging
Economics of Energy Efficiency Dara Goldberg ‘08 | 41
The office market is dominated by Class A buildings.
Source: CB Richard Ellis, MarketView Q1 2011; CoStar
Class A
Class B
Class C
Office Building Class by Percentage Square Footage
Class A
Class B
Class C
Class A
Class B/C
36.9M TOTAL SF
Uptown CharlotteManhattanBoston CBD
15.6M TOTAL SF539.2M TOTAL SF

Economics of Energy Efficiency Dara Goldberg ‘08 | 42
Electric use is more intensive than the nation and region.
Source: Duke Energy; EIA 2003 Commercial Buildings Energy Consumption Survey, 2006
25.6
16.8 17.3
12.0 14.0 16.0 18.0 20.0 22.0 24.0 26.0 28.0
Uptown CharlotteParticipant Average
Climate ZoneAverage
National Average
Electricity Use Intensity Uptown Charlotte vs. Regional and National Averages
kWh
per
squa
re f
oot
Note: Uptown Charlotte average was taken for 61 participating buildings for which data was available. Climate Zone and National Averages are taken for commercial office; Charlotte’s Climate Zone is defined by the EIA as having less than 2,000 Cooling Degree Days and less than 4,000 Heating Degree Days.
Uptown Charlotte Participant Average
Economics of Energy Efficiency Dara Goldberg ‘08 | 43
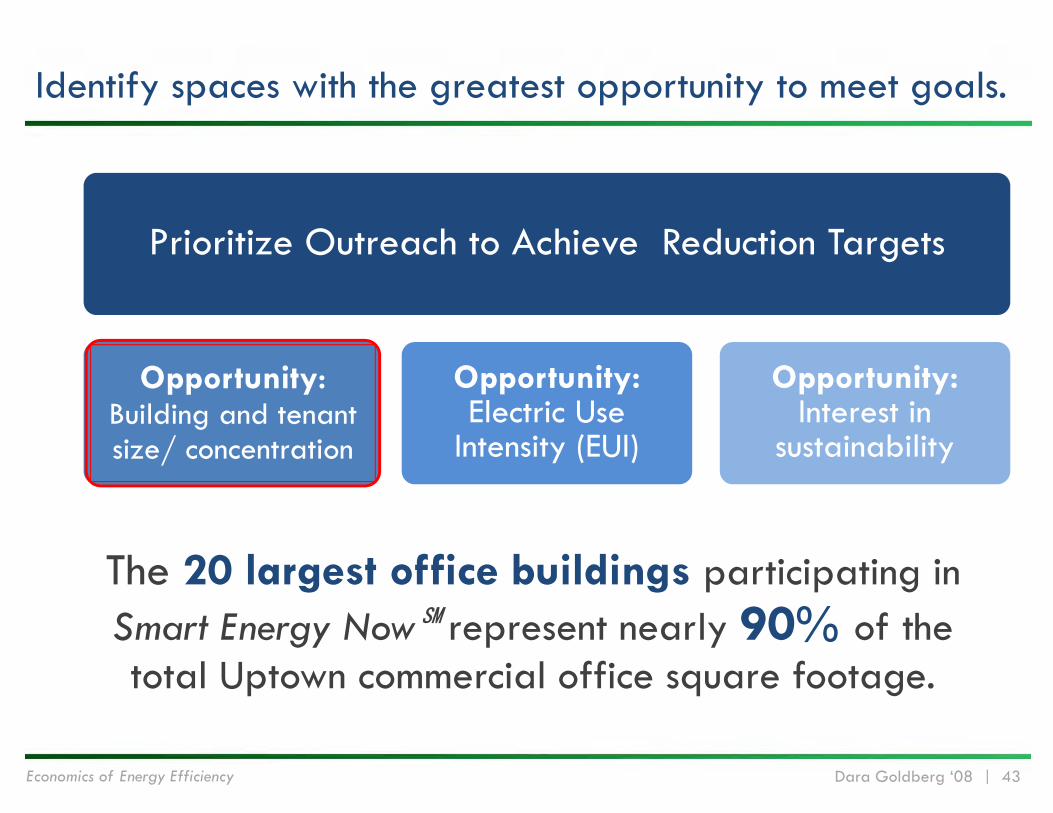
Identify spaces with the greatest opportunity to meet goals.
The 20 largest office buildings participating in Smart Energy Now℠ represent nearly 90% of the total Uptown commercial office square footage.
Prioritize Outreach to Achieve Reduction Targets
Opportunity:Building and tenant size/ concentration
Opportunity:Electric Use
Intensity (EUI)
Opportunity: Interest in
sustainability
Opportunity:Building and tenant size/ concentration
Economics of Energy Efficiency Dara Goldberg ‘08 | 44
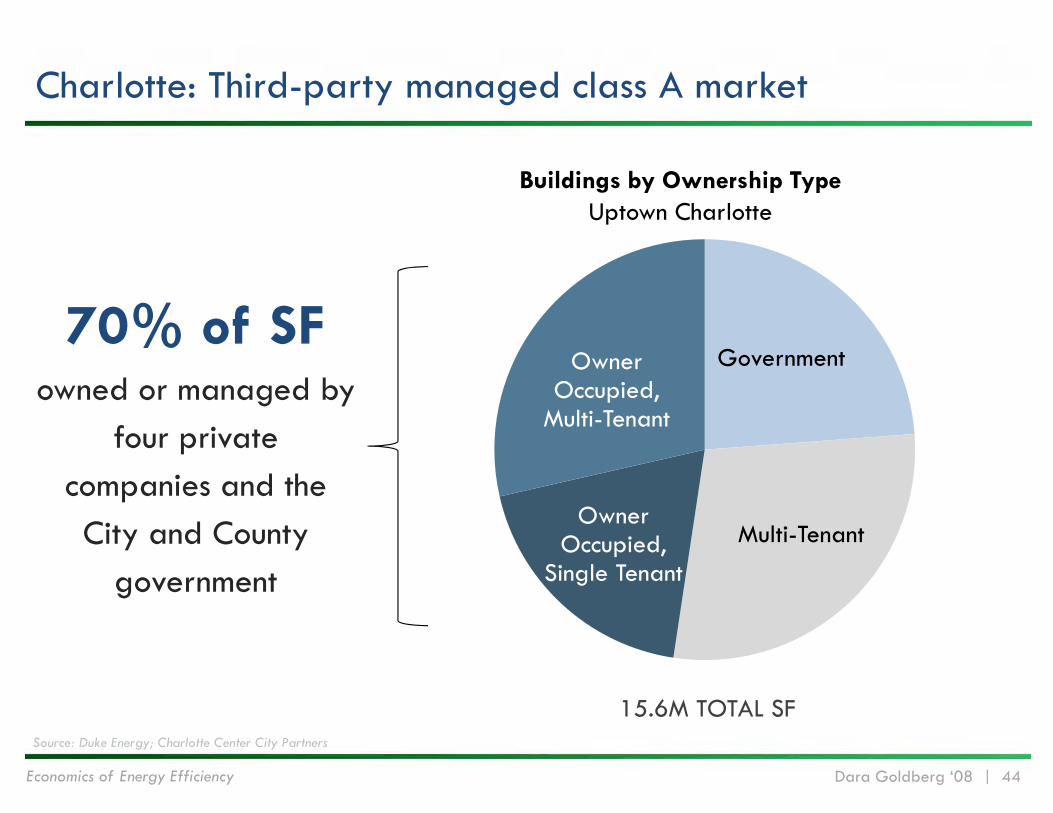
Charlotte: Third-party managed class A market
Source: Duke Energy; Charlotte Center City Partners
Government
Multi-TenantOwner
Occupied, Single Tenant
Owner Occupied,
Multi-Tenant
Buildings by Ownership TypeUptown Charlotte
15.6M TOTAL SF
70% of SFowned or managed by
four private companies and the City and County
government

Economics of Energy Efficiency Dara Goldberg ‘08 | 45
Charlotte: Breakdown of Energy Use & Cost
Base Building
Tenant Space
70% of Energy Use
30% of Energy Use
Landlord pays full building cost (master‐metered)
Energy cost included in tenant rent
Economics of Energy Efficiency Dara Goldberg ‘08 | 46
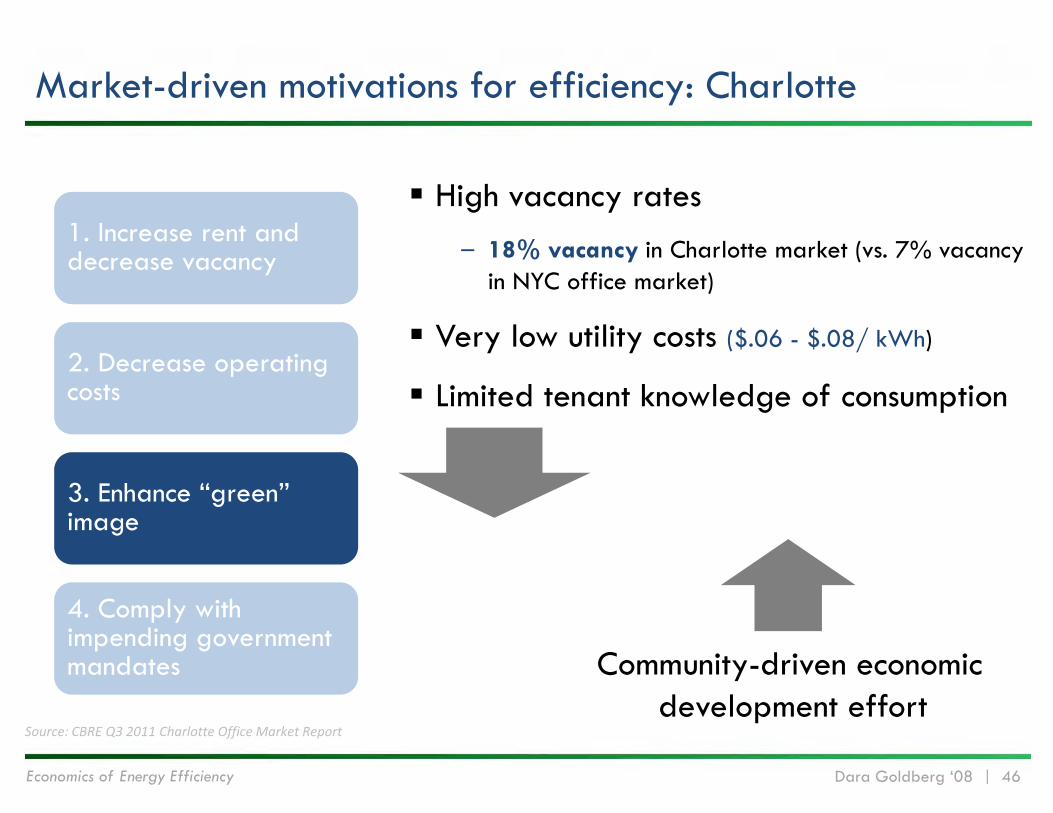
Source: CBRE Q3 2011 Charlotte Office Market Report
1. Increase rent and decrease vacancy
2. Decrease operating costs
3. Enhance “green” image
4. Comply with impending government mandates
High vacancy rates– 18% vacancy in Charlotte market (vs. 7% vacancy
in NYC office market)
Very low utility costs ($.06 - $.08/ kWh)
Limited tenant knowledge of consumption
Community-driven economic development effort
Market-driven motivations for efficiency: Charlotte
Economics of Energy Efficiency Dara Goldberg ‘08 | 47
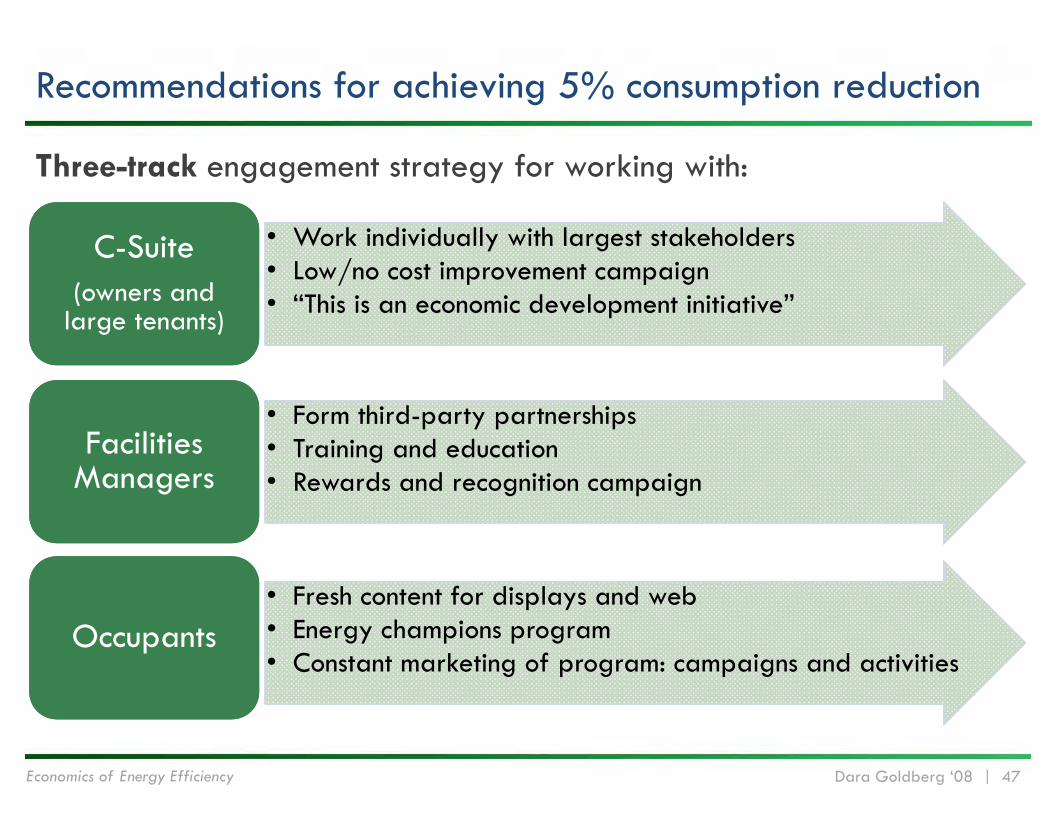
Recommendations for achieving 5% consumption reduction
Three-track engagement strategy for working with:
• Work individually with largest stakeholders• Low/no cost improvement campaign• “This is an economic development initiative”
C-Suite (owners and
large tenants)
C-Suite (owners and
large tenants)
• Form third-party partnerships• Training and education• Rewards and recognition campaign
Facilities ManagersFacilities
Managers
• Fresh content for displays and web• Energy champions program• Constant marketing of program: campaigns and activities
OccupantsOccupants
Economics of Energy Efficiency Dara Goldberg ‘08 | 48
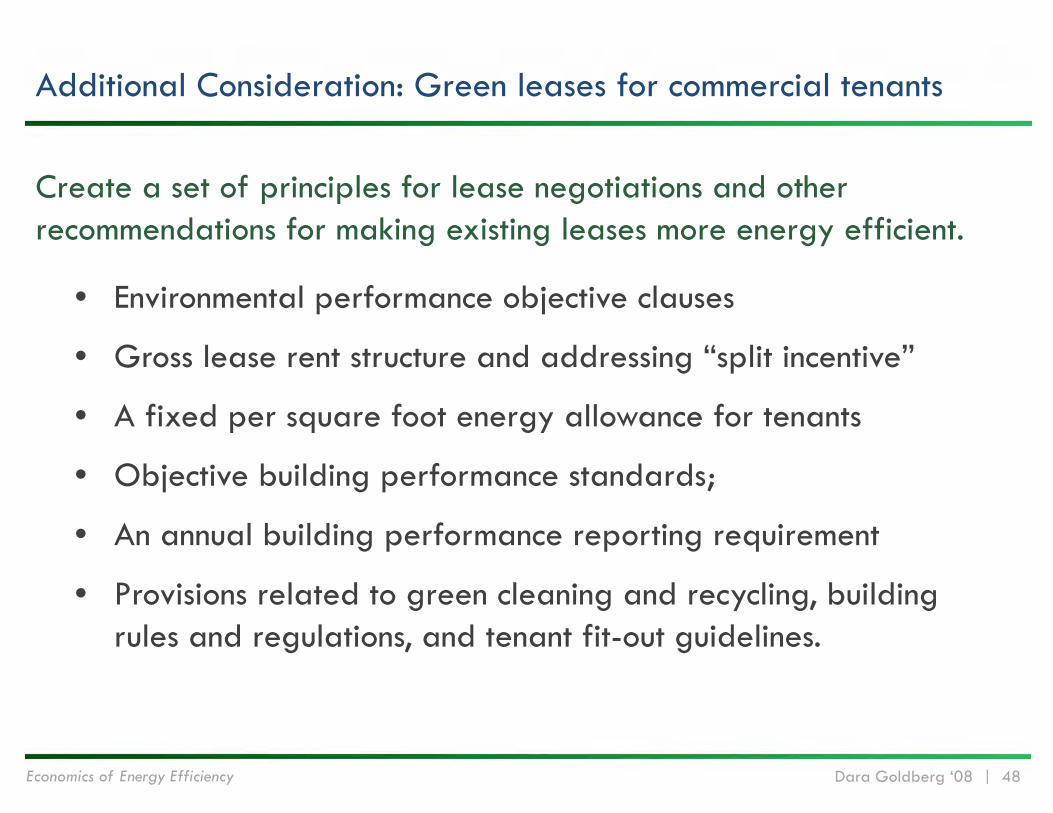
Additional Consideration: Green leases for commercial tenants
Create a set of principles for lease negotiations and other recommendations for making existing leases more energy efficient.
• Environmental performance objective clauses
• Gross lease rent structure and addressing “split incentive”
• A fixed per square foot energy allowance for tenants
• Objective building performance standards;
• An annual building performance reporting requirement
• Provisions related to green cleaning and recycling, building rules and regulations, and tenant fit-out guidelines.

CASE STUDYEnterprise and SAHF NewCo Green Services
Economics of Energy Efficiency Dara Goldberg ‘08 | 50
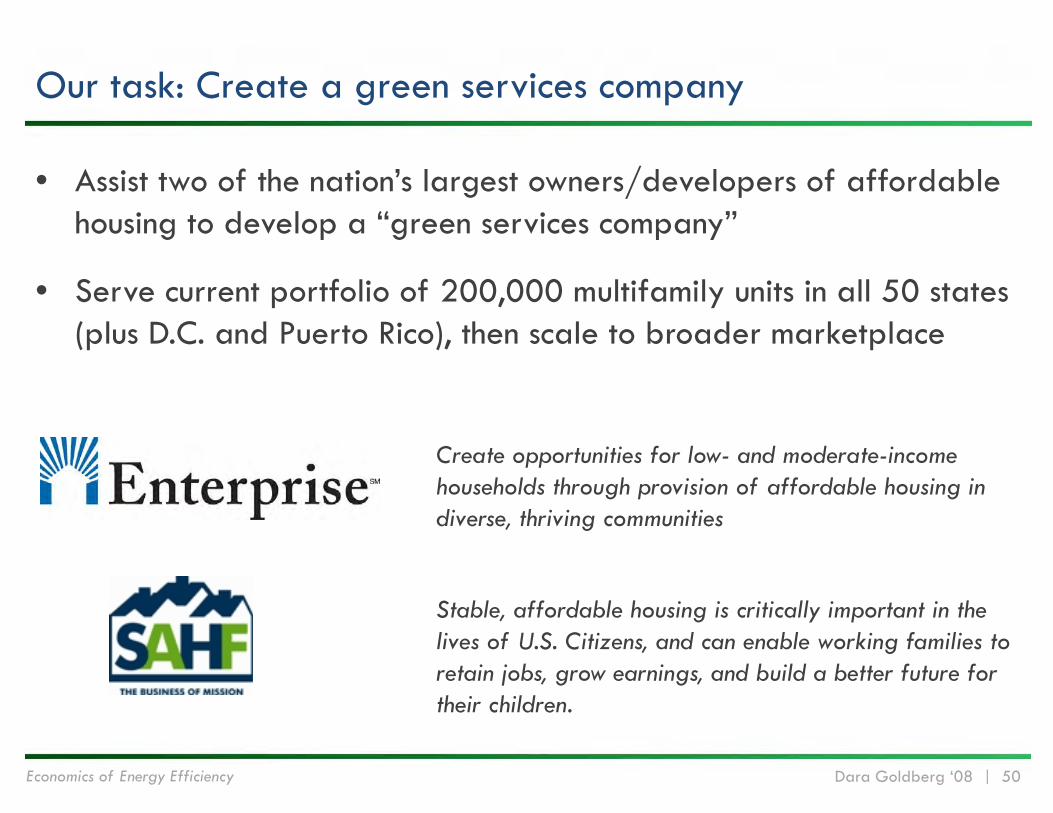
Our task: Create a green services company
• Assist two of the nation’s largest owners/developers of affordable housing to develop a “green services company”
• Serve current portfolio of 200,000 multifamily units in all 50 states (plus D.C. and Puerto Rico), then scale to broader marketplace
Create opportunities for low- and moderate-income households through provision of affordable housing in diverse, thriving communities
Stable, affordable housing is critically important in the lives of U.S. Citizens, and can enable working families to retain jobs, grow earnings, and build a better future for their children.
Economics of Energy Efficiency Dara Goldberg ‘08 | 51
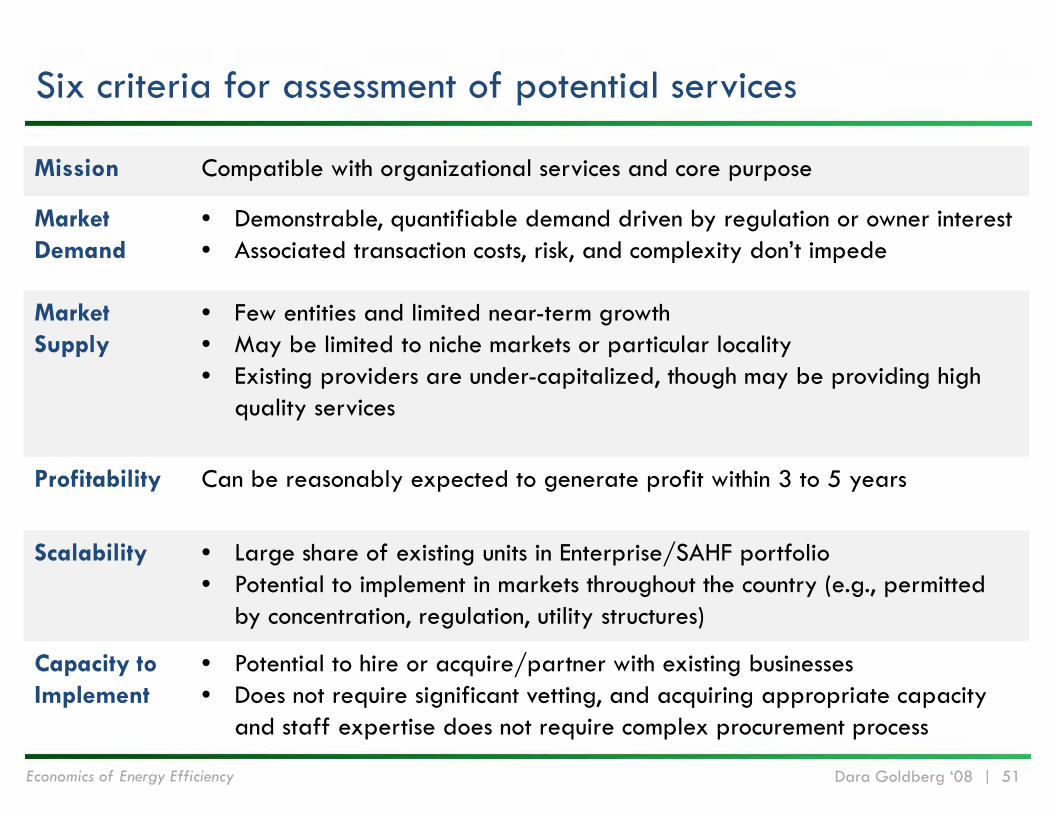
Six criteria for assessment of potential services
Mission Compatible with organizational services and core purpose
Market Demand
• Demonstrable, quantifiable demand driven by regulation or owner interest• Associated transaction costs, risk, and complexity don’t impede
Market Supply
• Few entities and limited near-term growth• May be limited to niche markets or particular locality• Existing providers are under-capitalized, though may be providing high
quality services
Profitability Can be reasonably expected to generate profit within 3 to 5 years
Scalability • Large share of existing units in Enterprise/SAHF portfolio• Potential to implement in markets throughout the country (e.g., permitted
by concentration, regulation, utility structures)
Capacity to Implement
• Potential to hire or acquire/partner with existing businesses• Does not require significant vetting, and acquiring appropriate capacity
and staff expertise does not require complex procurement process
Economics of Energy Efficiency Dara Goldberg ‘08 | 52
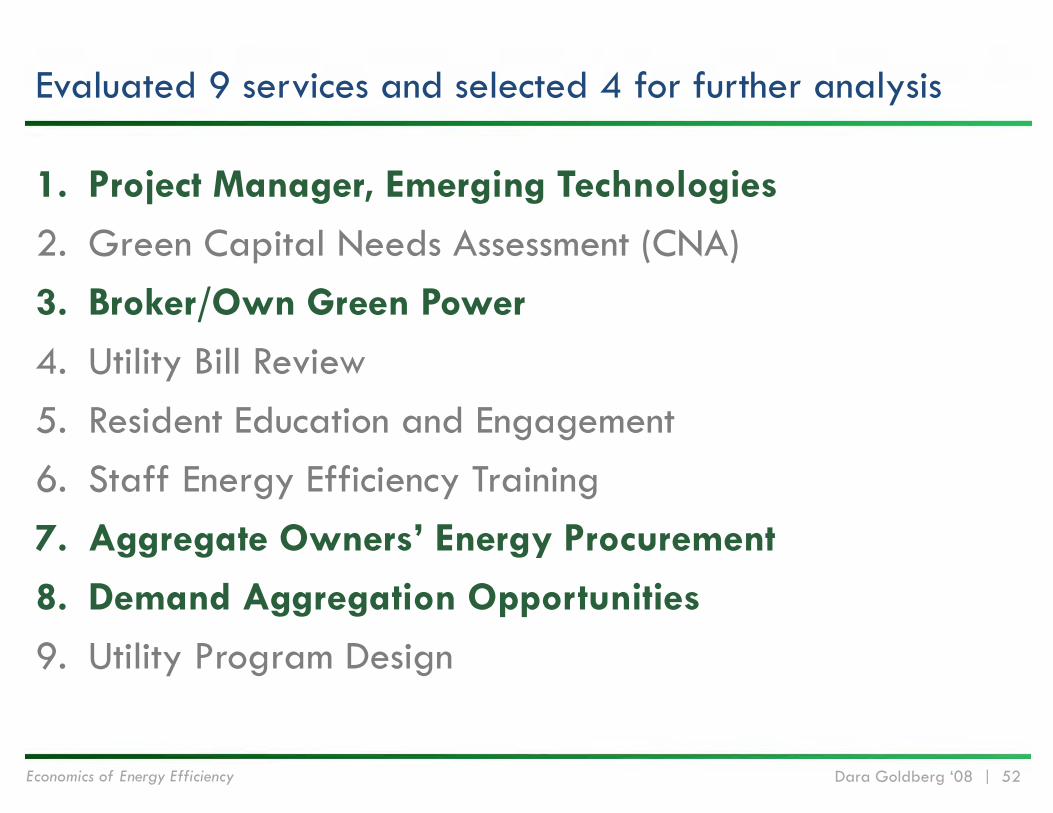
Evaluated 9 services and selected 4 for further analysis
1. Project Manager, Emerging Technologies
2. Green Capital Needs Assessment (CNA)3. Broker/Own Green Power
4. Utility Bill Review5. Resident Education and Engagement6. Staff Energy Efficiency Training7. Aggregate Owners’ Energy Procurement
8. Demand Aggregation Opportunities
9. Utility Program Design
Economics of Energy Efficiency Dara Goldberg ‘08 | 53
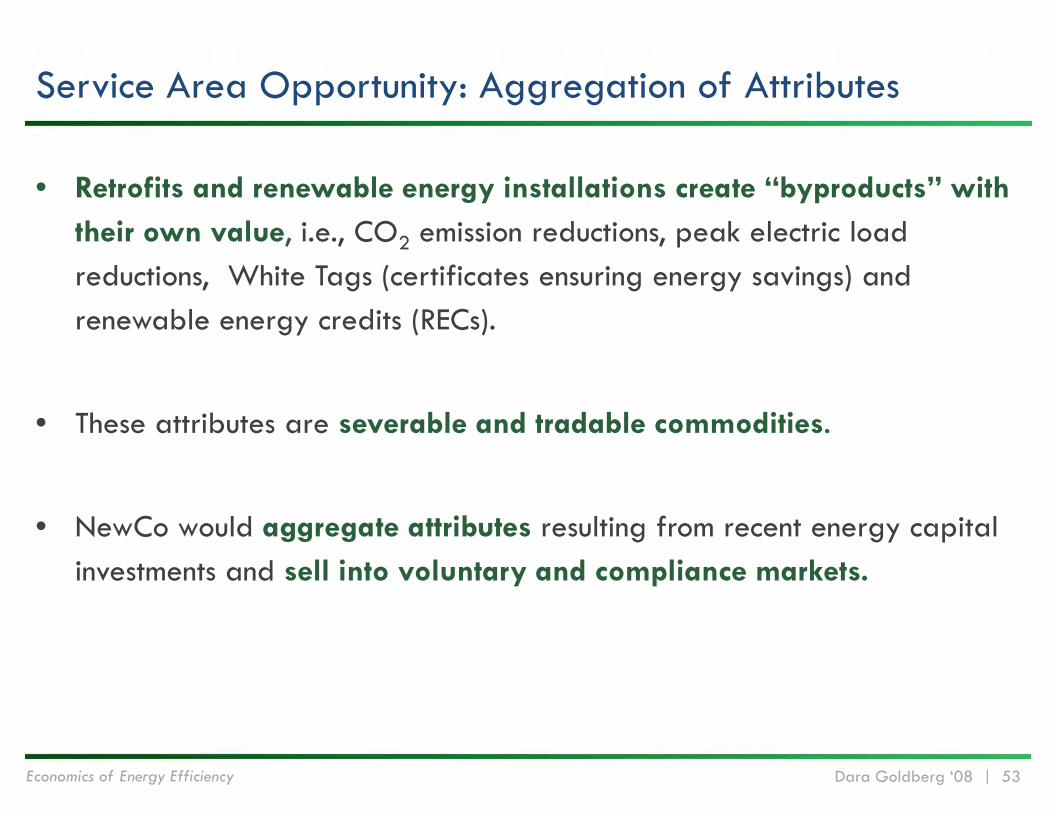
Service Area Opportunity: Aggregation of Attributes
• Retrofits and renewable energy installations create “byproducts” with their own value, i.e., CO2 emission reductions, peak electric load reductions, White Tags (certificates ensuring energy savings) and renewable energy credits (RECs).
• These attributes are severable and tradable commodities.
• NewCo would aggregate attributes resulting from recent energy capital investments and sell into voluntary and compliance markets.
Economics of Energy Efficiency Dara Goldberg ‘08 | 54
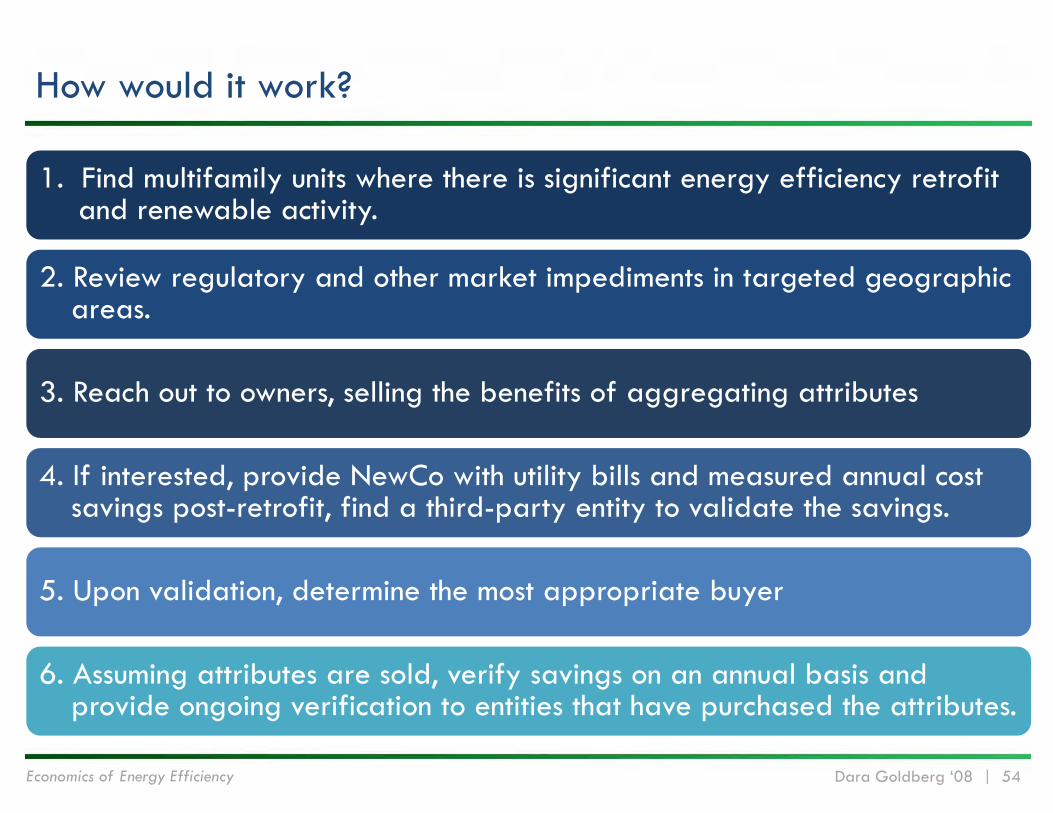
How would it work?
1. Find multifamily units where there is significant energy efficiency retrofit and renewable activity.
2. Review regulatory and other market impediments in targeted geographic areas.
3. Reach out to owners, selling the benefits of aggregating attributes
4. If interested, provide NewCo with utility bills and measured annual cost savings post-retrofit, find a third-party entity to validate the savings.
5. Upon validation, determine the most appropriate buyer
6. Assuming attributes are sold, verify savings on an annual basis and provide ongoing verification to entities that have purchased the attributes.

Economics of Energy Efficiency Dara Goldberg ‘08 | 55
Demand
State regulation creates place-specific compliance markets
• State regulation creates place-specific compliance markets
• Regulation and baseline EE standard has thus far hindered participation
• Commitment to “green” drives the voluntary market.
Benefits to Multifamily Owners
• Little to no additional cost (in most cases).
• Revenue can be shared with owners.
• Participating owners benefit from ongoing data tracking and management
Economics of Energy Efficiency Dara Goldberg ‘08 | 56
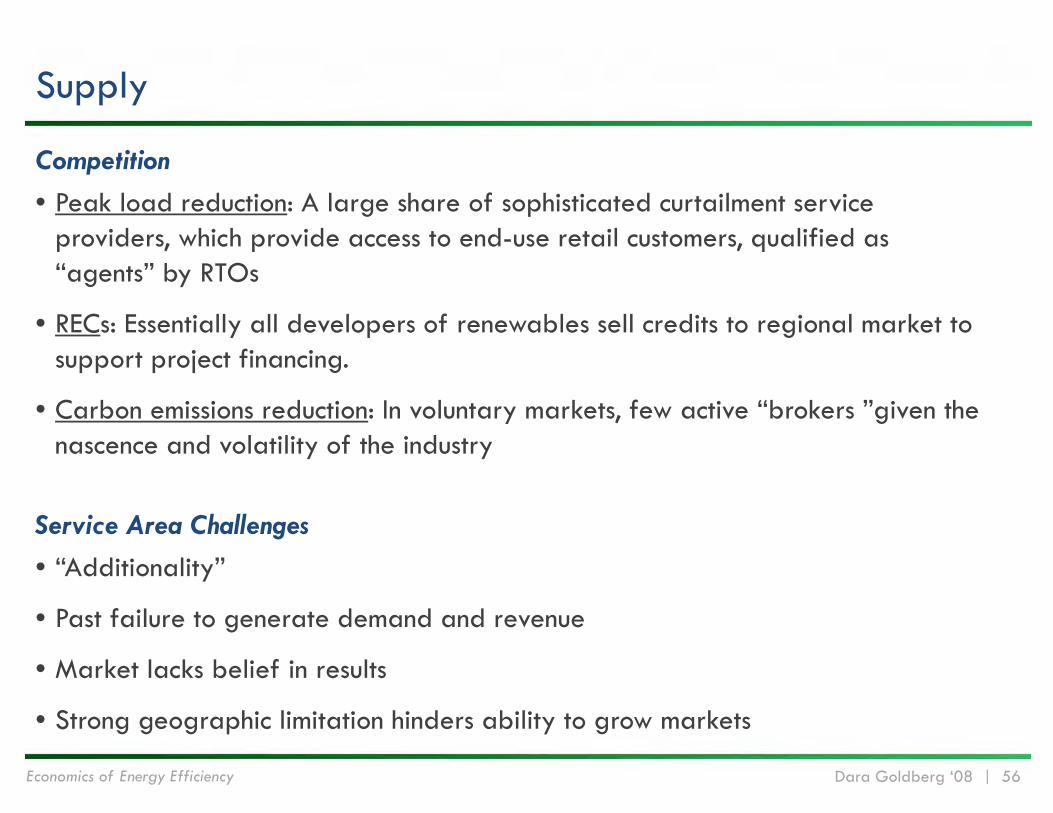
Supply
Competition
• Peak load reduction: A large share of sophisticated curtailment service providers, which provide access to end-use retail customers, qualified as “agents” by RTOs
• RECs: Essentially all developers of renewables sell credits to regional market to support project financing.
• Carbon emissions reduction: In voluntary markets, few active “brokers ”given the nascence and volatility of the industry
Service Area Challenges
• “Additionality”
• Past failure to generate demand and revenue
• Market lacks belief in results
• Strong geographic limitation hinders ability to grow markets
Economics of Energy Efficiency Dara Goldberg ‘08 | 57
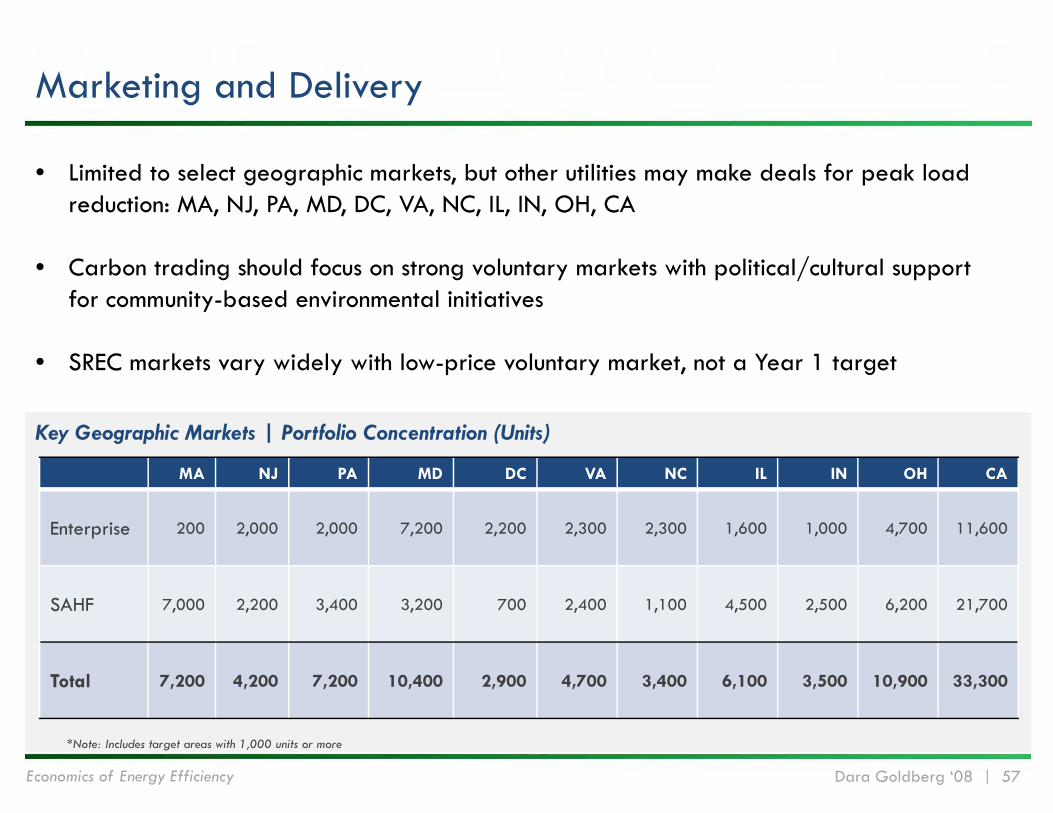
Marketing and Delivery
Key Geographic Markets | Portfolio Concentration (Units)
MA NJ PA MD DC VA NC IL IN OH CA
Enterprise 200 2,000 2,000 7,200 2,200 2,300 2,300 1,600 1,000 4,700 11,600
SAHF 7,000 2,200 3,400 3,200 700 2,400 1,100 4,500 2,500 6,200 21,700
Total 7,200 4,200 7,200 10,400 2,900 4,700 3,400 6,100 3,500 10,900 33,300
*Note: Includes target areas with 1,000 units or more
• Limited to select geographic markets, but other utilities may make deals for peak load reduction: MA, NJ, PA, MD, DC, VA, NC, IL, IN, OH, CA
• Carbon trading should focus on strong voluntary markets with political/cultural support for community-based environmental initiatives
• SREC markets vary widely with low-price voluntary market, not a Year 1 target
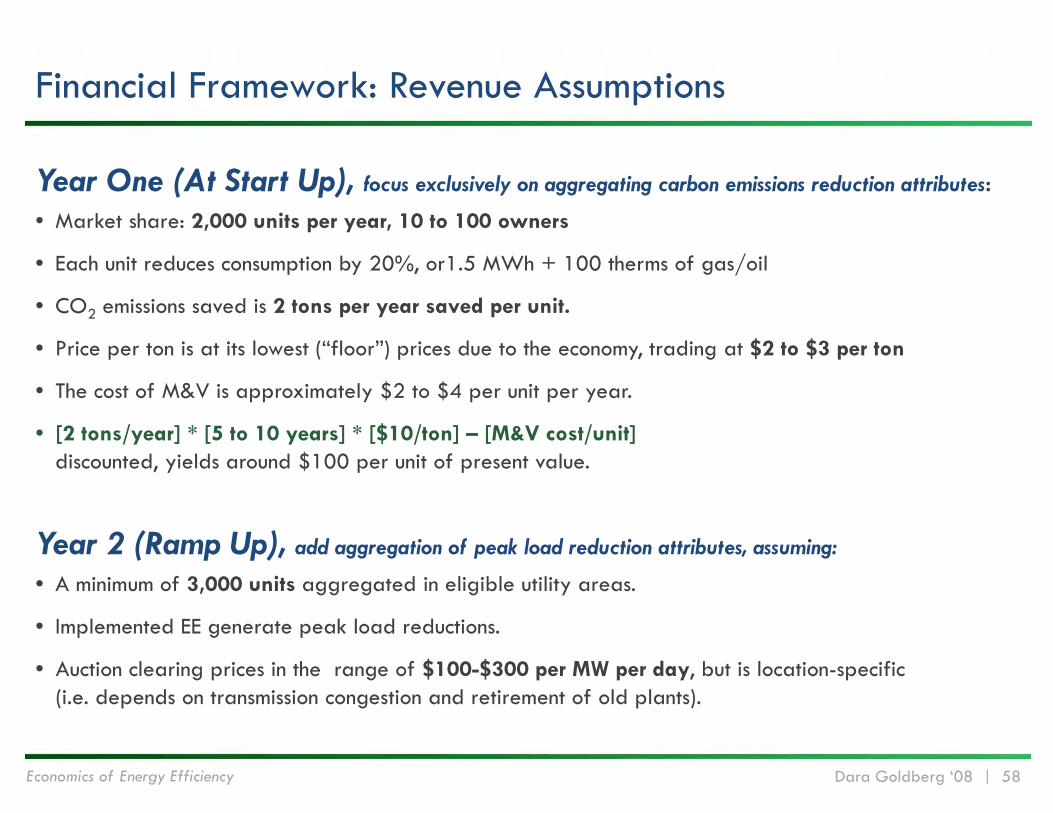
Economics of Energy Efficiency Dara Goldberg ‘08 | 58
Financial Framework: Revenue Assumptions
Year One (At Start Up), focus exclusively on aggregating carbon emissions reduction attributes:
• Market share: 2,000 units per year, 10 to 100 owners
• Each unit reduces consumption by 20%, or1.5 MWh + 100 therms of gas/oil
• CO2 emissions saved is 2 tons per year saved per unit.
• Price per ton is at its lowest (“floor”) prices due to the economy, trading at $2 to $3 per ton
• The cost of M&V is approximately $2 to $4 per unit per year.
• [2 tons/year] * [5 to 10 years] * [$10/ton] – [M&V cost/unit] discounted, yields around $100 per unit of present value.
Year 2 (Ramp Up), add aggregation of peak load reduction attributes, assuming:
• A minimum of 3,000 units aggregated in eligible utility areas.
• Implemented EE generate peak load reductions.
• Auction clearing prices in the range of $100-$300 per MW per day, but is location-specific (i.e. depends on transmission congestion and retirement of old plants).

Economics of Energy Efficiency Dara Goldberg ‘08 | 59
Year 1 Year 2 Year 3 Year 4 Year 5Earned RevenueCarbon Emissions Reduction Net Proceeds*
NPV per unit $100 $110 $120 $130 $140Number of Subscribers Aggregated (Units) 2,000 4,000 8,000 16,000 21,000 Subtotal Net Carbon Proceeds $200,000 $440,000 $960,000 $2,080,000 $2,940,000
Load Reduction Net Proceeds*NPV per unit $150 $150 $150 $150 $150Number of Subscribers Aggregated (Units) - 3,000 6,000 12,000 24,000 Subtotal Load Reduction Proceeds $0 $450,000 $900,000 $1,800,000 $2,340,000
Capitalization Needs $ - $ - $ - $ - $ -
Total Cash In $200,000 $890,000 $1.86M $3.88M $5.28M
Operating ExpensesStaff costs** $200,000 $300,000 $300,000 $369,000 $387,000 Other direct costs*** $200,000 $115,000 $115,000 $90,000 $95,000 Overhead*** $100,000 $110,000 $110,000 $120,000 $126,000
Total Expenses $500,000 $525,000 $525,000 $579,000 $608,000
Projected NOI $(300,000) $365,000 $1.34 M $3.30 M $4.67 M
*Net proceeds assumes the costs of measurement and verification are subtracted from total proceeds generated by sale of attributes, on a per unit basis.*Assumes Project Manager with 1 to 3 FTE support, with additional staff added in Year 4.***Other direct costs and overhead include consulting, travel, marketing, accounting and legal, and office/insurance costs, respectively.
Proforma
Economics of Energy Efficiency Dara Goldberg ‘08 | 60
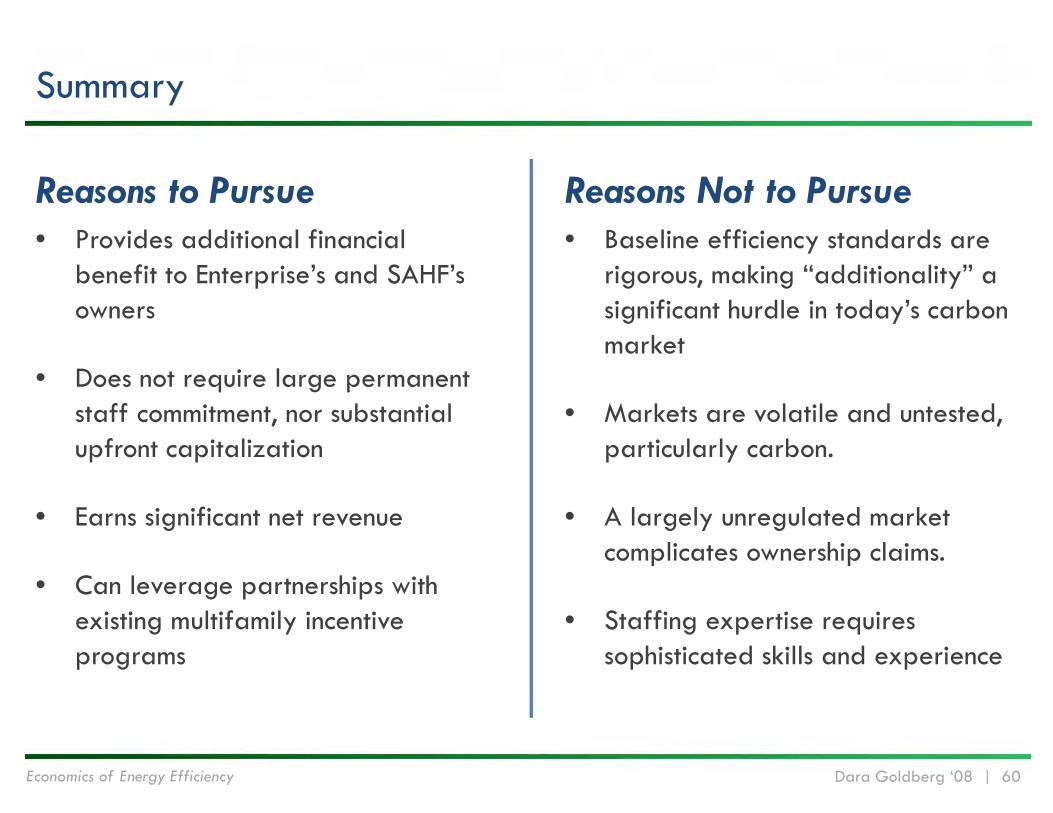
Summary
Reasons to Pursue• Provides additional financial
benefit to Enterprise’s and SAHF’s owners
• Does not require large permanent staff commitment, nor substantial upfront capitalization
• Earns significant net revenue
• Can leverage partnerships with existing multifamily incentive programs
Reasons Not to Pursue• Baseline efficiency standards are
rigorous, making “additionality” a significant hurdle in today’s carbon market
• Markets are volatile and untested, particularly carbon.
• A largely unregulated market complicates ownership claims.
• Staffing expertise requires sophisticated skills and experience

CASE STUDY
Illustrating the Benefits of Energy Efficiency in Multifamily UnderwritingDeutsche Bank Americas Foundation | Living Cities
Economics of Energy Efficiency Dara Goldberg ‘08 | 62
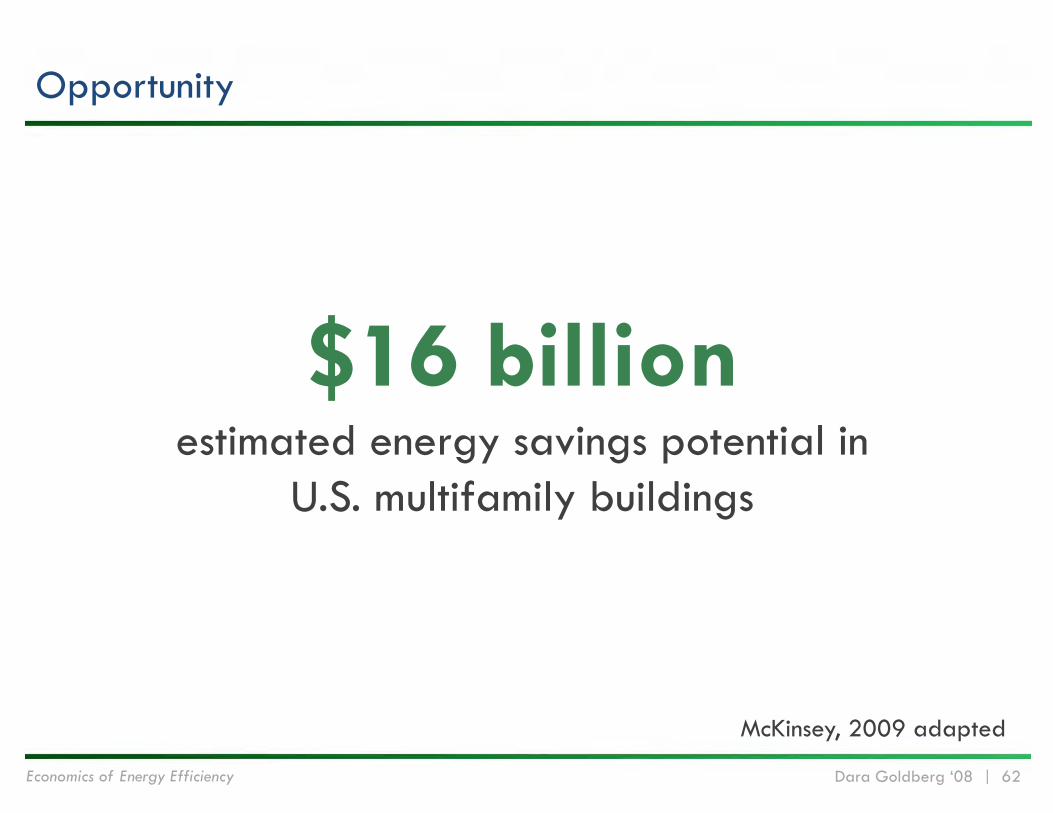
$16 billionestimated energy savings potential in
U.S. multifamily buildings
McKinsey, 2009 adapted
Opportunity
Economics of Energy Efficiency Dara Goldberg ‘08 | 63
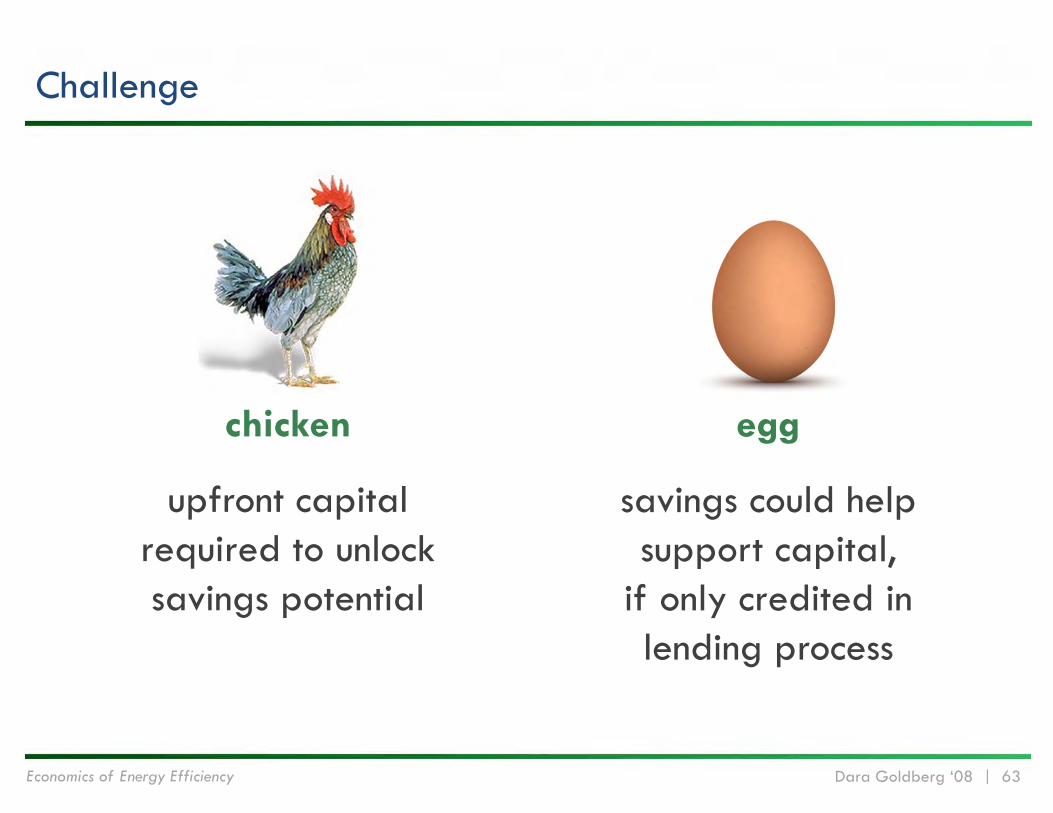
chicken
upfront capital required to unlock savings potential
egg
savings could help support capital,
if only credited in lending process
Challenge
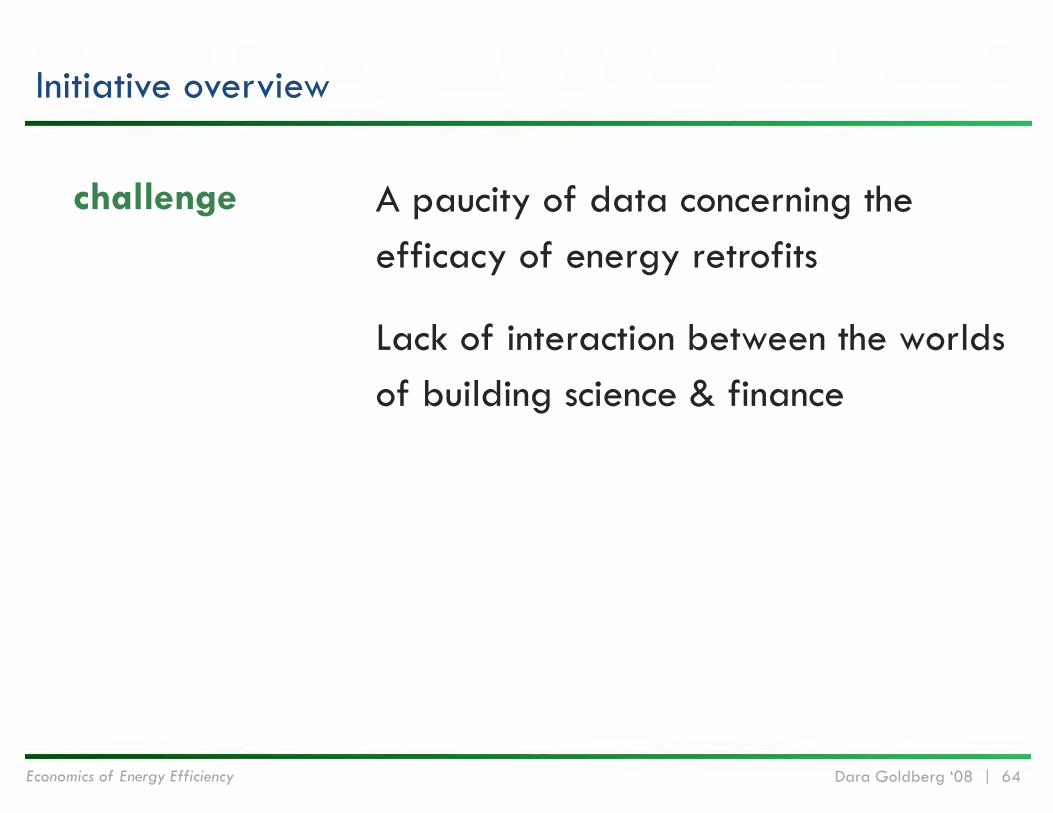
Economics of Energy Efficiency Dara Goldberg ‘08 | 64
A paucity of data concerning the efficacy of energy retrofits
Lack of interaction between the worlds of building science & finance
Initiative overview
challenge
Economics of Energy Efficiency Dara Goldberg ‘08 | 65
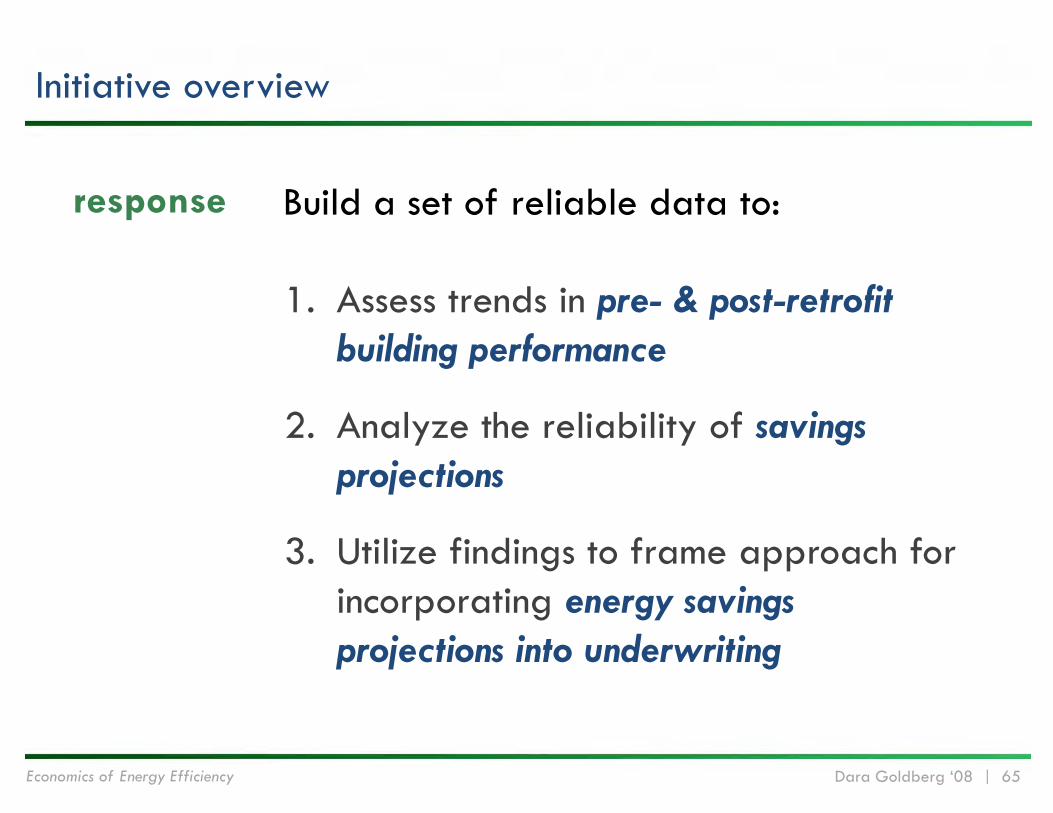
Initiative overview
1. Assess trends in pre- & post-retrofit building performance
2. Analyze the reliability of savings projections
3. Utilize findings to frame approach for incorporating energy savings projections into underwriting
Build a set of reliable data to:response

Economics of Energy Efficiency Dara Goldberg ‘08 | 66
Approach
231 projects
21,022 units
Electric Only43%
Fuel Only10%
Electric + Fuel47%
Breakdown of Dataset by End Use Data Availability
Economics of Energy Efficiency Dara Goldberg ‘08 | 67
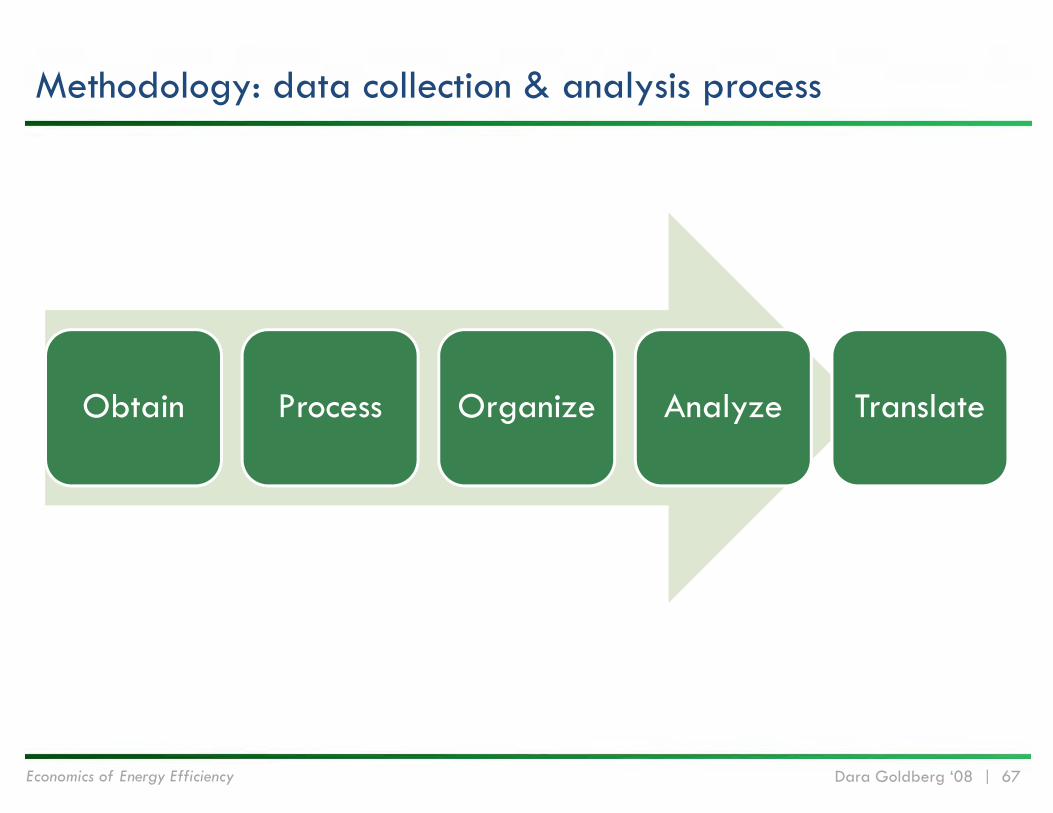
Methodology: data collection & analysis process
Obtain Process Organize Analyze Translate
Economics of Energy Efficiency Dara Goldberg ‘08 | 68
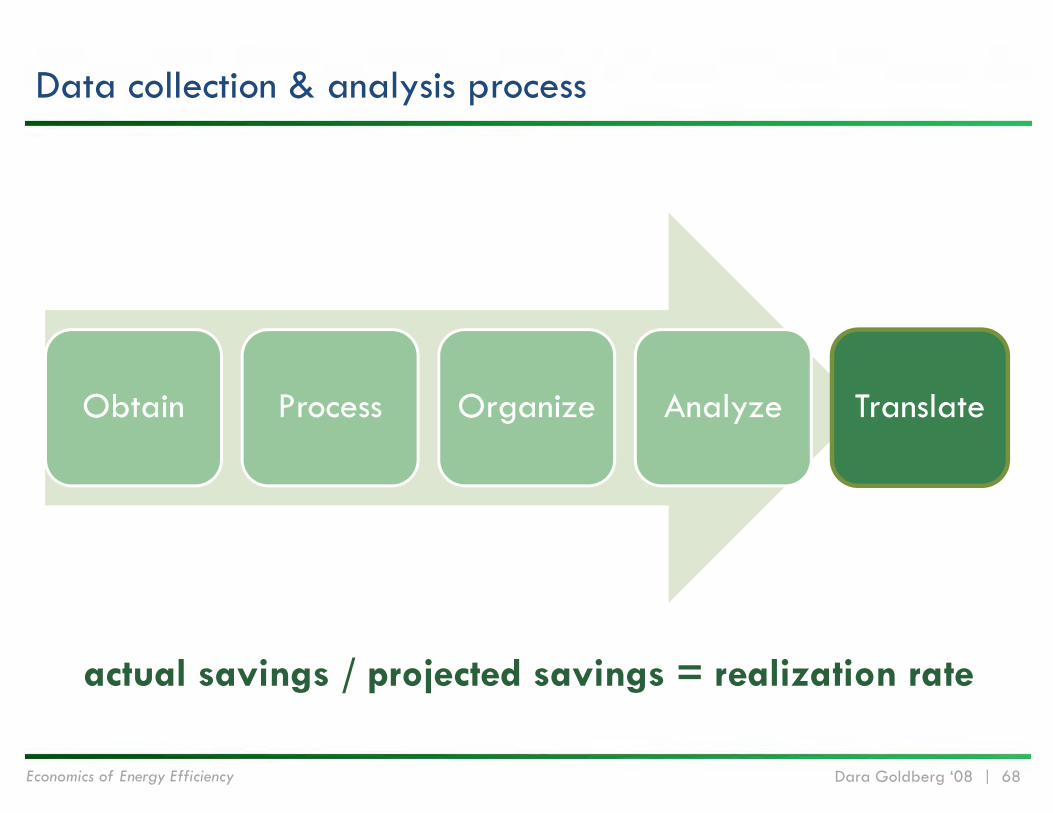
Data collection & analysis process
Obtain Process Organize Analyze Translate
actual savings / projected savings = realization rate
Economics of Energy Efficiency Dara Goldberg ‘08 | 69
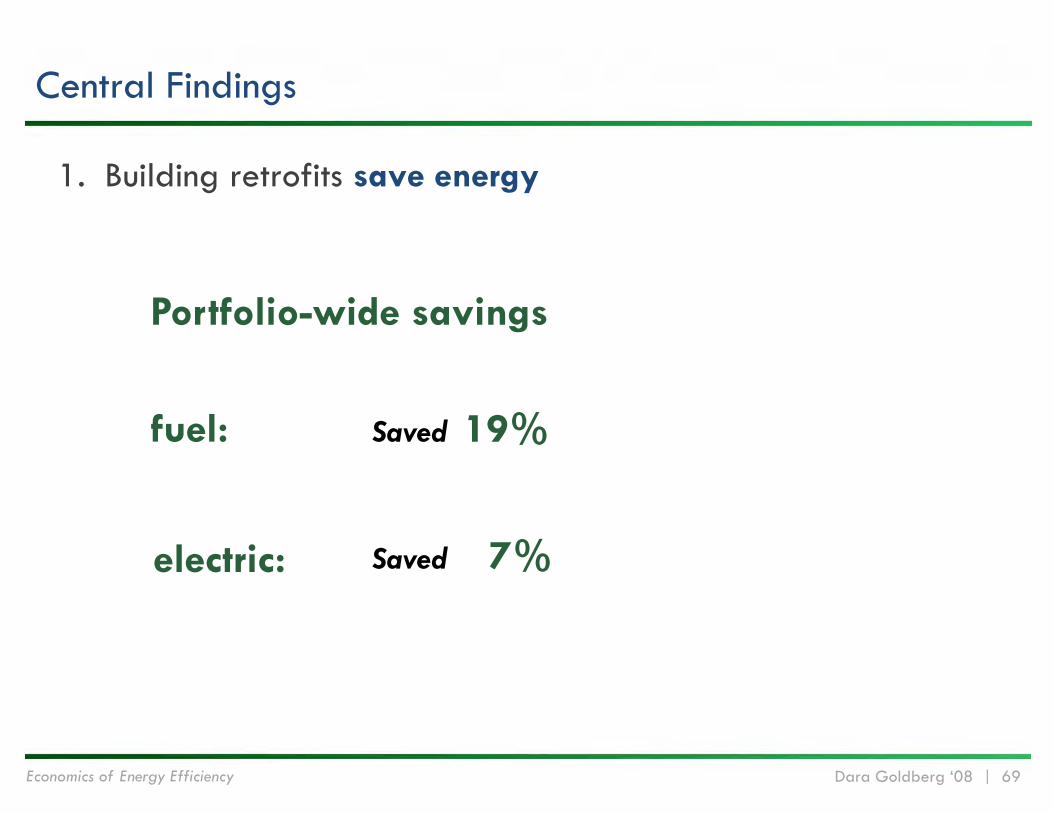
Central Findings
1. Building retrofits save energy
Portfolio-wide savings
Saved 19%
electric: Saved 7%
fuel:
Economics of Energy Efficiency Dara Goldberg ‘08 | 70
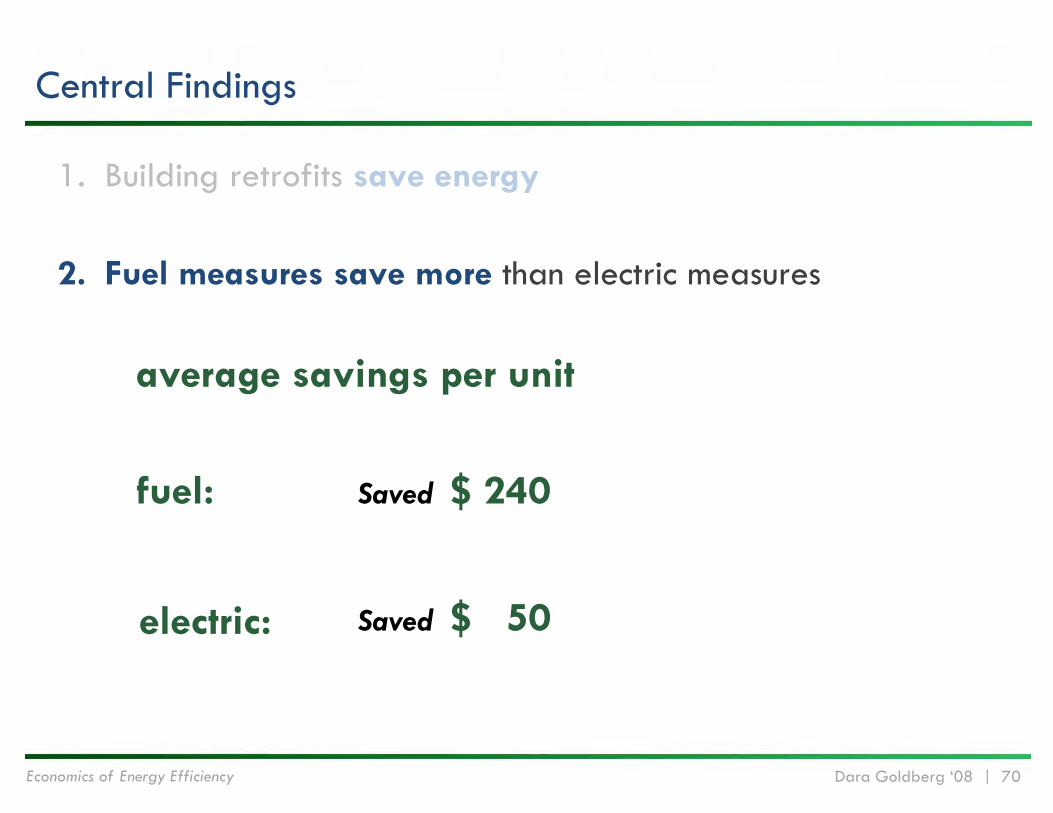
Central Findings
1. Building retrofits save energy
2. Fuel measures save more than electric measures
average savings per unit
Saved $ 240
electric: Saved $ 50
fuel:
Economics of Energy Efficiency Dara Goldberg ‘08 | 71
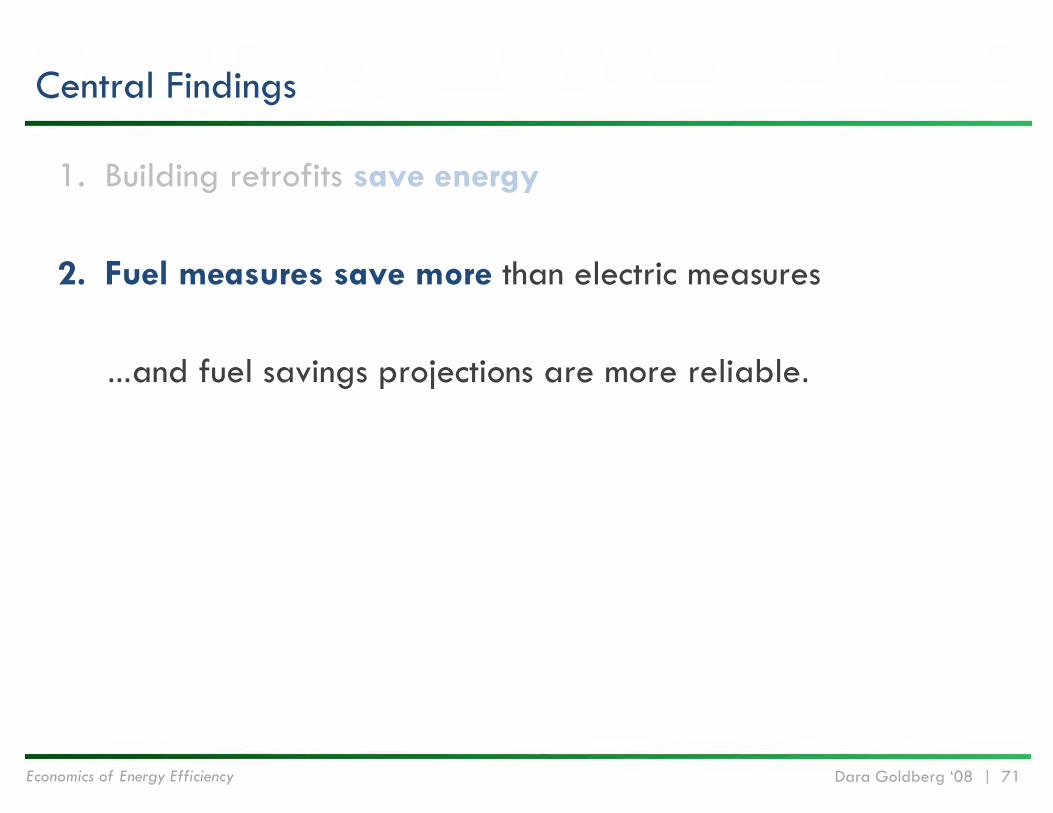
Central Findings
1. Building retrofits save energy
2. Fuel measures save more than electric measures
…and fuel savings projections are more reliable.
Economics of Energy Efficiency Dara Goldberg ‘08 | 72
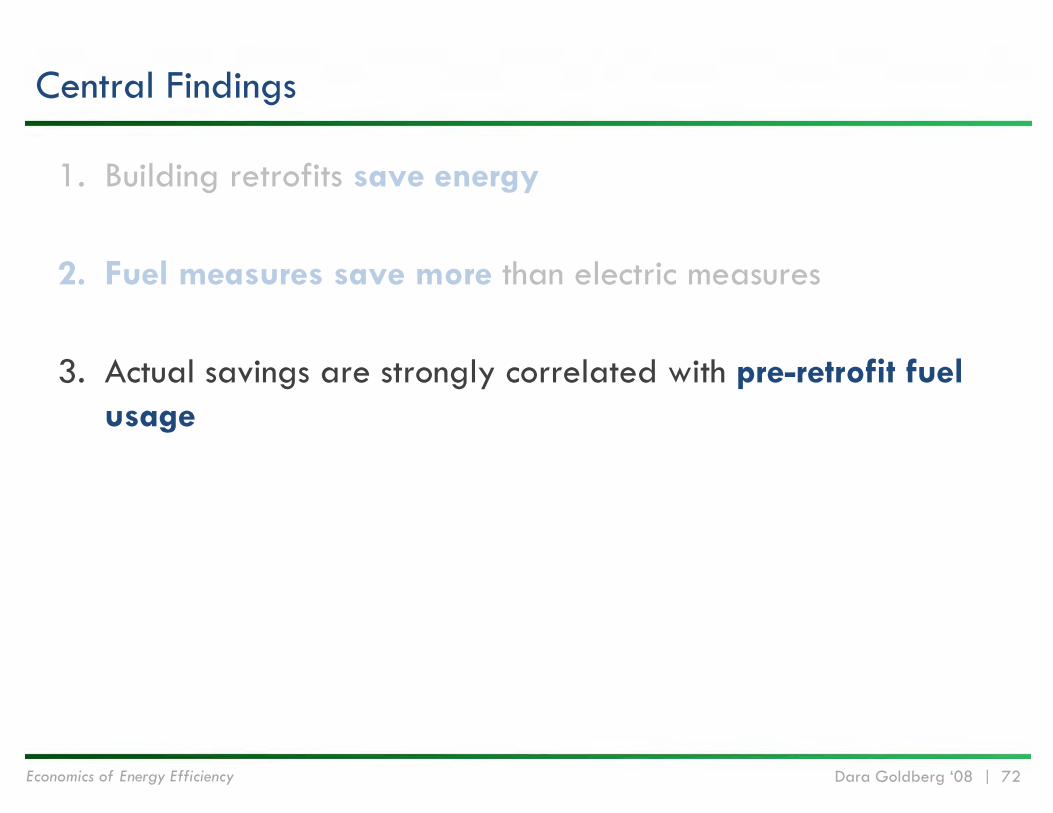
Central Findings
1. Building retrofits save energy
2. Fuel measures save more than electric measures
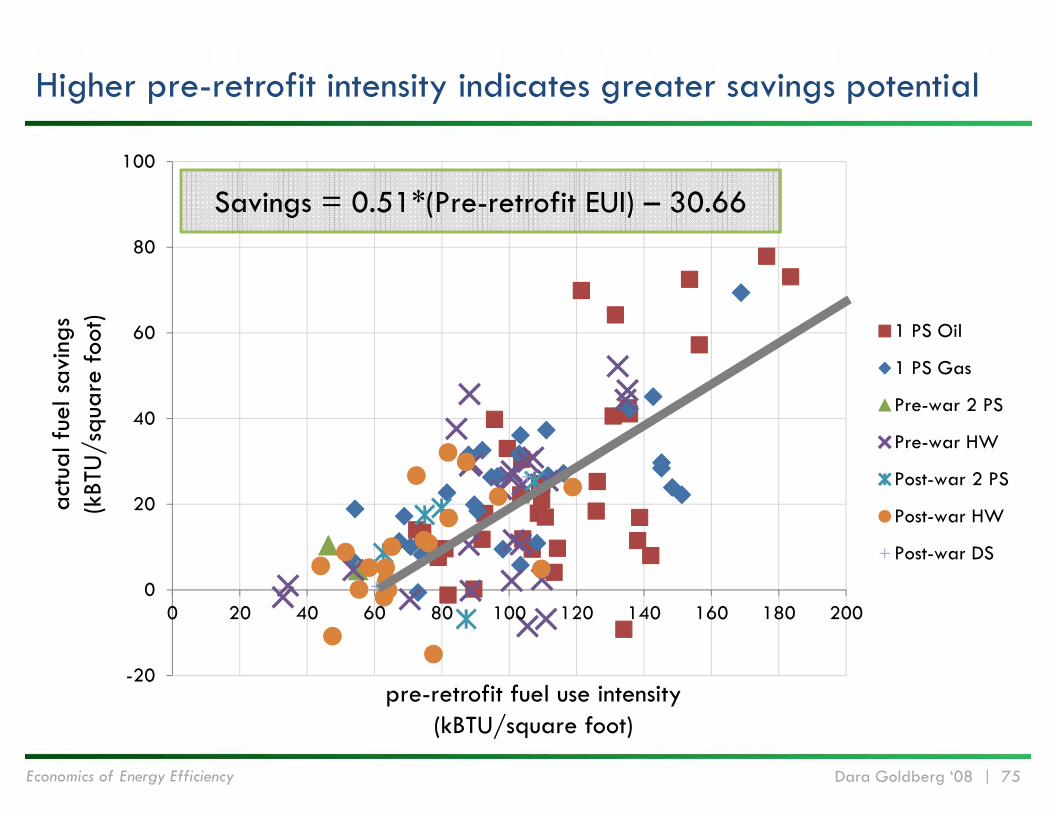
3. Actual savings are strongly correlated with pre-retrofit fuel usage
Economics of Energy Efficiency Dara Goldberg ‘08 | 73
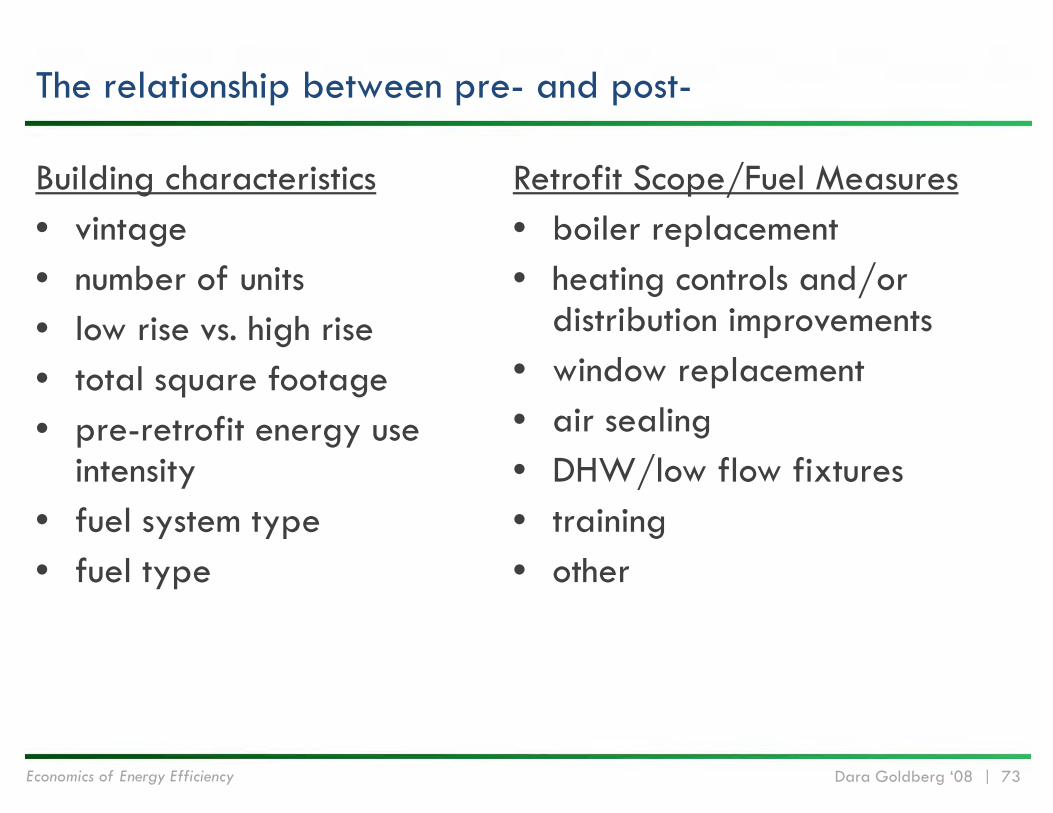
The relationship between pre- and post-
Building characteristics• vintage• number of units• low rise vs. high rise• total square footage• pre-retrofit energy use
intensity• fuel system type• fuel type
Retrofit Scope/Fuel Measures• boiler replacement• heating controls and/or
distribution improvements• window replacement• air sealing• DHW/low flow fixtures• training• other
Economics of Energy Efficiency Dara Goldberg ‘08 | 74
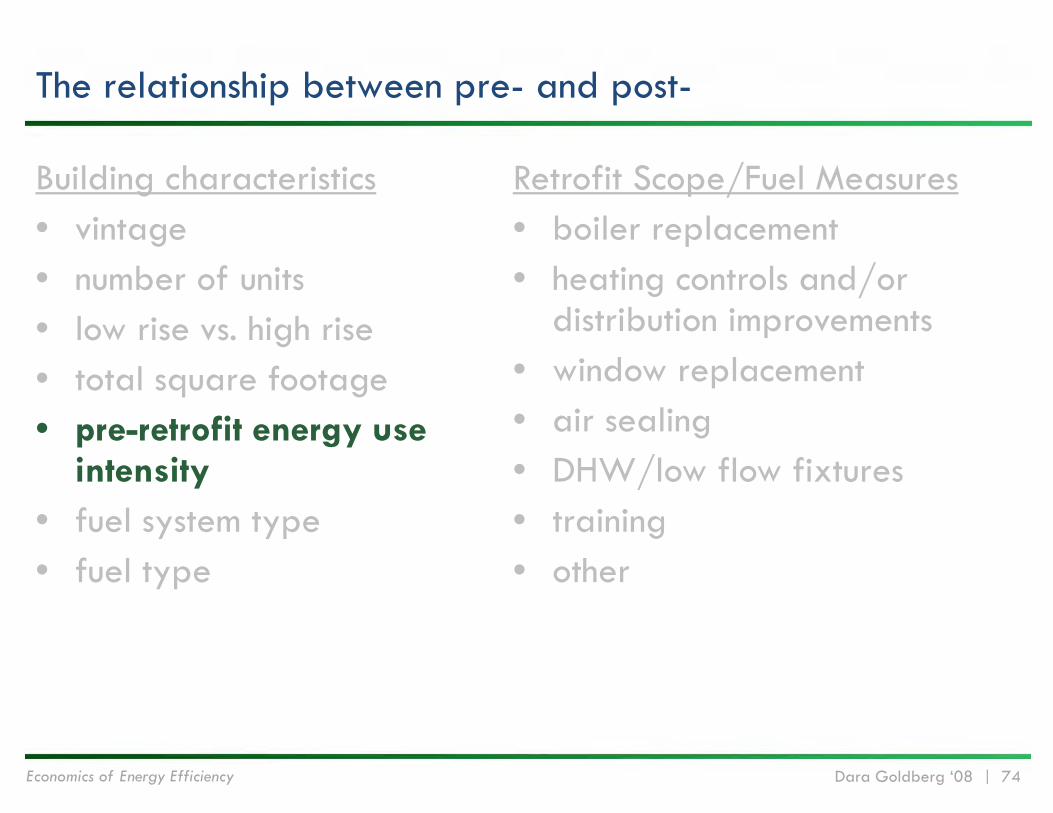
The relationship between pre- and post-
Building characteristics• vintage• number of units• low rise vs. high rise• total square footage• pre-retrofit energy use
intensity• fuel system type• fuel type
Retrofit Scope/Fuel Measures• boiler replacement• heating controls and/or
distribution improvements• window replacement• air sealing• DHW/low flow fixtures• training• other
Economics of Energy Efficiency Dara Goldberg ‘08 | 75
-20
0
20
40
60
80
100
0 20 40 60 80 100 120 140 160 180 200
1 PS Oil
1 PS Gas
Pre-war 2 PS
Pre-war HW
Post-war 2 PS
Post-war HW
Post-war DS
actu
al f
uel s
avin
gs(k
BTU
/squ
are
foot
)
pre-retrofit fuel use intensity(kBTU/square foot)
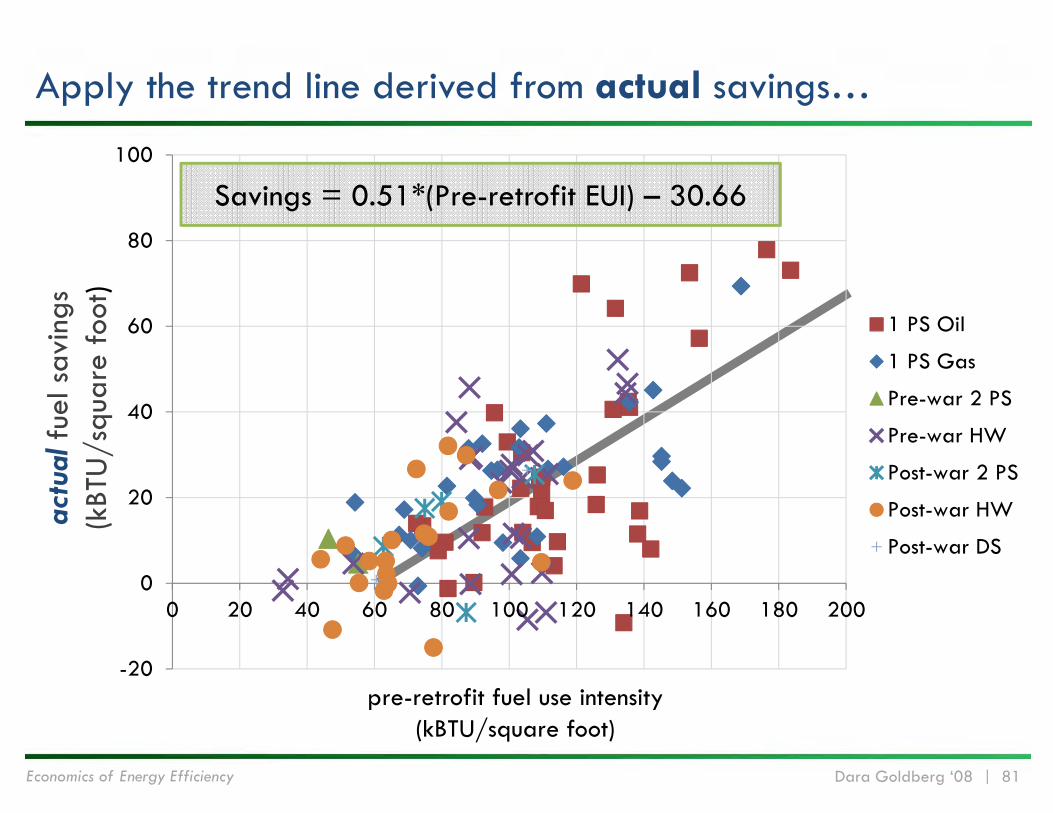
Savings = 0.51*(Pre-retrofit EUI) – 30.66
Higher pre-retrofit intensity indicates greater savings potential

Economics of Energy Efficiency Dara Goldberg ‘08 | 76
116103 95
8273
0
20
40
60
80
100
120
140
1 PS Oil (n=37) 1 PS Gas (n=29) Pre-war HW(n=26)
Post-war 2 PS(n=5)
Post-war HW(n=20)
pre-
retro
fit e
nerg
y us
e in
tens
ity
(kBT
U/s
quar
e fo
ot)
Heating system & age are good proxies for EUI
1-Pipe Steam, Oil
(n=37)
1-Pipe Steam, Gas
(n=29)
Pre-war Hot Water(n=26)
Post-war2-Pipe Steam
(n=5)
Post-war Hot Water
(n=20)

Economics of Energy Efficiency Dara Goldberg ‘08 | 77
Central Findings
1. Building retrofits save energy
2. Fuel measures save more than electric measures
3. Actual savings are strongly correlated with pre-retrofit fuel usage
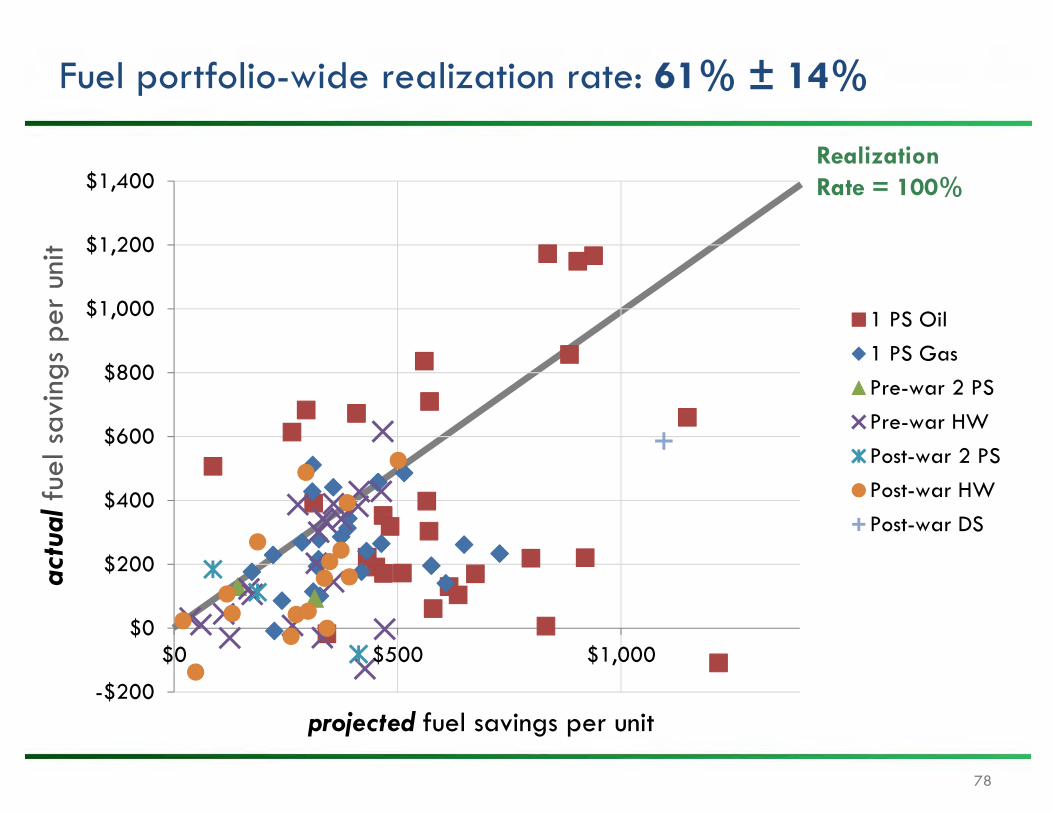
4. Strategically capping projections can vastly improve a portfolio’s realization rate
78
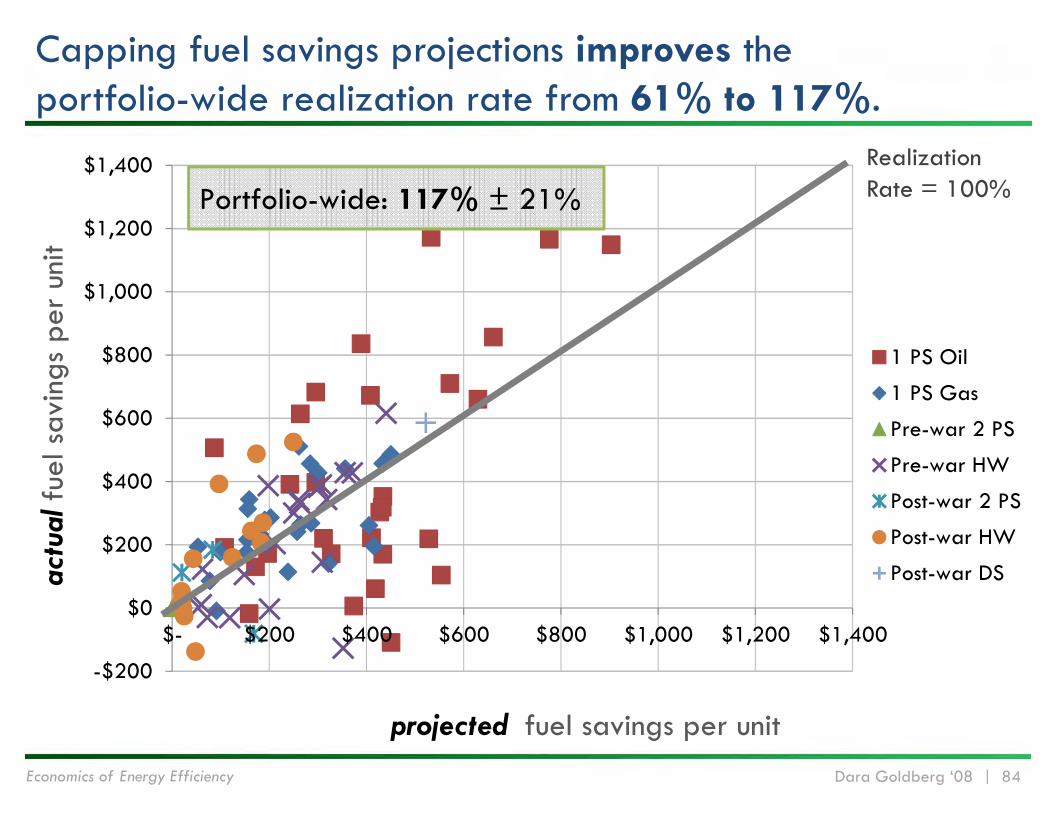
Fuel portfolio-wide realization rate: 61% ± 14%
-$200
$0
$200
$400
$600
$800
$1,000
$1,200
$1,400
$0 $500 $1,000
projected fuel savings per unit
1 PS Oil1 PS GasPre-war 2 PSPre-war HWPost-war 2 PSPost-war HWPost-war DS
Realization Rate = 100%
actu
alfu
el s
avin
gs p
er u
nit
Economics of Energy Efficiency Dara Goldberg ‘08 | 79
-10%
0%
10%
20%
30%
40%
50%
60%
70%
80%
90%
0 100 200 300 400
1 PS Oil
1 PS Gas
Pre-war 2 PS
Pre-war HW
Post-war 2 PS
Post-war HW
Post-war DS
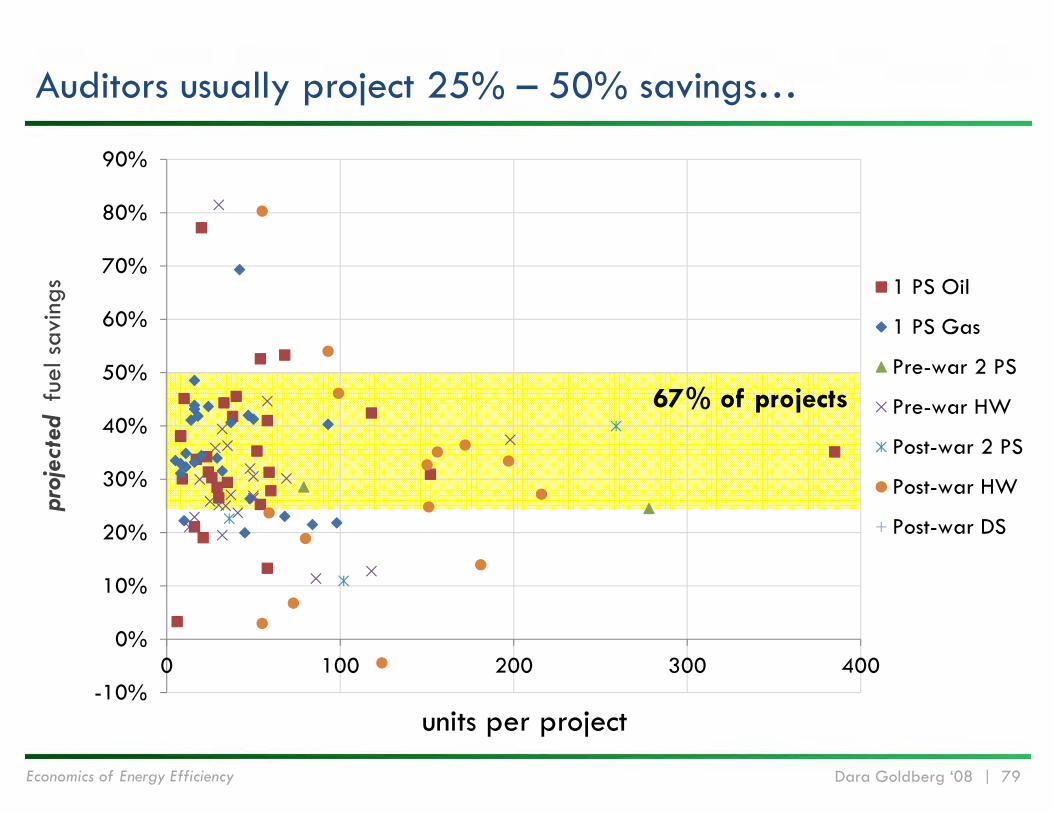
67% of projects
Auditors usually project 25% – 50% savings…pr
ojec
ted
fue
l sav
ings
units per project
Economics of Energy Efficiency Dara Goldberg ‘08 | 80
-10%
0%
10%
20%
30%
40%
50%
60%
70%
80%
90%
0 100 200 300 400
1 PS Oil
1 PS Gas
Pre-war 2 PS
Pre-war HW
Post-war 2 PS
Post-war HW
Post-war DS
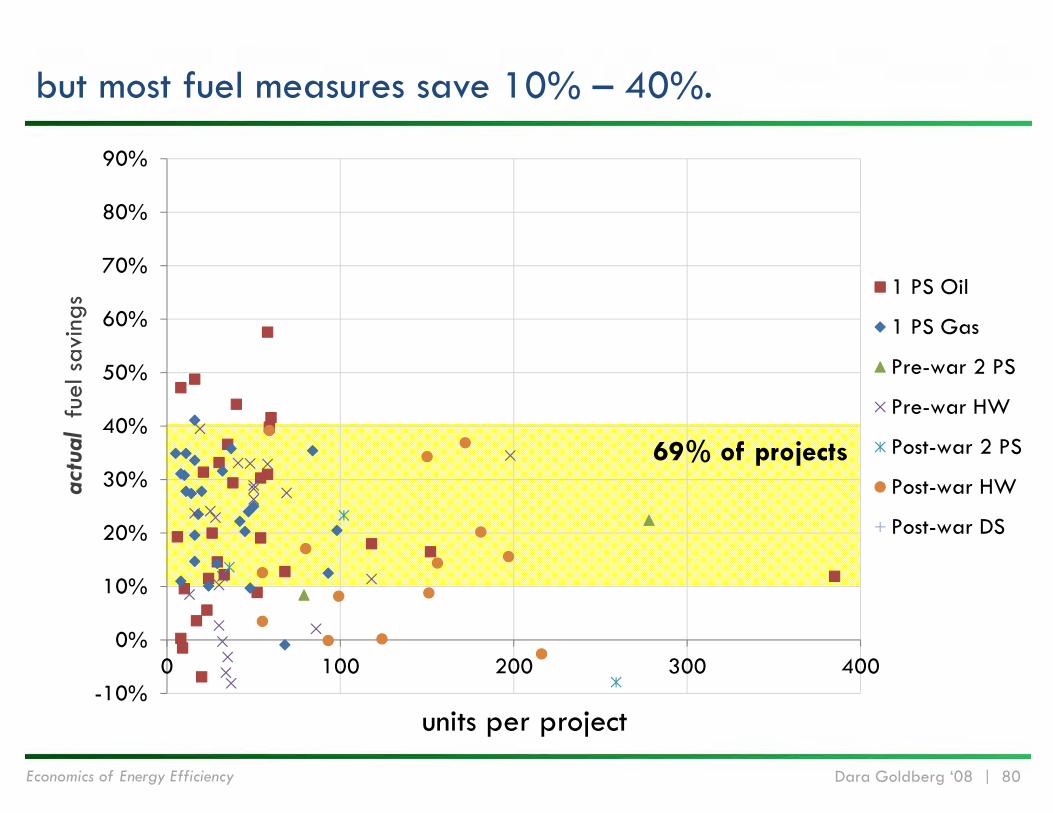
69% of projects
but most fuel measures save 10% – 40%. ac
tual
fuel
sav
ings
units per project
Economics of Energy Efficiency Dara Goldberg ‘08 | 81
-20
0
20
40
60
80
100
0 20 40 60 80 100 120 140 160 180 200
Total kBTU/SF Pre-retrofit
1 PS Oil
1 PS Gas
Pre-war 2 PS
Pre-war HW
Post-war 2 PS
Post-war HW
Post-war DS
actu
alfu
el s
avin
gs(k
BTU
/squ
are
foot
)
pre-retrofit fuel use intensity(kBTU/square foot)
Apply the trend line derived from actual savings…
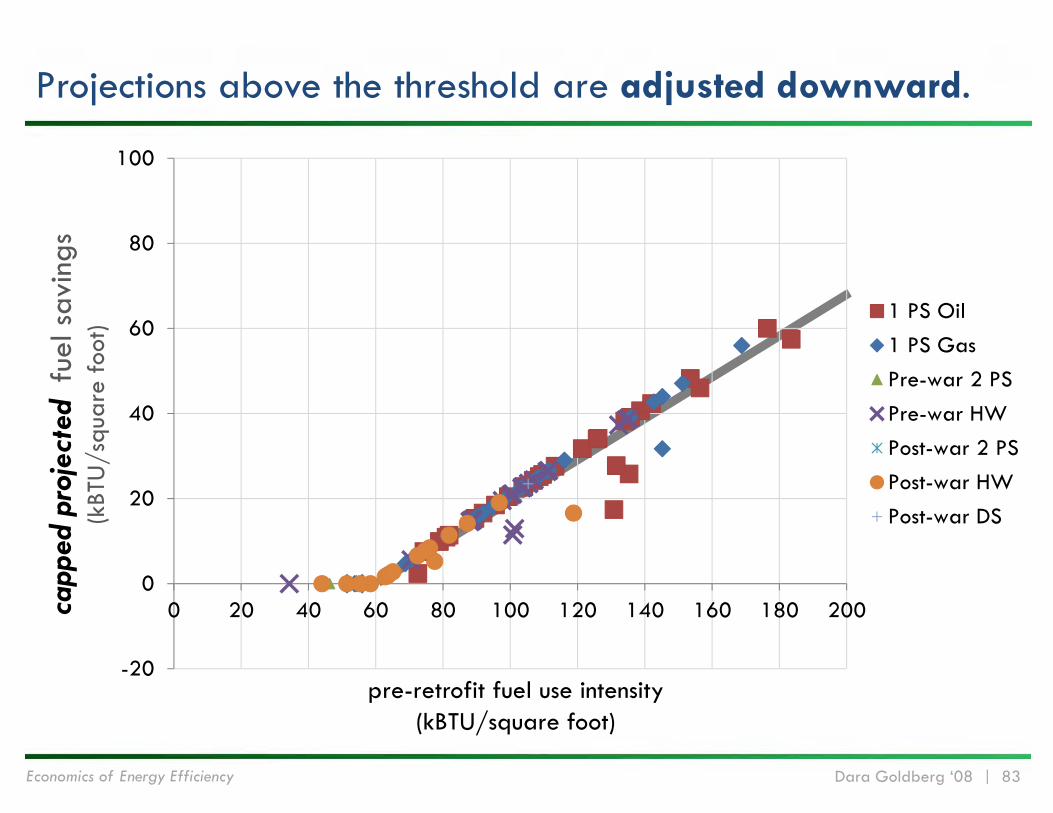
Savings = 0.51*(Pre-retrofit EUI) – 30.66
Economics of Energy Efficiency Dara Goldberg ‘08 | 82
-20
0
20
40
60
80
100
0 20 40 60 80 100 120 140 160 180 200
1 PS Oil
1 PS Gas
Pre-war 2 PS
Pre-war HW
Post-war 2 PS
Post-war HW
Post-war DSproj
ecte
d fu
el s
avin
gs(k
BTU
/squ
are
foot
)
pre-retrofit fuel use intensity(kBTU/square foot)
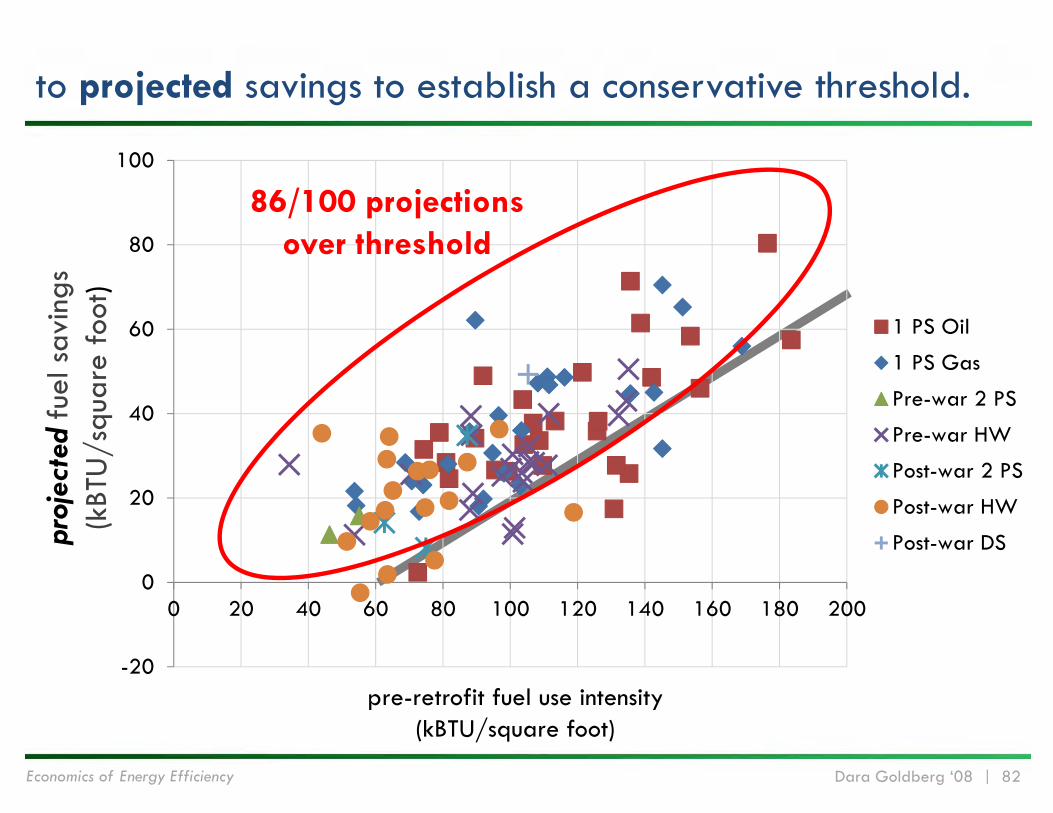
to projected savings to establish a conservative threshold.
86/100 projections over threshold
Economics of Energy Efficiency Dara Goldberg ‘08 | 83
-20
0
20
40
60
80
100
0 20 40 60 80 100 120 140 160 180 200
1 PS Oil1 PS GasPre-war 2 PSPre-war HWPost-war 2 PSPost-war HWPost-war DS
Projections above the threshold are adjusted downward.ca
pped
pro
ject
ed f
uel s
avin
gs(k
BTU
/squ
are
foot
)
pre-retrofit fuel use intensity(kBTU/square foot)
Economics of Energy Efficiency Dara Goldberg ‘08 | 84
-$200
$0
$200
$400
$600
$800
$1,000
$1,200
$1,400
$- $200 $400 $600 $800 $1,000 $1,200 $1,400
1 PS Oil
1 PS Gas
Pre-war 2 PS
Pre-war HW
Post-war 2 PS
Post-war HW
Post-war DS
Capping fuel savings projections improves theportfolio-wide realization rate from 61% to 117%.
Realization Rate = 100%Portfolio-wide: 117% ± 21%
actu
alfu
el s
avin
gs p
er u
nit
projected fuel savings per unit

Economics of Energy Efficiency Dara Goldberg ‘08 | 85
Comparative Portfolio Analysis
DBLC fuel dataset
with pre-, projected & post-retrofit data
85
100 projects
8,100 units
Economics of Energy Efficiency Dara Goldberg ‘08 | 86
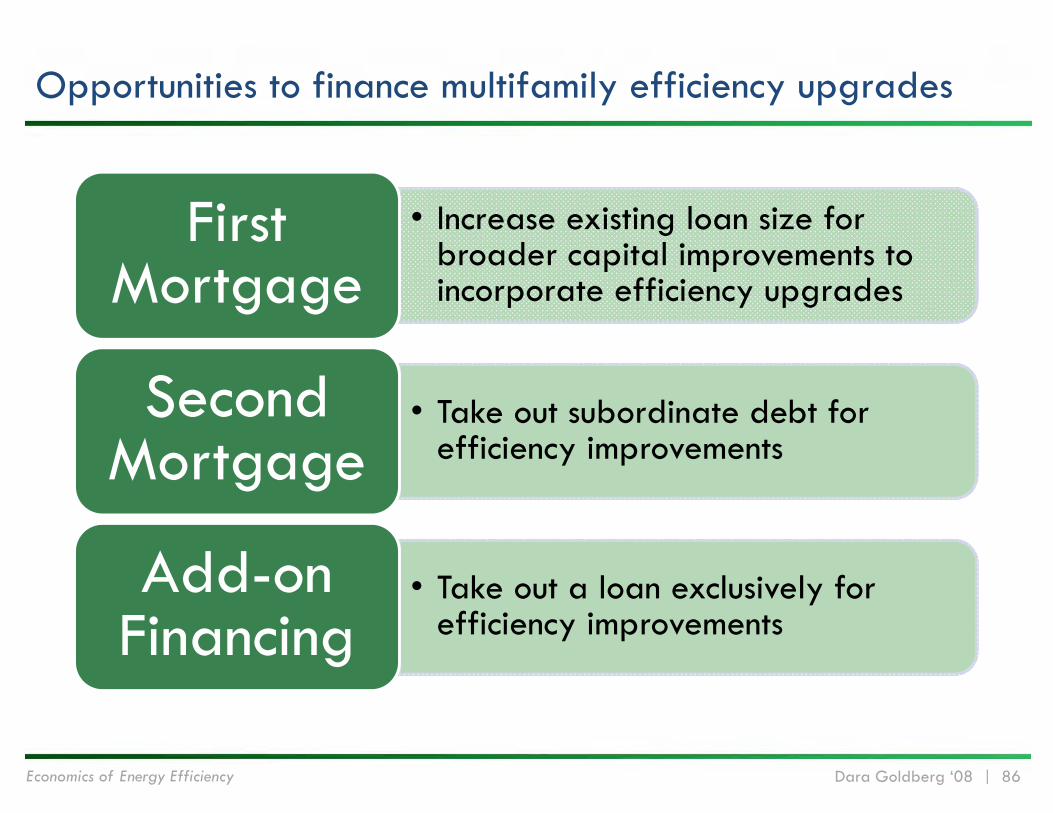
Opportunities to finance multifamily efficiency upgrades
• Increase existing loan size for broader capital improvements to incorporate efficiency upgrades
First Mortgage
• Take out subordinate debt for efficiency improvements
Second Mortgage
• Take out a loan exclusively for efficiency improvements
Add-on Financing
Economics of Energy Efficiency Dara Goldberg ‘08 | 87
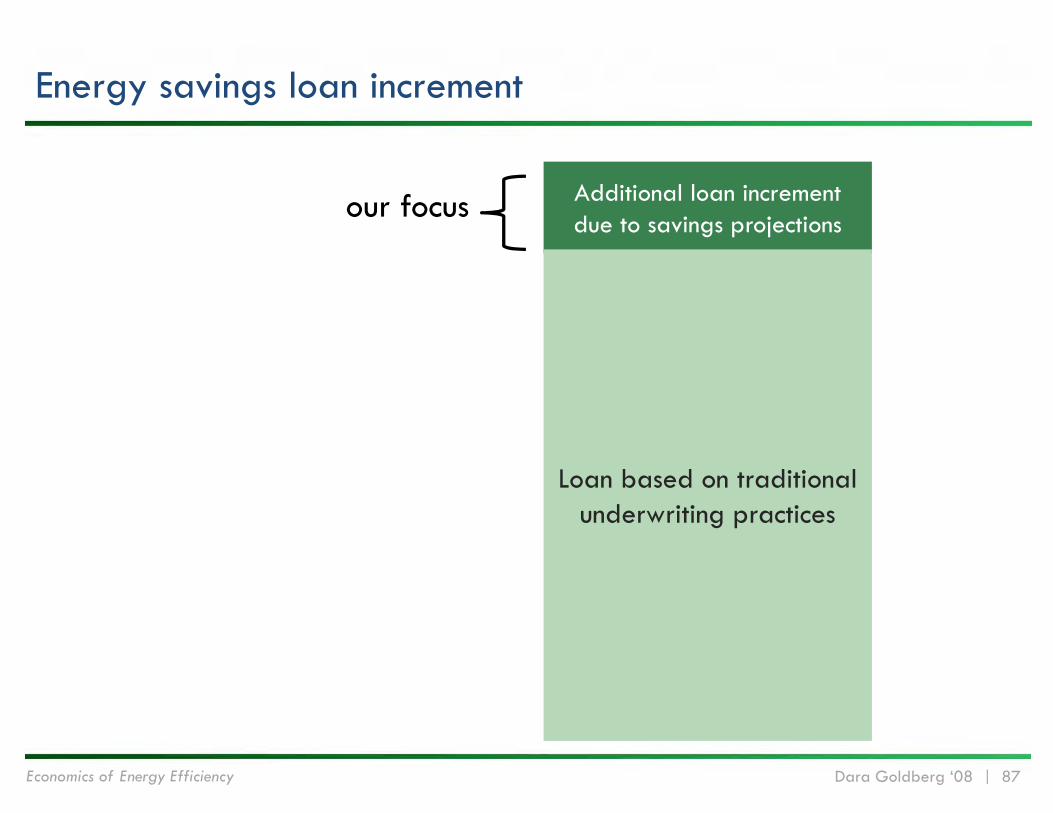
Energy savings loan increment
Additional loan increment due to savings projections
Loan based on traditional underwriting practices
our focus
Economics of Energy Efficiency Dara Goldberg ‘08 | 88
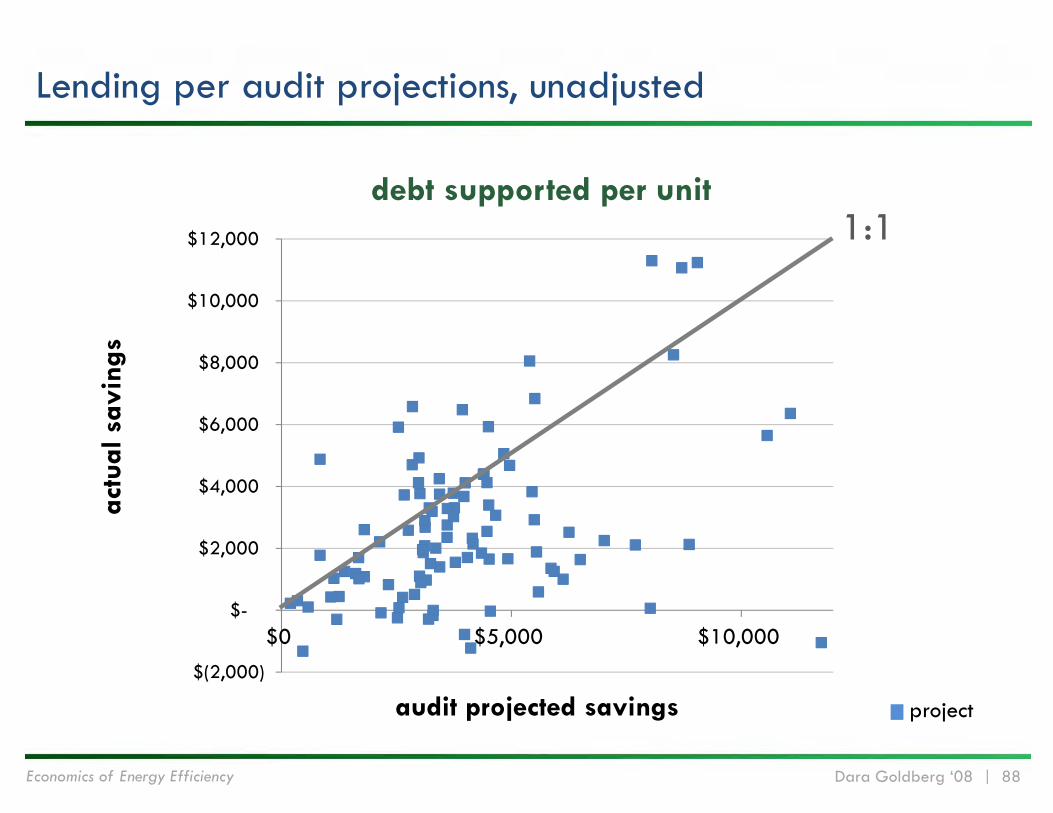
Lending per audit projections, unadjusted
$(2,000)
$-
$2,000
$4,000
$6,000
$8,000
$10,000
$12,000
$0 $5,000 $10,000
audit projected savings
actu
al s
avin
gs
1:1debt supported per unit
project
Economics of Energy Efficiency Dara Goldberg ‘08 | 89
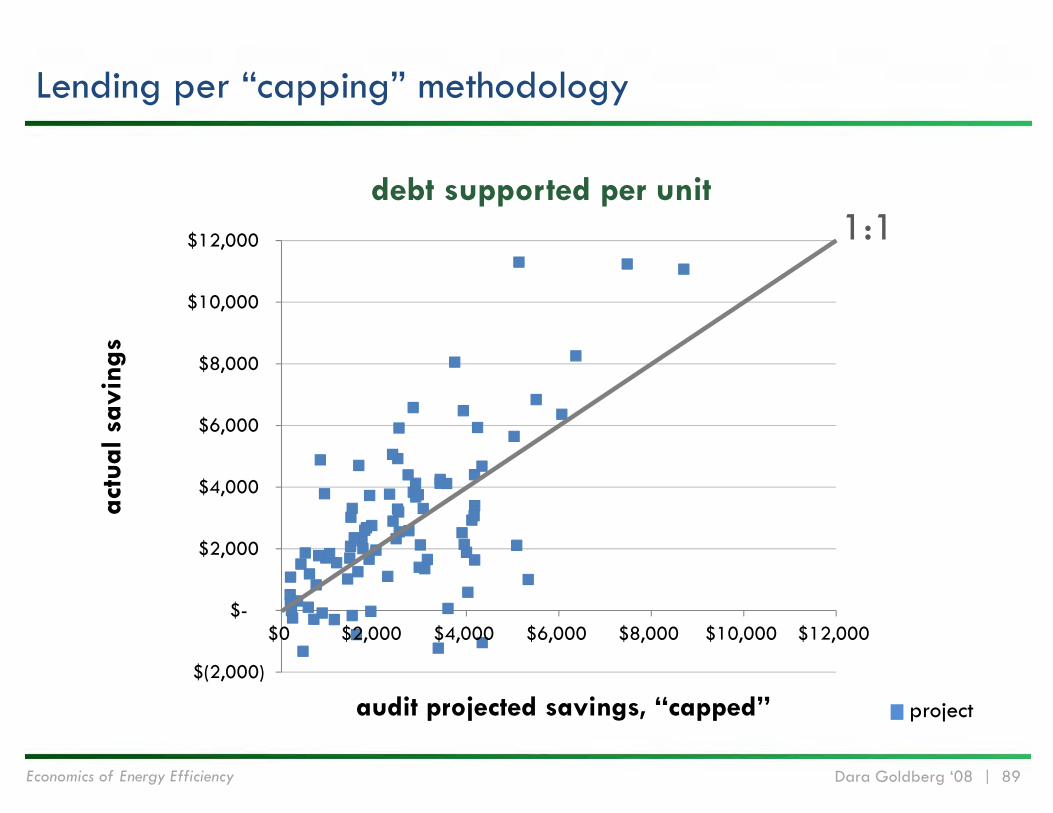
Lending per “capping” methodology
$(2,000)
$-
$2,000
$4,000
$6,000
$8,000
$10,000
$12,000
$0 $2,000 $4,000 $6,000 $8,000 $10,000 $12,000
audit projected savings, “capped”
actu
al s
avin
gs
1:1debt supported per unit
project
Economics of Energy Efficiency Dara Goldberg ‘08 | 90
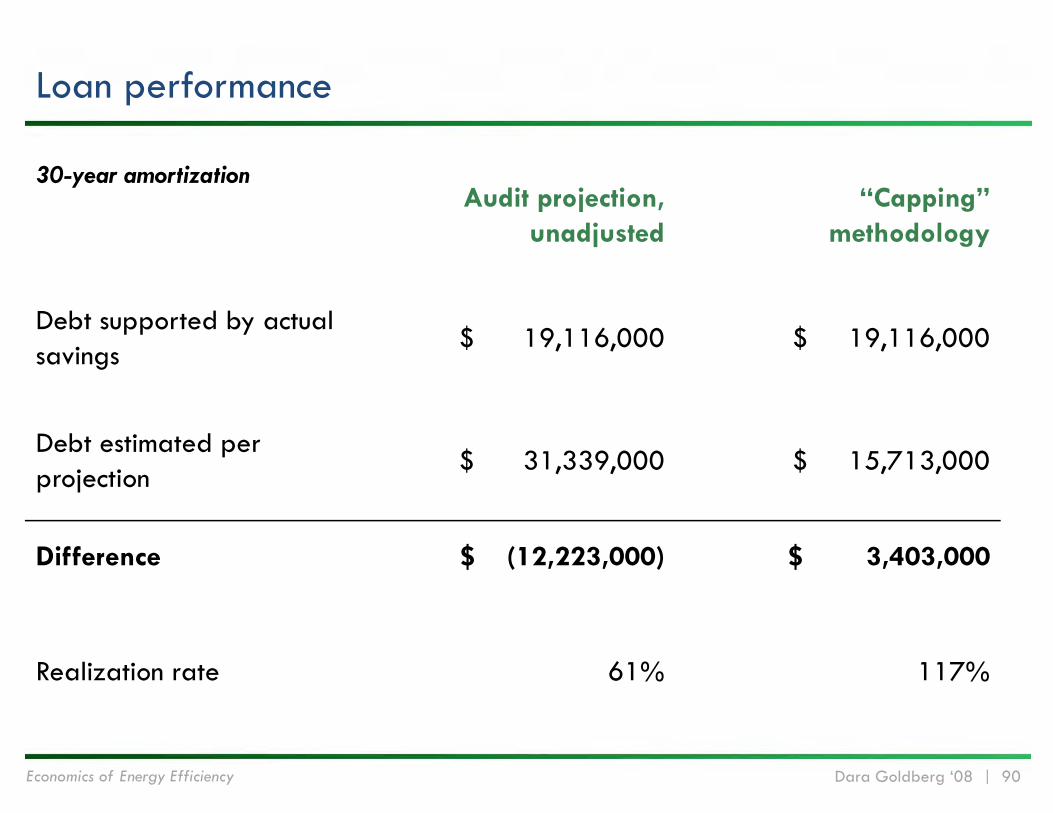
Loan performance
30-year amortizationAudit projection,
unadjusted“Capping”
methodology
Debt supported by actual savings
$ 19,116,000 $ 19,116,000
Debt estimated per projection
$ 31,339,000 $ 15,713,000
Difference $ (12,223,000) $ 3,403,000
Realization rate 61% 117%
Economics of Energy Efficiency Dara Goldberg ‘08 | 91
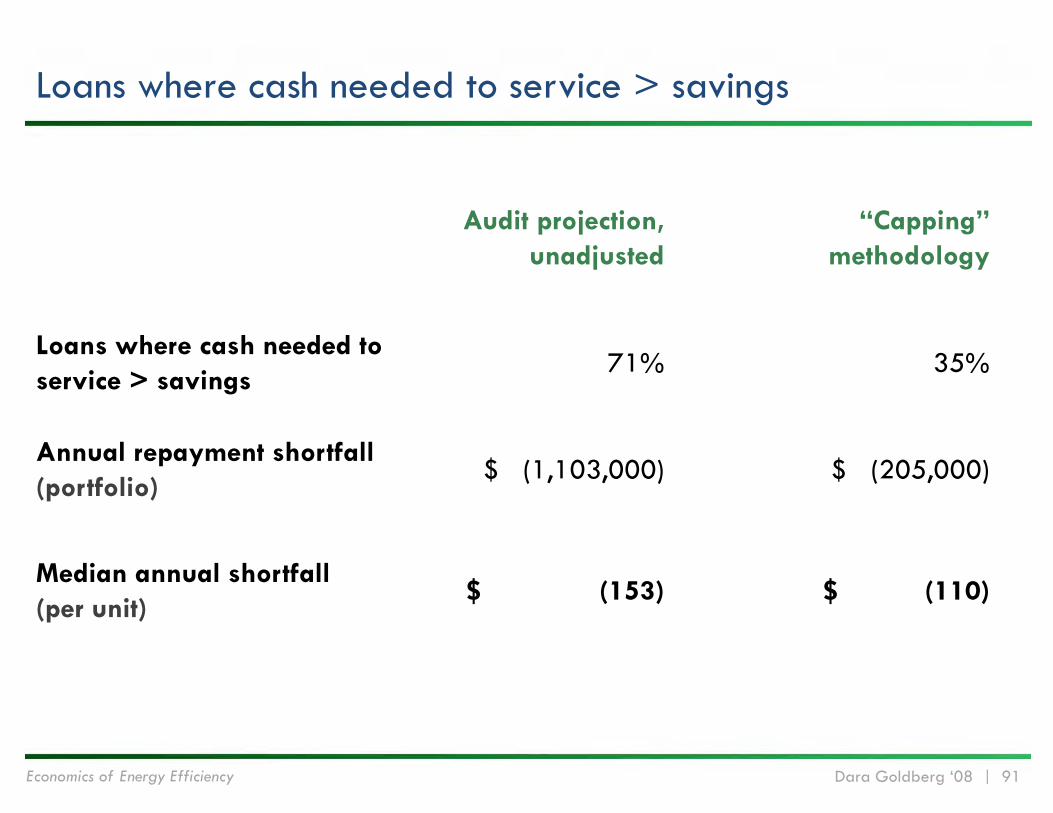
Loans where cash needed to service > savings
Audit projection,unadjusted
“Capping” methodology
Loans where cash needed to service > savings
71% 35%
Annual repayment shortfall(portfolio)
$ (1,103,000) $ (205,000)
Median annual shortfall (per unit)
$ (153) $ (110)
Economics of Energy Efficiency Dara Goldberg ‘08 | 92
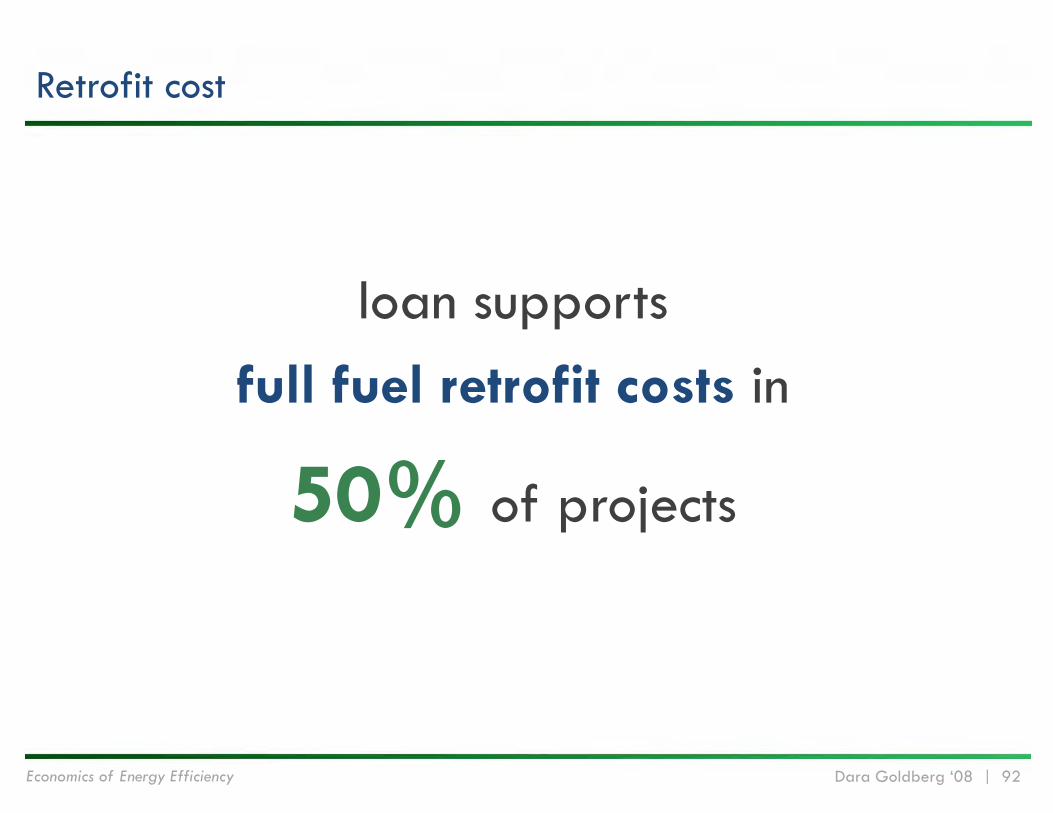
Retrofit cost
loan supportsfull fuel retrofit costs in
50% of projects
Economics of Energy Efficiency Dara Goldberg ‘08 | 93
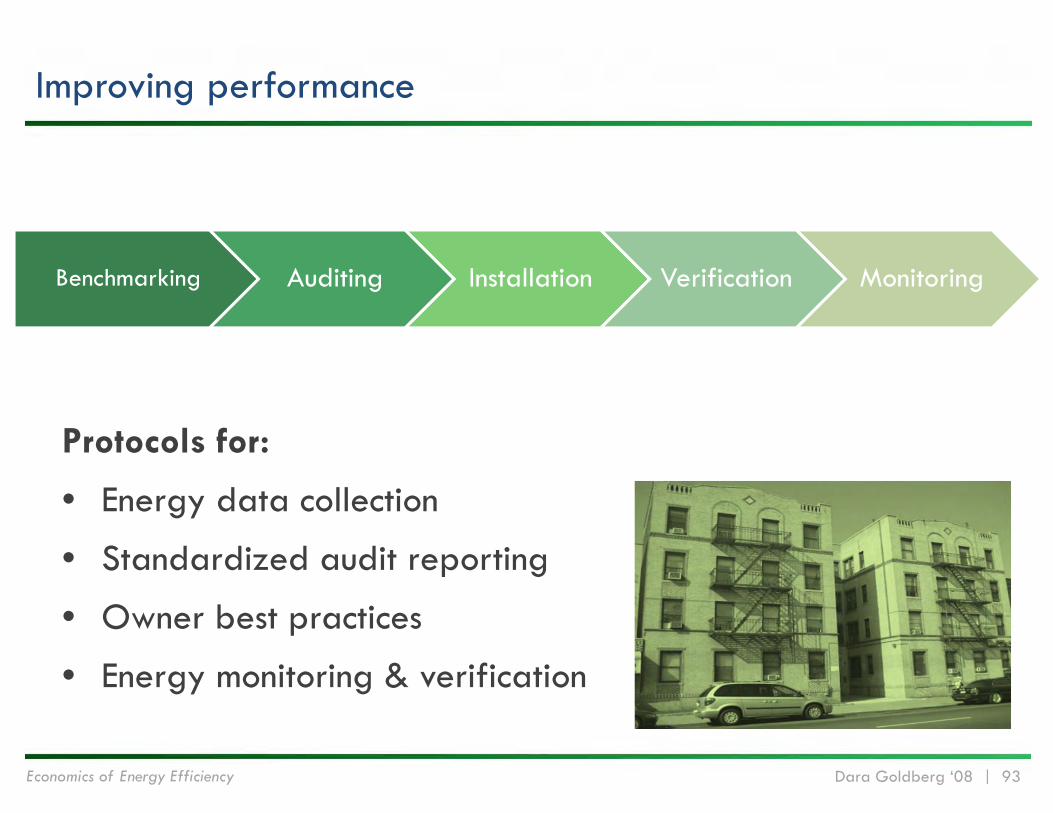
Improving performance
Protocols for:
• Energy data collection
• Standardized audit reporting
• Owner best practices
• Energy monitoring & verification
Benchmarking Auditing Installation Verification Monitoring
Economics of Energy Efficiency Dara Goldberg ‘08 | 94
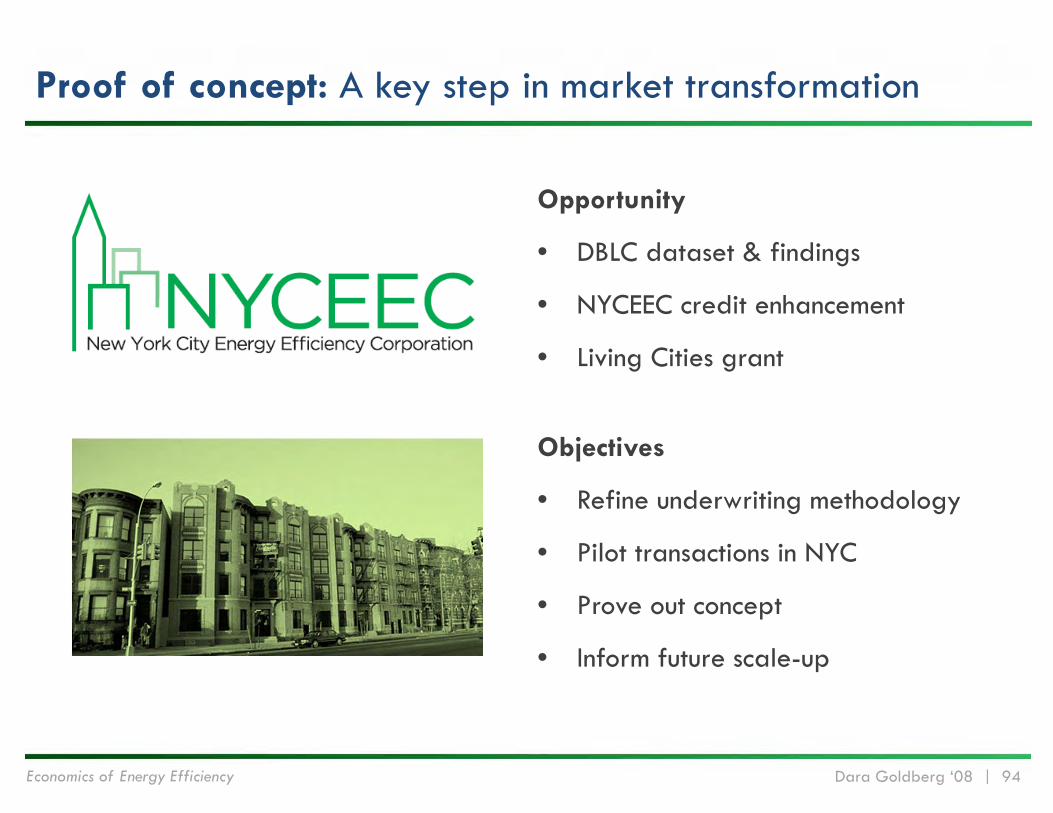
Proof of concept: A key step in market transformation
Opportunity
• DBLC dataset & findings
• NYCEEC credit enhancement
• Living Cities grant
Objectives
• Refine underwriting methodology
• Pilot transactions in NYC
• Prove out concept
• Inform future scale-up
Economics of Energy Efficiency Dara Goldberg ‘08 | 95
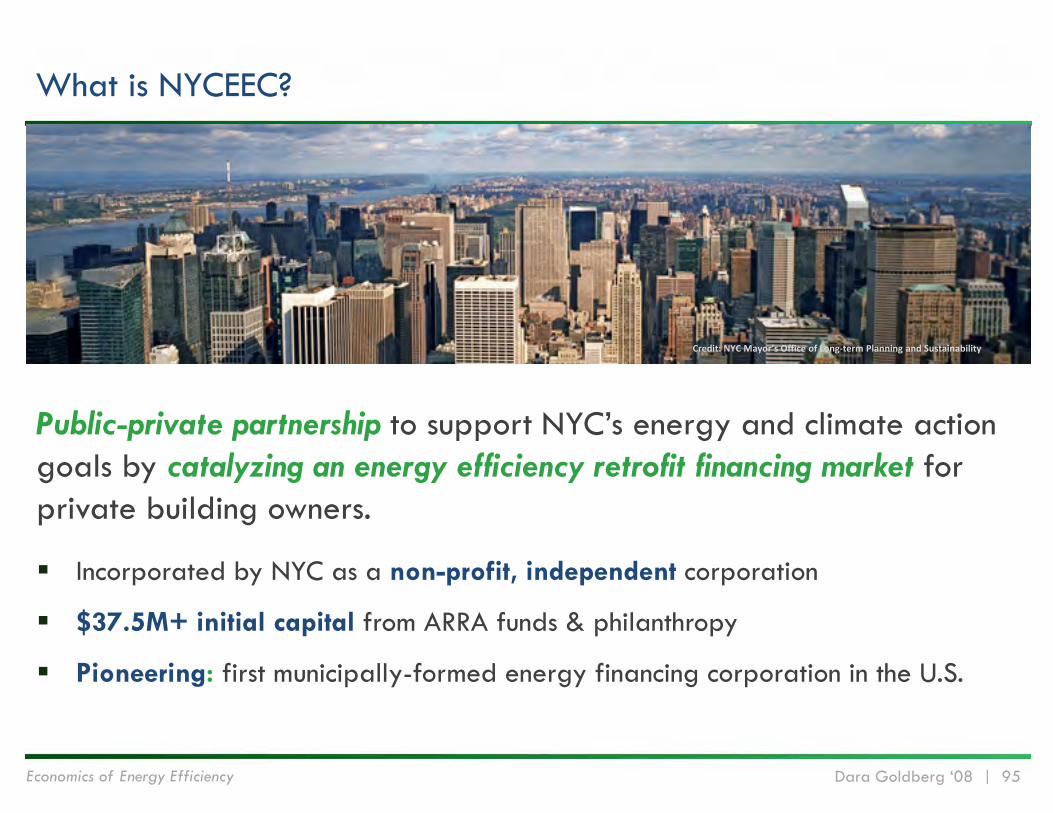
What is NYCEEC?
Public-private partnership to support NYC’s energy and climate action goals by catalyzing an energy efficiency retrofit financing market for private building owners.
Incorporated by NYC as a non-profit, independent corporation
$37.5M+ initial capital from ARRA funds & philanthropy
Pioneering: first municipally-formed energy financing corporation in the U.S.
Credit: NYC Mayor’s Office of Long‐term Planning and Sustainability
Economics of Energy Efficiency Dara Goldberg ‘08 | 96
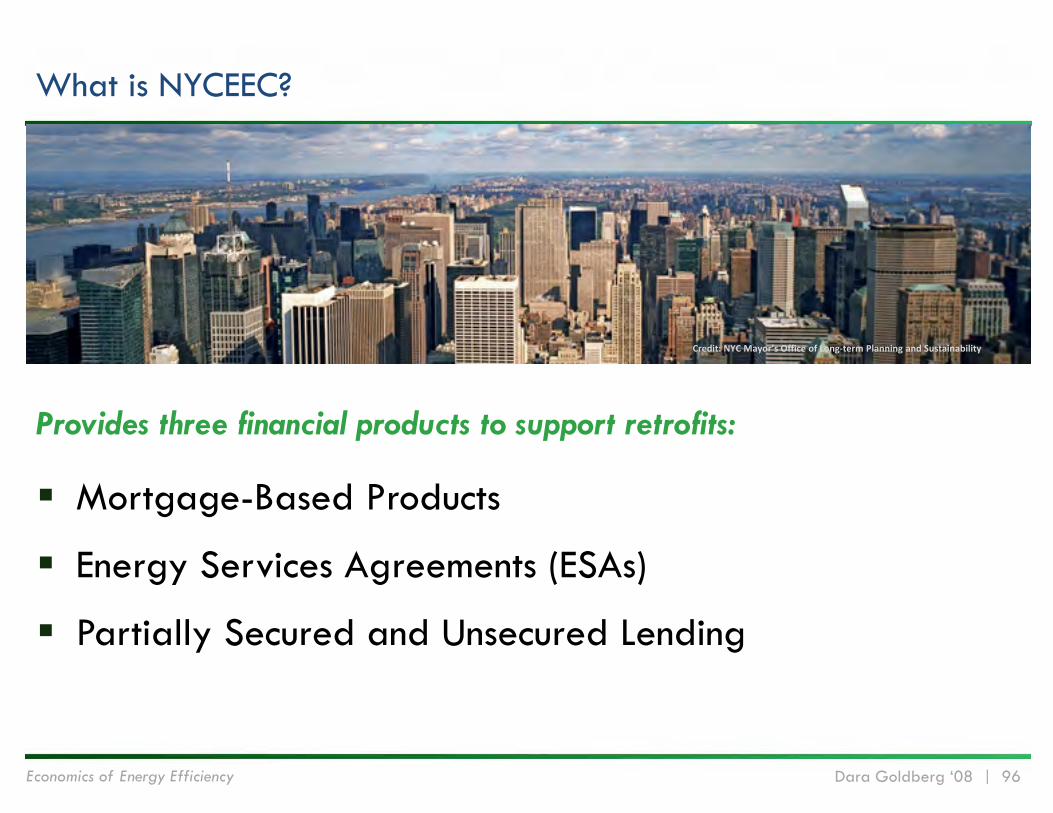
What is NYCEEC?
Provides three financial products to support retrofits:
Mortgage-Based Products
Energy Services Agreements (ESAs)
Partially Secured and Unsecured Lending
Credit: NYC Mayor’s Office of Long‐term Planning and Sustainability
Economics of Energy Efficiency Dara Goldberg ‘08 | 97
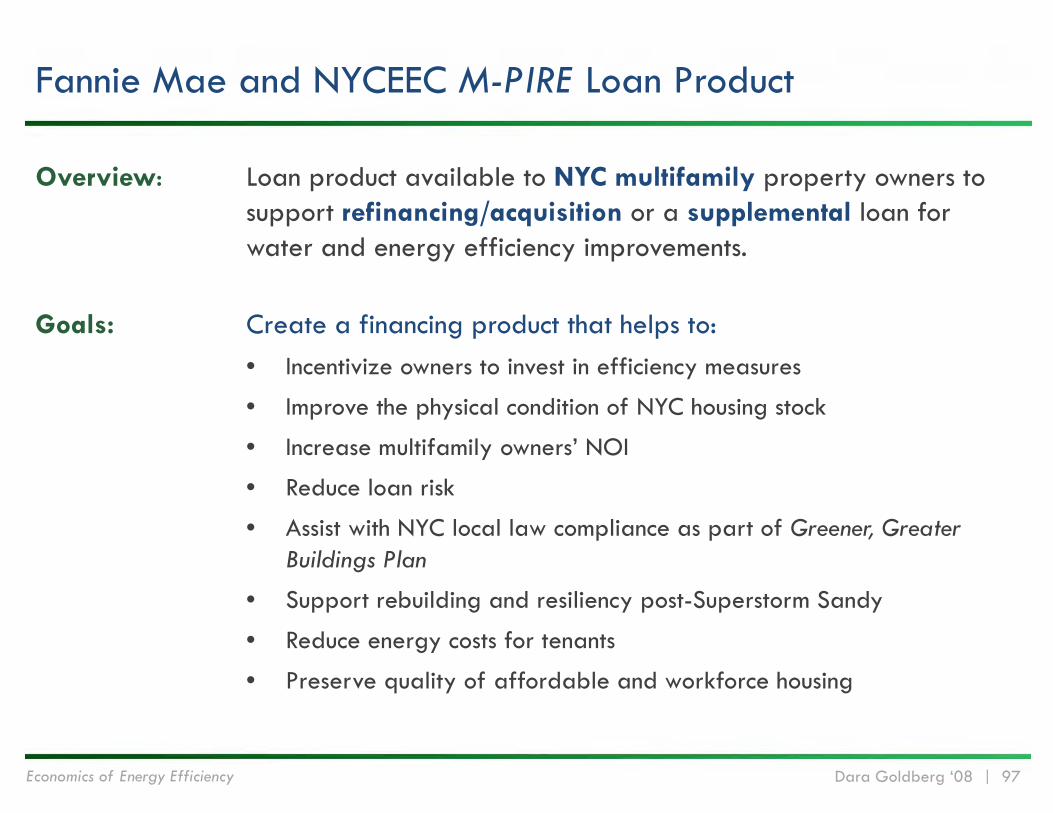
Fannie Mae and NYCEEC M-PIRE Loan Product
Overview: Loan product available to NYC multifamily property owners to support refinancing/acquisition or a supplemental loan for water and energy efficiency improvements.
Goals: Create a financing product that helps to:• Incentivize owners to invest in efficiency measures
• Improve the physical condition of NYC housing stock
• Increase multifamily owners’ NOI
• Reduce loan risk
• Assist with NYC local law compliance as part of Greener, Greater Buildings Plan
• Support rebuilding and resiliency post-Superstorm Sandy
• Reduce energy costs for tenants
• Preserve quality of affordable and workforce housing
Economics of Energy Efficiency Dara Goldberg ‘08 | 98
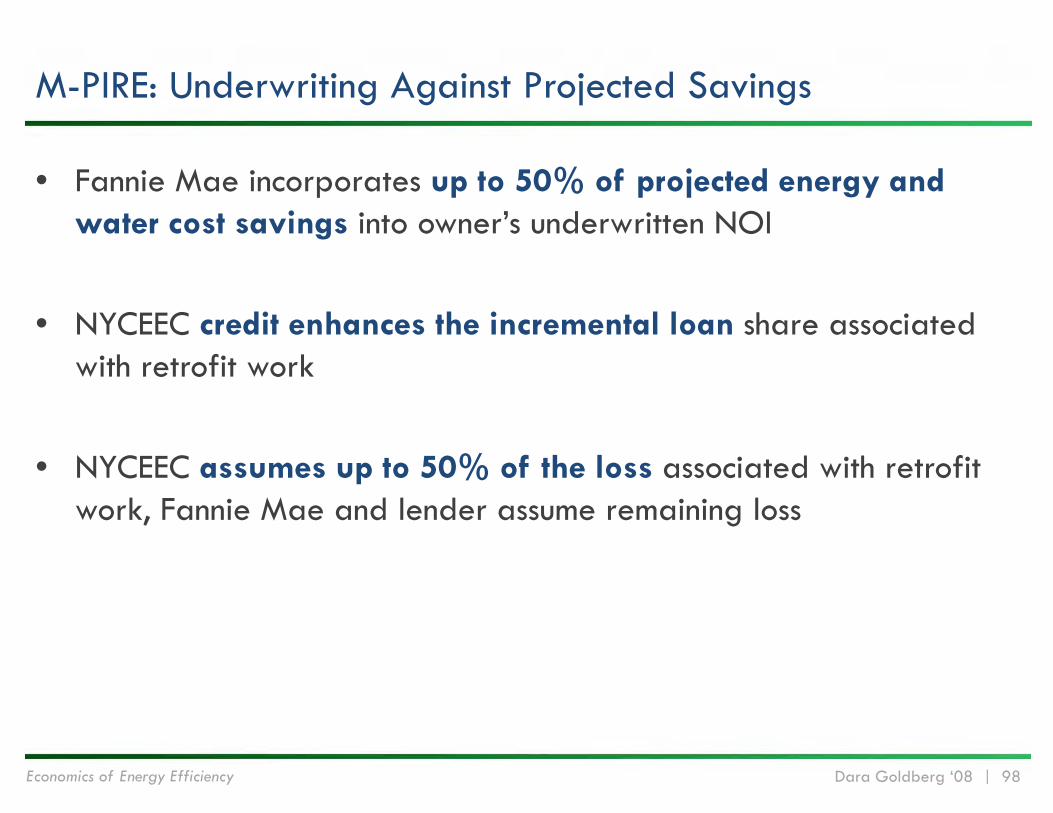
M-PIRE: Underwriting Against Projected Savings
• Fannie Mae incorporates up to 50% of projected energy and water cost savings into owner’s underwritten NOI
• NYCEEC credit enhances the incremental loan share associated with retrofit work
• NYCEEC assumes up to 50% of the loss associated with retrofit work, Fannie Mae and lender assume remaining loss

Economics of Energy Efficiency Dara Goldberg ‘08 | 99
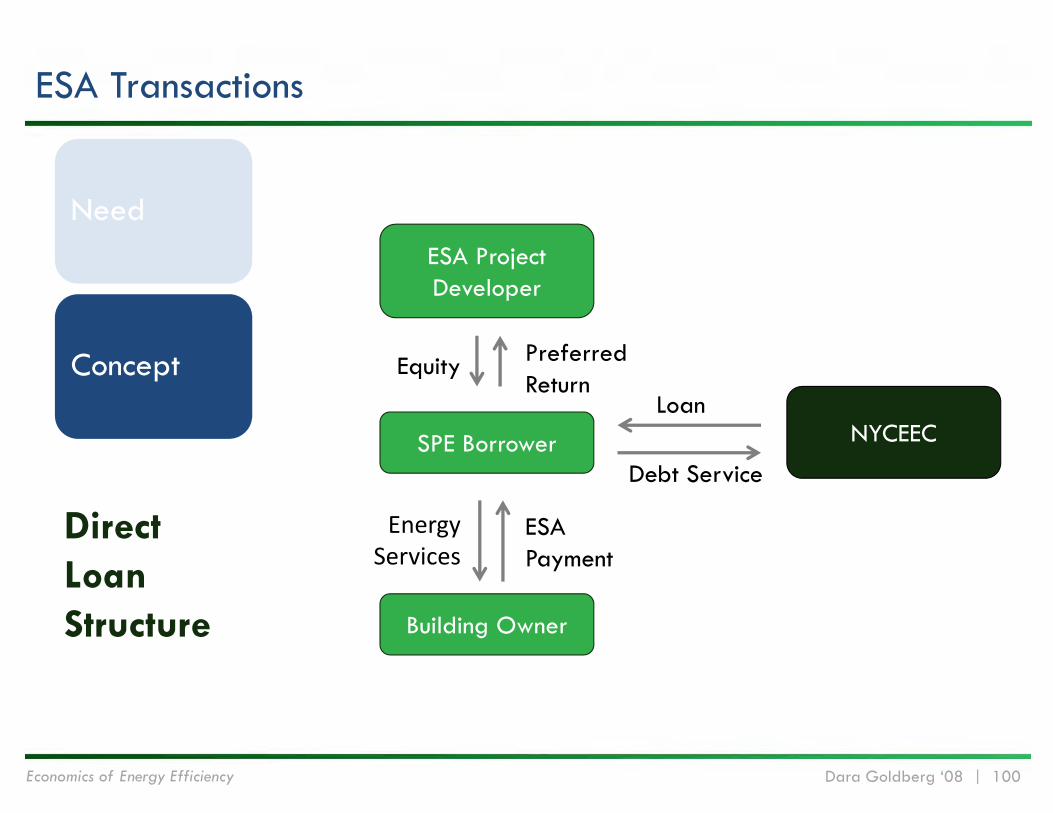
ESAs offer a promising approach for implementing energy efficiency capital work, but the model is new and generally untested in both commercial & multifamily.
ESA Transactions
Need
Concept
Potential Applications
Target Sectors
NYCEEC provides credit enhancement to participating lenders or debt to ESA Special Purpose Entities (SPEs).
Economics of Energy Efficiency Dara Goldberg ‘08 | 100
ESA Transactions
Need
Concept
Potential Applications
Target Sectors
NYCEEC
Building Owner
SPE Borrower
ESA Project Developer
Equity Preferred Return
Energy Services
ESA Payment
Loan
Debt Service
Direct Loan Structure
Economics of Energy Efficiency Dara Goldberg ‘08 | 101
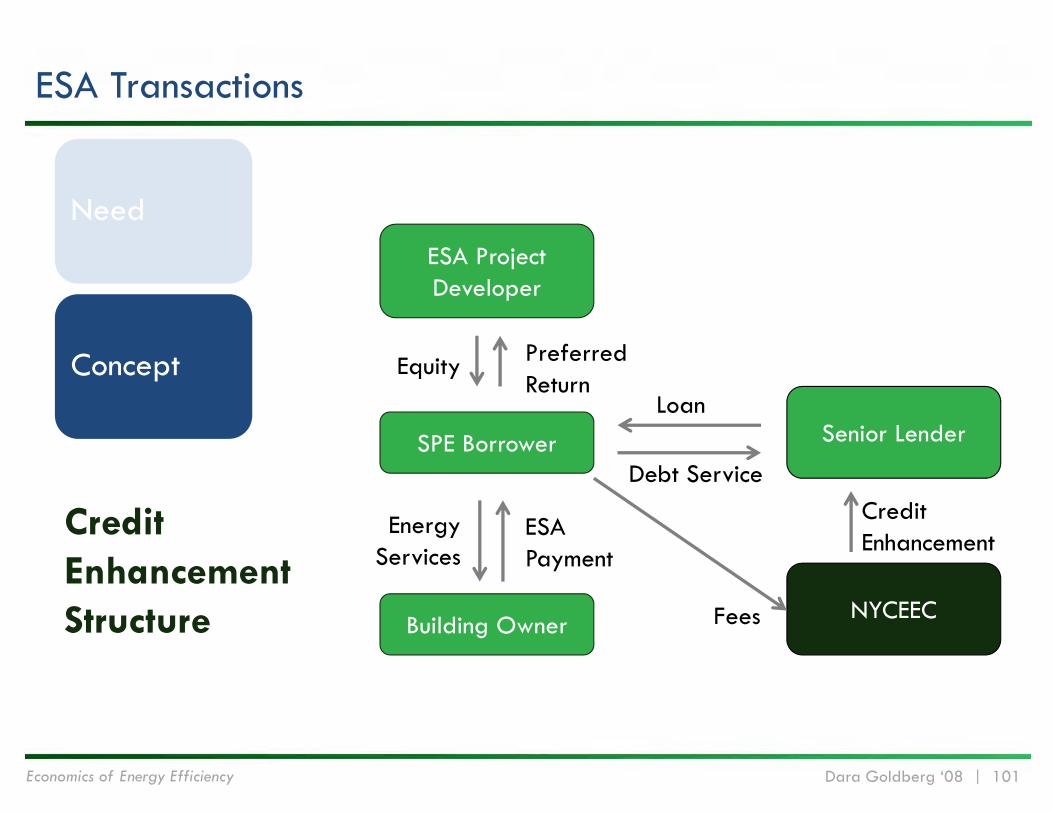
ESA Transactions
Need
Concept
Potential Applications
Target Sectors
Senior Lender
Building Owner
SPE Borrower
ESA Project Developer
Equity Preferred Return
Energy Services
ESA Payment
Loan
Debt Service
Credit Enhancement Structure NYCEEC
Credit Enhancement
Fees
Economics of Energy Efficiency Dara Goldberg ‘08 | 102
In process and completed transactions
Current pipeline represents interest of approximately $14M of NYCEEC capital (approx. 8-10 deals)
All Products
Mortgage-Based Products
In discussion with organizations such as Fannie Mae, HPD, HDC, commercial lenders and CDFIs
ESA Transactions
Closed transaction at 125 Maiden Lane, 320,000 SF class B commercial condo
Second transaction in advanced discussions, and shortlist of discrete transactions
Partially Secured/
Unsecured Lending Products
Term sheet negotiations underway for $8-10M lending facility
Shortlist of discrete opportunities

Questions?
Economics of Energy EfficiencyENGS 44 Sustainable Design | Dara Goldberg ‘08, LEED AP BD+C