Curriculum Review: Analyzing Curriculum Mapping …...Analyzing Curriculum Mapping Data | Analyzing...
35
Taylor Institute Curriculum Review Series #4 Curriculum Review: Analyzing Curriculum Mapping Data Patti Dyjur Frances Kalu January 2017
Transcript of Curriculum Review: Analyzing Curriculum Mapping …...Analyzing Curriculum Mapping Data | Analyzing...

Taylor Institute Curriculum Review Series #4
Curriculum Review: Analyzing Curriculum Mapping Data
Patti Dyjur Frances Kalu January 2017

Analyzing Curriculum Mapping Data | Table of Contents 2
Authors Patti Dyjur, Curriculum Development Specialist Taylor Institute for Teaching and Learning, University of Calgary Frances Kalu, Curriculum Development Specialist Taylor Institute for Teaching and Learning, University of Calgary January 2017 Taylor Institute for Teaching and Learning 434 Collegiate Blvd NW University of Calgary, Calgary, AB Canada T2N 1N4 Recommended Citation Dyjur, P. & Kalu, F. (2017). Curriculum review: Analyzing curriculum mapping data. Calgary:
University of Calgary.

Analyzing Curriculum Mapping Data | Table of Contents 3
TableofContents
Table of Contents .......................................................................................................................................... 3
Presenting Curriculum Mapping Data ........................................................................................................... 4
Analyzing an Individual Course ..................................................................................................................... 5
Questions to Analyze Individual Course Maps.............................................................................................. 8
Analyzing Aggregate Charts .......................................................................................................................... 9
Analyzing Course Streams ........................................................................................................................... 10
Analyzing Multiple Sections of a Course ..................................................................................................... 12
Bar Chart Summarizing the Number and Depth of Course Outcomes per PLO for Required Courses ....... 14
Bar Chart Summarizing the Number and Depth of Course Outcomes per PLO for All Courses ................. 16
Required Courses in a Program and Depth of PLO ..................................................................................... 18
All Courses in a Program and Depth of PLO ................................................................................................ 19
Student Assessment Methods Across a Program ....................................................................................... 21
Teaching and Learning Activities per PLO ................................................................................................... 22
How PLOs are Taught and Assessed ........................................................................................................... 24
Matrix of Teaching and Learning Activities Across a Program .................................................................... 26
Matrix of Content Relating to Writing Skills in Required Courses .............................................................. 27
Creating Charts on Special Topics ............................................................................................................... 28
Planning Chart ............................................................................................................................................. 30
Analyzing Curriculum Maps at the Program Level ...................................................................................... 31
Questions for Collaborative Discussion and Engagement ...................................................................... 31
Questions for Review Leads ........................................................................................................................ 33
Ways to Involve All Faculty in Data Analysis ............................................................................................... 34
References .................................................................................................................................................. 35
Analyzing Curriculum Mapping Data | Presenting Curriculum Mapping Data 4
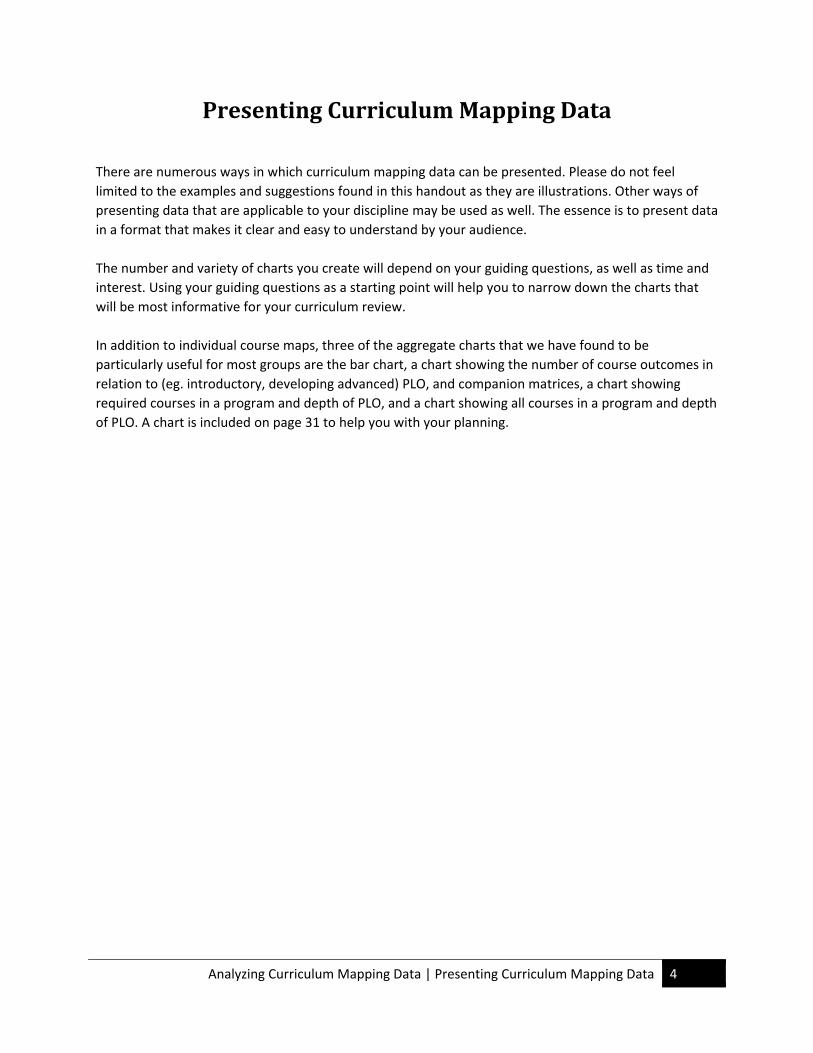
PresentingCurriculumMappingData There are numerous ways in which curriculum mapping data can be presented. Please do not feel
limited to the examples and suggestions found in this handout as they are illustrations. Other ways of
presenting data that are applicable to your discipline may be used as well. The essence is to present data
in a format that makes it clear and easy to understand by your audience.
The number and variety of charts you create will depend on your guiding questions, as well as time and
interest. Using your guiding questions as a starting point will help you to narrow down the charts that
will be most informative for your curriculum review.
In addition to individual course maps, three of the aggregate charts that we have found to be
particularly useful for most groups are the bar chart, a chart showing the number of course outcomes in
relation to (eg. introductory, developing advanced) PLO, and companion matrices, a chart showing
required courses in a program and depth of PLO, and a chart showing all courses in a program and depth
of PLO. A chart is included on page 31 to help you with your planning.

Analyzing Curriculum Mapping Data | Analyzing an Individual Course 5
AnalyzinganIndividualCourse First Level of Analysis
The chart below is an example of how an introductory interdisciplinary course for instance can be mapped to the program‐level learning outcomes (PLOs) of a program using a paper‐based method of curriculum mapping. Data is presented in a chart showing the alignment of the course outcomes for this course to the PLOs.
Introductory course in Interdisciplinary Studies (full‐year course)
Knowledge of
theo
ries and
concepts
Approaches to
solving problems
Evaluate qualitative
info
Evaluate
quantitative info
Communicate orally
and in
writing
Apply knowledge &
skills in different
contexts
Design and
implemen
t research
Ethical
understanding
Understand the foundations of interdisciplinary studies and its methods
D
D
I
Understand a range of disciplinary perspectives that influence how we think about, talk about, and use technology
D
I
Develop competence in reading and interpreting research
I
I
Develop competence in oral and written expression
D
Reflect critically on how knowledge is produced about technology.
D
D
I
D
`
PLOs
Course outcomes
Analyzing Curriculum Mapping Data | Analyzing an Individual Course 6
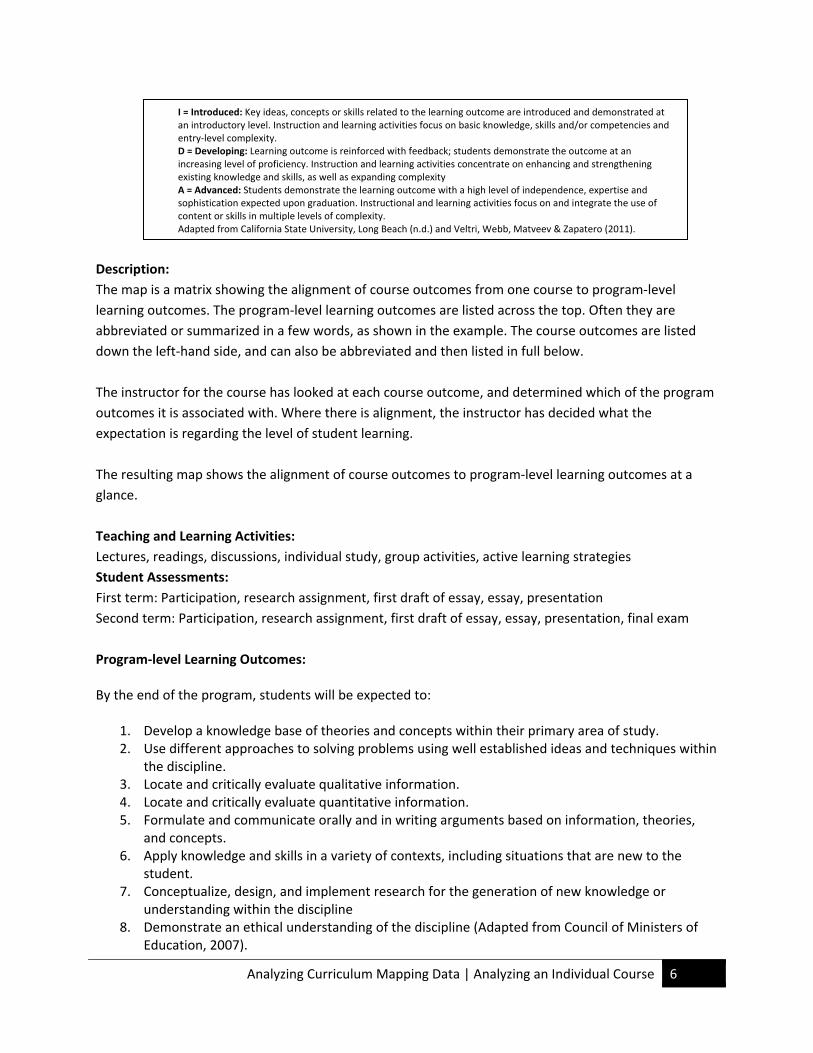
Description:
The map is a matrix showing the alignment of course outcomes from one course to program‐level
learning outcomes. The program‐level learning outcomes are listed across the top. Often they are
abbreviated or summarized in a few words, as shown in the example. The course outcomes are listed
down the left‐hand side, and can also be abbreviated and then listed in full below.
The instructor for the course has looked at each course outcome, and determined which of the program
outcomes it is associated with. Where there is alignment, the instructor has decided what the
expectation is regarding the level of student learning.
The resulting map shows the alignment of course outcomes to program‐level learning outcomes at a
glance.
Teaching and Learning Activities:
Lectures, readings, discussions, individual study, group activities, active learning strategies
Student Assessments:
First term: Participation, research assignment, first draft of essay, essay, presentation
Second term: Participation, research assignment, first draft of essay, essay, presentation, final exam
Program‐level Learning Outcomes: By the end of the program, students will be expected to:
1. Develop a knowledge base of theories and concepts within their primary area of study. 2. Use different approaches to solving problems using well established ideas and techniques within
the discipline. 3. Locate and critically evaluate qualitative information. 4. Locate and critically evaluate quantitative information. 5. Formulate and communicate orally and in writing arguments based on information, theories,
and concepts. 6. Apply knowledge and skills in a variety of contexts, including situations that are new to the
student. 7. Conceptualize, design, and implement research for the generation of new knowledge or
understanding within the discipline 8. Demonstrate an ethical understanding of the discipline (Adapted from Council of Ministers of
Education, 2007).
I = Introduced: Key ideas, concepts or skills related to the learning outcome are introduced and demonstrated at an introductory level. Instruction and learning activities focus on basic knowledge, skills and/or competencies and entry‐level complexity. D = Developing: Learning outcome is reinforced with feedback; students demonstrate the outcome at an increasing level of proficiency. Instruction and learning activities concentrate on enhancing and strengthening existing knowledge and skills, as well as expanding complexity A = Advanced: Students demonstrate the learning outcome with a high level of independence, expertise and sophistication expected upon graduation. Instructional and learning activities focus on and integrate the use of content or skills in multiple levels of complexity. Adapted from California State University, Long Beach (n.d.) and Veltri, Webb, Matveev & Zapatero (2011).
Analyzing Curriculum Mapping Data | Analyzing an Individual Course 7
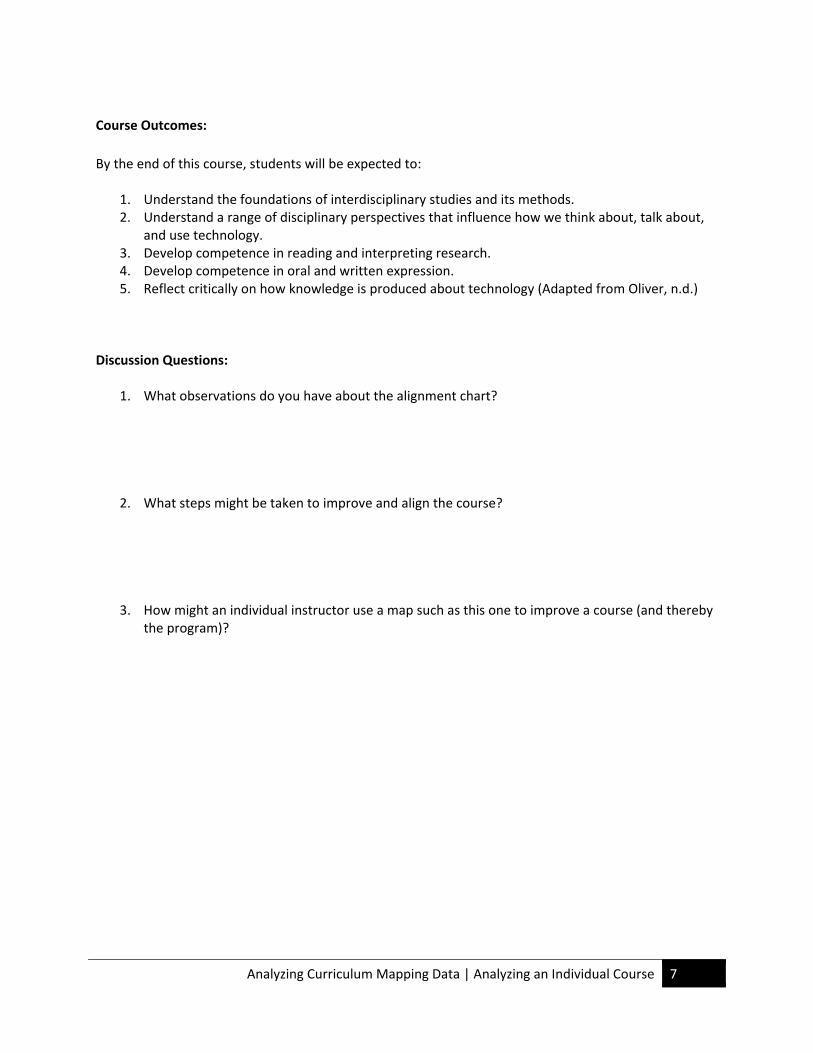
Course Outcomes:
By the end of this course, students will be expected to:
1. Understand the foundations of interdisciplinary studies and its methods. 2. Understand a range of disciplinary perspectives that influence how we think about, talk about,
and use technology. 3. Develop competence in reading and interpreting research. 4. Develop competence in oral and written expression. 5. Reflect critically on how knowledge is produced about technology (Adapted from Oliver, n.d.)
Discussion Questions:
1. What observations do you have about the alignment chart?
2. What steps might be taken to improve and align the course?
3. How might an individual instructor use a map such as this one to improve a course (and thereby the program)?
Analyzing Curriculum Mapping Data | Questions to Analyze Individual Course Maps 8
QuestionstoAnalyzeIndividualCourseMaps Course outcomes and expectations of student learning:
Are they clearly articulated? Are revisions needed? Is anything missing?
How well do they align with program‐level learning outcomes?
Are expectations of student learning reasonable? Teaching and learning activities (TLAs):
To what extent do teaching and learning activities (TLAs) facilitate student learning of the course outcomes?
Do TLAs emphasize factual recall only, or are students also challenged with activities that include critical thinking, application and analysis?
Is there sufficient variety in the course or does it rely heavily on one approach? Student assessments:
To what extent do assessments facilitate student learning of the course outcomes?
To what extent do student assessments measure what students know regarding course outcomes? In other words, how valid are the student assessments?
Do the assessments emphasize factual recall only, or are students also challenged with assignments that include critical thinking, application and analysis?
Do the assessment weightings reflect the degree of work required and the importance of the work?
Is there sufficient variety in the assessments to allow students to demonstrate their understanding in different ways, or does the course rely heavily on one approach?
How are you providing feedback to students? General:
What changes need to be made to the course?
Does the course focus on what is important?
What is memorable about the course?
Is the content accurate and up to date? In context with other courses:
Does the course design make sense considering the context of how it fits within the program? How well does it fit in with the sequence of courses within the program?
Are expectations of student learning progressing with subsequent courses?
Analyzing Curriculum Mapping Data | Analyzing Aggregate Charts 9
AnalyzingAggregateCharts Second Level of Analysis The second level of analysis occurs at the program level once the aggregate charts have been created. They prompt you to think about curriculum from a program perspective, rather than on a course by course basis. By examining how the courses fit together you can begin to see trends, gaps, and overlap. They can be used as an important source of evidence to inform curriculum discussions and decisions.
Analyzing Curriculum Mapping Data | Analyzing Course Streams 10
AnalyzingCourseStreams
Disciplinary Knowledge
Critical Thinking
Communication Research Skills
Ethical Reasoning
COURSE #202
Course Outcome #1 D I
Course Outcome #2 D A
Course Outcome #3 D D
Course Outcome #4 I
Course Outcome #5 A A
COURSE #302
Course Outcome #1 I I
Course Outcome #2 I I
Course Outcome #3 I I
Course Outcome #4 I I
COURSE #402
Course Outcome #1 D
Course Outcome #2 D I
Course Outcome #3 A
Course Outcome #4 A D D
Course Outcome #5 D
Description:
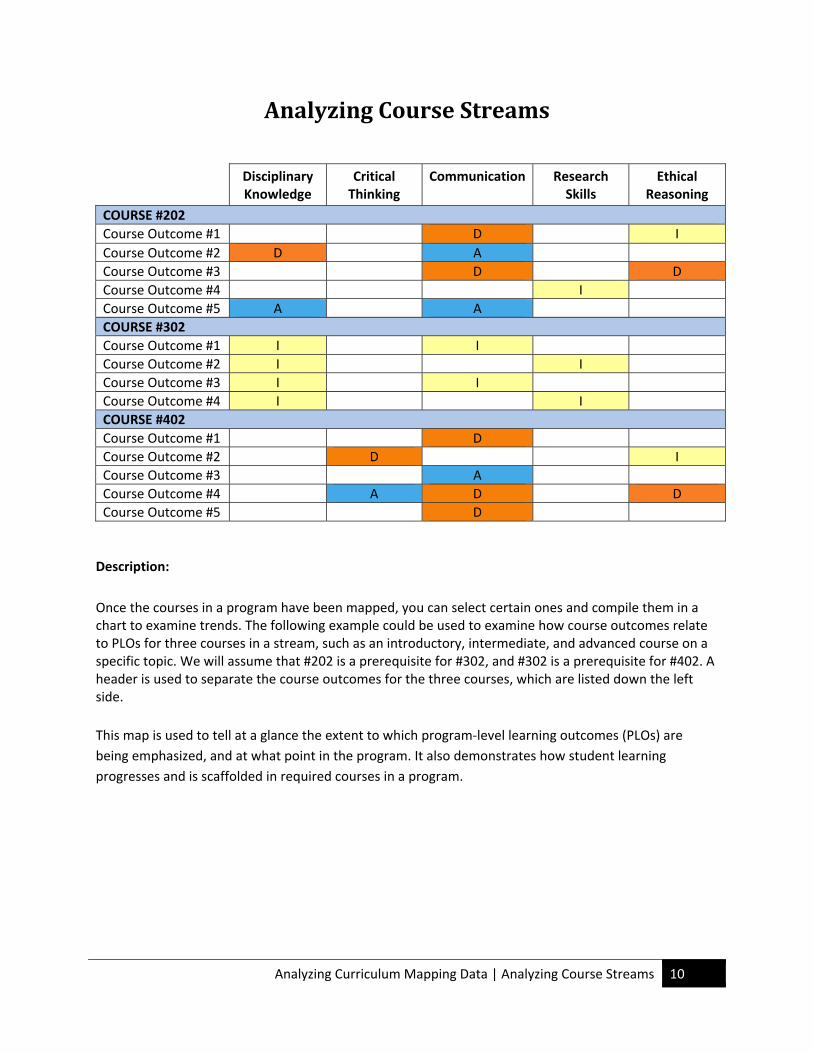
Once the courses in a program have been mapped, you can select certain ones and compile them in a chart to examine trends. The following example could be used to examine how course outcomes relate to PLOs for three courses in a stream, such as an introductory, intermediate, and advanced course on a specific topic. We will assume that #202 is a prerequisite for #302, and #302 is a prerequisite for #402. A header is used to separate the course outcomes for the three courses, which are listed down the left side.
This map is used to tell at a glance the extent to which program‐level learning outcomes (PLOs) are
being emphasized, and at what point in the program. It also demonstrates how student learning
progresses and is scaffolded in required courses in a program.

Analyzing Curriculum Mapping Data | Analyzing Course Streams 11
Questions to Analyze the Chart:
1. What general trends do you see in the data?
2. Where is the emphasis in the program? What PLOs are being most/least emphasized?
3. How could student learning be enhanced through changes to:
• Course sequence?
• Emphasis of specific PLOs?
• Scaffolding of student learning?
• Expectations of student learning (I, D, A)?
4. How might this type of chart be useful for your department or faculty when analyzing
curriculum mapping data?
Analyzing Curriculum Mapping Data | Analyzing Multiple Sections of a Course 12
AnalyzingMultipleSectionsofaCourse
Disciplinary Knowledge
Critical Thinking
Communication Research Skills
Ethical Reasoning
COURSE #201 Section 1
Course Outcome #1 I
Course Outcome #2 I D
Course Outcome #3 I I
Course Outcome #4 D D I
Course Outcome #5 I I
COURSE #201 Section 2
Course Outcome #1 I D
Course Outcome #2 I I
Course Outcome #3 I I I
Course Outcome #4 I D
COURSE #201 Section 3
Course Outcomes No data
COURSE #201 Section 4
Course Outcome #1 D D
Course Outcome #2 I D I
Course Outcome #3 D D
Course Outcome #4 D D I
Course Outcome #5 D D D I
Course Outcome #6 I D D I
Course Outcome #7 A A
Course Outcome #8 D D
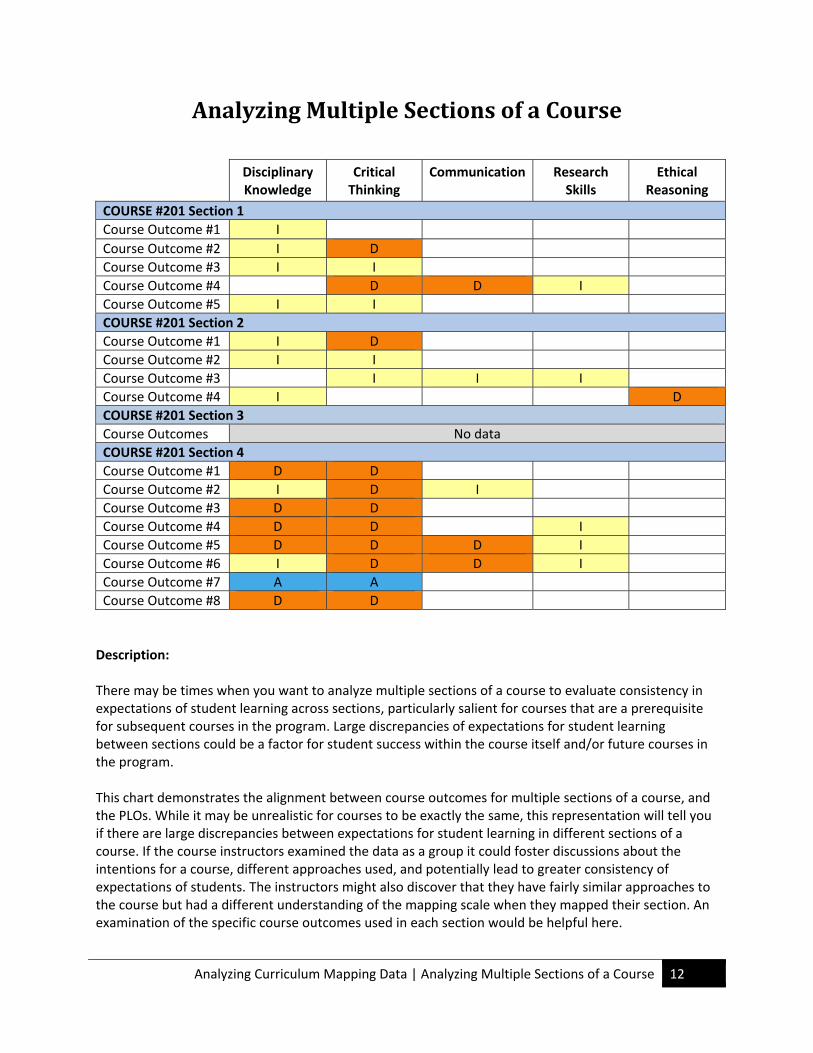
Description: There may be times when you want to analyze multiple sections of a course to evaluate consistency in expectations of student learning across sections, particularly salient for courses that are a prerequisite for subsequent courses in the program. Large discrepancies of expectations for student learning between sections could be a factor for student success within the course itself and/or future courses in the program. This chart demonstrates the alignment between course outcomes for multiple sections of a course, and the PLOs. While it may be unrealistic for courses to be exactly the same, this representation will tell you if there are large discrepancies between expectations for student learning in different sections of a course. If the course instructors examined the data as a group it could foster discussions about the intentions for a course, different approaches used, and potentially lead to greater consistency of expectations of students. The instructors might also discover that they have fairly similar approaches to the course but had a different understanding of the mapping scale when they mapped their section. An examination of the specific course outcomes used in each section would be helpful here.
Analyzing Curriculum Mapping Data | Analyzing Multiple Sections of a Course 13
Questions to Analyze the Chart:
1. In what ways do the different sections of the course show general consistency between
sections?
2. Where are there substantial differences between sections of the course?
3. How might you foster productive discussions between section instructors to promote
consistency of expectations of student learning?
4. Are there any courses in your program that you think might benefit from creating this type of
data representation?

Analyzing Curriculum Mapping Data | Bar Chart Summarizing the Number and Depth of Course Outcomes per PLO for Required Courses
14
BarChartSummarizingtheNumberandDepthofCourseOutcomesperPLOforRequiredCourses
Notes: No data for 320
Description:
This bar chart summarizes the number of course outcomes related to each of the program‐level learning
outcomes (PLOs) for required courses in the program. It tells you at a glance which PLOs are being
emphasized, and to what degree, for all majors in the program. At this point the conversation shifts
from focusing on what one course contributes to the program, to a collective view of the effectiveness
of the program.
Bars indicate the number of course outcomes that contribute to each PLO, added up from all courses in
the program. Each bar is broken into three sections, representing the number of course outcomes at the
Introductory, Developing, and Advanced levels. Looking at PLO #1, four course outcomes address it at
the ‘Introductory’ level, four address it at the level of ‘Developing’, and four address it to an ‘Advanced’
degree.
0246810121416
Advanced
Developing
Introduced
Freq
uency (Count – No. of
course outcomes)

Analyzing Curriculum Mapping Data | Bar Chart Summarizing the Number and Depth of Course Outcomes per PLO for Required Courses
15
Questions to Analyze the Data
1. What are the strengths of the program?
2. Which PLOs are being least emphasized? Looking at our priorities for the program (PLOs), what
are we collectively not doing well enough?
3. Is it necessary or even desirable to emphasize PLOs equally? Are some PLOs more important
than others? Who decides what emphasis should be given to the different PLOs? How will such
decisions be made?
4. What strategies do you have for presenting such data to your faculty and facilitating discussion
around:
• What the data mean
• How to analyze the chart
• Recommendations based on the evidence
Analyzing Curriculum Mapping Data | Bar Chart Summarizing the Number and Depth of Course Outcomes per PLO for All Courses
16
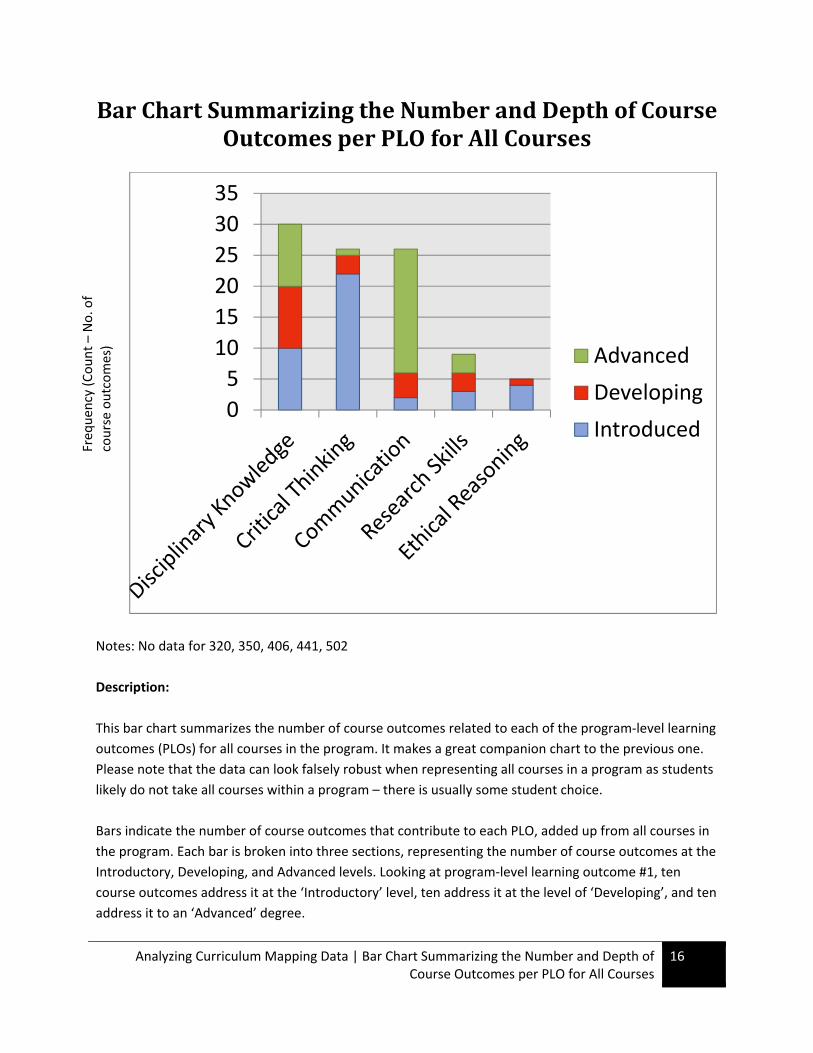
BarChartSummarizingtheNumberandDepthofCourseOutcomesperPLOforAllCourses
Notes: No data for 320, 350, 406, 441, 502
Description:
This bar chart summarizes the number of course outcomes related to each of the program‐level learning
outcomes (PLOs) for all courses in the program. It makes a great companion chart to the previous one.
Please note that the data can look falsely robust when representing all courses in a program as students
likely do not take all courses within a program – there is usually some student choice.
Bars indicate the number of course outcomes that contribute to each PLO, added up from all courses in
the program. Each bar is broken into three sections, representing the number of course outcomes at the
Introductory, Developing, and Advanced levels. Looking at program‐level learning outcome #1, ten
course outcomes address it at the ‘Introductory’ level, ten address it at the level of ‘Developing’, and ten
address it to an ‘Advanced’ degree.
0
5
10
15
20
25
30
35
Advanced
Developing
Introduced
Freq
uency (Count – No. of
course outcomes)
Analyzing Curriculum Mapping Data | Bar Chart Summarizing the Number and Depth of Course Outcomes per PLO for All Courses
17
Questions to Analyze the Data
1. What are the strengths of the program?
2. Which PLOs are being least emphasized? Looking at our priorities for the program (PLOs), what
are we collectively not doing well enough?

Analyzing Curriculum Mapping Data | Required Courses in a Program and Depth of PLO 18
RequiredCoursesinaProgramandDepthofPLO
COURSE No. Disciplinary Knowledge
Critical Thinking
Written Communication
Research Skills
Ethical Reasoning
COURSE 201 I I I
COURSE 203 I I I
COURSE 220 D I I
COURSE 230 D D I I
COURSE 301 A A D
COURSE 303 I I D I
COURSE 330 No data
COURSE 401 A D D A
COURSE 403 I D D
I = Introduced: Key ideas, concepts or skills related to the learning outcome are introduced and demonstrated at an introductory level. Instruction and learning activities focus on basic knowledge, skills and/or competencies and entry‐level complexity. D = Developing: Learning outcome is reinforced with feedback; students demonstrate the outcome at an increasing level of proficiency. Instruction and learning activities concentrate on enhancing and strengthening existing knowledge and skills, as well as expanding complexity A = Advanced: Students demonstrate the learning outcome with a high level of independence, expertise and sophistication expected upon graduation. Instructional and learning activities focus on and integrate the use of content or skills in multiple levels of complexity. Adapted from California State University, Long Beach (n.d.) and Veltri, Webb, Matveev & Zapatero (2011).
Description:
This chart has PLOs listed across the top. Required courses in the program are listed down the left‐hand
side. The most frequently indicated alignment is captured in each cell. For example, in Course 201,
course outcomes related to Disciplinary Knowledge most frequently at the Introductory level. Where
course outcomes related equally at two levels (for example, one course outcome aligned at an
Introductory level and one at a Developing level), the higher alignment was indicated on the chart.
Presenting the data in this way is helpful to view the program from a student perspective because
required courses are the only ones that students are guaranteed to take.
Analyzing Curriculum Mapping Data | All Courses in a Program and Depth of PLO 19
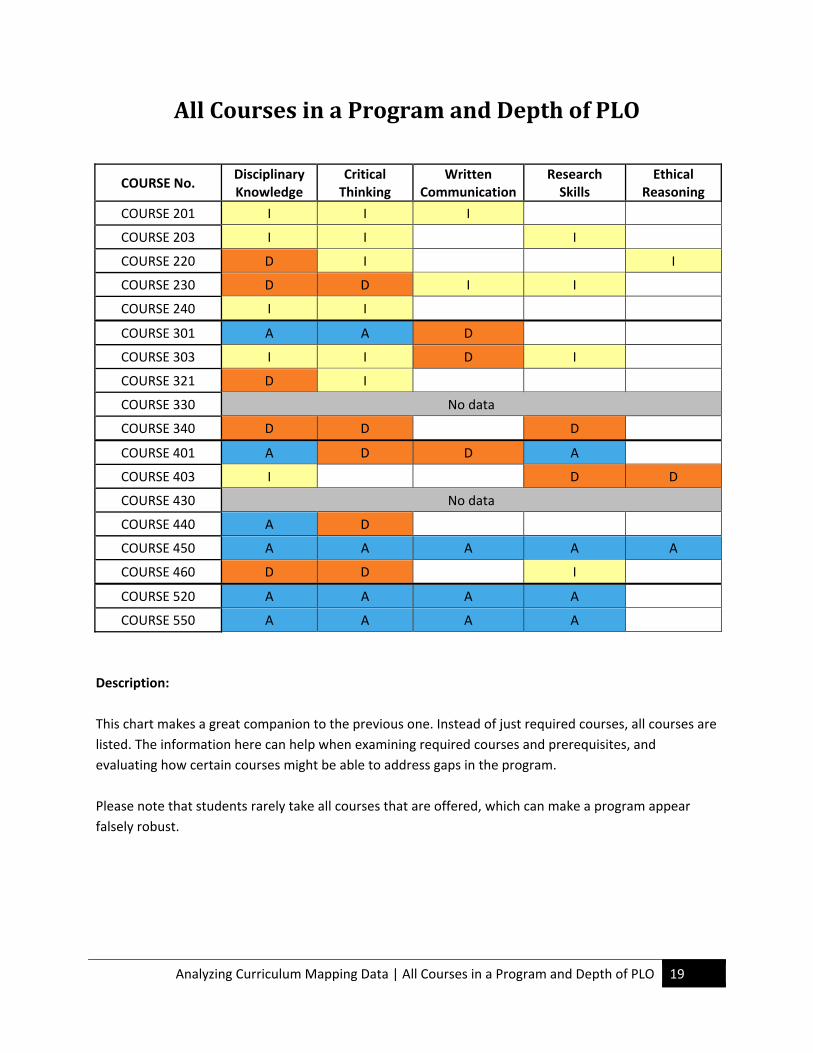
AllCoursesinaProgramandDepthofPLO
COURSE No. Disciplinary Knowledge
Critical Thinking
Written Communication
Research Skills
Ethical Reasoning
COURSE 201 I I I
COURSE 203 I I I
COURSE 220 D I I
COURSE 230 D D I I
COURSE 240 I I
COURSE 301 A A D
COURSE 303 I I D I
COURSE 321 D I
COURSE 330 No data
COURSE 340 D D D
COURSE 401 A D D A
COURSE 403 I D D
COURSE 430 No data
COURSE 440 A D
COURSE 450 A A A A A
COURSE 460 D D I
COURSE 520 A A A A
COURSE 550 A A A A
Description:
This chart makes a great companion to the previous one. Instead of just required courses, all courses are
listed. The information here can help when examining required courses and prerequisites, and
evaluating how certain courses might be able to address gaps in the program.
Please note that students rarely take all courses that are offered, which can make a program appear
falsely robust.
Analyzing Curriculum Mapping Data | All Courses in a Program and Depth of PLO 20
Discussion questions:
1. What curriculum questions might be better informed by the first chart? By the second chart?
2. What strategies would you use to engage instructors in the process of analyzing the data? How
would you guide them through a process to analyze the charts and make recommendations
based on the evidence?
Analyzing Curriculum Mapping Data | Student Assessment Methods Across a Program 21
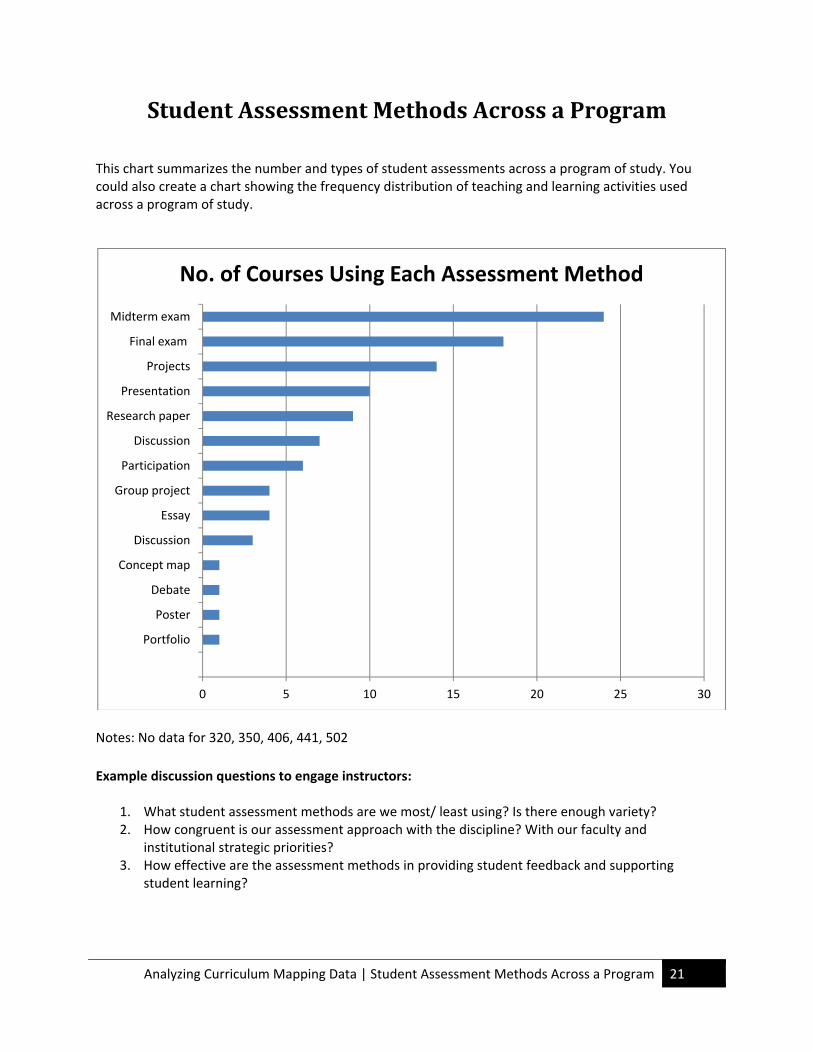
StudentAssessmentMethodsAcrossaProgram This chart summarizes the number and types of student assessments across a program of study. You could also create a chart showing the frequency distribution of teaching and learning activities used across a program of study.
Notes: No data for 320, 350, 406, 441, 502
Example discussion questions to engage instructors:
1. What student assessment methods are we most/ least using? Is there enough variety? 2. How congruent is our assessment approach with the discipline? With our faculty and
institutional strategic priorities? 3. How effective are the assessment methods in providing student feedback and supporting
student learning?
0 5 10 15 20 25 30
Portfolio
Poster
Debate
Concept map
Discussion
Essay
Group project
Participation
Discussion
Research paper
Presentation
Projects
Final exam
Midterm exam
No. of Courses Using Each Assessment Method
Analyzing Curriculum Mapping Data | Teaching and Learning Activities per PLO 22
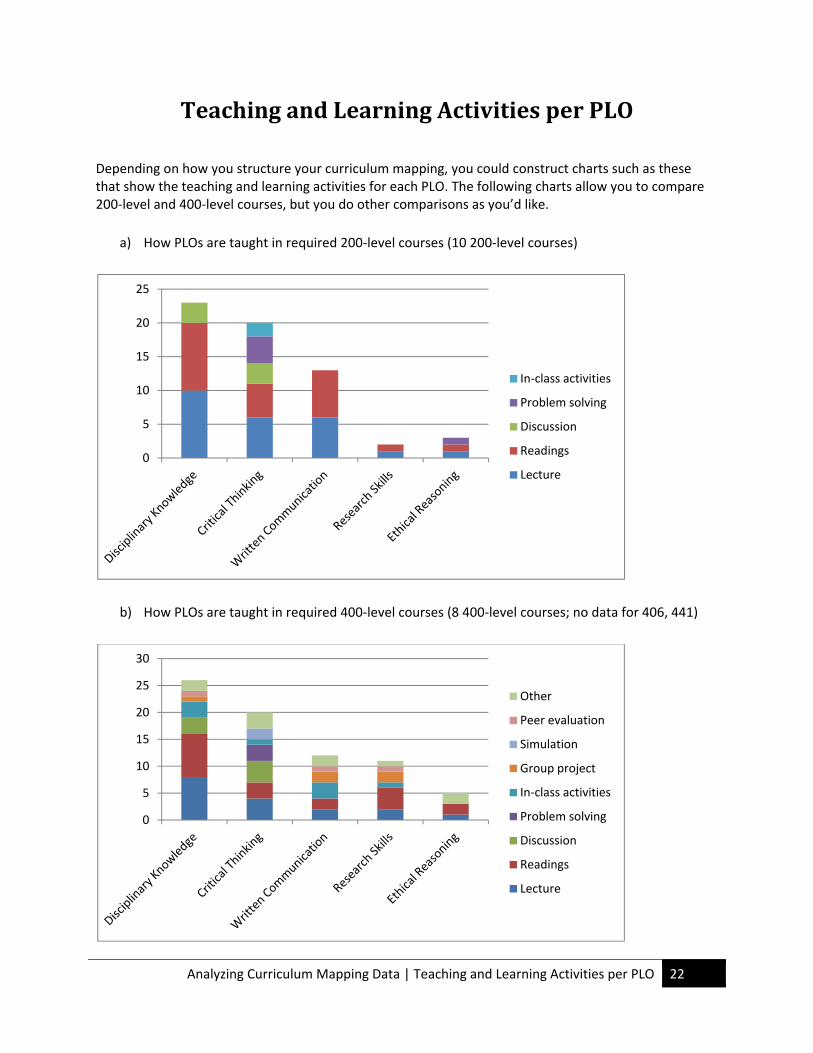
TeachingandLearningActivitiesperPLO Depending on how you structure your curriculum mapping, you could construct charts such as these that show the teaching and learning activities for each PLO. The following charts allow you to compare 200‐level and 400‐level courses, but you do other comparisons as you’d like.
a) How PLOs are taught in required 200‐level courses (10 200‐level courses)
b) How PLOs are taught in required 400‐level courses (8 400‐level courses; no data for 406, 441)
0
5
10
15
20
25
In‐class activities
Problem solving
Discussion
Readings
Lecture
0
5
10
15
20
25
30
Other
Peer evaluation
Simulation
Group project
In‐class activities
Problem solving
Discussion
Readings
Lecture

Analyzing Curriculum Mapping Data | Teaching and Learning Activities per PLO 23
Questions to analyze the data:
1. What observations do you have about the charts? What do they tell you about the types of
teaching and learning activities used in 200‐level courses and 400‐level courses?
2. What questions do you have about teaching and learning activities across the program that are
not answered by the charts?
Analyzing Curriculum Mapping Data | How PLOs are Taught and Assessed 24
HowPLOsareTaughtandAssessed
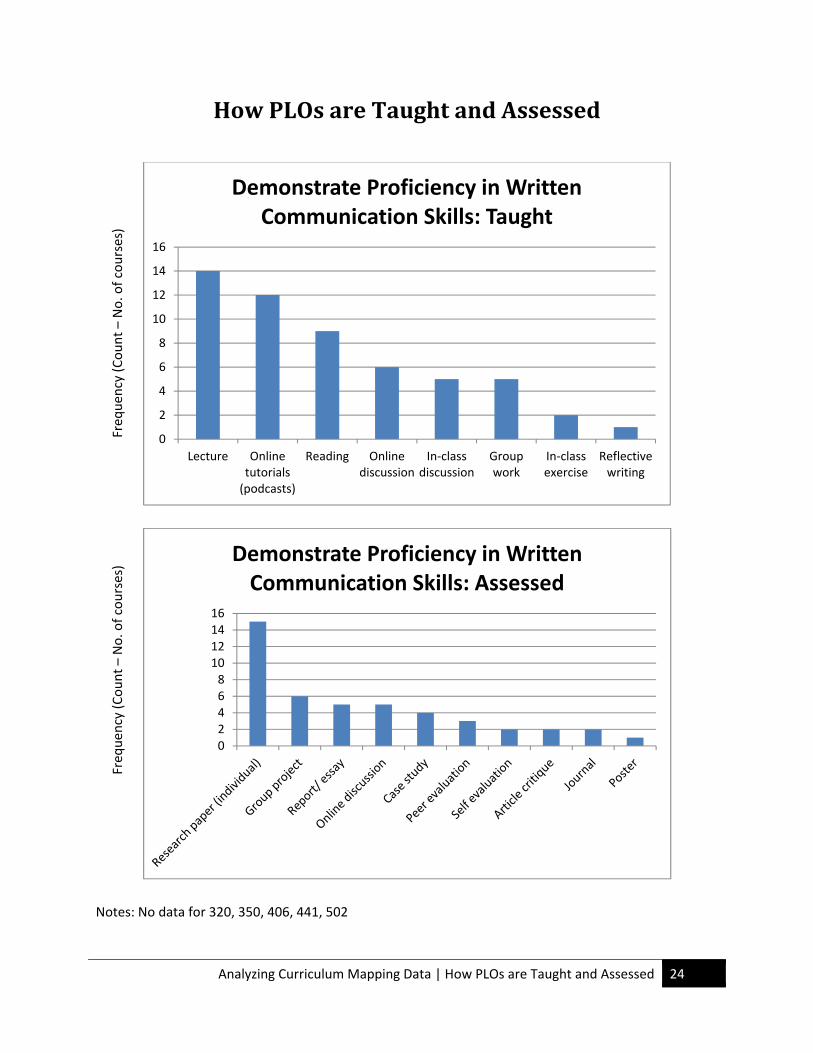
Notes: No data for 320, 350, 406, 441, 502
0
2
4
6
8
10
12
14
16
Lecture Online tutorials (podcasts)
Reading Online discussion
In‐class discussion
Group work
In‐class exercise
Reflective writing
Demonstrate Proficiency in Written Communication Skills: Taught
02468
10121416
Demonstrate Proficiency in Written Communication Skills: Assessed
Freq
uency (Count – No. of courses)
Freq
uency (Count – No. of courses)
Analyzing Curriculum Mapping Data | How PLOs are Taught and Assessed 25
These bar charts show how one of the PLOs (By the end of the program, students will be expected to
demonstrate proficiency in written communication) is being taught and assessed in the program.
Different methods of teaching and assessing written communication are listed across the bottom. The
bars indicate the frequency, or number of courses that include the method.
Consider creating charts such as these for PLOs in which you want to delve a bit deeper. In this fictitious
example, a group was wondering about how written communication was being taught and assessed
across the program because they identified writing as an area of challenge for students.
Discussion questions:
1. Where are the strengths in how written communication is being taught and assessed in the
program?
2. What opportunities do you see to enhance student success regarding demonstrating proficiency
in written communication?
3. How might you approach a discussion with instructors on the topic of how written
communication is taught and assessed in the program?
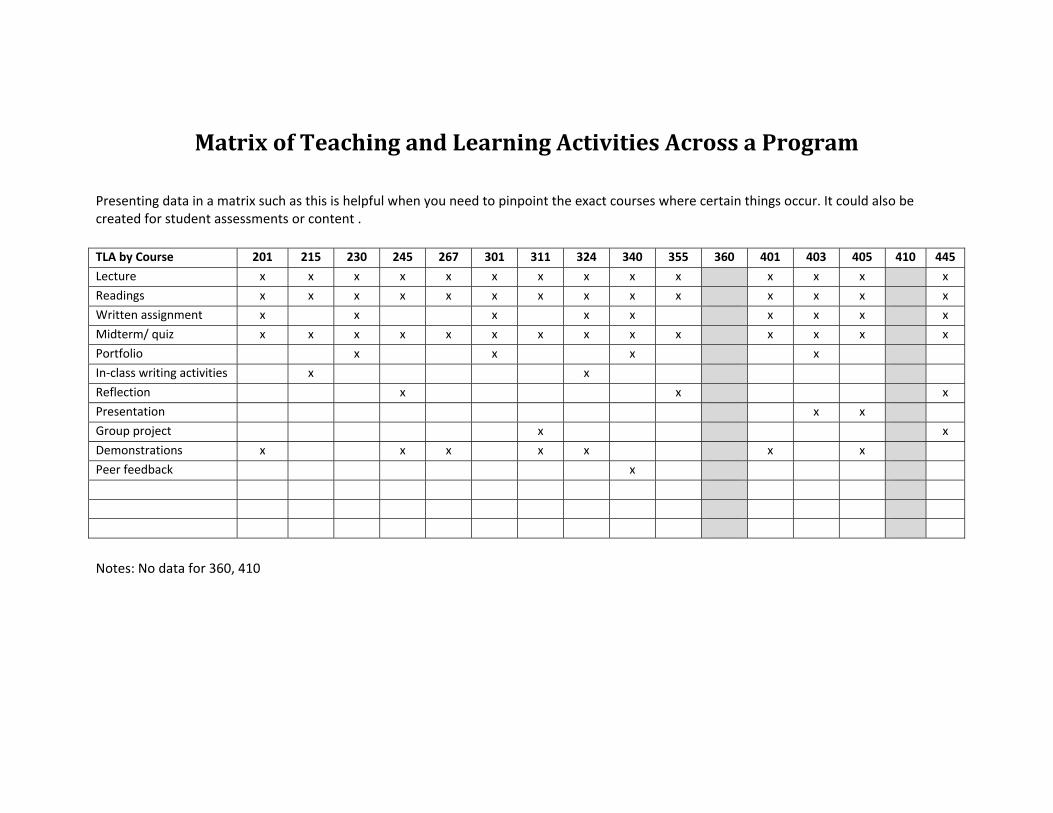
MatrixofTeachingandLearningActivitiesAcrossaProgram Presenting data in a matrix such as this is helpful when you need to pinpoint the exact courses where certain things occur. It could also be created for student assessments or content .
TLA by Course 201 215 230 245 267 301 311 324 340 355 360 401 403 405 410 445
Lecture x x x x x x x x x x x x x x
Readings x x x x x x x x x x x x x x
Written assignment x x x x x x x x x
Midterm/ quiz x x x x x x x x x x x x x x
Portfolio x x x x
In‐class writing activities x x
Reflection x x x
Presentation x x
Group project x x
Demonstrations x x x x x x x
Peer feedback x
Notes: No data for 360, 410
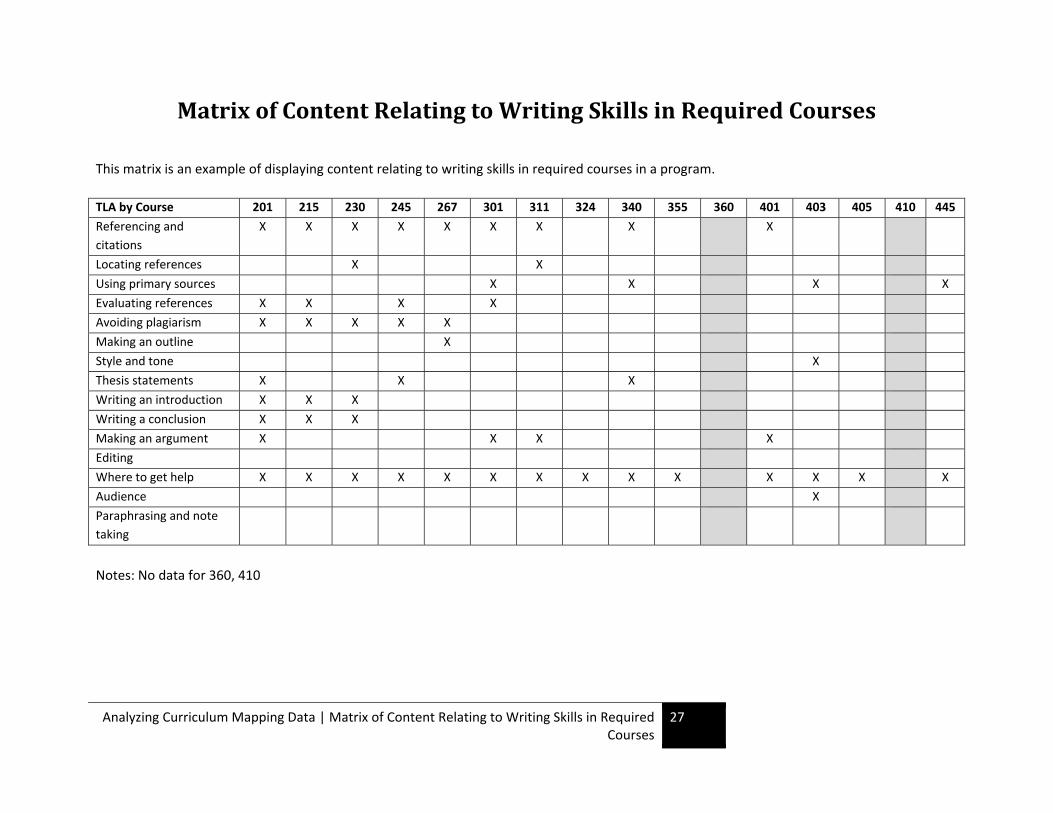
Analyzing Curriculum Mapping Data | Matrix of Content Relating to Writing Skills in Required Courses
27
MatrixofContentRelatingtoWritingSkillsinRequiredCourses This matrix is an example of displaying content relating to writing skills in required courses in a program.
TLA by Course 201 215 230 245 267 301 311 324 340 355 360 401 403 405 410 445
Referencing and
citations
X X X X X X X X X
Locating references X X
Using primary sources X X X X
Evaluating references X X X X
Avoiding plagiarism X X X X X
Making an outline X
Style and tone X
Thesis statements X X X
Writing an introduction X X X
Writing a conclusion X X X
Making an argument X X X X
Editing
Where to get help X X X X X X X X X X X X X X
Audience X
Paraphrasing and note
taking
Notes: No data for 360, 410
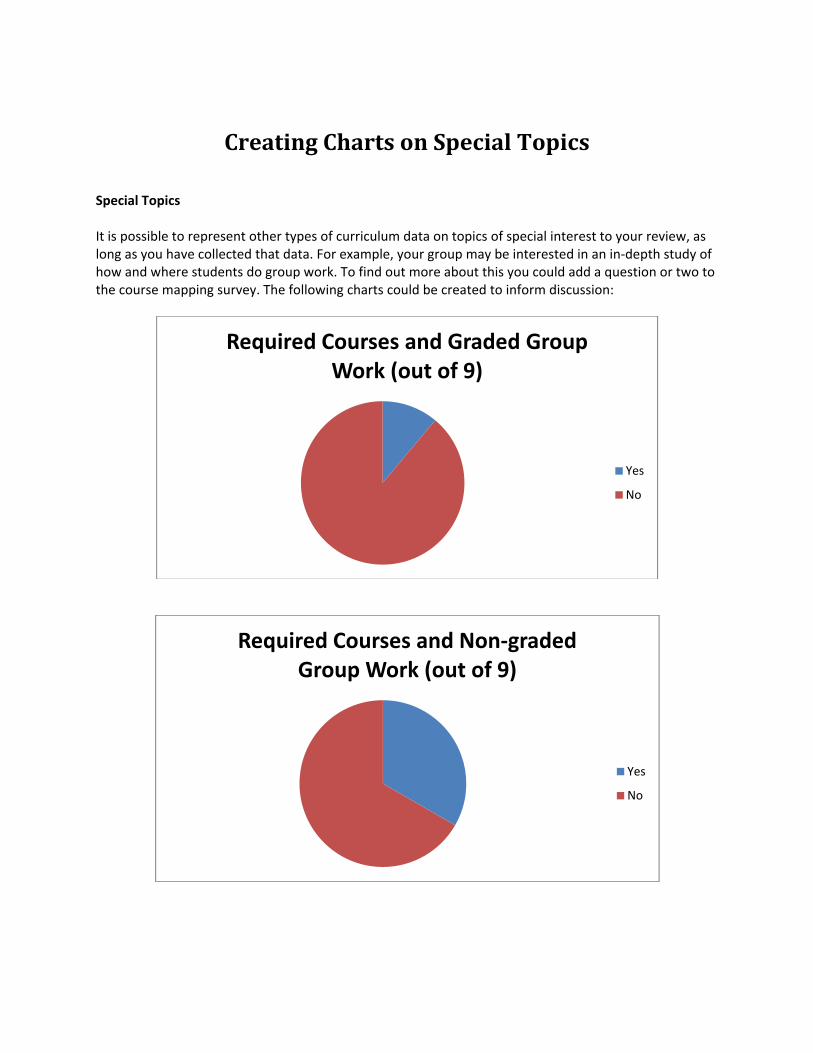
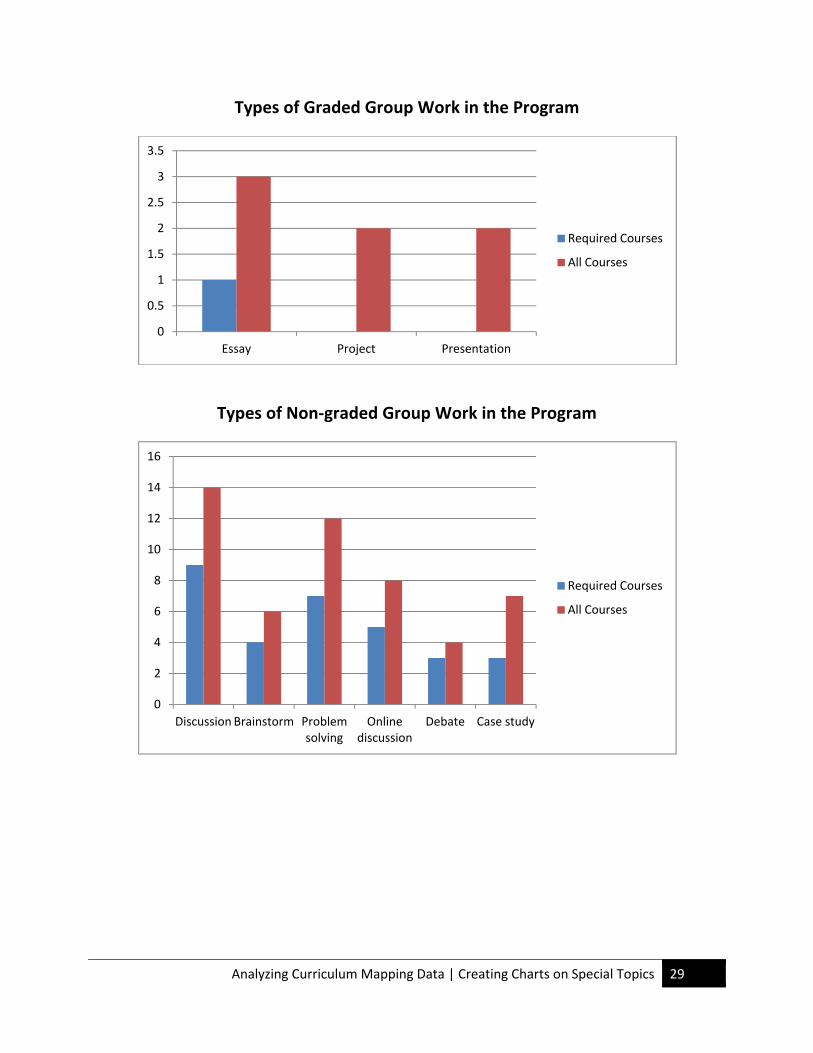
CreatingChartsonSpecialTopics Special Topics It is possible to represent other types of curriculum data on topics of special interest to your review, as long as you have collected that data. For example, your group may be interested in an in‐depth study of how and where students do group work. To find out more about this you could add a question or two to the course mapping survey. The following charts could be created to inform discussion:
Required Courses and Graded Group Work (out of 9)
Yes
No
Required Courses and Non‐graded Group Work (out of 9)
Yes
No
Analyzing Curriculum Mapping Data | Creating Charts on Special Topics 29
Types of Graded Group Work in the Program
Types of Non‐graded Group Work in the Program
0
0.5
1
1.5
2
2.5
3
3.5
Essay Project Presentation
Required Courses
All Courses
0
2
4
6
8
10
12
14
16
Discussion Brainstorm Problem solving
Online discussion
Debate Case study
Required Courses
All Courses
Analyzing Curriculum Mapping Data | Planning Chart 30
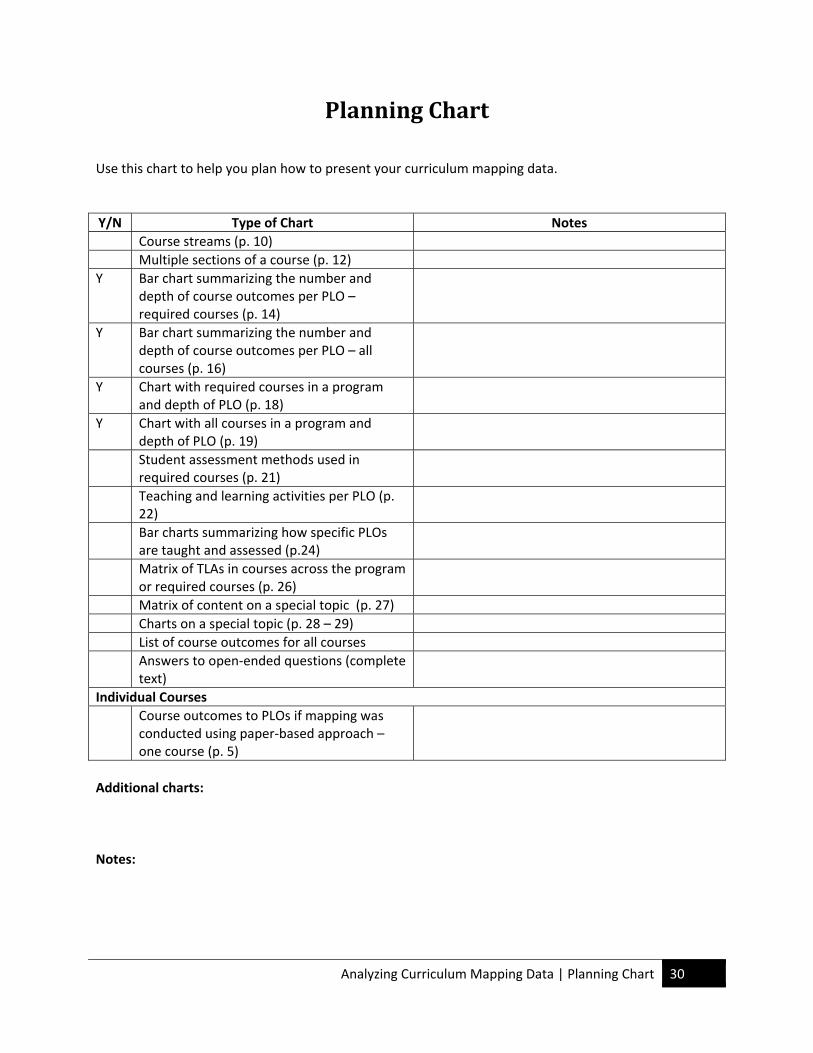
PlanningChart Use this chart to help you plan how to present your curriculum mapping data.
Y/N Type of Chart Notes
Course streams (p. 10)
Multiple sections of a course (p. 12)
Y Bar chart summarizing the number and depth of course outcomes per PLO – required courses (p. 14)
Y Bar chart summarizing the number and depth of course outcomes per PLO – all courses (p. 16)
Y Chart with required courses in a program and depth of PLO (p. 18)
Y Chart with all courses in a program and depth of PLO (p. 19)
Student assessment methods used in required courses (p. 21)
Teaching and learning activities per PLO (p. 22)
Bar charts summarizing how specific PLOs are taught and assessed (p.24)
Matrix of TLAs in courses across the program or required courses (p. 26)
Matrix of content on a special topic (p. 27)
Charts on a special topic (p. 28 – 29)
List of course outcomes for all courses
Answers to open‐ended questions (complete text)
Individual Courses
Course outcomes to PLOs if mapping was conducted using paper‐based approach – one course (p. 5)
Additional charts: Notes:
Analyzing Curriculum Mapping Data | Analyzing Curriculum Maps at the Program Level 31
AnalyzingCurriculumMapsattheProgramLevel
QuestionsforCollaborativeDiscussionandEngagement (Adapted from Banta and Blaich, 2011, p. 23) The following questions can be used to guide discussions related to data gathered through curriculum mapping processes. Questions will be adapted based on each specific project. General
What general trends do you see in the data?
What data presented most surprised you? Why?
Where are our strengths? What are we doing well?
Where are some areas for improvement?
How do these results align or conflict with other curriculum assessment results (eg. student/ faculty/ employee feedback) or past program reviews? Where are areas of congruency and divergence?
What next steps might be taken to improve and align our curriculum? Instructional and Assessment Methods
What instructional/ assessment strategies are we most/ least using?
How are the instructional and assessment methods used in the courses congruent with the discipline?
How are the instructional and assessment methods used in the courses congruent with our program’s/faculty’s/institution’s mission and vision?
How are high impact educational practices embedded throughout the curriculum?
In terms of supporting student learning, how well are the instructional and assessment methods that we use working?
Learning Outcomes
What learning outcomes are we most/ least emphasizing?
Where are the strengths and gaps in the teaching and assessment of these learning outcomes?
How do our instructional and assessment strategies align with the intended learning outcomes?
Which learning outcomes resonated (i.e. were clearly stated, and easily interpreted)? Which ones were confusing? How could the learning outcomes be further clarified?

Analyzing Curriculum Mapping Data | Analyzing Curriculum Maps at the Program Level 32
Workload and Progression
How does student learning progress across the program for each of the learning outcomes? How could student achievement of the learning outcomes be better supported through this progression?
How is student workload distributed across the semester?
When have students and instructors expressed concern over workload during the semester? How could workload be more evenly distributed?
Analyzing Curriculum Mapping Data | Questions for Review Leads 33
QuestionsforReviewLeads
How will you encourage instructors to take a thoughtful, reflective approach to mapping their courses?
What types of aggregate charts will best inform your guiding questions?
What strategies might you use to engage instructors in the process of analyzing the data? How might you help them make sense of the data? How might you guide them through a process of analyzing data (including other sources) and making recommendations based on the evidence?
How might you approach a discussion with instructors on curriculum topics? What strategies do you have to keep the discussion productive, focused and positive?

Analyzing Curriculum Mapping Data | Ways to Involve All Faculty in Data Analysis 34
WaystoInvolveAllFacultyinDataAnalysis
This section includes some strategies to involve all faculty in the process of analyzing different data
sources. Again, these suggestions are just a starting point and not an exhaustive list:
All‐faculty retreat (and provide food)
Discussion at a department meeting
Add data to a Desire2Learn discussion board, allowing all to access the data and comment when it fits into their schedule
Ask for volunteers to form a working group to take on the work of data analysis
Invite sessional instructors in on the conversation (a great professional development opportunity for them)
Prepare an initial analysis and send it to all faculty for feedback and recommendations
Involve your Undergraduate Curriculum Committee in the analysis and report writing
Analyzing Curriculum Mapping Data | References 35
References
Banta, T. W., & Blaich, C. (2011). Closing the assessment loop. Change: The Magazine of Higher Learning,
43(1), 22‐27.
California State University, Long Beach. (n.d.). Creating a curriculum map. Retrieved from
http://www.ced.csulb.edu/offices/assessment‐office/creating‐curriculum‐map
Council of Ministers of Education. (2007). Ministerial statement on quality assurance of degree
education in Canada. Retrieved from
http://www.cmec.ca/Publications/Lists/Publications/Attachments/95/QA‐Statement‐
2007.en.pdf
Oliver, S. (n.d.). Interdisciplinary studies 1021E. Huron University College. Retrieved from
http://www.huronuc.on.ca/Assets/website/Document/FASS/Non%20Dept/2014‐
2015/IDS1021E2014.pdf
Veltri, N. F., Webb, H. W., Matveev, A. G., & Zapatero, E. G. (2011). Curriculum mapping as a tool for
continuous improvement of IS curriculum. Journal of Information Systems Education, 22(1), 31‐
42.