Economic Update - DoubleLine · 2017-10-25 · The fourth quarter of 2016 was defined by the U.S....
333 S. Grand Ave., 18th Floor || Los Angeles, CA 90071 || (213) 633-8200 Economic Update Fourth Quarter 2016 DoubleLine Macro-Asset Allocaon Team Sam Garza, Porolio Manager Fei He, Quantave Analyst Ryan Kimmel, Analyst
Transcript of Economic Update - DoubleLine · 2017-10-25 · The fourth quarter of 2016 was defined by the U.S....
333 S. Grand Ave., 18th Floor || Los Angeles, CA 90071 || (213) 633-8200
Economic Update
Fourth Quarter 2016
DoubleLine Macro-Asset Allocation Team
Sam Garza, Portfolio Manager
Fei He, Quantitative Analyst
Ryan Kimmel, Analyst

2
Economic Update
Economic Update 12/31/16
The fourth quarter of 2016 was
defined by the U.S. presidential
election, paving Donald Trump’s
ascendency to the White House.
While the anti-establishment
candidate’s victory was a surprise to
many investors, we at DoubleLine
believed Mr. Trump’s likelihood of
being elected was much higher than
was represented in the polls and
prediction markets. In the final hours
of the presidential race, it became
clear that a large cohort of the voter
base was underrepresented in the
polls.
The overnight shift (literally) in market
sentiment towards a Trump
presidency shows how fast financial
markets can augment perspectives.
After being limit down overnight, U.S.
equities staged an impressive rally the
day after the election. The market
found comfort in Trump’s prospective
pro-growth policies and ambition to
deregulate. The Republican sweep of
the House and Senate decreased the
probability of political gridlock in
Washington, supporting risk assets
further.
Trump’s victory underscored a change
that was already underway since the
third quarter of 2016, a shift from a
deflationary to reflationary
environment. As we noted in the third
quarter, inflation expectations were
likely to increase as the negative
effects from oil prices rolled off and
eventually would become positive
contributors to headline inflation.
Trump’s plan to bring manufacturing
back to the U.S. by increasing the
costs of imports along with tax reform
and infrastructure spending should
increase the price of goods
domestically. Over the course of the
second half of 2016 breakeven
inflation rates increased sharply. See
Figure 1. The increase in inflation
Global Markets Review
Figure 1: U.S. Breakeven Inflation Rates As of December 31, 2016
0.5
0.7
0.9
1.1
1.3
1.5
1.7
1.9
2.1
2.3
2.5
10-year Breakeven
5-year Breakeven
Source: Bloomberg, DoubleLine
Source: Bloomberg, DoubleLine
Figure 2: ISM Manufacturing & Services Purchasing Managers’ Indices (PMI) As of December 31, 2016
30
35
40
45
50
55
60
65 ISM Manufacturing Index
ISM Services Index

3
Economic Update
Economic Update 12/31/16
expectations and stronger growth
elevated nominal bond yields with 10-
year yields rising more than 100 basis
points (bps) from the lows reached in
July. The U.S. Dollar (USD) rallied on
the Trump victory from a combination
of potential value-add tax adjustment
and supportive yield differentials,
particularly versus the Japanese Yen
and the Euro. The USD was also
supported by the Federal Reserve
(“Fed”) shifting to a more hawkish
tone at the December Federal Open
Market Committee meeting. The Fed
raised the Federal Funds Rate by 25
bps, which was expected by the
market, and hinted it may raise the
rate three times instead of twice in
2017.
Economic growth measures
continued to improve in the fourth
quarter with Institute of Supply
Management’s (ISM) Manufacturing
and Services Indices accelerating into
expansion territory. See Figure 2 on
the previous page. Small business
optimism, as measured by the
National Federation of Independent
Business (NFIB), also improved to the
highest level in over a decade. CEO
and U.S. consumer confidence
exuded the same level of confidence.
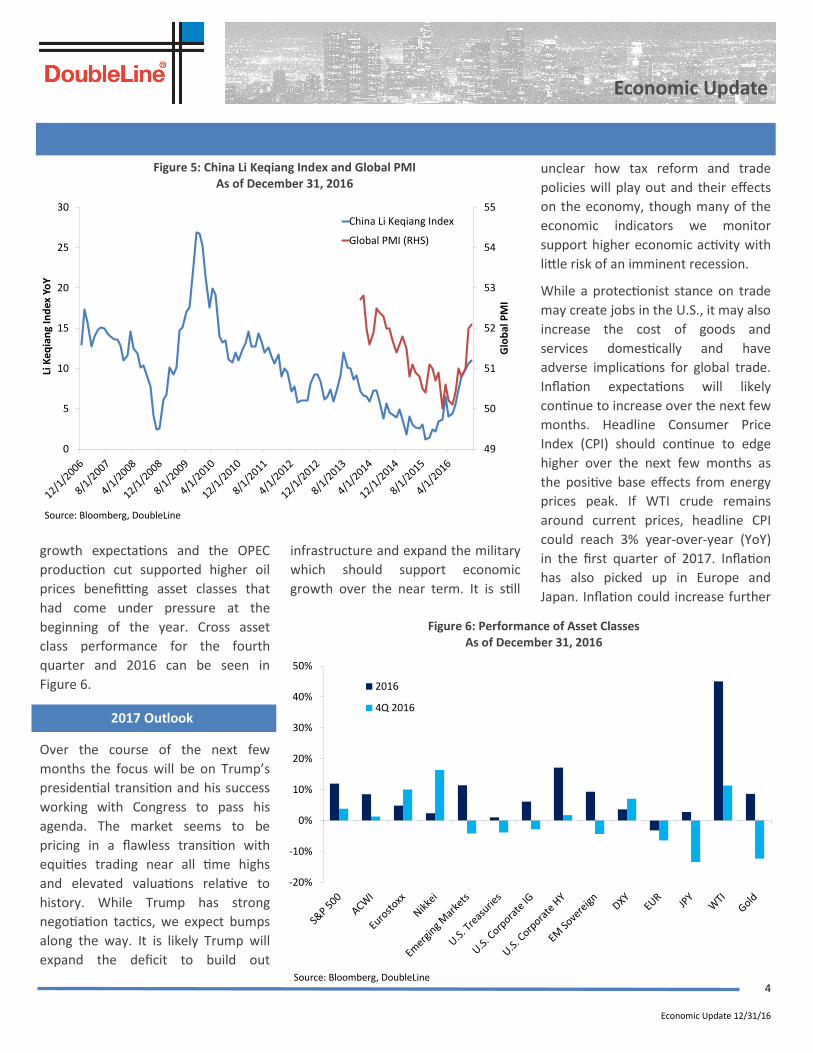
See Figures 3 and 4. The U.S. was not
the only country to see an uptick in
economic growth indicators: the
global Purchasing Managers’ Index
edged higher in the fourth quarter,
and China’s growth indicators picked
up with the China Li Keqiang Index at
highest level since third quarter 2013.
See Figure 5 on the following page.
As global economic growth improved,
commodities followed. Crude, as
measured by West Texas
Intermediate (WTI), rallied 11%
during the fourth quarter to market a
45% increase in 2016. The
combination of increased global
Figure 3: NFIB Small Business Optimism Index As of December 31, 2016
Figure 4: CEO and Consumer Confidence As of December 31, 2016
Source: Bloomberg, DoubleLine *RHS = Right hand side
-8
-6
-4
-2
0
2
4
6
8
10
80
85
90
95
100
105
110
Mo
M C
han
ge
Ind
ex L
eve
l
MoM Change (RHS)
NFIB Small Business Optimism
Source: Bloomberg, DoubleLine *RHS = Right hand side, MoM = month-over-month
1
2
3
4
5
6
7
8
9
20
30
40
50
60
70
80
90
100
110
120
CEO
Co
nfi
de
nce
Co
nsu
me
r C
on
fid
en
ce
Consumer Confidence
CEO Confidence (RHS)*
4
Economic Update
Economic Update 12/31/16
growth expectations and the OPEC
production cut supported higher oil
prices benefitting asset classes that
had come under pressure at the
beginning of the year. Cross asset
class performance for the fourth
quarter and 2016 can be seen in
Figure 6.
Over the course of the next few
months the focus will be on Trump’s
presidential transition and his success
working with Congress to pass his
agenda. The market seems to be
pricing in a flawless transition with
equities trading near all time highs
and elevated valuations relative to
history. While Trump has strong
negotiation tactics, we expect bumps
along the way. It is likely Trump will
expand the deficit to build out
infrastructure and expand the military
which should support economic
growth over the near term. It is still
unclear how tax reform and trade
policies will play out and their effects
on the economy, though many of the
economic indicators we monitor
support higher economic activity with
little risk of an imminent recession.
While a protectionist stance on trade
may create jobs in the U.S., it may also
increase the cost of goods and
services domestically and have
adverse implications for global trade.
Inflation expectations will likely
continue to increase over the next few
months. Headline Consumer Price
Index (CPI) should continue to edge
higher over the next few months as
the positive base effects from energy
prices peak. If WTI crude remains
around current prices, headline CPI
could reach 3% year-over-year (YoY)
in the first quarter of 2017. Inflation
has also picked up in Europe and
Japan. Inflation could increase further
2017 Outlook
Source: Bloomberg, DoubleLine
Figure 5: China Li Keqiang Index and Global PMI As of December 31, 2016
Figure 6: Performance of Asset Classes As of December 31, 2016
Source: Bloomberg, DoubleLine
-20%
-10%
0%
10%
20%
30%
40%
50%
2016
4Q 2016
49
50
51
52
53
54
55
0
5
10
15
20
25
30
Glo
bal
PM
I
Li K
eq
ian
g In
dex
Yo
Y
China Li Keqiang Index
Global PMI (RHS)

5
Economic Update
Economic Update 12/31/16
in these regions, particularly Germany,
as base effects become positive. With
yields still very low in these regions,
yields could edge higher as well. See
Figure 7.
Given the expected uptick in growth
and inflation expectations, the Fed is
likely to hike between two to three
times in 2017. It is still unclear
whether the Fed will hike in March,
but it is more likely that the Fed will
make their moves in June and the
second half of the year as Trump’s pro
-growth policies come to fruition.
Higher wage inflation may prompt
more aggressive Fed action. See
Figure 8. Wage inflation should be
monitored closely in 2017.
While the European Central Bank
(ECB) and Bank of Japan (BoJ) were
relatively quiet in the fourth quarter,
it will be interesting to see if these
central banks continue with asset
purchases in the face of rising growth
expectations and higher inflation. If
the ECB and BoJ signal a tapering of
asset purchases, then European and
Japanese bond yields will have to
reprice higher and the euro and
Japanese Yen could appreciate vs.
USD.
Given the dramatic move in U.S.
government bonds in the fourth
quarter, we believe Treasuries could
stage a countertrend rally as growth
expectations are reigned in and short
positions get squeezed. According to
the U.S. Commodity Futures Trading
Commission (CFTC) data, net short
positions in Treasury futures are at all-
time highs. Ten-year Treasury yields
are likely to drop to around 2.25% in
the first quarter. However, as Trump’s
policies become reality and deficit
spending increases, yields should
move higher toward 3% in the second
half of the year. With inflation Source: Bloomberg, DoubleLine *BLS = Bureau of Labor Statistics
Figure 7: German 10-Year Yield & German CPI YoY As of December 31, 2016
Source: Bloomberg, DoubleLine
Figure 8: U.S. Wage Growth YoY As of December 31, 2016
Views on Assets
-1
0
1
2
3
4
5
6German 10-Year Yield
German CPI YoY
1
1.5
2
2.5
3
3.5
4
4.5
5
5.5BLS Average Hourly Earnings YoY
Atlanta Fed Wage Growth Tracker
6
Economic Update
Economic Update 12/31/16
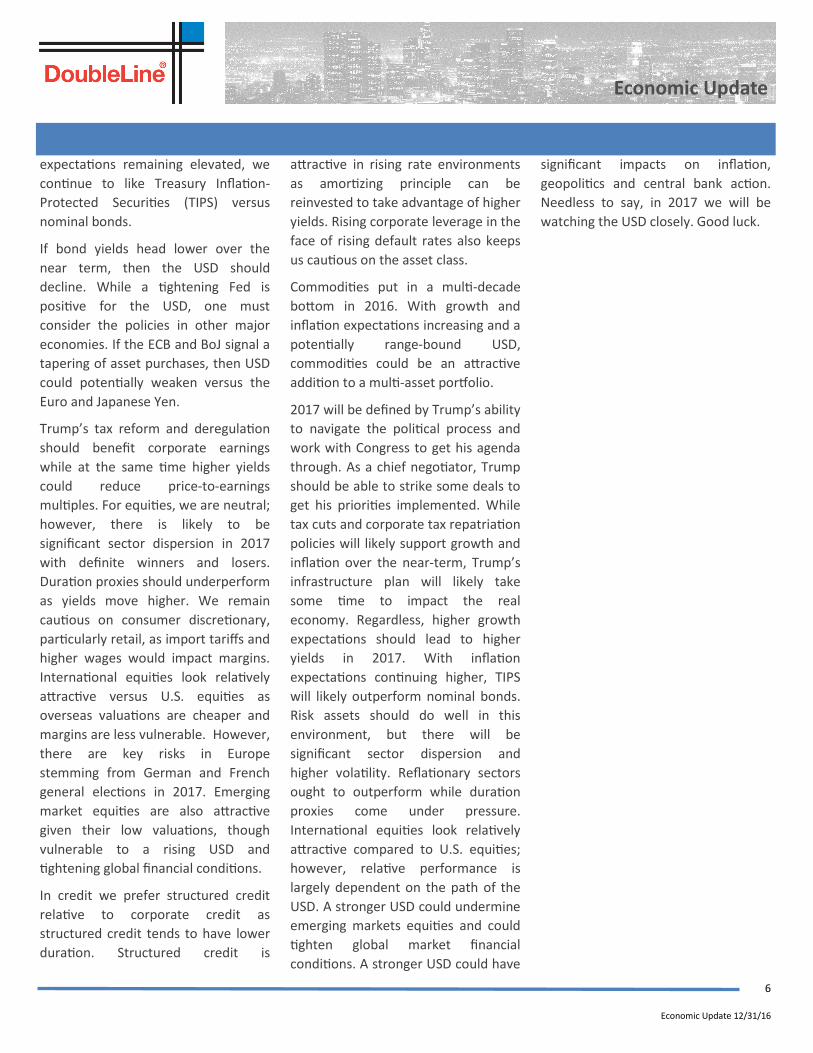
expectations remaining elevated, we
continue to like Treasury Inflation-
Protected Securities (TIPS) versus
nominal bonds.
If bond yields head lower over the
near term, then the USD should
decline. While a tightening Fed is
positive for the USD, one must
consider the policies in other major
economies. If the ECB and BoJ signal a
tapering of asset purchases, then USD
could potentially weaken versus the
Euro and Japanese Yen.
Trump’s tax reform and deregulation
should benefit corporate earnings
while at the same time higher yields
could reduce price-to-earnings
multiples. For equities, we are neutral;
however, there is likely to be
significant sector dispersion in 2017
with definite winners and losers.
Duration proxies should underperform
as yields move higher. We remain
cautious on consumer discretionary,
particularly retail, as import tariffs and
higher wages would impact margins.
International equities look relatively
attractive versus U.S. equities as
overseas valuations are cheaper and
margins are less vulnerable. However,
there are key risks in Europe
stemming from German and French
general elections in 2017. Emerging
market equities are also attractive
given their low valuations, though
vulnerable to a rising USD and
tightening global financial conditions.
In credit we prefer structured credit
relative to corporate credit as
structured credit tends to have lower
duration. Structured credit is
attractive in rising rate environments
as amortizing principle can be
reinvested to take advantage of higher
yields. Rising corporate leverage in the
face of rising default rates also keeps
us cautious on the asset class.
Commodities put in a multi-decade
bottom in 2016. With growth and
inflation expectations increasing and a
potentially range-bound USD,
commodities could be an attractive
addition to a multi-asset portfolio.
2017 will be defined by Trump’s ability
to navigate the political process and
work with Congress to get his agenda
through. As a chief negotiator, Trump
should be able to strike some deals to
get his priorities implemented. While
tax cuts and corporate tax repatriation
policies will likely support growth and
inflation over the near-term, Trump’s
infrastructure plan will likely take
some time to impact the real
economy. Regardless, higher growth
expectations should lead to higher
yields in 2017. With inflation
expectations continuing higher, TIPS
will likely outperform nominal bonds.
Risk assets should do well in this
environment, but there will be
significant sector dispersion and
higher volatility. Reflationary sectors
ought to outperform while duration
proxies come under pressure.
International equities look relatively
attractive compared to U.S. equities;
however, relative performance is
largely dependent on the path of the
USD. A stronger USD could undermine
emerging markets equities and could
tighten global market financial
conditions. A stronger USD could have
significant impacts on inflation,
geopolitics and central bank action.
Needless to say, in 2017 we will be
watching the USD closely. Good luck.

7
Author Biographies
Economic Update 12/31/16
Ryan Kimmel
Analyst, Macro-Asset Allocation
Ryan Kimmel is an Analyst for DoubleLine Capital’s Multi-Asset Growth Strategy. Mr. Kimmel joined Dou-
bleLine in 2012. Prior to DoubleLine, Mr. Kimmel was a Proprietary Trader at The Gelber Group, trading
currencies for the Foreign Currency Group. Before Gelber, Mr. Kimmel was an Investment Banking An-
alyst in Morgan Stanley’s Mergers and Acquisitions Group. Mr. Kimmel holds a BA in Business Economics
from the University of California, Los Angeles and holds an MBA from the Anderson School of Manage-
ment at the University of California, Los Angeles.
Samuel M. Garza
Portfolio Manager, Macro-Asset Allocation
Mr. Garza joined DoubleLine in 2009. Prior to DoubleLine, Mr. Garza was a Senior Vice President at TCW
since 2000 where he held several positions over the years ending with his last promotion to Senior Vice
President in 2005. Prior to TCW, Mr. Garza worked at Union Bank of California in the Commercial Bank-
ing Group where he was involved with corporate loan underwriting. Mr. Garza holds a BA in Business
Economics from the University of California, Santa Barbara and an MBA from the Anderson School of
Management at the University of California, Los Angeles.
Fei He, CFA
Quantitative Analyst, Macro-Asset Allocation
Mr. He joined DoubleLine’s Macro-Asset Allocation team in 2014 as a quantitative analyst. Prior to join-
ing the firm, he worked at PIMCO for three and half years as a quantitative research analyst where he
began in client analytics, advising clients on strategic asset allocation and later moved to emerging mar-
kets and commodities. Mr. He began his career at Absolute Return Capital Advisors as a portfolio/
research associate. He has published papers, including the Financial Analysts Journal. Mr. He holds an
MS in Financial Engineering from UCLA Anderson School of Management and a PhD in Molecular &
Medical Pharmacology from UCLA David Geffen School of Medicine. He graduated from Tsinghua Uni-
versity in Beijing with a BS in Biological Sciences & Biotechnology and is a CFA charterholder.

8
Definitions
Economic Update 12/31/16
BofA/Merrill Lynch U.S. Cash Pay High Yield Index - An index that tracks the performance of below investment grade corporate debt currently in a coupon paying
period. Eurobonds and debt issuer from countries designated as emerging markets (e.g. Argentina, Brazil, Venezuela, etc.) are excluded, but Canadian and global bonds
(SEC registered) of issuers in non-EMG countries are included. Original issue zeroes, step-up coupon structures, 144-As and pay-in-kind (PIK, as of October 1, 2009) are
also included.
Bollinger Bands - A technical indicator of volatility using bands that are plotted two standard deviations away from a moving average to find a n upper and lower
bound.
Capital Expenditure (CapEx) - Payments made in cash or cash equivalents during a particular period to acquire or improve a company's physical or fixed assets.
China Li Keqiang Index - An index that utilizes three indicators (rail cargo volume, bank lending & electricity consumption) to measure China’s economy.
Consumer Price Index (CPI) - A measure that examines the weighted average of prices of a basket of consumer goods and services, such as transportation, fo od and
medical care. The CPI is calculated by taking price changes for each item in the predetermined basket of goods and averaging them; the goods are weighted according to
their importance. Changes in CPI are used to assess price changes associated with the cost of living.
Eurostoxx Index - A stock index of Eurozone stocks designed by STOXX, an index provider owned by Deutsche Borse Group and SIX group, with the g oal of providing a
blue-chip representation of Supersector leaders in the Eurozone.
Institute for Supply Management (ISM) Global Purchasing Managers Index- A composite index based on five of the individual indexes with the following weights: New
Orders - 0.3, Output - 0.25, Employment - 0.2, Suppliers' Delivery Times - 0.15 and Stock of Items Purchased - 0.1. Purchasing Managers' Index surveys are available for 32
countries and also for key regions including the Eurozone.
Institute for Supply Management (ISM) Manufacturing Purchasing Managers Index - An index made up of data from 300 manufacturing firms collected by the Insti-
tute of Supply Management (ISM). It indicates the economic health of the manufacturing sector.
Institute for Supply Management (ISM) Services Purchasing Managers Index - An index made up of data from 400 non-manufacturing firms collected by the Institute of
Supply Management (ISM).
Morgan Stanley Capital International All Country World Index (MSCI ACWI) - A market-capitalization-weighted index designed to provide a broad measure of stock
performance throughout the world, including both developed and emerging markets.
“Emerging Markets” - Morgan Stanley Capital International Emerging Markets Index (MXEF) - A float-adjusted market capitalization index designed to measure equity
market performance in global emerging markets. The index consists of 26 emerging economies, including but not limited to, Argentina, Brazil, China, India, Poland, Thai-
land, Turkey, and Venezuela.
Nikkei 225 Index - A price-weighted index comprised of Japan's top 225 blue-chip companies on the Tokyo Stock Exchange. The Nikkei is equivalent to the Dow Jones
Industrial Average Index in the U.S.
Shiller CAPE® Ratio - CAPE® stands for Cyclically Adjusted Price-Earnings. The CAPE® Ratio is a valuation metric that takes the current price of an equity or index divided
by its inflation adjusted average of ten years of earnings.
Standard & Poor’s U.S. 500 Index (S&P 500) - A capitalized-weighted index of 500 stocks chosen for market size, liquidity an dindustry grouping, among other factors.
This index is designed to be a leading indicator of U.S. equities and is meant to reflect the risk/return characteristics of the large cap universe.
Tokyo Price Index (TOPIX) - An index that measures the performance of 150 highly liquid securities selected from each major sector of the Tokyo market.
“U.S. Treasuries” - Barclays U.S. Treasury Index - An index that measures U.S. dollar-denominated, fixed-rate, nominal debt issued by the U.S. Treasury
“U.S. Corporate IG” - Barclays U.S. Aggregate Corporate Index - An index that measures the investment grade, U.S. dollar-denominated, fixed-rate taxable bond market,
including Treasuries, government-related and corporate securities.
“U.S. Corporate HY” - Barclays U.S. Corporate High Yield Index - An index that measures the U.S. dollar-denominated, high yield, fixed-rate corporate bond market.
“EM Sovereign” - Barclays Emerging Markets Sovereign Index - A hard currency EM index that includes fixed and floating-rate U.S. dollar-denominated debt issued by
sovereign EM issuers.
U.S. Dollar Spot Index (DXY) - DXY is the US Dollar Index (USDX) indicates the general value of the US dollar. Average exchange rates between the US dollar and six major
world currencies.
An investment cannot be made in an index.
9
Disclaimers
Economic Update 12/31/16
Important Information Regarding This Report
Issue selection processes and tools illustrated throughout this presentation are samples and may be modified periodically. Such charts are not the only tools used by the
investment teams, are extremely sophisticated, may not always produce the intended results and are not intended for use by non-professionals.
DoubleLine has no obligation to provide revised assessments in the event of changed circumstances. While we have gathered this information from sources believed to
be reliable, DoubleLine cannot guarantee the accuracy of the information provided. Securities discussed are not recommendations and are presented as examples of
issue selection or portfolio management processes. They have been picked for comparison or illustration purposes only. No security presented within is either offered for
sale or purchase. DoubleLine reserves the right to change its investment perspective and outlook, as well as portfolio construction, without notice as market conditions
dictate or as additional information becomes available. This material may include statements that constitute “forward-looking statements” under the U.S. securities laws.
Forward-looking statements include, among other things, projections, estimates, and information about possible or future results related to a client’s account, or market
or regulatory developments.
Ratings shown for various indices reflect the average for the indices. Such ratings and indices are created independently of DoubleLine and are subject to change without
notice.
Important Information Regarding Risk Factors
Investment strategies may not achieve the desired results due to implementation lag, other timing factors, portfolio management decision-making, economic or market
conditions or other unanticipated factors. The views and forecasts expressed in this material are as of the date indicated, are subject to change without notice, may not
come to pass and do not represent a recommendation or offer of any particular security, strategy, or investment. Past performance (whether of DoubleLine or any index
illustrated in this presentation) is no guarantee of future results. You cannot invest in an index.
Important Information Regarding DoubleLine
In preparing the client reports (and in managing the portfolios), DoubleLine and its vendors price separate account portfolio securities using various sources, including
independent pricing services and fair value processes such as benchmarking.
To receive a complimentary copy of DoubleLine’s current Form ADV (which contains important additional disclosure information), a copy of the DoubleLine’s proxy voting
policies and procedures, or to obtain additional information on DoubleLine’s proxy voting decisions, please contact DoubleLine’s Client Services.
Important Information Regarding DoubleLine’s Investment Style
DoubleLine seeks to maximize investment results consistent with our interpretation of client guidelines and investment mandate. While DoubleLine seeks to maximize
returns for our clients consistent with guidelines, DoubleLine cannot guarantee that DoubleLine will outperform a client's specified benchmark. Additionally, the nature
of portfolio diversification implies that certain holdings and sectors in a client's portfolio may be rising in price while others are falling; or, that some issues and sectors
are outperforming while others are underperforming. Such out or underperformance can be the result of many factors, such as but not limited to duration/interest rate
exposure, yield curve exposure, bond sector exposure, or news or rumors specific to a single name.
DoubleLine is an active manager and will adjust the composition of client’s portfolios consistent with our investment team’s judgment concerning market conditions and
any particular security. The construction of DoubleLine portfolios may differ substantially from the construction of any of a variety of bond market indices. As such, a
DoubleLine portfolio has the potential to underperform or outperform a bond market index. Since markets can remain inefficiently priced for long periods, DoubleLine’s
performance is properly assessed over a full multi-year market cycle.
Important Information Regarding Client Responsibilities
Clients are requested to carefully review all portfolio holdings and strategies, including by comparing the custodial statement to any statements received from
DoubleLine. Clients should promptly inform DoubleLine of any potential or perceived policy or guideline inconsistencies. In particular, DoubleLine understands that
guideline enabling language is subject to interpretation and DoubleLine strongly encourages clients to express any contrasting interpretation as soon as practical. Clients
are also requested to notify DoubleLine of any updates to Client’s organization, such as (but not limited to) adding affiliates (including broker dealer affiliates), issuing
additional securities, name changes, mergers or other alterations to Client’s legal structure.
DoubleLine® is a registered trademark of DoubleLine Capital LP.
© 2017 DoubleLine Capital LP