Economic Survey 2016 - tralac · mainly attributed to high earnings from titanium minerals of...
20
Economic Survey 2016 Popular Version
Transcript of Economic Survey 2016 - tralac · mainly attributed to high earnings from titanium minerals of...

Economic Survey 2016
Popular Version

Foreward The Popular Version is based on a master set of data on the 2016 Economic Survey publication report that has been compiled by the Kenya National Bureau of Statistics (KNBS). The popular version is an easy to read publication with highlights on economic performance and indicators in 2015. The Economic Survey is an annual publication of the Kenya National Bureau of Statistics (KNBS). It pre-sents socio-economic highlights of the economy for the last five years. The report forms an important source of input into the budgeting process, planning, monitoring and policy formulation processes. At KNBS we remain committed to keeping you informed. Feel free to seek any further clarification on the information provided from our office.
The Kenya National Bureau of Statistics (KNBS) was established by The Statistics Act of 2006, to replace the Central Bureau of Statistics (CBS). The KNBS as a Semi-Autonomous Government Agency (SAGA) plays a crucial role in the development of statistics, at the National and County levels needed for planning and policy formulation in the country. Under Section 4(2) of The Statistics Act 2006, the Bureau is respon-sible for; establishing standards and promoting the use of best practices and methods in the production and dissemination of statistical information, across the National Statistical System (NSS).
Vision
A centre of excellence in Statistics Production and Management
Mission
To effectively manage and coordinate the entire National Statistical System to enhance statistical produc-
tion and utilization.
Mandate
KNBS is mandated by law (Statistics Act 2006) to collect, analysis disseminate social economic statistics
needed for planning and policy formulation in the Country.
The Bureau has 47 fully operational statistics offices in all the Counties. There are Six Directorates at the KNBS, namely;
Production Statistics;
Macroeconomic Statistics;
Population and Social Statistics;
Strategy and Development;
Finance and Administration and;
Information, Communication and Technology.
Zachary Mwangi Director General, KNBS
About Kenya National Bureau of Statistics (KNBS)
Economic Survey 2016

The Gross Domestic
Product (GDP) is
estimated to have
expanded by 5.6 per
cent in 2015 compared
to a 5.3 per cent
growth in 2014. This
growth was mainly
supported by a stable
macroeconomic
environment and
improvement in
outputs of agriculture;
construction; finance
and insurance; and
real estate.
GDP Indicators, 2011- 2015
DOMESTIC ECONOMY
Sector contribution in 2015
3
Indicator Unit 2011 2012 2013 2014 2015
GDP at Market Prices : (Current) KSh Billion 3,725,918.4 4,261,150.7 4,745,439.2 5,398,020.7 6,224,369.9
GDP at market prices (constant) KSh Billion 3,294,025.7 3,444,066.9 3,640,155.8 3,834,244.2 4,050,848.4
GDP Per capita (Current): KSh 94,219.4 104,820.9 113,210.3 124,710.0 140,961.0
GDP Per capita (Constant) KSh 83,297.9 84,721.2 87,105.4 89,240.5 91,588.0
GNI Per Capita (Current) KSh 94,235.0 104,514.0 112,575.0 124,044.0 139,972.0
Agriculture
Manufacturing
Transport & Storage
Real Estate
Education
Public administration & Defence
Information & Communication
Electricity Supply
Accommodation & Food service
Water Supply, Sewerage & Waste Mgt
Activities of household as employers
Financial Intermediation Services Construction
30%
10.3%
8.4%
7.6%
5.0%
4.8%
4.0%
0.9%
1.0%
0.8%
0.8%
0.5%
-2.7% KSh
Economic Survey 2016
-
1.0
2.0
3.0
4.0
5.0
6.0
7.0
2011 2012 2013 2014 2015
6.1
4.6
5.7 5.3
5.6
GDP Growth Rate

INTERNATIONAL SCENE
4
ANNUAL WORLD INFLATION RATES
World real Gross Domestic Product (GDP) growth decelerated to 3.1 per cent in 2015 from 3.4 per cent in 2014. This was as a result of low commodity prices, weaker capital flows, subdued global trade and increasing financial market volatility particularly in emerging markets and developing economies. The economic growth in Sub-Saharan Africa (SSA) slowed from 5.1 per cent GDP growth in 2014 to 3.8 per cent growth in 2015. However, there was a slowed growth of 3.4 per cent in 2015 from 5.8 per cent in 2014 in the East Africa Community (EAC). This was mainly asso-ciated with political instability in Burundi and uncertainties associated with general election in Tanzania and Uganda.
Uganda
5.2%
Tanzania
6.9%
South Africa
1.4%
Brazil
-3%
United States of America
2.4% China
6.8%
Japan
0.6%
Germany
1.5%
United Kingdom 2.4%
Regions
7.2
7.8
5.7 5.6
1.3
2.2
3.0
4.4
3.8
-
1.0
2.0
3.0
4.0
5.0
6.0
7.0
8.0
9.0
BRIICS EAC WAEMU ASEAN MASHREQ2
Perc
enta
ge
Region
Inflation Rate
Economic Survey 2016

EMPLOYMENT, EARNINGS AND CONSUMER PRICES
5
Formal and Informal New Jobs Created,
2011 - 2015
Public Sector
2.5%
Self Employment
19.6%
Average earning Private - 10.7 % Public - 6.2 %
Private Sector
5.4.%
Employment in 2015
5.9%
Average Annual Inflation Rate
Employment Growth Rates
14.0
9.4
5.7
6.9 6.6
0.0
2.0
4.0
6.0
8.0
10.0
12.0
14.0
16.0
2011 2012 2013 2014 2015
Years
InflationRates
Pe
rce
nt
Ne
w jo
bs
in '0
00
s
Economic Survey 2016

PUBLIC FINANCE
Government Revenue and Expenditure, 2011/12-
2015/16
National Government Expenditure by
Function, 2015 — 16
MONEY, BANKING AND FINANCE
6
0.7
2.2
3.1
3.1
3.8
6.1
10.1
10.4
12.9
13.5
14.4
- 5.0 10.0 15.0 20.0
Mining and Quarrying
Financial Institutions
Agriculture
OtherActivities
Building and Construction
Transport, Storage and communication
Real Estate
Manufacturing
Community and Personal Services (NPISH)
Wholesale and retail trade, hotels and restaurants
Other Business
Per cent
Se
cto
r
-
200.0
400.0
600.0
800.0
1,000.0
1,200.0
1,400.0
1,600.0
1,800.0
2011/12 2012/13 2013/14 2014/15* 2015/16+
KS
h B
illi
on
s
Year
Revenue Expenditure
Share of Commercial Banks' Bills, Loans and Advances to Private Sector, 2015
Economic Survey 2016
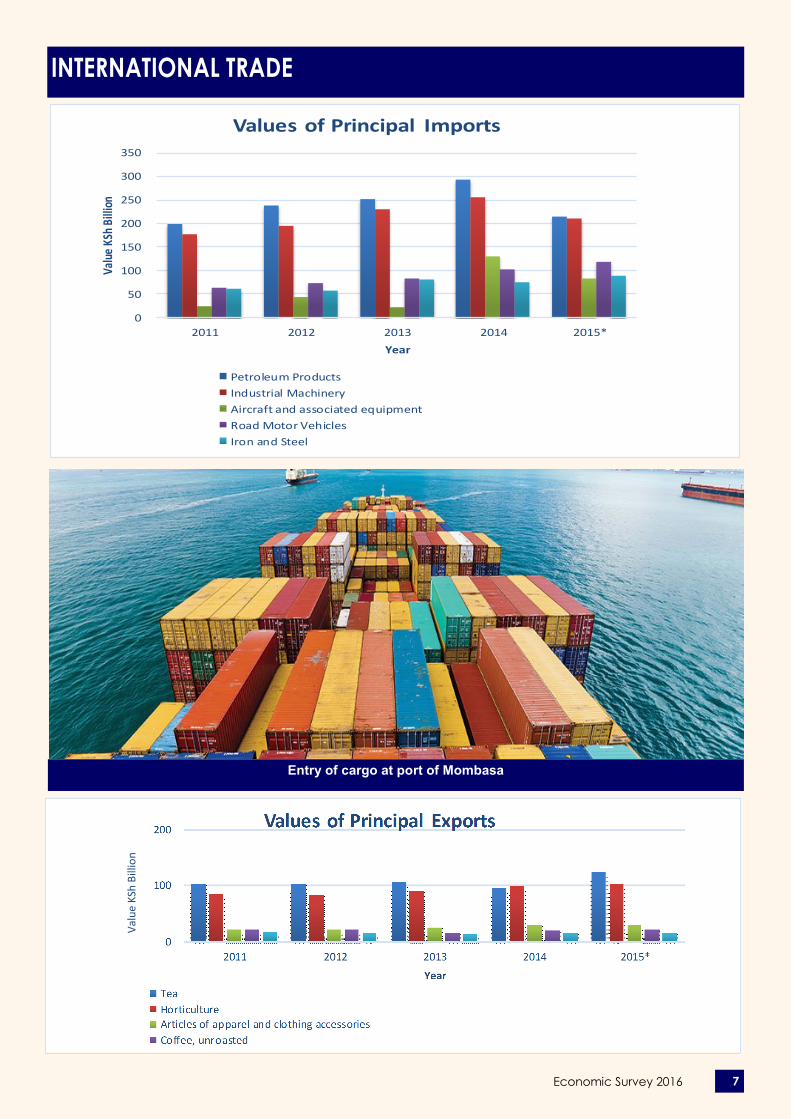
INTERNATIONAL TRADE
7
Entry of cargo at port of Mombasa
Economic Survey 2016
0
50
100
150
200
250
300
350
2011 2012 2013 2014 2015*
Valu
e KS
h Bi
llion
Year
Values of Principal Imports
Petroleum Products
Industrial Machinery
Aircraft and associated equipment
Road Motor Vehicles
Iron and Steel
Val
ue
KSh
Bill
ion

AGRICULTURE SECTOR
8
This Infographics highlight the Sale of Selected Agricultural Produce by Co-operatives and the percentage share to Marketed Production, 2011 - 2015
Economic Survey 2016
- 100.0 200.0 300.0 400.0 500.0 600.0 700.0
2011
2012
2013
2014
2015
549.0
495.2
523.0
541.3
600.4
Value of marketed Horticulture Produce
7.5%
Sugarcane Production
6.6%
Tea Production
10.3%
Coffee Production
16%
Wheat Production
4.2%
Maize Production
9%
Overall Growth Performance
6.2%
Recorded Milk Production (in Million litres)

ENVIRONMENT & NATURAL RESOURCES
Water
Mining The overall value of mineral output rose by 14.7 per cent from KSh 21.billion in 2014 to KSh 24.2 billion in 2015. The increase was mainly attributed to high earnings from titanium minerals of illmenite, rutile and zircon in the export markets. Earring from titanium
ores accounted for more than half of the minerals value.
9
Titanium Mining in the Kwale County
KSh. 32.5
billion in
2014/15
KSh. 41.3
billion in
2015/2016
County Government Environment protection
KSh. 5.2
billion in
2014/15
KSh. 16.6
billion in
2015/2016
0
100
200
300
400
500
600
700
2011/12 2012/13 2013/14 2014/15 2015/16*
Nu
mb
er
Year
Water Purification Points, Boreholes drilled by Public and Private Sector, 2011/12-
2015/16*
Water Purification Points Public Boreholes Private Boreholes
0
200
400
600
800
1000
1200
2011 2012 2013 2014 2015*
'00
0 T
on
ne
s
Year
Quantity of Principal Minerals, 2011-2015
Crushed Refined Soda Illmenite Titanium Ore
Soda Ash Rutile Titanium Ore
Fluorspar
0
1000
2000
3000
4000
5000
6000
7000
8000
9000
10000
2011 2012 2013 2014 2015*
Val
ue in
KSh
Mill
ion
Year
Value of Principal Minerals, 2011-2015
Soda Ash Rutile Titanium Ore
Illmenite Titanium Ore Zircon Titanium Ore
Fluorspar
Water resources for domestic, agricul-
ture and industrial use
Zircon
National Government Water supply
Economic Survey 2016

MANUFACTURING SECTOR
10
The manufacturing sector expanded by 3.5 per cent in 2015 compared to 3.2 per cent in 2014. The growth was partly attributed to reduced cost of inputs such as petroleum products and electricity.
Quantum Index, 2014 — 2015
132.5
116.5 118.6
138.2 134.1 135.6
125.4
143.6
0
20
40
60
80
100
120
140
160
Total Food Products Beverages and Tobacco Rubber and Plastic Products Total Manufacturing
Pe
rce
nta
ge
2014 2015
Producer Price Index Percentage Change, 2015
Economic Survey 2016
-2 -1 0 1 2 3 4 5 6
2011
2012
2013
2014
2015
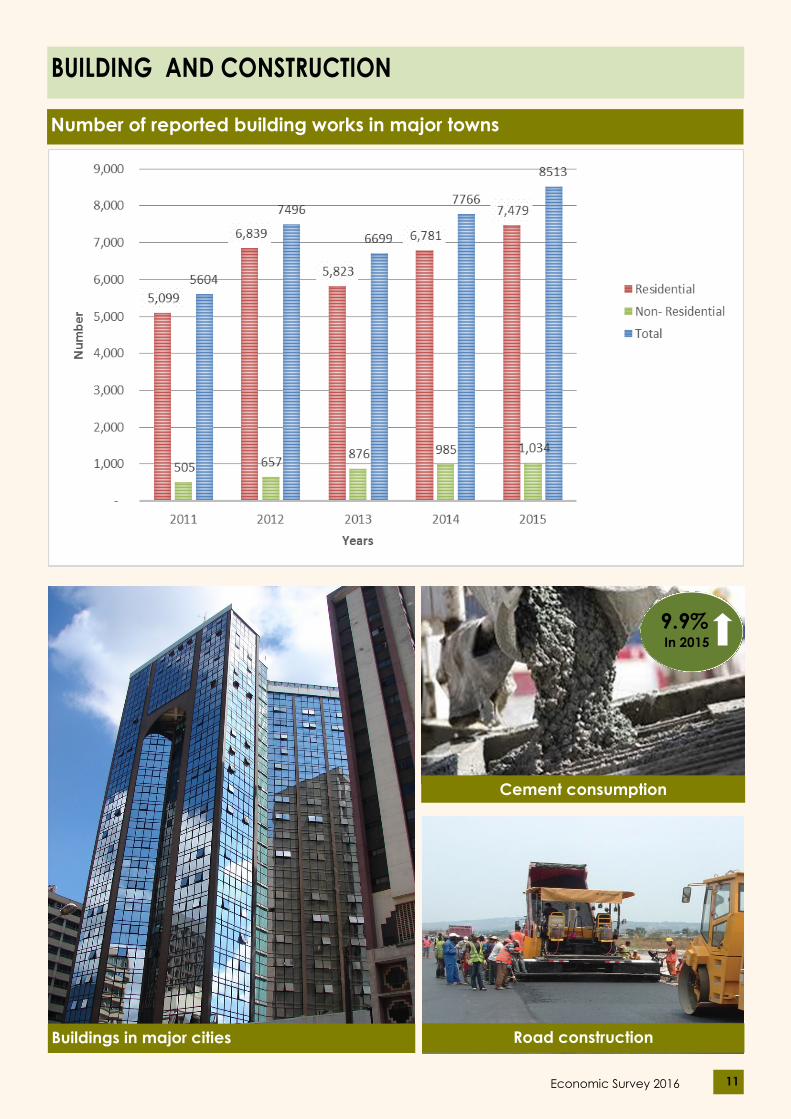
BUILDING AND CONSTRUCTION
11
Number of reported building works in major towns
Road construction
Economic Survey 2016
Buildings in major cities
Cement consumption
9.9% In 2015

TRANSPORT AND STORAGE
Cargo throughput in '000 Dead Weight Tonnes
0
50,000
100,000
150,000
200,000
250,000
300,000
2011 2012 2013 2014 2015
Motor Vehicles Motor and Auto Cycles Total Motor Vehicles and Auto cycles
Newly Registered motor vehicles, motor and auto cycles
Standard Gauge Railway Construction
12 Economic Survey 2016
0
200
400
600
800
1,000
1,200
1,400
1,600
1,800
2011 2012 2013 2014 2015
Rail Freight Traffic in Tonnes
0 200,000 400,000 600,000 800,000 1,000,0001,200,000
2011
2012
2013
2014
2015
5,200.0
5,400.0
5,600.0
5,800.0
6,000.0
6,200.0
6,400.0
6,600.0
6,800.0
7,000.0
7,200.0
2011 2012 2013 2014 2015
7,015.2
6,860.8
6,596.7
6,281.6
5,878.6
Bed
-Nig
hts
'000
Year
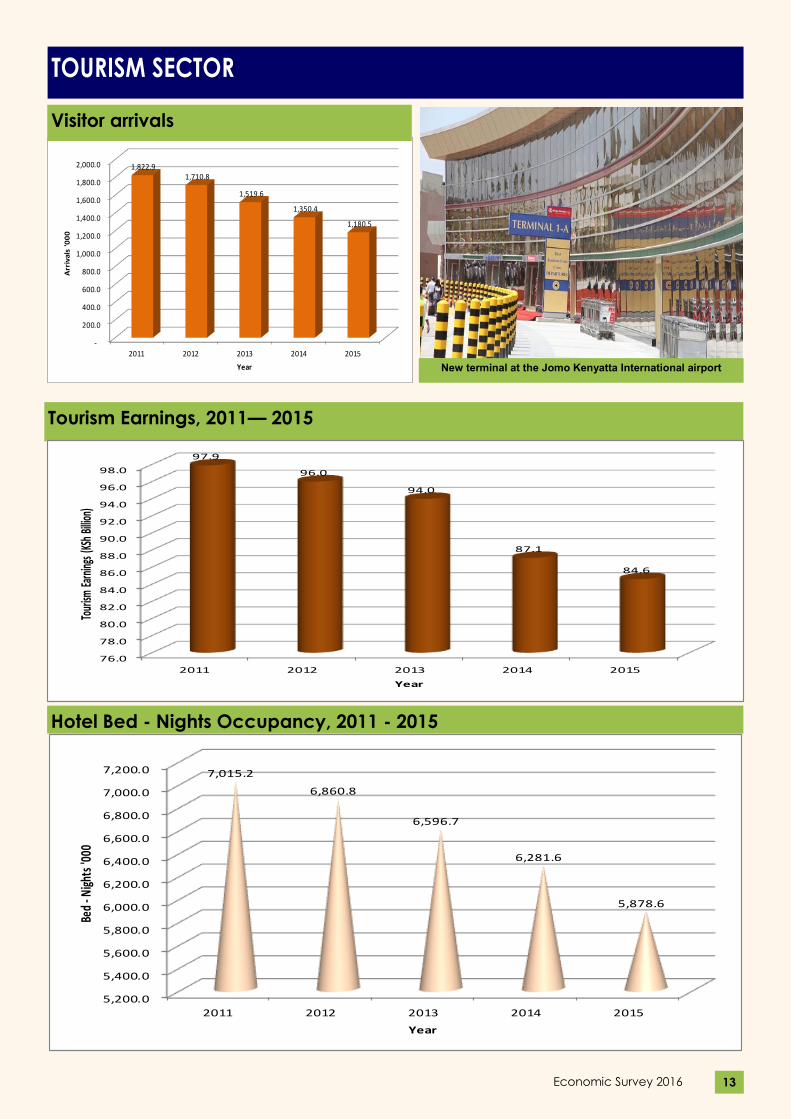
TOURISM SECTOR
13
Tourism Earnings, 2011— 2015
New terminal at the Jomo Kenyatta International airport
Hotel Bed - Nights Occupancy, 2011 - 2015
76.0
78.0
80.0
82.0
84.0
86.0
88.0
90.0
92.0
94.0
96.0
98.0
2011 2012 2013 2014 2015
97.9
96.0
94.0
87.1
84.6
Tour
ism Ea
rning
s (KS
h Bil
lion)
Year
-
200.0
400.0
600.0
800.0
1,000.0
1,200.0
1,400.0
1,600.0
1,800.0
2,000.0
2011 2012 2013 2014 2015
1,822.9 1,710.8
1,519.6
1,350.4
1,180.5
Arr
ival
s '0
00
Year
Visitor arrivals
Economic Survey 2016

Proportion of Geothermal power
to total electricity generation
47.5%
Geothermal production in Kenya
ENERGY
14
The energy sector witnessed a steady rise in global crude oil and other liquid inventories in 2015. Murban crude prices decreased to an average of USD 52.53 per barrel in 2015, down from an average of USD 99.45 per barrel in 2014.
Electricity generation in GWH
Economic Survey 2016

Petroleum Demand
Installed Capacity, 2015
Hydro35.2%
Thermal Oil
35.7%
Geo thermal26.9%
Wind1.1%
Co-generation1.1%
Power generation
15 Economic Survey 2016

INFORMATION,COMMUNICATION AND TECHNOLOGY (ICT)
Mobile and mobile money subscriptions
-
5,000,000
10,000,000
15,000,000
20,000,000
25,000,000
30,000,000
2011 2012 2013 2014 2015
No. of SMS sent
SMS sent
16 Economic Survey 2016
0
500
1,000
1,500
2,000
2,500
3,000
2011 2012 2013 2014 2015
Total mobile money transfer in KSh billion
Telecommunication tower

17
EDUCATION
17
Free Primary Education has increased school enrollment
Secondary School Gross Enrolment Rate (GER) and Net Primary School Gross Enrolment Rate (GER) and Net Enrolment
110,692
86,045
173,987
115,746
217,164
146,170
257,326
169,708
29,554 24,905 39,980
31,666 42,454 37,994
45,259 40,630
-
50,000
100,000
150,000
200,000
250,000
300,000
Male Female Male Female Male Female Male Female
2012/13 2013/14 2014/15 2015/16*
Public Private
University Enrolment, 2011— 2015
Economic Survey 2016

The total number of registered births marginally decreased from 954,254 in 2014 to 950,224 in 2015. Similarly, the coverage rate declined marginally from 63.4 per cent in 2014 to 60.4 per cent in 2015. Disparities in registration of births were observed across counties with Garissa recording the highest coverage rate of 93.3 per cent while Mandera recorded the least coverage rate at 16.0 per cent.
Total Number of registered medical personal in 2015 was 133,002 up from 12,1578 in 2014.
Number of registered medical personal per 100,000 thousand of the population rose to 301 in 2015 up from 282.
HEALTH INDICATORS
18
0 5000 10000 15000 20000 25000 30000 35000 40000 45000 50000
Doctors
Dentists
Pharmacists
Pharmaceutical Technologists
BSc Nursing
Registered Nurses
Enrolled Nurses
Clinical Officers
Public Health officers1
Public Health Technicians2
Number
Pe
rso
nn
el
2015 2014
Registered Medical Personnel, 2014 - 2015
Hospital building
Economic Survey 2016

GOVERNANCE
Number of Police, Prison and Probation Officers, 2011-2015
Reported crime and type
In 2015, the Judiciary implemented a number of institutional changes aimed at improving delivery of justice. This included recruitment of more judicial officers, opening up of new court stations and launching the Magistrates and Kadhis Courts Registry Manual.
2,648
6,164
21,174
2,865
5,591
1,961
9,528
2,184
1,111
5,525
120
3,983
3,244
79
71
19
6,223
0 5,000 10,000 15,000 20,000 25,000
Homicide
Offences against morality
Robbery
Breakings
Theft of stock
Stealing
Theft by servant
Dangerous drugs
Traffic offences
Criminal damage
Economic crimes
Corruption
Offences involving tourists
Other penal code offences
Num
ber
Type
of c
rim
e
17 19
Nu
mb
er
Economic Survey 2016
Published by the Kenya National Bureau of Statistics (KNBS) - April , 2016 ISBN 9966 – 767– 52– 5
@KNBStats
Kenya National Bureau of Statistics (KNBStats)
Kenya National Bureau of Statistics
Herufi House
Lt. Tumbo Avenue
P.O. Box 30266 – 00100
Nairobi, Kenya
Telephone: (+254) 3317583/6
Fax: (+254) 20 3315977 Email: [email protected]
Website: www.knbs.or.ke
Follow us at: