Economic, social and territorial situation of France
36
Transcript of Economic, social and territorial situation of France

DIRECTORATE-GENERAL FOR INTERNAL POLICIES
POLICY DEPARTMENT B: STRUCTURAL AND COHESION POLICIES
REGIONAL DEVELOPMENT
RESEARCH FOR REGI COMMITTEE -ECONOMIC, SOCIAL ANDTERRITORIAL SITUATION
IN CROATIA
IN-DEPTH ANALYSIS
This document was requested by the European Parliament’s Committee on RegionalDevelopment.
AUTHOR
Diána HaasePolicy Department B: Structural and Cohesion PoliciesEuropean ParliamentB-1047 BrusselsE-mail: [email protected]
EDITORIAL ASSISTANCE
Lyna Pärt
LINGUISTIC VERSIONS
Original: EN
ABOUT THE PUBLISHER
To contact the Policy Department or to subscribe to its monthly newsletter please write to:[email protected]
Manuscript completed in May 2016© European Union, 2016.
Print ISBN 978-92-823-9149-5 doi: 10.2861/082672 QA-01-16-430-EN-CPDF ISBN 978-92-823-9148-8 doi: 10.2861/808147 QA-01-16-430-EN-N
This document is available on the internet at:http://www.europarl.europa.eu/supporting-analyses
DISCLAIMER
The opinions expressed in this document are the sole responsibility of the author and donot necessarily represent the official position of the European Parliament.
Reproduction and translation for non-commercial purposes are authorised, provided thesource is acknowledged and the publisher is given prior notice and sent a copy.
DIRECTORATE-GENERAL FOR INTERNAL POLICIES
POLICY DEPARTMENT B: STRUCTURAL AND COHESION POLICIES
REGIONAL DEVELOPMENT
RESEARCH FOR REGI COMMITTEE -ECONOMIC, SOCIAL ANDTERRITORIAL SITUATION
IN CROATIA
IN-DEPTH ANALYSIS
Abstract
This in-depth analysis was written upon request of the Committee on RegionalDevelopment, and it is an update of a similar document that was completed inNovember 2015. The aim is to inform Members about the political, socio-economicand administrative system of Croatia, in particular Šibenik-Knin and KarlovacCounties and the City of Zagreb. The analysis also provides an overview ofcohesion policy in Croatia, including the arrangements in place for the 2014-2020programming period and the European Territorial Cooperation programmes.
IP/B/REGI/NT/2016-09 May 2016
PE 573.444 EN

Economic, Social and Territorial Situation in Croatia
3
TABLE OF CONTENTS
LIST OF ABBREVIATIONS 4
LIST OF TABLES 5
LIST OF FIGURES 5
1. THE REPUBLIC OF CROATIA: KEY FACTS AND FIGURES 7
2. ECONOMIC, SOCIAL AND TERRITORIAL SITUATION OF ŠIBENIK-KNIN COUNTY, KARLOVAC COUNTY AND THE CITY OF ZAGREB 15
2.1. Šibenik-Knin County 15
2.2. Karlovac County 16
2.3. The City of Zagreb 17
3. EU COHESION POLICY IN CROATIA 21
3.1. Pre accession 21
3.2. 2007-2013 period (The period from 1 July 2013 to 31 December 2013) 21
3.3. 2014-2020 period 22
3.4. EU Cohesion Policy in Šibenik-Knin and Karlovac Counties and the City ofZagreb - project examples 24
3.5. Territorial cooperation and macro-regional strategies in Croatia - projectexamples 25
REFERENCES 29
Policy Department B: Structural and Cohesion Policies
4
LIST OF ABBREVIATIONS
CARDS Community Assistance for Reconstruction, Development andStabilisation
CBC Cross-border cooperation
EAFRD European Agricultural Fund for Rural Development
EC European Commission
EMFF European Maritime and Fisheries Fund
ERDF European Regional Development Fund
ESF European Social Fund
ESIF/ESIFunds
European Structural and Investment Funds
EU European Union
EUR Euro
GDP (PPS) Gross Domestic Product (purchasing power standards)
IPA Instrument for Pre-Accession Assistance
ISPA Instrument for Structural Policies for Pre-Accession
LRUs Local and regional units
NUTS Nomenclature of Territorial Units for Statistics
OECD Organisation for Economic Co-operation and Development
OP Operational Programme
PA Partnership Agreement
PHARE Poland and Hungary: Aid for Restructuring of the Economies
R&D Research and Development
SME Small and Medium sized Enterprise (s)
TEN-T Trans-European Transport Network
TO Thematic Objective
UNESCO United Nations Educational, Scientific and Cultural Organization
USAID United States Agency for International Development
YEI Youth Employment Initiative
Economic, Social and Territorial Situation in Croatia
5
LIST OF TABLES
Table 1European Economic Forecast Spring 2015 - Croatia 11
Table 2World Ranking of tourism economic indicators out of 184 countries (EuropeanUnion – World Ranking out of World 12 regions) 12
Table 3Basic Energy Indicators (2012) 13
Table 4Key data - Šibenik-Knin County 15
Table 5Key data - Karlovac County 16
Table 6Key data - Zagreb 18
Table 7Croatian ESIF programmes, 2014-2020 23
LIST OF FIGURES
Figure 1Map of Croatia 7
Figure 2Counties and the City of Zagreb 8
Figure 3Statistical regions of Croatia 9
Figure 4Real GDP growth rate, 1998-2015 10

Policy Department B: Structural and Cohesion Policies
6

Economic, Social and Territorial Situation in Croatia
7
1. THE REPUBLIC OF CROATIA: KEY FACTS ANDFIGURES
The Republic of Croatia (Republika Hrvatska) is located in South-eastern Europe, it is partof the Danube valley and to the east it is bordering the Adriatic Sea. Neighbouringcountries are Slovenia, Hungary, Serbia, Bosnia and Herzegovina and Montenegro.
Figure 1: Map of Croatia
Source: croatia.eu
The land area of Croatia is 56 594 km2, and the sea and interior sea waters are 31 479km2. The coast line is 6 278 km long (mainland 1 880 km and islands 4 398 km). Croatiahas more than a thousand islands, islets, rocks and reef, a fact that is of importancefor the "geographical identity" of the country. Although the land area of Croatia is not verybig (19th in size among Member States of the European Union), it has an extremelyvaried relief, with the three main types being: lowland Pannonian, mountainous Dinaricand coastal Adriatic. The highest point is Dinara peak - 1 831 m. About 62 % of theterritory covered by the river network belongs to the Black Sea catchment basin, 38 % ofthe territory to the Adriatic catchment basin. Croatia is considered to be one of the classickarst countries in Europe, and it has large reserves of underground drinking water: interms of the size of its per capita water reserves, Croatia is the third in Europe (behindIceland and Norway). In addition, 47 % of its land and 39 % of its sea is designated asspecially protected areas and areas of conservation: 19 National and Nature Parks,with some- designated as United Nations Educational, Scientific and Cultural Organization(UNESCO) World Heritage sites.

Policy Department B: Structural and Cohesion Policies
8
According to the 2011 Census (Croatian Bureau of Statistics), the population of Croatia is4 284 889 people, of which 48.2 % are men and 51.8 % are women. The majority of thepopulation are Croats (90.42 %). The biggest minority with 4.36 % of the population arethe Serbs, but a wide range of other ethnicities are also present in the country, includingBosnians, Hungarians, Slovenes, Italians, Czechs, and Romas (each ethnicity being lessthan 1 % of the total population).
Eurostat data for 2015 reports the population (the number of persons having their usualresidence in a country on 1 January of the respective year) to be 4 225 316 persons. Theofficial language is Croatian, and the currency in use is kuna.
1.1. Political and governmental/administrative structuresCroatia became independent from the former Yugoslavia on 25 June 1991; it joined the UNon 22 May 1992 and NATO on 1 April 2009. Croatia became candidate country for EUmembership in June 2004 and accession negotiations were opened on 3 October 2005. TheEuropean Union (EU) Accession Treaty was signed on 9 December 2011; and at thereferendum at the beginning of 2012, 66.27 % of Croatian voters supported accession tothe EU. The parliament unanimously ratified the Accession Treaty and Croatia becamethe 28th EU Member State as of 1 July 2013.
Croatia is a unitary state, with a unicameral parliamentary system (the parliament iscalled Sabor), and it has three levels of governance: central (national) level, "regional"1 level with the 20 Counties (županija) plus the City of Zagreb (The
capital city of Zagreb has a special status, as it is both a Town and a County), local level with the 428 Municipalities and 128 Towns.
Figure 2: Counties and the City of Zagreb
Source: croatia.euNote: Karlovac County (IV), Šibenik-Knin County (XV), Zagreb (XXI).
1 In several Croatian documents, available in English online, the term "region" refers to a county, and not to aNUTS2 region. For the sake of clarity, in this in-depth analysis the term "region" means NUTS2 regions.

Economic, Social and Territorial Situation in Croatia
9
Croatia underwent a decentralisation process that started in 2001 when certainfunctions and responsibilities were transferred from the national to the local level. ACommission for Decentralisation was created by the government in 2004 and overall, thereform of local self-government has long been present on the political agenda, stronglysupported by international organisations and donors (e.g. EU CARDS and IPA, USAID). Thecategory of large Towns (more than 35 000 citizens) was introduced in 2005, and thesehave broader self-government competences. The division of responsibilities, the territorialorganization and budgetary issues of local units are regulated by several pieces oflegislation; the financing system of local and regional units is mainly based on sharing oftax revenues (in particular the personal income tax) between the central government andthe local and regional units (LRUs). As regards their competences, cities andmunicipalities carry out locally important operations that directly affect the needsof the citizens (tasks not assigned by constitution or law to state bodies). Obligatory tasksinclude among others housing and arrangement of settlements, zoning and town planning,pre-elementary and elementary schooling, protection and improvement of naturalenvironment, etc. Counties on the other hand are in charge of operations of regionalimportance, in domains such as education; zoning and town planning; economicdevelopment; transports and transportation infrastructure.
The European Commission (EC), in its Croatia Country Report 2016, concludes that there ishigh level of territorial fragmentation of public administration that translates into amultiplication of functions and public bodies and weighs on efficiency. The decentralisationof functions to sub-national levels of government went beyond their fiscal capacity,resulting in strong reliance on central government transfers. Moreover, weaknesses inadministrative capacities and procedures hamper (partially due to fragmentation ofsub-national governance) management and absorption of European Structural andInvestment Funds (ESIF/ESI Funds). Despite these weaknesses, reform of governance atlocal level is still not in sight. 2
Finally, Croatia is divided into two (earlier three) statistical (NUTS 2 level) regions:Jadranska Hrvatska and Kontinentalna Hrvatska. The City of Zagreb and Karlovac Countyare in Kontinentalna Hrvatska, and Karlovac County is situated in Jadranska Hrvatska.
Figure 3: Statistical regions of Croatia
Source: cor.europa.eu
2 Country Report Croatia 2016, SWD(2016)80 final/2 of 3.3.20156.

Policy Department B: Structural and Cohesion Policies
10
The government in power is a coalition that involves representatives of the Hrvatskademokratska zajednica (HDZ), MOST nezavisnih lista as well as independent ministers(without affiliation to a political party).3.
Political summary
Presidential elections Latest one: 28 December 2014 and11 January 2015
Legislative elections Latest one: 8 November 2015;
Local elections Latest one: 19 May and 2 June 2013
Head of State President Kolinda Grabar-Kitarović(HDZ), elected 11 January 2015;inaugurated 15 February 2015
Head of Government Tihomir Oreskovic, Prime Minister(since 22 January 2016);
Minister responsible forCohesion Policy
Tomislav Tolušić,, Minister ofRegional Development and EU Funds
1.2. The economyCroatia had one of the wealthiest economies among the former Yugoslavianrepublics. Unfortunately, the country suffered heavily during the war of 1991-95,and lost part of its competitiveness compared to other economies of central Europe thatwere benefiting (at the beginning of the 1990s) from democratic changes. Also due to thesubsequent introduction of reforms, Croatia had developed quickly until 2008 (see Figure 4below).
Figure 4: Real GDP growth rate, 1998-2015
-8,0
-6,0
-4,0
-2,0
0,0
2,0
4,0
6,0
2004 2005 2006 2007 2008 2009 2010 2011 2012 2013 2014 2015EU - 28
Croatia
Source: Author, based on Eurostat data.
3 HDZ: Croatian Democratic Union, MOST nezavisnih lista: Bridge of Independent Lists.
Economic, Social and Territorial Situation in Croatia
11
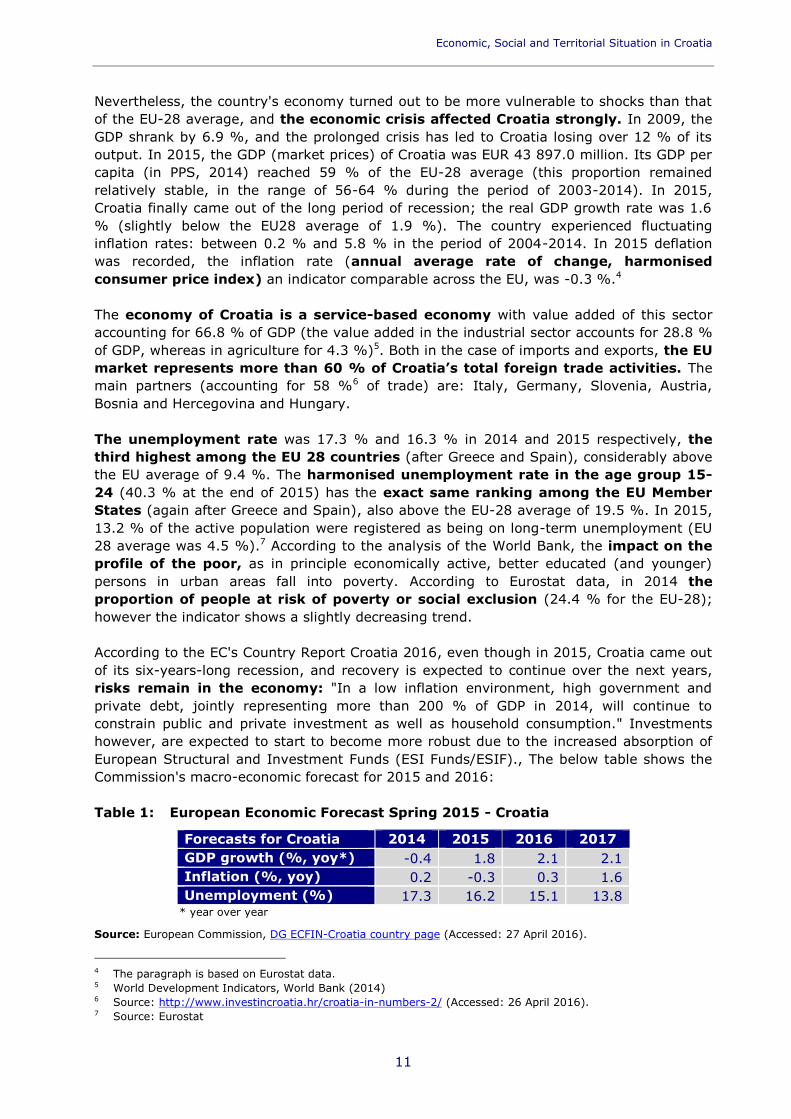
Nevertheless, the country's economy turned out to be more vulnerable to shocks than thatof the EU-28 average, and the economic crisis affected Croatia strongly. In 2009, theGDP shrank by 6.9 %, and the prolonged crisis has led to Croatia losing over 12 % of itsoutput. In 2015, the GDP (market prices) of Croatia was EUR 43 897.0 million. Its GDP percapita (in PPS, 2014) reached 59 % of the EU-28 average (this proportion remainedrelatively stable, in the range of 56-64 % during the period of 2003-2014). In 2015,Croatia finally came out of the long period of recession; the real GDP growth rate was 1.6% (slightly below the EU28 average of 1.9 %). The country experienced fluctuatinginflation rates: between 0.2 % and 5.8 % in the period of 2004-2014. In 2015 deflationwas recorded, the inflation rate (annual average rate of change, harmonisedconsumer price index) an indicator comparable across the EU, was -0.3 %.4
The economy of Croatia is a service-based economy with value added of this sectoraccounting for 66.8 % of GDP (the value added in the industrial sector accounts for 28.8 %of GDP, whereas in agriculture for 4.3 %)5. Both in the case of imports and exports, the EUmarket represents more than 60 % of Croatia’s total foreign trade activities. Themain partners (accounting for 58 %6 of trade) are: Italy, Germany, Slovenia, Austria,Bosnia and Hercegovina and Hungary.
The unemployment rate was 17.3 % and 16.3 % in 2014 and 2015 respectively, thethird highest among the EU 28 countries (after Greece and Spain), considerably abovethe EU average of 9.4 %. The harmonised unemployment rate in the age group 15-24 (40.3 % at the end of 2015) has the exact same ranking among the EU MemberStates (again after Greece and Spain), also above the EU-28 average of 19.5 %. In 2015,13.2 % of the active population were registered as being on long-term unemployment (EU28 average was 4.5 %).7 According to the analysis of the World Bank, the impact on theprofile of the poor, as in principle economically active, better educated (and younger)persons in urban areas fall into poverty. According to Eurostat data, in 2014 theproportion of people at risk of poverty or social exclusion (24.4 % for the EU-28);however the indicator shows a slightly decreasing trend.
According to the EC's Country Report Croatia 2016, even though in 2015, Croatia came outof its six-years-long recession, and recovery is expected to continue over the next years,risks remain in the economy: "In a low inflation environment, high government andprivate debt, jointly representing more than 200 % of GDP in 2014, will continue toconstrain public and private investment as well as household consumption." Investmentshowever, are expected to start to become more robust due to the increased absorption ofEuropean Structural and Investment Funds (ESI Funds/ESIF)., The below table shows theCommission's macro-economic forecast for 2015 and 2016:
Table 1: European Economic Forecast Spring 2015 - Croatia
Forecasts for Croatia 2014 2015 2016 2017GDP growth (%, yoy*) -0.4 1.8 2.1 2.1Inflation (%, yoy) 0.2 -0.3 0.3 1.6Unemployment (%) 17.3 16.2 15.1 13.8
* year over year
Source: European Commission, DG ECFIN-Croatia country page (Accessed: 27 April 2016).
4 The paragraph is based on Eurostat data.5 World Development Indicators, World Bank (2014)6 Source: http://www.investincroatia.hr/croatia-in-numbers-2/ (Accessed: 26 April 2016).7 Source: Eurostat
Policy Department B: Structural and Cohesion Policies
12
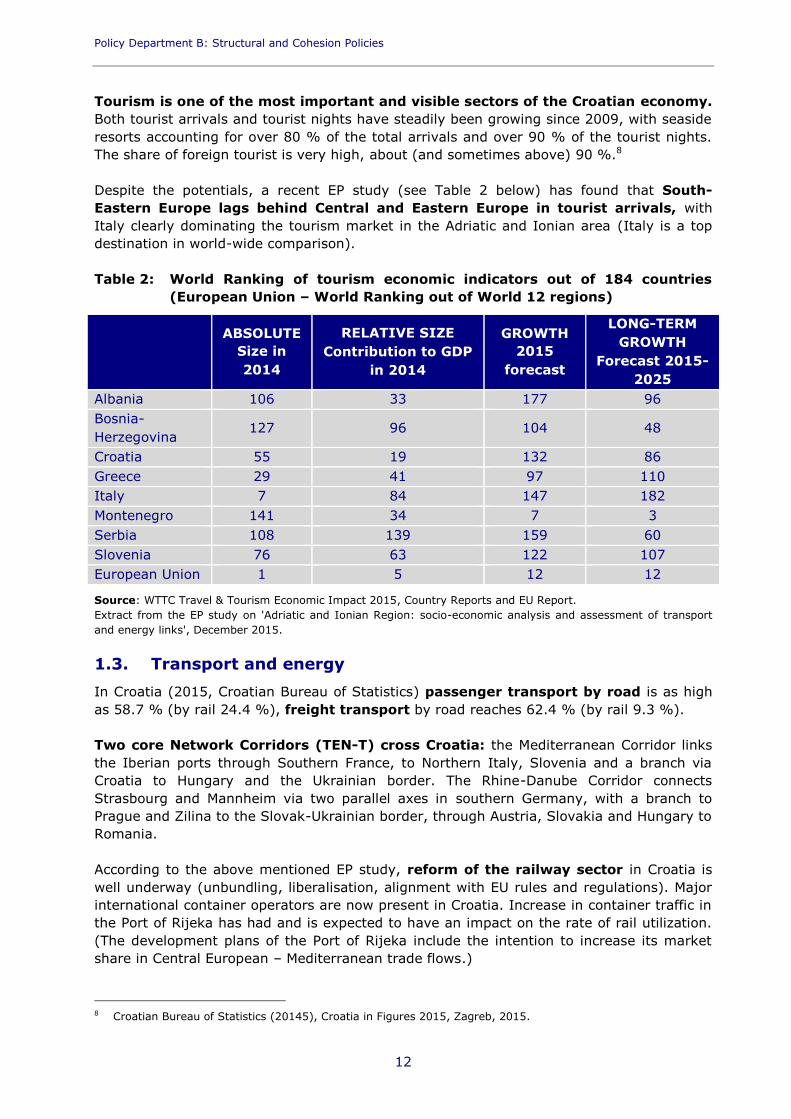
Tourism is one of the most important and visible sectors of the Croatian economy.Both tourist arrivals and tourist nights have steadily been growing since 2009, with seasideresorts accounting for over 80 % of the total arrivals and over 90 % of the tourist nights.The share of foreign tourist is very high, about (and sometimes above) 90 %.8
Despite the potentials, a recent EP study (see Table 2 below) has found that South-Eastern Europe lags behind Central and Eastern Europe in tourist arrivals, withItaly clearly dominating the tourism market in the Adriatic and Ionian area (Italy is a topdestination in world-wide comparison).
Table 2: World Ranking of tourism economic indicators out of 184 countries(European Union – World Ranking out of World 12 regions)
ABSOLUTESize in2014
RELATIVE SIZEContribution to GDP
in 2014
GROWTH2015
forecast
LONG-TERMGROWTH
Forecast 2015-2025
Albania 106 33 177 96Bosnia-Herzegovina
127 96 104 48
Croatia 55 19 132 86Greece 29 41 97 110Italy 7 84 147 182Montenegro 141 34 7 3Serbia 108 139 159 60Slovenia 76 63 122 107European Union 1 5 12 12
Source: WTTC Travel & Tourism Economic Impact 2015, Country Reports and EU Report.Extract from the EP study on 'Adriatic and Ionian Region: socio-economic analysis and assessment of transportand energy links', December 2015.
1.3. Transport and energyIn Croatia (2015, Croatian Bureau of Statistics) passenger transport by road is as highas 58.7 % (by rail 24.4 %), freight transport by road reaches 62.4 % (by rail 9.3 %).
Two core Network Corridors (TEN-T) cross Croatia: the Mediterranean Corridor linksthe Iberian ports through Southern France, to Northern Italy, Slovenia and a branch viaCroatia to Hungary and the Ukrainian border. The Rhine-Danube Corridor connectsStrasbourg and Mannheim via two parallel axes in southern Germany, with a branch toPrague and Zilina to the Slovak-Ukrainian border, through Austria, Slovakia and Hungary toRomania.
According to the above mentioned EP study, reform of the railway sector in Croatia iswell underway (unbundling, liberalisation, alignment with EU rules and regulations). Majorinternational container operators are now present in Croatia. Increase in container traffic inthe Port of Rijeka has had and is expected to have an impact on the rate of rail utilization.(The development plans of the Port of Rijeka include the intention to increase its marketshare in Central European – Mediterranean trade flows.)
8 Croatian Bureau of Statistics (20145), Croatia in Figures 2015, Zagreb, 2015.

Economic, Social and Territorial Situation in Croatia
13
Energy production in Croatia is typically dominated by hydro and conventionalthermo powers, but the country also imports a substantial share of its energyconsumption. The same EP study found that the energy system is fragmented (in theBalkan Peninsula and in relation to Italy). Also the area is not well connected to CentralEurope and the Black Sea. Most countries on the Balkan Peninsula (the ones that have gasinfrastructure, including Croatia) are heavily dependent on gas supply from the RussianFederation even though natural gas covers a relatively small percentage of energy demandin these economies.
Table 3: Basic Energy Indicators (2012)
millionbillion2005USD
billion2005USD
Mtoe Mtoe Mtoe TWh MtOf CO2
World 7 037 54 588 82 901 13 461 - 13 371(c) 20 915 31 734(d)
OECD 1 254 39 490 39 202 3 869 1 543 5 250 10 145 12 146Albania 3.16 11.22 25.69 1.67 0.39 2.07 6.14 3.83Bosnia andHerzegovina 3.83 12.88 28.20 4.52 2.21 6.67 12.54 21.22
Croatia 4.27 44.95 68.29 3.45 4.39 7.92 16.30 17.19Greece 11.09 208.22 234.49 10.43 19.44 26.55 61.13 77.51
Italy 60.91 1 729.86 1605.06 31.86 132.60 158.80 321.38 374.77
Montenegro 0.62 2.88 6.59 0.71 0.37 1.06 3.36 2.30Serbia 7.22 27.85 69.95 10.78 3.98 14.46 31.58 44.09Slovenia 2.06 38.25 50.29 3.56 3.64 7.00 13.94 14.63(a) Gross production + imports – exports - losses.(b) CO2 emissions form fuel combustion only. Emissions are calculated using the IEA’s energy balances and theRevised 1996 IPPCC Guidelines.(c) TPES for world includes international aviation and international marine bunkers as well as electricity and heattrade.(d) CO2 emissions for world include emissions from international aviation and international marine bunkers.TPES= Total Primary Energy Supply
Source: IEA (2013)Extract from EP study on 'Adriatic and Ionian Region: socio-economic analysis and assessment of transport andenergy links', December 2015
Finally, In Croatia 76 % of households and 89 % of firms (without financial sector, 10 ormore persons employed)) are connected to broadband network; EU-28 figures are 80 %and 95 % respectively (Eurostat, 2015).

Policy Department B: Structural and Cohesion Policies
14

Economic, Social and Territorial Situation in Croatia
15
2. ECONOMIC, SOCIAL AND TERRITORIAL SITUATION OFŠIBENIK-KNIN COUNTY, KARLOVAC COUNTY AND THECITY OF ZAGREB
As explained in the previous chapter, Croatia has 20 Counties with the City of Zagreb beingboth a Town and a County.
2.1. Šibenik-Knin CountyŠibenik-Knin County (Šibensko-kninska županija) is situated in southern Croatia, in thenorth-central part of Dalmatia, with numerous islands belonging to its territory. On theeast, it borders with Bosnia and Herzegovina, and to the west it hosts parts of the AdriaticSea border with Italy. Its northern neighbour is the Zadar County, and to the south theSplit-Dalmatia County. Two natural parks are situated in the county: Krka and the KornatiNational Parks. The Cathedral of St James in Šibenik is part of the UNESCO World Heritagelist.
Table 4: Key data - Šibenik-Knin County
Flag
Area 2 984 km2
County seat: Šibenik
Settlements 5 towns and 15 municipalities
Population 109 375
Population density (per km2) 36.7
Sources: Census 2011, Statistical Information 2015, Croatian Bureau of Statistics
2.1.1 Governmental and administrative structures9
Administratively, Šibenik-Knin County is divided into 20 territorial units of local self-government: 5 towns and 15 municipalities. Administratively, Šibenik-Knin County isdivided into 20 territorial units of local self-government: 5 towns and 15 municipalities.Bodies of the county are the following: the Assembly (41 members, 6 representatives ofthe Serb minority, based in Šibenik), and the County Prefect. Currently, the President ofthe Regional Assembly is Mr. Nediljko Dujić (Party: HDZ), and the County Prefect is Mr.Goran Pauk (HDZ).
2.1.2 Socio-economic development10
The GDP of Šibenik-Knin County is 6 485 585.79 thousand kuna (2013 data, 856 347.1thousand EUR), corresponding to 1.97 % of the country's GDP. The GDP per capita is60 975.1 kuna, (2013 data, EUR 8 051.1), 79 % of the national average. 2015 data of theCroatian Bureau of statistics shows that only 2.2 % of the total number of businessentities was located in the county.
9 Information largely based on the Statute of the County. (Accessed: 8 September 2015)10 Main source of data are several publications of the Croatian Bureau of Statistics (2015).
Policy Department B: Structural and Cohesion Policies
16
According to the results of the 2011 Census, Croats amount to 87.4 % of thepopulation of the county. The biggest minority are the Serbs (10.5 %). The biggesttown is Šibenik with 46 332 inhabitants, followed by Knin (15 407); the other three townshave less than 10 000 people. The population of the 15 municipalities ranges from 239 to3481 inhabitants.
The data of the 2011 Census showed the following distribution of people inemployment across the key sectors of the economy: 3.1 % of those in employmentworked in agriculture/forestry/fishing, 23.7 % in mining/industry/construction andenergy/water related activities, 70.2 % was employed in the services sector. Theunemployment rate was 25.5 % in 2014, above the national level of 22.2 %.
The area of Šibenik traditionally has industrial production (mainly metalwork, but also smallboat building). Wine making is also part of the local economy, with several vineyardsforming winemaking sub-regions in a relatively small geographical area. The area also hasa lot to offer for tourism industry, for example it is a popular sailing destination in theAdriatic and the wider Mediterranean region. As part of the business support infrastructure,a Business zone called Podi was established 3.5 km east of city Šibenik (12 companies withmore than 500 employees; investors from Croatia, Slovenia, Germany, Austria, Italy andthe Netherlands). There is also a business incubator in Šibenik (which, same as the Ponizone benefited from the CARDS programme (2002)).
As regards infrastructure endowment, A1 highway crosses the county; there is a port inŠibenik that specializes in bulk cargo transhipment, but with the growing importance ofpassenger traffic the port authority is in the process of creating a new passenger terminal.There are two regional airports within 60-70 km distance Šibenik (Split and Zadar).11
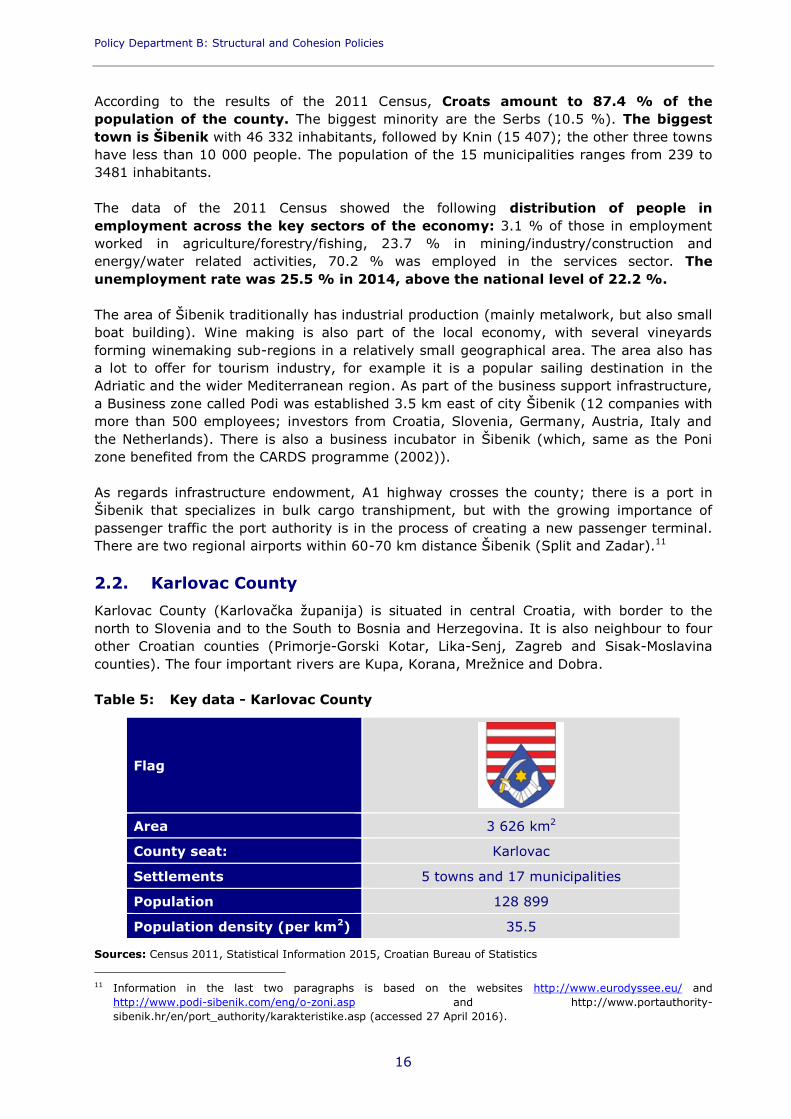
2.2. Karlovac CountyKarlovac County (Karlovačka županija) is situated in central Croatia, with border to thenorth to Slovenia and to the South to Bosnia and Herzegovina. It is also neighbour to fourother Croatian counties (Primorje-Gorski Kotar, Lika-Senj, Zagreb and Sisak-Moslavinacounties). The four important rivers are Kupa, Korana, Mrežnice and Dobra.
Table 5: Key data - Karlovac County
Flag
Area 3 626 km2
County seat: Karlovac
Settlements 5 towns and 17 municipalities
Population 128 899
Population density (per km2) 35.5
Sources: Census 2011, Statistical Information 2015, Croatian Bureau of Statistics
11 Information in the last two paragraphs is based on the websites http://www.eurodyssee.eu/ andhttp://www.podi-sibenik.com/eng/o-zoni.asp and http://www.portauthority-sibenik.hr/en/port_authority/karakteristike.asp (accessed 27 April 2016).

Economic, Social and Territorial Situation in Croatia
17
2.1.1 Governmental and administrative structures12
Administratively, Karlovac County is divided into 22 territorial units of local self-government: 5 towns and 17 municipalities. Administratively, Karlovac County isdivided into 22 territorial units of local self-government: 5 towns and 17 municipalities.Bodies of the county are the following: the Assembly (41 members, 4 representatives ofthe Serb minority, based in Karlovac), the County Prefect. Currently, the President of theRegional Assembly is Mr. Željko Bokulić (Party: HSP Dr. Ante Starčević13), and the CountyPrefect is Mr. Ivan Vučić (HDZ).
2.1.2 Socio-economic development14
The GDP of Karlovac county is 7 381 857.2 thousand kuna (2013, 974 689.4 thousandEUR), corresponding to 2.2 % of the country's GDP. The GDP per capita is 58 791.7kuna (2013, EUR 7762.8), 75.96 % of the national average. 2015 data of the CroatianBureau of statistics shows that only 2 % of the total number of business entities waslocated in the county.
According to the results of the 2011 Census, Croats amount to 86.1 % of thepopulation of the county. The biggest minority are the Serbs (10.4 %). The biggesttown is Karlovac with 55 705 inhabitants, followed by Ogulin (13 915) and Duga Resa (11180); the other two towns have less than 10 000 people. The population of the 17municipalities ranges from 475 to 4 764 inhabitants.
The data of the 2011 Census showed the following distribution of people inemployment across the key sectors of the economy: 5.3 % of those in employmentworked in agriculture/forestry/fishing, 32.2 % in mining/industry/construction andenergy/water related activities, 62.2 % was employed in the services sector. Theunemployment rate was 25.6 % in 2014, above the national level of 22.2 %.
2.3. The City of ZagrebThe City of Zagreb is the capital city and the biggest town in Croatia. It is situatedbetween the Pannonian plain, the edge of the Alps and the Dinaric range, on the slopes ofMedvednica Mountain, in the Carpathian Basin. Thus, it is in a natural "crossroads", amajor transit area in terms of culture, trade and connectivity. The city itself is crossedby the Sava, Danube and Drava Rivers.15
12 Information largely based on the Statute of the County. (Accessed: 8 September 2015).13 Hrvatska stranka prava dr. Ante Starčević (Croatian Party of Rights dr. Ante Starčević ).14 Main source of data are several publications of the Croatian Bureau of Statistics (2015).15 It should be noted that the City of Zagreb is surrounded by Zagreb County (see Figure 2, territorial entity
marked as "I."), the administrative seat of which is in Zagreb.
Policy Department B: Structural and Cohesion Policies
18
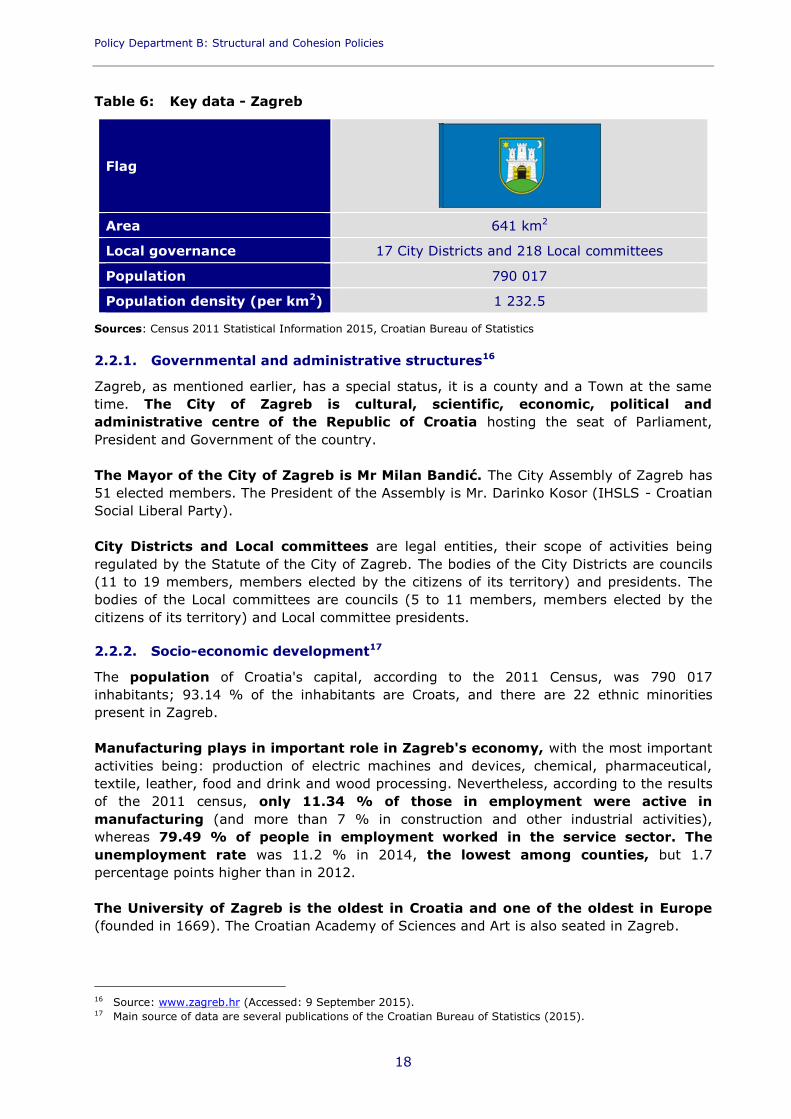
Table 6: Key data - Zagreb
Flag
Area 641 km2
Local governance 17 City Districts and 218 Local committees
Population 790 017
Population density (per km2) 1 232.5
Sources: Census 2011 Statistical Information 2015, Croatian Bureau of Statistics
2.2.1. Governmental and administrative structures16
Zagreb, as mentioned earlier, has a special status, it is a county and a Town at the sametime. The City of Zagreb is cultural, scientific, economic, political andadministrative centre of the Republic of Croatia hosting the seat of Parliament,President and Government of the country.
The Mayor of the City of Zagreb is Mr Milan Bandić. The City Assembly of Zagreb has51 elected members. The President of the Assembly is Mr. Darinko Kosor (IHSLS - CroatianSocial Liberal Party).
City Districts and Local committees are legal entities, their scope of activities beingregulated by the Statute of the City of Zagreb. The bodies of the City Districts are councils(11 to 19 members, members elected by the citizens of its territory) and presidents. Thebodies of the Local committees are councils (5 to 11 members, members elected by thecitizens of its territory) and Local committee presidents.
2.2.2. Socio-economic development17
The population of Croatia's capital, according to the 2011 Census, was 790 017inhabitants; 93.14 % of the inhabitants are Croats, and there are 22 ethnic minoritiespresent in Zagreb.
Manufacturing plays in important role in Zagreb's economy, with the most importantactivities being: production of electric machines and devices, chemical, pharmaceutical,textile, leather, food and drink and wood processing. Nevertheless, according to the resultsof the 2011 census, only 11.34 % of those in employment were active inmanufacturing (and more than 7 % in construction and other industrial activities),whereas 79.49 % of people in employment worked in the service sector. Theunemployment rate was 11.2 % in 2014, the lowest among counties, but 1.7percentage points higher than in 2012.
The University of Zagreb is the oldest in Croatia and one of the oldest in Europe(founded in 1669). The Croatian Academy of Sciences and Art is also seated in Zagreb.
16 Source: www.zagreb.hr (Accessed: 9 September 2015).17 Main source of data are several publications of the Croatian Bureau of Statistics (2015).

Economic, Social and Territorial Situation in Croatia
19
There is a concentration of economic activity and a big disparity between the levelof development in Zagreb, compared to other parts of the country. Zagreb is therichest city in Croatia, contributing by 33 % to the total GDP of the country, and havingthe highest GDP per capita of 137 320.7 kuna (EUR 18 131.6) compared to theCroatian average of 77 464.6 kuna (10 228.3 EUR).18 The average monthly paid off netearnings in Croatia is 5 507 kuna (2013) whereas in the City of Zagreb it reaches 6 437kuna. 2015 data of the Croatian Bureau of statistics shows that 32.2 % of the totalnumber of business entities was located in the City of Zagreb.
18 2013, Croatian Bureau of Statistics.

Policy Department B: Structural and Cohesion Policies
20
Economic, Social and Territorial Situation in Croatia
21
3. EU COHESION POLICY IN CROATIA
3.1. Pre accessionBefore joining the EU, Croatia had access to several sources of support: CommunityAssistance for Reconstruction, Development and Stabilisation (CARDS), Poland andHungary: Aid for Restructuring of the Economies (PHARE), Instrument for StructuralPolicies for Pre-Accession (ISPA) and the Instrument for Pre-Accession Assistance (IPA).Non EU sources were also made available, including those of the World Bank, and theWestern Balkan Investment Framework19.
During the 2007 to 2013 period, countries benefiting from the IPA had to focus on fivecomponents that were matching future cohesion policy instruments and themes. Countrieshad to set up implementing structures, such as audit authorities, which was to allow forgaining experience in programme management. In this period the key challenges Croatiawas facing were the high turnover of staff dealing with programme management, and thehandling of public procurement procedures. An EP study on administrative capacities20 inMember States found that upon accession, when Croatia became eligible for supportfrom cohesion policy funds, and was no more eligible for pre-accession support, thenecessary adaptation to differences in implementation systems (structure, financialmanagement, terminology, monitoring and evaluation, etc.) required considerable effortfrom Croatian authorities and proved to be challenging.
Nevertheless, regional and local stakeholders using IPA resources also had the possibility toacquire experience while implementing new type of projects in the fields of transport(railway infrastructure, inland waterways), environment (waste and water management),business and research & development, etc.
3.2. 2007-2013 period (The period from 1 July 2013 to 31December 2013)
As explained in the above mentioned EP study, the accession date of 1 July 2013 created aunique situation for Croatia: only six months were left till the end of the 2007-2013period, and it was not feasible to create programmes under 2007-2013 cohesion policyrules for such a short period of time.
The solution was that a provision was made within the 2013 budget to create convergencefunds for Croatia to deal with the transfer from IPA to Cohesion policy funding. Some of theIPA Operational Programmes that were running at the time of Croatia’s accession (such asthe OP Transport) were turned into Convergence programmes that were to be funded fromthese allocations but to be run under the applicable rules of the 2007-2013 funding period.
These allocations amounted to around €449.4 million for Sustainable Growth, of which€299.6 million were to be funded from Structural Funds and €149.8 million from theCohesion Fund. (...)This means, in effect, that for the period leading up to 2016 the Croatian authorities willhave to run structures and programmes for:
19 This Framework supports socio-economic development and EU accession. It is a joint initiative of the EU,International Financial institutions, bilateral donors and the governments of the Western Balkans.
20 European Parliament (2014).

Policy Department B: Structural and Cohesion Policies
22
• IPA – mainly the larger programmes and projects financed under IPA and subject toIPA rules of implementation and financing;
• The Convergence OPs running under the 2007-2013 rules managed by the ManagingAuthorities that are not designated as such for the 2014-2020 period under the draftPA for the 2014-2020 funding period;
• The 2014-2020 period itself, with any specific changes in the rules from the 2007-2013funding period now in force within a new organisational set-up (described below) andslightly different lines of communications and responsibilities;
• The responsibilities for closing the IPA and Convergence programmes during the 2014-2020 operational period.
Source: European Parliament study on Implementation of Cohesion policy 2014-2020: Preparations andadministrative capacity of Member States (2014).
This transition period clearly meant additional pressure on staff dealing withprogramme management in the different authorities, additional audit and monitoringefforts and increased intensity of reporting tasks as progress is made parallel in differentstructures.
3.3. 2014-2020 periodThe Croatian Partnership Agreement (PA) was adopted on 30 October 2014; itcovers all 5 ESI Funds, and provides a framework for investments under all 11 thematicobjectives (TOs) defined in the Common Provisions Regulation (CPR, Article 9)21. Thefollowing priorities are defined in the PA:
• Promoting innovation friendly business environment and developing a competitiveand innovation-driven economy by stimulating the entrepreneurship, the research-development and innovation, as well as the e-economy,
• Developing infrastructure for economic growth and employment, in particular keynetworks (TEN-T) and sustainable urban transport,
• Supporting a low-carbon and green economy, by encouraging a sustainable andefficient use of natural resources, promoting the energy efficiency, as well as theadaptation to climate change,
• Developing human capital growth and tackling the mismatch of the labour skills byreforming the education curricula, developing the vocational education and trainingand the self-employment,
• Promoting social inclusion and reducing the risk of poverty by developing the socialservices, tackling the different forms of discrimination, and ensuring the shift frominstitutional to community-based services,
• Improving the healthcare services in an effective and cost-efficient way,
• Building a modern and professional public administration, developing the socialdialogue and ensuring the efficiency and impartiality of the judiciary.
21 Regulation (EU) No 1303/2013 of the European Parliament and of the Council of 17 December 2013 layingdown common provisions on the European Regional Development Fund, the European Social Fund, theCohesion Fund, the European Agricultural Fund for Rural Development and the European Maritime andFisheries Fund and laying down general provisions on the European Regional Development Fund, the EuropeanSocial Fund, the Cohesion Fund and the European Maritime and Fisheries Fund and repealing CouncilRegulation (EC) No 1083/2006, OJEU L 347. p. 320.
Economic, Social and Territorial Situation in Croatia
23
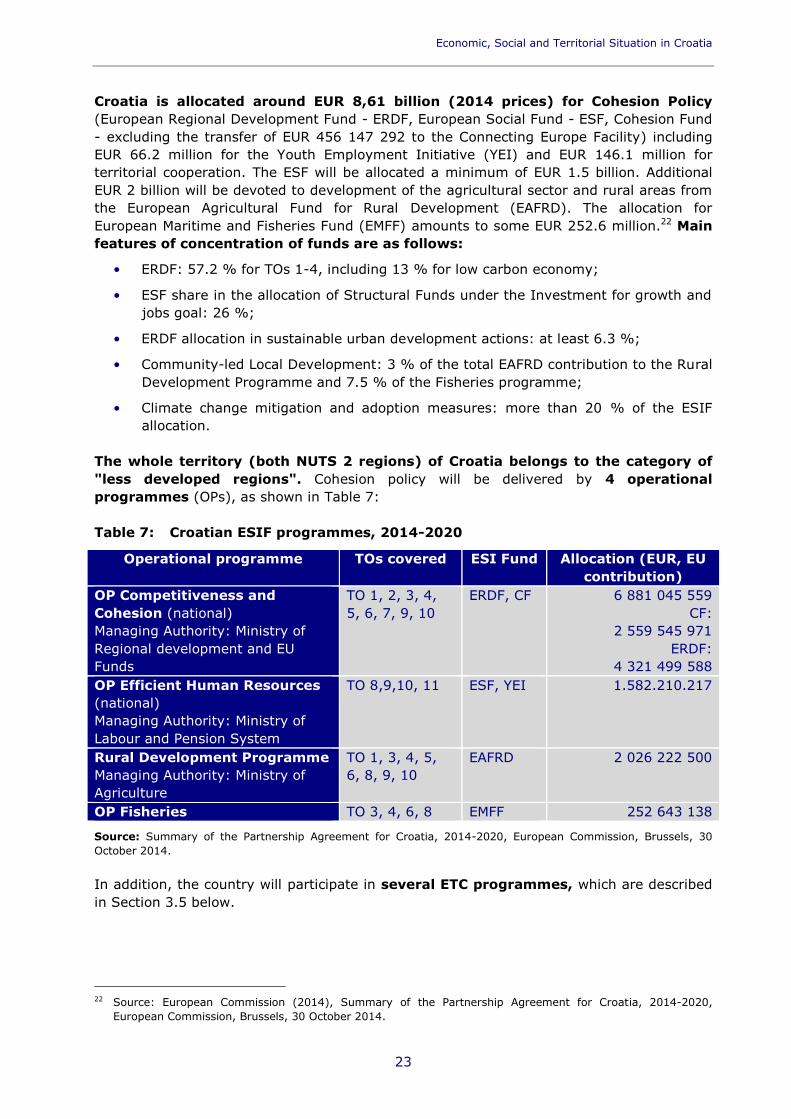
Croatia is allocated around EUR 8,61 billion (2014 prices) for Cohesion Policy(European Regional Development Fund - ERDF, European Social Fund - ESF, Cohesion Fund- excluding the transfer of EUR 456 147 292 to the Connecting Europe Facility) includingEUR 66.2 million for the Youth Employment Initiative (YEI) and EUR 146.1 million forterritorial cooperation. The ESF will be allocated a minimum of EUR 1.5 billion. AdditionalEUR 2 billion will be devoted to development of the agricultural sector and rural areas fromthe European Agricultural Fund for Rural Development (EAFRD). The allocation forEuropean Maritime and Fisheries Fund (EMFF) amounts to some EUR 252.6 million.22 Mainfeatures of concentration of funds are as follows:
• ERDF: 57.2 % for TOs 1-4, including 13 % for low carbon economy;
• ESF share in the allocation of Structural Funds under the Investment for growth andjobs goal: 26 %;
• ERDF allocation in sustainable urban development actions: at least 6.3 %;
• Community-led Local Development: 3 % of the total EAFRD contribution to the RuralDevelopment Programme and 7.5 % of the Fisheries programme;
• Climate change mitigation and adoption measures: more than 20 % of the ESIFallocation.
The whole territory (both NUTS 2 regions) of Croatia belongs to the category of"less developed regions". Cohesion policy will be delivered by 4 operationalprogrammes (OPs), as shown in Table 7:
Table 7: Croatian ESIF programmes, 2014-2020
Operational programme TOs covered ESI Fund Allocation (EUR, EUcontribution)
OP Competitiveness andCohesion (national)Managing Authority: Ministry ofRegional development and EUFunds
TO 1, 2, 3, 4,5, 6, 7, 9, 10
ERDF, CF 6 881 045 559CF:
2 559 545 971ERDF:
4 321 499 588OP Efficient Human Resources(national)Managing Authority: Ministry ofLabour and Pension System
TO 8,9,10, 11 ESF, YEI 1.582.210.217
Rural Development ProgrammeManaging Authority: Ministry ofAgriculture
TO 1, 3, 4, 5,6, 8, 9, 10
EAFRD 2 026 222 500
OP Fisheries TO 3, 4, 6, 8 EMFF 252 643 138
Source: Summary of the Partnership Agreement for Croatia, 2014-2020, European Commission, Brussels, 30October 2014.
In addition, the country will participate in several ETC programmes, which are describedin Section 3.5 below.
22 Source: European Commission (2014), Summary of the Partnership Agreement for Croatia, 2014-2020,European Commission, Brussels, 30 October 2014.
Policy Department B: Structural and Cohesion Policies
24
3.4. EU Cohesion Policy in Šibenik-Knin and Karlovac Countiesand the City of Zagreb - project examples
Karlovac County profited from EU co-financed grants already in the 2007-13 period. Aproject example is the "Freshwater aquarium and museum of rivers - KAquarium" inKarlovac, supported by the ERDF (HRK 36,222,282.45) under the Regional CompetitivenessOperational Programme 2007 – 2013. According to its website, this project is due to becompleted by September 2016, and aims to create an aquarium that "will represent theflora and fauna of Croatian rivers and lakes, geological history, traditional culture andhistory of the basins of the four Karlovac rivers". The project was developed by the City ofKarlovac and the Karlovac County Development Agency - KARLA ltd. Another example isthe (at the time of writing) on-going project aiming at rehabilitation of a high riskhazardous waste "hot spot" (a location with high quantities of waste) next to Karlovac(Lemić Brdo), financed under the Environment OP 2007-13.
In Šibenik-Knin County the ERDF supported the revitalisation of St Michael's fortress inŠibenik (EU funding amounted to EUR 660 million under the Regional Competitiveness OP,2007-13). This project included construction and furnishing of an open-air stage with 1077seats and works on the underground part of the fortress; educational programs were alsoorganised, and equipment purchased to boost the quality of the experience offered tovisitors (e.g. a panoramic telescope). There are several (at the time of writing) on-goingprojects in the county, supported under the Environment OP 2007-13, that aim atimproving water supply and waste water treatment (sewage systems and waste watertreatment plants). Such projects are located in Knin, Drniš and in the agglomeration ofAgglomeration Vodice – Tribunj – Srima.
The City of Zagreb has also made use of cohesion policy resources available for Croatia. Aproject example is the Biosciences Technology Commercialization and IncubationCentre, which is funded under the Regional Competitiveness Operational Programme forthe 2007-2013 programming period (priority “Enhancing the competitiveness of theCroatian economy”):
Biosciences technology centre
On the campus of Zagreb University a Biosciences Technology Commercialization andIncubation Centre (BIOCentre) is being built using a € 14 million investment from theERDF. This centre will provide support to biotechnology and life sciences start-upbusinesses in Croatia. The overall project objective of the BIOcentre is to developtechnology transfer and commercialisation capacities of the higher education institutionsand public research organisations. The Centre, which will have a floor area of 4 500m2, willinclude business and laboratory premises for small high-technology enterprises. A centrallaboratory designed for developing production processes involving bio-products incompliance with good manufacturing practices (GMP) will also be installed.
The project is funded through the priority “Enhancing the competitiveness of the Croatianeconomy” of the Regional Competitiveness Operational Programme for the 2007-2013programming period.Source: European Commission (2014), Cohesion Policy and Croatia, European Commission, March 2014 andInforegio (accessed: 2 May 2016).
Economic, Social and Territorial Situation in Croatia
25
3.5. Territorial cooperation and macro-regional strategies inCroatia - project examples
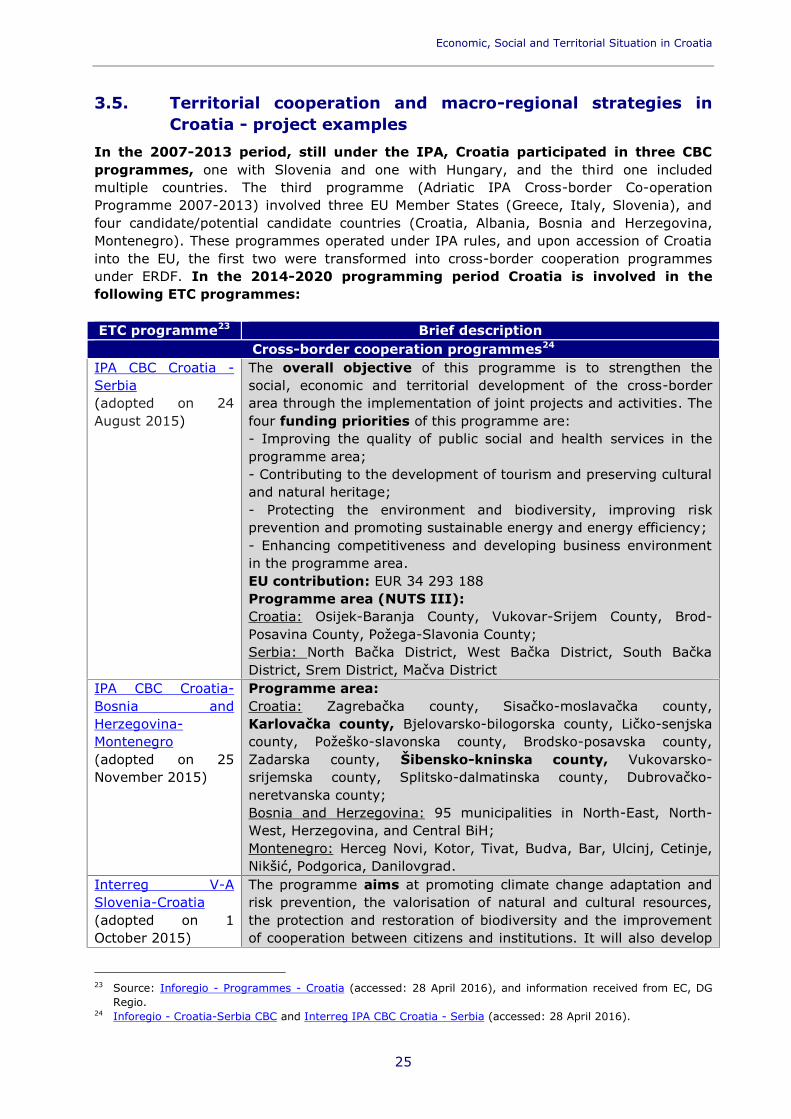
In the 2007-2013 period, still under the IPA, Croatia participated in three CBCprogrammes, one with Slovenia and one with Hungary, and the third one includedmultiple countries. The third programme (Adriatic IPA Cross-border Co-operationProgramme 2007-2013) involved three EU Member States (Greece, Italy, Slovenia), andfour candidate/potential candidate countries (Croatia, Albania, Bosnia and Herzegovina,Montenegro). These programmes operated under IPA rules, and upon accession of Croatiainto the EU, the first two were transformed into cross-border cooperation programmesunder ERDF. In the 2014-2020 programming period Croatia is involved in thefollowing ETC programmes:
ETC programme23 Brief descriptionCross-border cooperation programmes24
IPA CBC Croatia -Serbia(adopted on 24August 2015)
The overall objective of this programme is to strengthen thesocial, economic and territorial development of the cross-borderarea through the implementation of joint projects and activities. Thefour funding priorities of this programme are:- Improving the quality of public social and health services in theprogramme area;- Contributing to the development of tourism and preserving culturaland natural heritage;- Protecting the environment and biodiversity, improving riskprevention and promoting sustainable energy and energy efficiency;- Enhancing competitiveness and developing business environmentin the programme area.EU contribution: EUR 34 293 188Programme area (NUTS III):Croatia: Osijek-Baranja County, Vukovar-Srijem County, Brod-Posavina County, Požega-Slavonia County;Serbia: North Bačka District, West Bačka District, South BačkaDistrict, Srem District, Mačva District
IPA CBC Croatia-Bosnia andHerzegovina-Montenegro(adopted on 25November 2015)
Programme area:Croatia: Zagrebačka county, Sisačko-moslavačka county,Karlovačka county, Bjelovarsko-bilogorska county, Ličko-senjskacounty, Požeško-slavonska county, Brodsko-posavska county,Zadarska county, Šibensko-kninska county, Vukovarsko-srijemska county, Splitsko-dalmatinska county, Dubrovačko-neretvanska county;Bosnia and Herzegovina: 95 municipalities in North-East, North-West, Herzegovina, and Central BiH;Montenegro: Herceg Novi, Kotor, Tivat, Budva, Bar, Ulcinj, Cetinje,Nikšić, Podgorica, Danilovgrad.
Interreg V-ASlovenia-Croatia(adopted on 1October 2015)
The programme aims at promoting climate change adaptation andrisk prevention, the valorisation of natural and cultural resources,the protection and restoration of biodiversity and the improvementof cooperation between citizens and institutions. It will also develop
23 Source: Inforegio - Programmes - Croatia (accessed: 28 April 2016), and information received from EC, DGRegio.
24 Inforegio - Croatia-Serbia CBC and Interreg IPA CBC Croatia - Serbia (accessed: 28 April 2016).
Policy Department B: Structural and Cohesion Policies
26
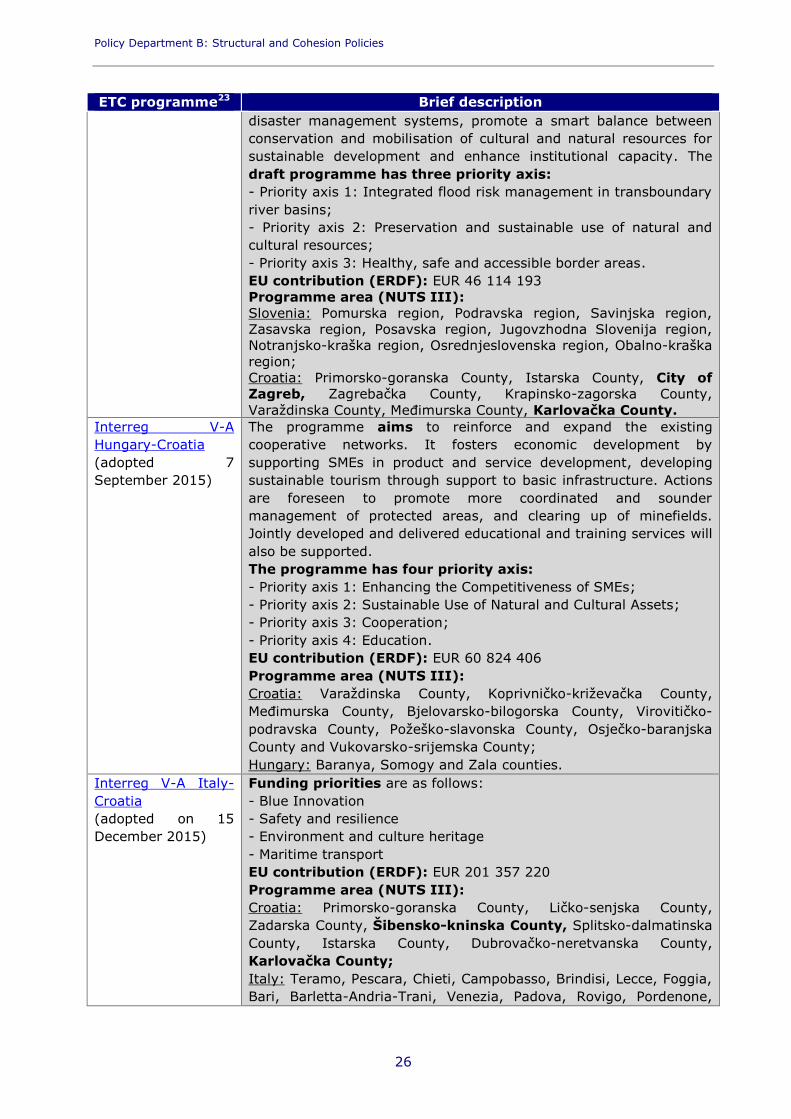
ETC programme23 Brief descriptiondisaster management systems, promote a smart balance betweenconservation and mobilisation of cultural and natural resources forsustainable development and enhance institutional capacity. Thedraft programme has three priority axis:- Priority axis 1: Integrated flood risk management in transboundaryriver basins;- Priority axis 2: Preservation and sustainable use of natural andcultural resources;- Priority axis 3: Healthy, safe and accessible border areas.EU contribution (ERDF): EUR 46 114 193Programme area (NUTS III):Slovenia: Pomurska region, Podravska region, Savinjska region,Zasavska region, Posavska region, Jugovzhodna Slovenija region,Notranjsko-kraška region, Osrednjeslovenska region, Obalno-kraškaregion;Croatia: Primorsko-goranska County, Istarska County, City ofZagreb, Zagrebačka County, Krapinsko-zagorska County,Varaždinska County, Međimurska County, Karlovačka County.
Interreg V-AHungary-Croatia(adopted 7September 2015)
The programme aims to reinforce and expand the existingcooperative networks. It fosters economic development bysupporting SMEs in product and service development, developingsustainable tourism through support to basic infrastructure. Actionsare foreseen to promote more coordinated and soundermanagement of protected areas, and clearing up of minefields.Jointly developed and delivered educational and training services willalso be supported.The programme has four priority axis:- Priority axis 1: Enhancing the Competitiveness of SMEs;- Priority axis 2: Sustainable Use of Natural and Cultural Assets;- Priority axis 3: Cooperation;- Priority axis 4: Education.EU contribution (ERDF): EUR 60 824 406Programme area (NUTS III):Croatia: Varaždinska County, Koprivničko-križevačka County,Međimurska County, Bjelovarsko-bilogorska County, Virovitičko-podravska County, Požeško-slavonska County, Osječko-baranjskaCounty and Vukovarsko-srijemska County;Hungary: Baranya, Somogy and Zala counties.
Interreg V-A Italy-Croatia(adopted on 15December 2015)
Funding priorities are as follows:- Blue Innovation- Safety and resilience- Environment and culture heritage- Maritime transportEU contribution (ERDF): EUR 201 357 220Programme area (NUTS III):Croatia: Primorsko-goranska County, Ličko-senjska County,Zadarska County, Šibensko-kninska County, Splitsko-dalmatinskaCounty, Istarska County, Dubrovačko-neretvanska County,Karlovačka County;Italy: Teramo, Pescara, Chieti, Campobasso, Brindisi, Lecce, Foggia,Bari, Barletta-Andria-Trani, Venezia, Padova, Rovigo, Pordenone,

Economic, Social and Territorial Situation in Croatia
27
ETC programme23 Brief descriptionUdine, Gorizia, Trieste, Ferrara, Ravenna, Forlì-Cesena, Rimini,Pesaro e Urbino, Ancona, Macerata.Transnational cooperation programmes
Mediterranean25 The aim is to promote growth in the Mediterranean area byfostering innovative concepts and practices. Sustainable use of(natural and cultural) resources will be encouraged, and support willbe provided to social integration.Total OP budget: EUR 275 905 320EU contribution: EUR 233 678 308
ERDF: EUR 224 322 525IPA: EUR 9 355 783
Programme area: 57 regions divided among 10 EU Member States(Croatia, Cyprus, France, Greece, Italy, Malta, Portugal, Slovenia,Spain, United-Kingdom) and 3 IPA countries (Albania, Bosnia-Herzegovina and Montenegro). In the case of Croatia the entirecountry is eligible.
Danube26 The four funding priorities of this programme are:- Innovative and socially responsible Danube region;- Environment and culture responsible Danube region;- Better connected and energy responsible Danube region;- Well-governed Danube region.It will support policy integration in the area within a range of fieldslinked to the priorities of the EU Strategy for the Danube Region.Total OP budget: EUR 262 989 839EU contribution: EUR 221 924 597
ERDF: EUR 202 095 405IPA: EUR 19 829 192
Programme area: Austria, Bulgaria, Czech Republic, Germany,Croatia, Hungary, Romania, Slovenia, Slovakia.
Central Europe27 The overall objective of the programme is “to cooperate beyondborders to make central European cities and regions better places tolive and work”.Funding priorities are:- Cooperating on innovation to make Central Europe morecompetitive;- Cooperating on low-carbon strategies in Central Europe;- Cooperating on natural and cultural resources for sustainablegrowth in Central Europe;- Cooperating on transport to better connect Central Europe.Total OP budget: EUR 298 987 026EU contribution (ERDF): EUR 246 581 112Programme area: Austria, Croatia, the Czech Republic, Hungary,Poland, Slovakia and Slovenia, as well as parts of Germany andItaly.
25 Mediterranean Programme and Inforegio - Mediterranean Programme (accessed: 31 August 2015).26 Inforegio - Danube programme (accessed: 31 August 2015).27 Inforegio - Central Europe programme and Central Europe programme (accessed: 31 August 2015).

Policy Department B: Structural and Cohesion Policies
28
ETC programme23 Brief descriptionADRION28 (AdriaticIonian Programme2014-2020)
The programme is built around four thematic priority axes:- Innovative and smart region (development of a regional innovationsystem for the Adriatic-Ionian area);- Sustainable region (sustainable valorisation and preservation ofnatural and cultural assets) and (transnationally tackingenvironmental vulnerability, fragmentation and the safeguarding ofecosystem services);- Connected region (integrated transport and mobility services andmultimodality;- Supporting the governance of the EU Strategy for the Adriatic andIonian Region.EU contribution: EUR 83.5 million from the ERDF and EUR 15.7million from IPA II.Programme area: 4 EU Member States (Croatia, Greece, part ofItaly, Slovenia), 4 non-EU countries (Albania, Bosnia andHerzegovina, Montenegro, and Serbia).
There are currently 5 Interregional cooperation programmes (the so called INTERREGVC, succeeding the former INTERREG IVC), and Croatia is participating in all of themalong with the 27 other EU MS29: INTERREG EUROPE, ESPON 2020, INTERACT III, URBACTIII.
Croatia is involved in two macro-regional strategies: the EU Strategy for theDanube Region, and the EU Strategy for the Adriatic Ionian Region. Croatia is partof both strategies with the entirety of its territory and has set up an inter-ministerialworking group for regional cooperation30, which is a forum that discuss the implementationof macro-regional strategies, and related topics such as the European Groupings forTerritorial Cooperation etc. In the context of the Danube Strategy, the themes Croatiafocuses on are: competitiveness and enterprises, environment (biodiversity) and educationand innovation (promoting academic networks and innovation clustering in the region).
A project example in Karlovac County is a water conservation project that aims topreserve and restore small springs that could then be alternative sources of drinking water.Certain village ponds would also be restored, and could become important spots ofbiodiversity. The border area concerned is the Bela Krajina in Slovenia and the ŽumberačkeMountain in Croatia. The project is expected to contribute to cross-border integration ofisolated groups of fauna and flora and to prevent further fragmenting of their populations.
According to its website (www.zagreb.hr) The City of Zagreb is fostering cooperationwith other cities, including capital cities of EU Member States and candidatecountries, etc. with a focus on exchanging experience on urban development, transport,digital issues, using EU resources for development and research. Zagreb holds membershipin several intercity organizations and associations (e.g. The Assembly of the EuropeanRegions – AER, Metropolis, Eurocities, etc.). As regards international presence, Istria wasthe first Croatian County to open a representative office in Brussels, Belgium. The Officewas opened in June 2005 in collaboration with the Italian region of Friuli Venezia Giulia.
28 ADRION - South-East Europe net (accessed: 31 August 2015).29 Inforegio - Interregional cooperation (accessed: 31 August 2015).30 Source: Inforegio (accessed: 31 August 2015).

Economic, Social and Territorial Situation in Croatia
29
REFERENCES
Croatian Bureau of Statistics (2015), Croatia in Figures 2015, Zagreb, 2015.
Croatian Bureau of Statistics (2014) Employment and wages 2014, Statistical report.
Croatian Bureau of Statistics (2015) Statistical information 2015.
Croatian Bureau of Statistics (2015) Number and structure of business entities, bycounties, Situation as on 30 June, 2015.
Croatian Bureau of Statistics (2015) Gross Domestic Product for Republic Of Croatia, NUTS2 level and counties, 2000 – 2012; (ESA 2010), March 2015.
European Parliament (2014), Implementation of Cohesion policy 2014-2020: Preparationsand administrative capacity of Member States, Author: Metis GmbH EPRC GlasgowUniversity, EP, Directorate-General for Internal Policies, September 2014.
European Parliament (2015), Adriatic and Ionian Region: socio-economic analysis andassessment of transport and energy links, EP, Policy Department for Structural andCohesion Policies, December 2015.
European Parliament (2015), Economic, Social and Territorial Situation in Croatia, EP,Policy Department for Structural and Cohesion Policies, October 2015.
European Commission (2014), Summary of the Partnership Agreement for Croatia, 2014-2020, European Commission, Brussels, 30 October 2014.
European Commission (2014), Cohesion Policy and Croatia, European Commission, March2014.
European Commission (2015), Country profile key indicators Hrvatska, EuropeanCommission, Directorate-General for Regional and Urban Policy, Analysis Unit B1, May2015.
European Commission (2015), Country Report Croatia 2015 Including an In-Depth Reviewon the prevention and correction of macroeconomic imbalances, SWD(2015)30 of26.2.2015.
[ONLINE]https://portal.cor.europa.eu/divisionpowers/countries/MembersNLP/Croatia/Pages/default.aspx [Accessed 25 April 2016]
[ONLINE] http://croatia.eu/article.php?lang=2&id=12 [Accessed 25 April 2016]
[ONLINE] http://www.dzs.hr/default_e.htm [Accessed 28 April 2016]
[ONLINE] http://www.worldbank.org/en/country/croatia/overview [Accessed 25 April 2016]
[ONLINE] 2011 Census (Croatian Bureau of Statistics), http://www.dzs.hr/default_e.htm[Accessed 27 July 2016]

Policy Department B: Structural and Cohesion Policies
30
[ONLINE] http://www.europaworld.com/entry/hr [Accessed 16 July 2015]
CIA (2015), The World Factbook: Croatia, [ONLINE] Available at:https://www.cia.gov/library/publications/the-world-factbook/geos/hr.html[Accessed 26 August 2015]
[ONLINE]http://ec.europa.eu/regional_policy/en/atlas/programmes?search=1&keywords=&periodId=3&countryCode=HR®ionId=ALL&objectiveId=ALL&tObjectiveId=ALL[Accessed 28 April 2016]
[ONLINE]http://ec.europa.eu/regional_policy/en/policy/cooperation/european-territorial/interregional/ [Accessed 28 April 2016]
[ONLINE]http://ec.europa.eu/enlargement/candidate-countries/croatia/eu_croatia_relations_en.htm[Accessed 8 September 2015]
[ONLINE]www.investincroatia.hr [Accessed: 26 April 2016]
[ONLINE] http://www.opzo.hr/en/projects [Accessed: 28 April 2016]
[ONLINE] http://www.aquariumkarlovac.com/en/Home [Accessed: 28 April 2016]
[ONLINE]https://vlada.gov.hr/clanovi-vlade/66 [Accessed: 27 April 2016]
[ONLINE]http://www.eurodyssee.eu/ [Accessed: 27 April 2016]
[ONLINE]http://www.podi-sibenik.com/eng/o-zoni.asp [Accessed: 27 April 2016]
[ONLINE]http://www.portauthority-sibenik.hr/en/port_authority/karakteristike.asp[Accessed: 27 April 2016]
[ONLINE]http://svmihovil.sibenik.hr/?stranice=revitalizacija-tvr-ave&id=3&lang=en[Accessed: 29 April 2016]
[ONLINE]http://svmihovil.sibenik.hr/?stranice=revitalizacija-tvr-ave&id=3&lang=en[Accessed: 2 May 2016]