CONSULTING ENGINEERS Geothermal Heating and Cooling Fundamentals
/-
I Project in Development and the Environment
Economic Review of a Geothermal District Heating Project in Podhale, Poland
November 1994
Submitted to: US AIDIENI Submitted by: PRIDE
USAID Contract Number: ANE-0 178-4-00- 1047-00 USAID Project Number: 398-0365
Sponsored by: USAIDIENI Implemented by: Chemonics International and its associates
2000 M Street, NW, Suite 200, Washington, DC 20036 Telephone: (202) 331-1860 Fax: (202) 331-1871
The objective of the Project in Development and the Environment (PRIDE) is to help the U.S. Agency for International Development (AID) design and implement programs that foster the agency's environ- mental and natural resources strategy for sustainable economic growth in the Near East and Eastern Europe.
PRIDE provides AID and participating countries with advisory assistance, training, and information services in four program areas: (1) strategic planning, (2) environmental policy analysis, (3) private sector initiatives, and (4) environmental information, education, communication, and institutional
strengthening.
The project is being implemented by a consortium selected through open competition in 1991.
Chemonics International is the prime contractor; subcontractors include RCGIHagler, Bailly, Inc.; Science Applications International Corporation; Capital Systems Group, Inc.; Environomics, Inc.; Industrial Economics, Inc.; Lincoln University; and Resource Management International, Inc. In addition, AID has entered into a cooperative agreement with the World Environment Center to support implementation of PRIDE.
The opinions expressed in this paper are those of the author(s) and do not necessarily reflect the positions of the sponsoring agency or contractors.
Printed on recycled paper

Economic Review of a Geothermal District Heating Project in Podhale, Poland
By:
Duane T. Kexel, Chief Economist
November 1994
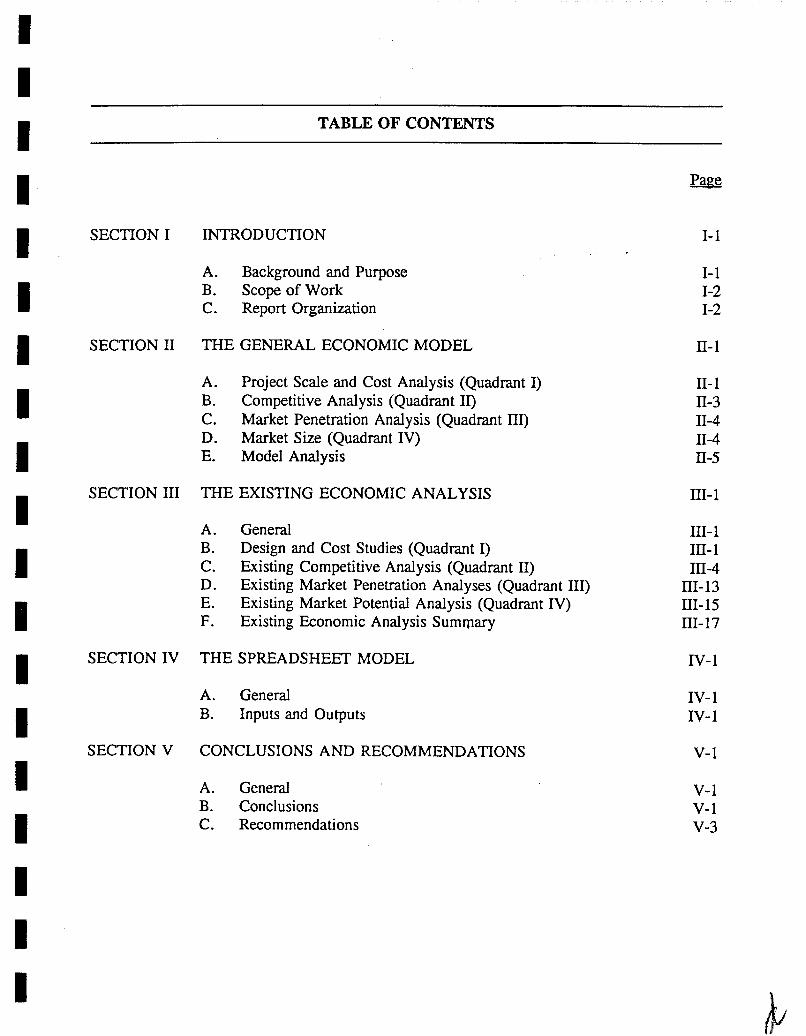
TABLE OF CONTENTS
SECTION I INTRODUCTION I- 1
A. Background and Purpose B. Scope of Work C. Report Organization
SECTION I1 THE GENERAL ECONOMIC MODEL
A. Project Scale and Cost Analysis (Quadrant I) B. Competitive Analysis (Quadrant 11) C. Market Penetration Analysis (Quadrant 111) D. Market Size (Quadrant IV) E. Model Analysis
SECTION I11 THE EXISTING ECONOMIC ANALYSIS
A. General B. Design and Cost Studies (Quadrant I) C. Existing Competitive Analysis (Quadrant 11) D. Existing Market Penetration Analyses (Quadrant 111) E. Existing Market Potential Analysis (Quadrant IV) F. Existing Economic Analysis Summary
SECTION IV THE SPREADSHEET MODEL
A. General B. Inputs and Outputs
SECTION V CONCLUSIONS AND RECOMMENDATIONS
A. General B. Conclusions C. Recommendations
IV- 1
IV- 1 IV- 1
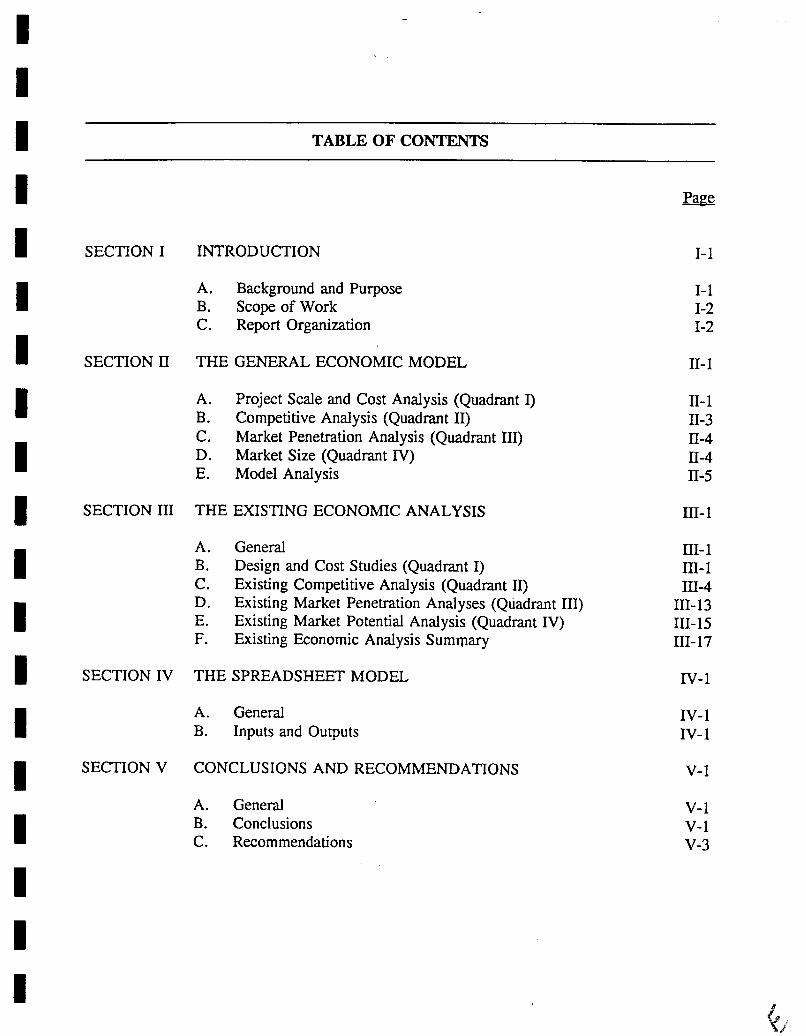
TABLE OF CONTENTS
SECTION I INTRODUCTION
A. Background and Purpose B. Scope of Work C. Report Organization
SECTION I1 THE GENERAL ECONOMIC MODEL
A. Project Scale and Cost Analysis (Quadrant I) B. Competitive Analysis (Quadrant 11) C. Market Penetration Analysis (Quadrant 111) D. Market Size (Quadrant IV) E. Model Analysis
SECTION I11 THE EXISTING ECONOMIC ANALYSIS
A. General B. Design and Cost Studies (Quadrant I) C. Existing Competitive Analysis (Quadrant 11) D. Existing Market Penetration Analyses (Quadrant 111) E. Existing Market Potential Analysis (Quadrant IV) F. Existing Economic Analysis Sumrl1a.y
SECTION IV THE SPREADSHEET MODEL
A. General B. Inputs and Outputs
SECTION V CONCLUSIONS AND RECOMMENDATIONS
A. General B. Conclusions C. Recommendations
Page
IV- 1
IV- 1 IV- 1

SECTION I INTRODUCTION
A. Background and Purpose
The Podhale region of southern Poland has proven geothermal energy potential that could be used to displace coal or other fuels for space and water heating. A project that has been in active formulation by Polish interests and Danish consultants for the past two years would provide geothermal district heating to 10,000-15,000 residential and commercial buildings in nine municipalities over the next five years. The two alternatives summarized in Table 1 are now being considered for implementation:
Two key documents provide the most current summaries of the project formulation studies and economic analyses:
-
Geothermal Potential Review Study concern in^ The Podhale Re~ion - Poland, Houe & Olsen, November 3, 1993.
Poland Geothermal Pro-iects Identification Report, , October 17, 1994.
Table 1 - Podhale Alternative Project Summaries
The World Bank and the United States Agency for International Development (USAID) are both considering funding for the initial phase of the Podhale project, which
Well-Pairs Gas Peaking Plant (MW) District Heat Pipeline (KM) Pressure Reduction Plants Costs ($000)
Generation, Transmission Distribution Conversion TOTAL
Buildings/Towns TJ/Y ear (GrossINet) Delivered Cost ($/GJ)
Alternative A
6 70 5.6 3
42,022 22,900 18,100
$83,022
9,90019 1,30511,185
9.02
Alternative B
10 120 5.6 4
62,714 3 1,600 24.400
$118,714
15,0001 10 2,23712,017
7.88

Podhale Geothermale Economic Review Report PRIDE
would provide geothermal heating for the Central Valley. The purpose of this study is to provide an objective assessment of the economics of the project to determine:
Whether the project appears economically attractive based on data available from the above studies and on World Bank standards for economic evaluation.
Areas where additional data or project restrictions could reduce the risks of proceeding with the project.
B. Scope of Work
The specific scope of work for this review includes the following tasks:
Review existing studies provided by the World Bank.
Evaluate the economic benefits of converting to geothermal energy compared to other available options.
Assess required market penetrations and average costs for the project to breakeven.
Evaluate, from available data, the market penetrations that are probable with and without incentives.
Assess existing data to determine the cost to the consumer and the consumer's ability to pay.
Develop a spreadsheet model that identifies the most critical economic variables and allows for sensitivity analyses.
The deliverables include the spreadsheet model and a brief report of findings.
C. Report Organization
The remainder of this report is comprised of four major sections. The first develops a generalized economic model of the Podhale geothermal project as a framework for discussion of the significant issues in the evaluation. Given that background, the next section summarizes the currently available analyses with emphasis on specific concerns and major uncertainties. A simplified spreadsheet model is then presented, which allows sensitivity testing of the primary linkages in the economic analysis. The final section provides conclusions that can reasonably be drawn from the currently available data and recommendations for areas of increased analytic emphasis as project development proceeds.

SECTION I1
THE GENERAL ECONOMIC MODEL

SECTION II THE GENERAL ECONOMIC MODEL
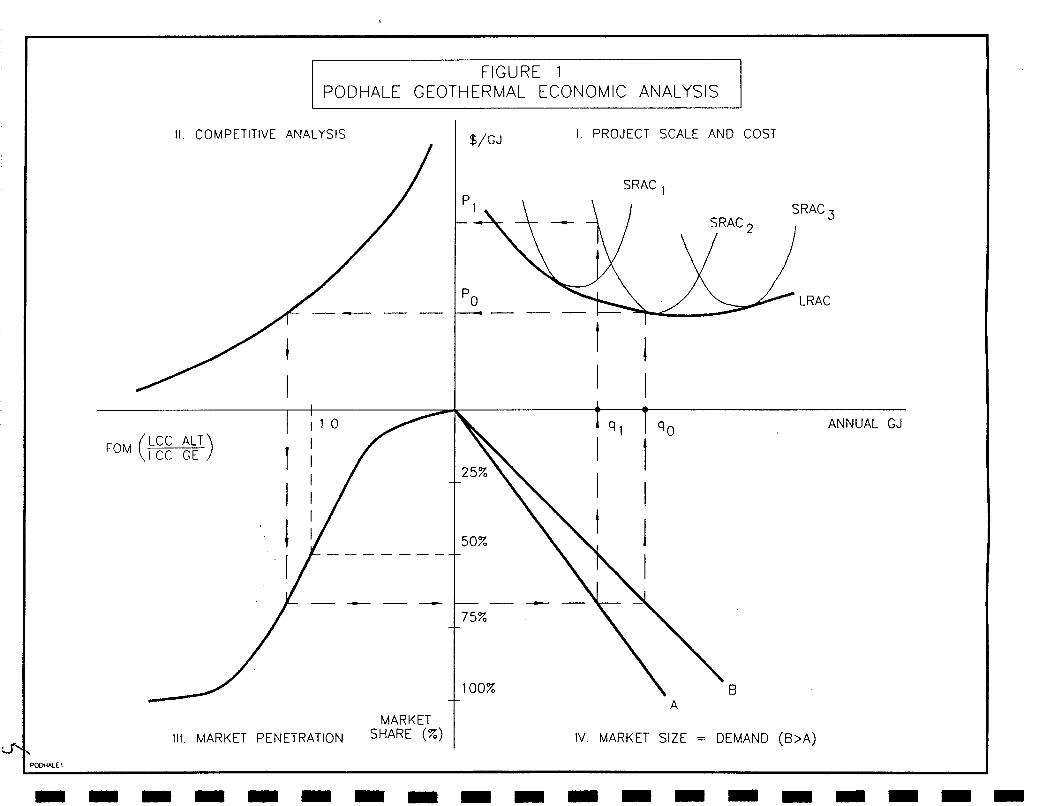
The Podhale geothermal project is similar in concept and motivation to a World Bank project now being finalized in Slovenia. The Bank is establishing an Air Pollution Abatement Fund to stimulate conversions of iidividual households and residential and commercial boiler houses from polluting fuels to natural gas in Maribor, Slovenia. The economic analysis of the Podhale project for the World Bank will parallel the Slovenian evaluation. The general model is presented in Figure 1 as four interrelated quadrants.
A. Project Scale and Cost Analysis (Quadrant I)
Quadrant I is a standard set of cost curves that portray the alternative project sizes and the short-run average cost curves that correspond to three hypothetical project scales. In the Podhale case, two project alternatives have been costed that would generally correspond to SRAC, and SRAC, in Figure 1. The difference is whether or not Nowy Targ is served by the project. Assuming additional alternatives could be defined and costed, the long-run average cost curve would approach a smooth envelope of short-run relationships as shown by LRAC. The LRAC shows the price that must be charged for the project to break even for each possible plant size and level of operation.
For illustrative purposes, we can assume that the project represented by SRAC, is chosen with the expectation that Q, will be the annual heat provided to consumers at price P,. (Actual production will have to exceed Q, by the amount of distribution losses, but this refinement is ignored to simplify the diagrams).
The specific focus of the Quadrant I analysis is on the following questions:
1. What range of project sizes is technically feasible?
2. What are the variable and fixed costs associated with each possible scale of plant? These costs define the revenue requirement for the project to break even.
3. It should be noted that each alternative identified in this analysis represents a design that is assumed to be technically reliable and optimal. Reliable in this instance means that it will produce the outputs indicated with acceptable certainty and includes sufficient backup to cover outages or uncertain yields. Optimal means that each plant scale represents the least-cost method of using this technology over the range of outputs considered for that plant.

Section 11: The General Economic Model PRIDE
B. Competitive Analysis (Quadrant II)
In Quadrant 11, Po is taken as given and life-cycle cost comparisons are constructed for all households, boiler houses, and commercial buildings that would potentially be served by the geothermal district heating system. Figures of merit (FOMs) for geothermal are calculated as the ratios of life-cycle heating costs using alternate fuels to the life-cycle costs of using the geothermal system. An FOM of 1.2, for example, would indicate that the present worth of life-cycle costs for the alternative was 20.0 percent above the life-cycle costs of geothermal.
In practice there are numerous curves in Quadrant I1 corresponding to distinct potential conversion groups with various existing heating fuels, and ages and efficiencies of existing heating systems. Nothing essential is lost by the simplified single-curve representation. In fact, this properly represents the two alternative schemes examined by Houe & Olsen. In those alternatives, all the consumers who would be served by the geothermal district heating system are served by a gas-fired district heat system or by individual gas-heating systems served by a gas distribution network that displaces the district heat distribution system. The decision is centralized on an "all or nothing" basis. This is a dramatic simplification that may or may not be realistic. If individual household and boiler house choices among fuels such as coal, gas-oil, fuel oil or bottled gas are allowed, the analysis must be more detailed but no different in concept.
It should be noted that all of the comparisons necessary for the economic benefit-cost analysis are developed in the calculations of the FOMs. Assuming heating demand is perfectly inelastic, the economic analysis of the project will amount to a comparison of the following costs:
Geothermal Alternative Systems
Plant Investment Supply System Investment If Any Distribution System Investment District Heating Conversion Costs For Customers Gas Network Gas Costs Operating Costs For Existing Systems Electric Costs Fuel District Heating O&M O&M Customer O&M Replacement Costs For Existing Systems
Conversion Costs For Alternative Systems
All of these elements are also required to calculate the FOMs in Quadrant 11. Refinements of the economic model would be appropriate if demand elasticity is recognized and if environmental impacts vary across the alternatives considered. These refinements are not addressed in this review. Although the economic analysis and competitive analysis are conceptually similar, they may use different pricing and discounting assumptions. In practice, the competitive analysis is a financial rather than an economic comparison.
The issues of primary concern in the competitive analysis of Quadrant I1 are:

Podhale Geothermal Economic Review Report PRIDE
1. Who will decide whether or not to use the geothermal district heating system? Will it be a centralized choice made by municipalities or district heating systems on behalf of their constituents/customers? Or will it be a collection of individual household and small boiler house decisions?
2. What range of options are available to the decision-makers?
3. What are the relative life cycle costs of the available options? Determination of these costs depends on estimates of:
Alternative system fuel costs A1 ternative system replacement costs Alternative system service life Alternative system age Alternative system efficiencies
C. Market Penetration Analysis (Quadrant 111)
Simple economic models assume perfect information, instantaneous adjustment, and a singular focus on relative prices as the determinant of technology that will dominate the market. Market penetration models soften these assumptions and recognize that adoption of a new technology will be subject to substantial inertia, imperfect information, and non-price dimensions of competition. Thus it is reasonable to assume that an FOM of 1.2, for example, might only lead to a seventy-five percent market share. Likewise, a twenty percent price disadvantage would still be likely to attract some adoptions based on convenience or environmental preferences.
Quadrant I11 shows a logistic curve that is commonly used to forecast adoptions of new technologies. Typically it is assumed that market share will be 50 percent at an FOM of 1 .a. Location of other points on the curve can be established through carefully designed market surveys. Willingness to convert is established from survey responses and individual FOMs are calculated from survey data that determine the specific life-cycle costs for the existing versus the geothermal heating system.
It should be emphasized that the general shape of the curve in Quadrant I11 and a few points are standard. Actual location of the curve is not, however, a statistical analysis of solid data. A review of responses to several survey questions and qualified judgment are essential to specifying this relationship.
D. Market Size (Quadrant IV)
To convert the market share derived in Quadrant I11 to the demand for project output, the total heating load at issue must be identified. This normally involves the following steps:
Identify specific areas of the interested municipalities that could reasonably be served by a geothermal district heating system. This would typically be done using density criteria and by excluding areas already served or planned to be served by a natural gas network.

Section I!: The General Economic Model PRIDE
For the potential service areas, establish the number of households, boiler houses and district heating systems currently serving that area. Census data and boiler house inventories usually provide the necessary input.
Based on survey data, sales data from existing fuel suppliers, boiler house inventories and district heating system records, estimate the existing fuel use per unit for space and water heating. Per unit values are then used to estimate the total use of existing fuels for space and water heating. '
Adjust the existing fuel use for any difference in efficiencies between the present source and the proposed geothermal project.
Add losses to get the gross demand for output produced by the proposed project.
Two different market sizes are illustrated in Figure 1. Applied to the Podhale project as analyzed by Houe and Olsen, the difference between A and B is whether or not service to Nowy Targ is included. Presumably finer market segmentation could be considered with the basic unit of production being a doublet of wells. Project phasing could be important in achieving early penetrations sufficient to cover the needed investments.
E. Model Analysis
The use of the model to evaluate a project is easily tracked in Figure 1. Assume the mid-size plant is built with an expected output price (Po). The competitive analysis indicates that this would supply heat at a life-cycle cost of about 83 percent (1.0/1.2) of the cost from alternative sources. At this FOM, Quadrant 111 shows we could anticipate a market share of about 70.0 percent. If the market size is B (Nowy Targ is in) the choice of plant size was appropriate and equilibrium would be achieved with geothermal supplying Qo GJ at a price Po. If, however, market size turns out to be A, the quantity demanded would be just Q, and plant per unit revenue requirement would increase to P,. The choices then become:
1. The geothermal enterprise could supply Q, and take a loss equal to (P, - Po) x Q, in the hope that the market will soon grow to B, which will allow them to break even.
2. The government could cover the losses of the geothermal plant through a subsidy justified by the environmental benefits of geothermal heating.
3. The government could increase pollution taxes, which would shift the Quadrant I1 curve to the left. Then a price of Po would yield a higher FOM, which would increase the geothermal market share. Given a sufficient increase, the effective demand could be Qo even with market size A, and equilibrium would again be established at Po and Qo.
The important point to note is that in the situation illustrated for market size A, the economic plant size is smaller than plant 2. Losses would be considerably smaller if plant size 1 had been selected. Break even (including competitive returns on invested capital) could be achieved for a plant size between 1 and 2 in the hypothetical case illustrated.

SECTION m
THE EXISTING ECONOMIC ANALYSIS

SECTION m THE EXISTING ECONOMIC ANALYSIS
A. General
The studies reviewed for this report provide an abbreviated application of the economic model described above. This section summarizes the existing analyses within the context of the general model. Three types of comments are offered:
Requests for clarification of design concepts and assumptions used in formulating and evaluating the projects as now proposed.
Comparison of certain key parameters with data available from our Slovenia studies. Identification of additional areas of investigation that would appear relevant but have not been included in the reports now available.
B. Design and Cost Studies (Quadrant T)
The Project Identification' Report (PIR) provides reasonably detailed analyses of the costs of two sizes of geothermal district heating projects. Table 2 summarizes PIR results following the format of the general model. In contrast to the PIR, Table 2 separates costs into those paid by the geothermal generation and transmission (G&T) organization; those paid by the district heat distribution organization; and those paid by the consumer. The split of costs between the G&T and distributor will allow recognition of potentially different financing terms for production and transmission plant compared to the distribution network. It also provides an indication of the price that the G&T might charge existing district heating systems, such as Tatry in Zakopane, where the distribution network is already in place. The cost separation is also advisable since it appears that cost estimates for G&T plant are more detailed at this stage than the allowances for distribution investments and for the conversion and connection costs that would be paid by the consumers. The general model cost analysis (Quadrant I) mirrors a market structure in which the G&T sells to a distributor who sells to the end-user. Although the G&T function and the distribution function may be combined in one company, the analytic separation provides useful information. Clearly, the investment costs bome by the consumer should be treated separately unless the geothermal company intends to pay for all connections and in-home conversions with a recapture of revenues through the rates charged. The general model focuses on the consumer decision in the competitive analysis in Quadrant 11.
The key findings in Table 2 are:
1. The final cost to the consumer of geothermal district heat would be $7.64 per GJ for the smaller project and $6.75 per GJ for the larger project, assuming sales of 1,185 TJ per year and 2,017 TJ per year respectively.

TABLE 2
Dlstr~butlon Losses Gross Heat Demand @ Plant Sold To [hstrlbutor Sold To Custorrner
Plant Investmenu Foted Costs GBT Geothermal Plantrrrans (SOOO) H - 0 15 ($000) H-0 15
D~stributor D~slnbut~on Pipes ($000) H-0 15 ($000) H-0 15 Customer ConversionSfConnect~ons
GBT CapRal Recovery Faclor
(S000) Calc GBT Electnc MwnfrJ Oul Mwh Calc
$1 86 Allocated By Plant $94 Allocated By Plant
slrJOul 1-1 (S000) Cak SrrJ Out 1-1 ($000) Calc $744 Allocated By Plant Distributor Maintenance ($000) Calc S230 Allocated By Plant ($000) CslC $375 Allocated By Plant
GBT Personnel 121 S10,M)O) ($000) Calc $78 Allocated By Plant 12 1 $10,000] ($000) Calc $80 Allocated By Plant $40 Allocated By Plant
USD/TJ Out (-1 USDlrJ Out -1
GBT Fmed CosWear G&T Variable CosVYear GBT TotaVCosWear
Price To Distributor SlGJ $5.02 Distributor Purchase Costs ($000) $6.304 Distributor Fixed CosWear ($000) $2.427 Distributor Variable CosWear ($000) $330 Distr~butor TotaVCosWear ($000) $9.062
Price To Consumer SlGJ S7 64

Section l k The Existing Economic Analysis PRIDE
2. Well over 70 percent of the costs for each project are fixed, which means that the price will be very sensitive to the terms on which the projects are financed and to the actual sales that materialize.
3. The available cost studies do not show what would happen to costs if loads exceed the assumed level. Lower loads can, however, be readily costed. If loads fall 10 percent short of assumed levels, the prices would rise to $8.30 per GJ (8.5 percent) or to $7.30 per GJ (8.0 percent).
4. It should be noted that the results in Table 2 do not compare directly with results in Tables 21 and 22 of the PIR since we have excluded the consumer investments at this point. Results in our analysis show somewhat higher costs for geothermal than the PIR. The differences arise in the fixed costs paid by the distributor. We have assumed those investments are financed on the same terms as the geothermal plant investment.
Questions regarding the geothermal project design and costs include:
1. What is the provision for backup in case of system failure due to leakage or irregular yield from the wells? Can leaks be isolated so heat can be maintained for the rest of the system? Can the gas peaking plant adequately provide reserves for temporary low yields from the wells? Has the peaking plant size been optimized to reflect the uncertainty associated with well yields?
2. Can the geothermal system accommodate future growth in and around the areas served? If not, does the proposed geothermal system prohibit economic construction of a gas network that could serve future growth?
3. What is the basis for the cost estimates for the distribution network? Note that distribution fixed costs account for about 25.0 percent of the total cost to the customer.
4. Is the 95.0 percent efficiency assumed for the gas peaking plant realistic? Why are gas costs estimated at $5.25 per GJ for the pealung plant compared to the price of $8.17 per GJ shown in Table 12 of the PIR? Are these differences in tariffs by class? What rate would the gas utility charge a large user for on-peak usage? What is the true economic cost of gas on-peak? Note that gas costs account for 10.0 to 12.0 percent of total cost to the consumer.
5. What capacity would the proposed projects have to serve loads greater than the design assumptions? How would higher loads impact production costs for a given plant size?
6. How were the two project alternatives of 6 well doublets and 10 well doublets selected for analysis? The available information indicates sharply decreasing costs per unit as demand for output from a given plant increases because fixed costs are so large relative to variable costs. This suggests much lower risk from a project that is too small than from one that is too large. Are there other plant sizes that

Podhale Geothermale Economic Review Report PRIDE
are reasonable to consider? Has phased construction been seriously evaluated as a way to keep expenditures compatible with the confirmation of market size and penetration?
C. Existing Competitive Analysis (Quadrant II)
The general model requires full life-cycle comparisons of the proposed heating system versus all reasonable alternatives from the perspective of all decision-makers who will select '
their preferred systems over the next 10-15 years. The adequacy of the analysis depends centrally on:
1. The clear identification of who will make the choices. Will the relevant decisions be made by individual households; by municipal authorities; by existing district heating companies; and/or by individual commercial buildings?
2. Whether or not all realistic options have been explored for each group of decision makers.
3. The accuracy of the inputs used in the comparative cost analyses.
The existing analyses can be evaluated in relation to these three areas.
C1. Alternatives Considered
The competitive analyses in the reviewed studies are limited to comparison of a geothermal district heating with:
A. A gas-fired district heating system presumably covering the same area as the geothermal option. Table 17 of the PIR shows the costs for this option excluding Nowy Targ.
B. A gas distribution network with individual gas heating systems. The role played by existing district heat systems in Zakopane (Tatry) and Nowy Targ in this option is not specified.
The potential end-users of the geothermal heat are apparently:
Number GJ/Year GJ/BIdg.
Buildings in Nine Small Towns 4,538 672,616 148 Tatry District Heating System in Zakopane 894 173,752 194 Separately Heated Buildings in Zakopane 4.468 879.228 - 197
SUBTOTAL Project w/o Nowy Targ 9,900 1,725,596 174
Boiler Houses in Nowy Targ
TOTAL 15,000 3,111,596 207

Section Ill: The Existing Economic Analysis PRIDE
C2. Decision Makers
Thus, the relevant decision-makers for the options considered would be:
Oprion A: Municipal authorities in nine small towns who would decide whether to construct a district heating system to serve some portion of the 4,538 buildings at issue and whether to supply that system with gas or geothermal-gas heat.
The Tatry district heating company that would choose whether to purchase heat from the new transmission grid fired by gas or geothermal.
Municipal authorities in Zakopane who would choose whether to serve 4,468 buildings with a district heating system and which heat source should supply that system.
Municipal authorities in Nowy Targ who would make similar choices to those in Zakopane.
Oprion B: In this instance the individually heated buildings in all locations would separately choose between the geothermal district heating option and the range of stand-alone heating alternatives available to them.
The Tatry district heating system in Zakopane would fact the same decision as in Option A Except the specified fuel would be geothermal.
The individual boiler houses in Nowy Targ would also be allowed separable choices.
Theoretically, the municipal authorities in Option A would act on behalf of their constituencies with benefit of economic comparisons similar to those made by individuals in Option B. In practice, however, the penetrations and pace of conversions are likely to vary widely between these two approaches. In a democratic collective choice framework, 51 percent of the constituents could bind 100 percent of potential conversions. In an atomistic competitive model, 51 percent could bind no more than 51 percent of potential conversions. Regardless of the political setting, the basis of proper economic analysis remains at the individual household and boiler house level.
In summary, the existing studies have provided a fairly clear inventory of the potential conversions and have identified the decision-making entities that are relevant for each option considered.
C3. Options Evaluated
The second issue in the competitive analysis is the sufficiency of the range of options explored for each decision-making group. This area is our single biggest concern with the studies that have been conducted to date. It is not clear, for example, why no consideration
Podhale Geothermale Economic Review Report PRIDE
has been given to economic comparisons of home heating, district heating, or boiler house use of:
Domestic coal, which is evidently the prevailing fuel in all applications Cleaner imported coal Gas-oil Fuel oil LP Gas
The fact that most of these fuels are not indigenous to Poland does not preclude their possible economic attraction. Limiting the competitive analysis to capital-intensive systems such as those that require a common district heating network or an expensive gas distribution network seems quite restrictive. Our Slovenian studies showed oil-based systems to be very competitive with gas. LP gas systems may also be competitive in areas where the gas distribution network is not yet complete. Any projection of market penetration should give serious attention to the current cost of home heating relative to the proposed cost if the project is built. This would require a comparison with coal even though this may not be environmentally acceptable. While comparisons with these fuels are outside the scope of this study, consideration should be given to these options as project formulation proceeds.
C4. Data Validation
The final issue in the competitive analysis relates to the verification of the data used in the comparisons that have been made. We cannot in this review independently assess the cost estimates that have been developed for capital investments or the prices that have been used for gas or electricity. We have, however, compared some key parameters with Slovenian data to provide general benchmarking. The results are provided in Table 3. The economic analysis in the PIR develops the total annual cost of heating a 500 cubic meter house as the sum of:
Fuel Costs = 133.3 GJ x $5.10 = $ 681 Maintenance Cost = .02 X $3,000 = 60 Amortized Conversion (10 years, 10 percent) = 488
TOTAL
In that analysis there is no explicit treatment of the investment required to construct the gas distribution system. The assumption must be that the $3,000 conversion cost includes the in-house conversion, the connection and the per household share of the incremental gas network. Alternatively, it could be that the gas price of $5.10 per GJ includes the revenue required for system investment. Slovenian results belie both assumptions and suggest that a higher price for gas should be used. The Slovenian price would be reasonable since one-third of total delivered cost often covers total distribution system cost.
Two factors more than offset the underestimate of gas costs. New residential gas heating boilers at a cost of $3,000 should operate at 90.0 percent rather than 75.0 percent

Table 3
Item Units Gas Conversion Cost
$/G J Gas Price 1994
Gross Cubic Meters Per HH
Heating Degree Days Per Year
Gas Heat Efficiency
Annual Purchases GJ Space Heat GJ Water Heat GJ
Annual Fuel Cost Per HH
Annual Maintenance Per HH
Amortization Per HH
Total Annual Cost Per HH Adjusted For HDD Adjusted For Volume Adjusted For Both
Persons Per Household
Net Disposable Income Per HH p.a.
Slovenia Poland $3,300 $3,000
$7.45 $5.10
245 500
3,264 3,516
90.0% 75.0%
62.5 133.3 55.8 6.7
$466 $68 1
Ratio 90.9%
68.5%
203.7%
107.7%
83.3%
213.3%
146.2%
66 oil
$288 $488
$820 $1,229 $851 $1,229
$1,251 $1,229 $1,316 $1,229
3.3
$6,816
30.9%
169.7%
149.9% 144.3%
' 98.3% 93.4%

Podhale Geothermale Economic Review Report PRIDE
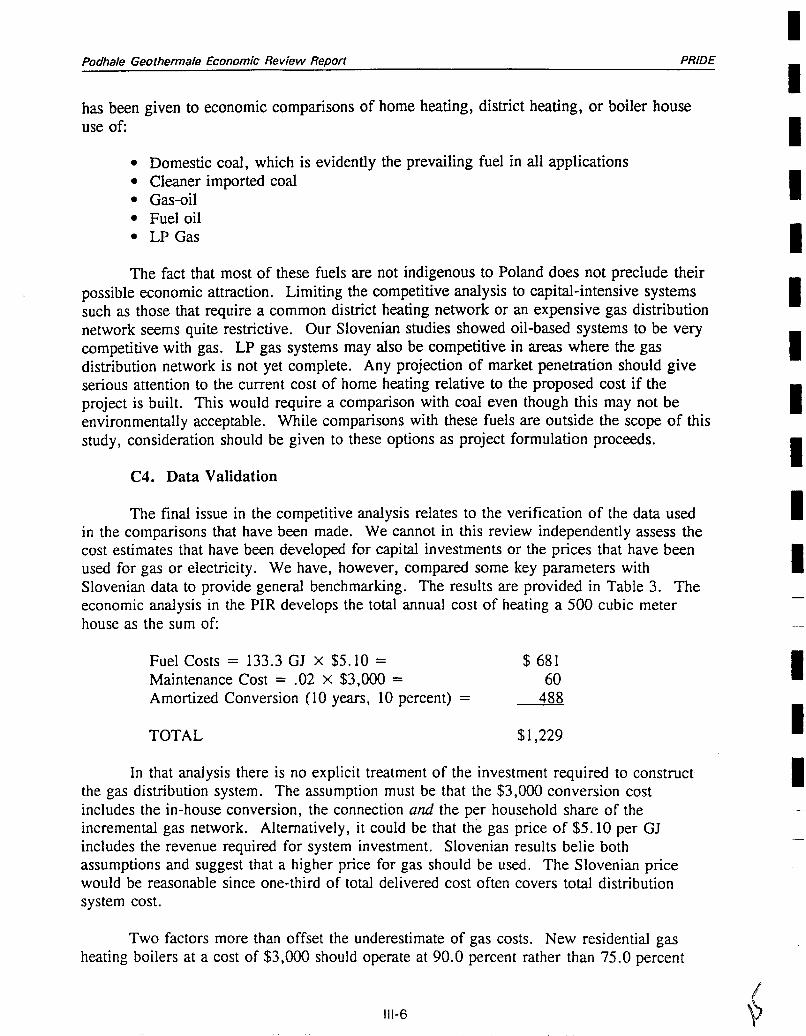
efficiency, according to Slovenia data. The amortization calculation is also based on punitive assumptions. A system with an expected life of 30 years should not be amortized over 10 years. The assumption of a 10.0 percent household discount rate also seems excessive. We would suggest the analysis shown in Table 4 which assumes:
The consumer finances the conversion cost based on an 80.0 percent loan for ten years at a real interest rate of 10.0 percent.
The gas system is worth its depreciated value on a straight-line basis at the end of twenty years.
Gas purchases equal the net usage divided by an efficiency of 90.0 percent. Net usage is estimated at 80.0 percent of that for uncontrolled district heating systems.
The gas purchase price for areas requiring a new gas distribution network is $7.45 per GJ.
Consumers use a real discount rate of 6.0 percent in evaluating their investment options.
The total annual cost for gas heating is thus estimated to be $1,040. If we assume net usage is the same for individual and district heat systems, this cost would be $1,215.
Although this result would seem to confirm the existing analyses, it highlights a critical issue. For areas where no added investment is required in the gas distribution network, the cost to heat the reference house using 80 GJ would fall to $818, which is below the geothermal cost. The area where the incremental cost of the gas network is probably lowest is in Zakopane, which already has a partial grid and presumably high densities. Furthermore, gas-oil or LPG systems tend to have operating costs close to gas, but require no gas network investment. It appears that an expanded gas network in Zakopane, coupled with gas-oil or LP based systems in less densely developed areas, might be cost competitive with geothermal and would involve much lower risk. Verification of this possibility would require a sound gas expansion plan and cost estimate for appropriate areas and solid price projections for gas, gas-oil, and LP gas. If Zakopane is excluded, the project must be scaled down from the alternatives evaluated in the PIR to be economically viable.
It should also be recognized that the existing studies provide economic comparisons on a per-unit-delivered price basis. This is appropriate only if the demand is the same under all options considered. It is not clear whether the geothermal plan costs include thermostatic valves and metering as discussed in the PIR @. 48). If they do not, use is likely to be significantly greater for the geothermal district heat system thin for individualized systems with separate controls that allow set-backs at night and when homes are not occupied. We have assumed that an uncontrolled district heating system would require net heat per household of 100.0 GJ per year, compared to individual systems that require 80.0 GJ per Year.
Calculation of the FOM, which is the final output of the competitive analysis in Quadrant I1 of the general model, requires a life cycle cost estimate of the geothermal option

hdhale Geothemale Economic Review Re~ort PRIDE
from the consumer's perspective. The potential consumer will be faced with an investment to convert the present heating system to the district heating system; the maintenance costs on the new system; plus the annual payment to the district heating distributor. Table 2 showed that the sales price to the consumer for the proposed geothermal district heating system would be:
Without Nowy Targ $7.64 per GJ if sales are 1,185 TJ With Nowy Targ $6.75 per GJ if sales are 2,017 TJ
Conversion costs in the PIR are estimated as:
$ BIdgs. Per Bldg. Without Nowy Targ $18,100 9,900 $1,828 With Nowy Targ $24,400 15,000 $1,627
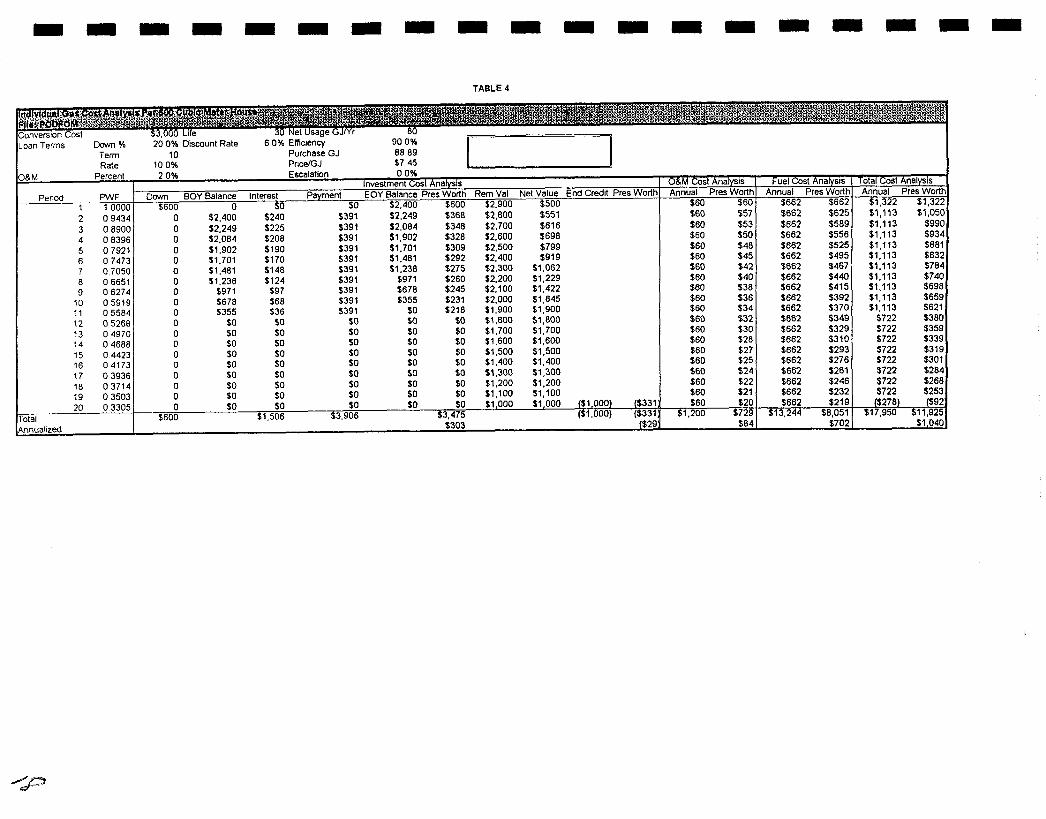
Tables 5 and 6 develop the life-cycle costs for a 500 cubic meter house based on these inputs for the two alternative projects and amortization methods which are consistent with those used to evaluate individual gas systems. The annualized costs and resultant FOMs relative to individual gas systems are:
Annual Cost FOM
Without Nowy Targ $1,016 1.02 With Nowy Targ $899 1.16
C5. Summary of Issues In The Competitive Analysis
The existing data are not sufficient to allow calculation of FOMs for existing district heating systems, boiler houses, or non-residential buildings. Therefore, our analysis is suggestive but not decisive. The key issues identified in the competitive analysis include:
1. The alternative of a gas-fired district heating system is not likely to be competitive with a geothermal system if the cost estimates in the PIR are reasonable. Total investment costs are about $65 million for a gas-fired system (Table 18) and $83 million for geothermal (Table 15). The systems must produce 1,305 TJ per year. At 90.0 percent efficiency this would require 1,450 TJ per year of gas for the gas system and 173.7 TJ of gas for the geothermal system. Annual differences in gas cost for the two systems are then:
Gas-Fired 1,45Ox$3,700= $5,365,000 Geothermal 173.7 x $5,250 = 912.000
$4,453,000
Thus, at current gas prices, the difference in investment costs of $18 million is offset in about four years by fuel cost differences.
TABLE 5
0 $1.902 $190 $391 $1.701 5309 $2.500 $799 0 51.701 5170 $39 1 $1.481 $292 52.400 $919 0 $1 481 $148 539 1 51.238 $275 $2.300 $1.062 0 11.238 5124 $391 $971 5260 $2.200 $1.229
5678 $245 52.100 91.422 $355 $231 $2.000 11.645 SO $218 $1.900 $1.900
8 S1.W $1.800 $0 $1.700 $1.700 8 S1.W $1.600 SU $1.500 $1.500 8 51.400 $1.400
0 $1.464 $146 0 $1.372 $137 0 $1,271 $127 0 $1.160 $116 0 $1.038 ,$lo4
$217 5141 51,220 $1.003 1 1 0 5564 12 05266 13 04970 14 0 4686 15 04423 16 04173 17 0 3936 18 0.3714 19 03503 20 0.3305
Total Annuallzed
0 $217 $22 $238 $0 $133 $1.159 $1.159 0 $0 $0 $0 $0 $0 $1.098 $1.098 0 $0 $0 $0 $0 $0 $1.037 $1.037 0 $0 $0 $0 $0 $0 $976 $976 0 $0 $0 $0 SO 8 $915 $915 0 $0 $0 $0 $0 $0 $854 $854 0 $0 $0 $0 $0 8 $793 $793 0 $0 $0 $0 $0 $0 $732 5732 0 $0 $0 $0 8 $0 $671 $671 0 $0 $0 50 SO $0 $610 $610 ($810) (5202)
$366 $919 $2.383 $2.120 ($610) ($202) $185 ($18)
$37 $20 $37 $19 $37 $18 $37 $17 $37 $16 $37 $15 $37 $14 $37 $14 $37 $13 $37 $12 $732 $445
$39
$764 $427 $764 $402 $764 $380 $764 $358 $764 $338 $764 $319 $764 $301 $764 $284 $764 $268 $764 $253
$15.260 $9.269 $810
$1,039 $580 $801 $422 $801 $398 SO1 $375 801 $354 $801 $334 $801 $315 $801 $297 $801 $280 $191 $63
$18.151 $11.652 $1,016
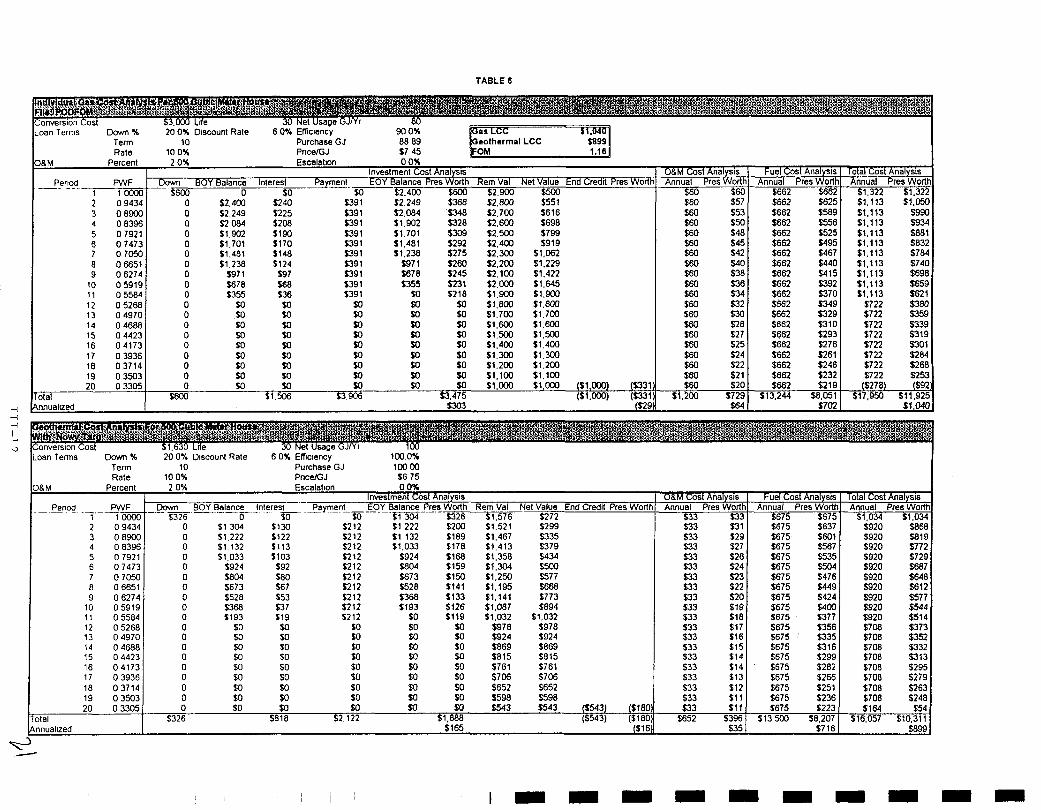
TABLE 6
Rate 10 OX PnceIGJ 57 45 1.161 Percent 2 0% Escalat~on 0 0%
Investment Cost Anal sis
- PWF - I BOY Ba lance te res t P2rnent ~ o Y Balance Pres A h Rem Val Net Value tnd Credit Pres Wort1 1 1 MM S600 0 SO SO %24W $Em $2900 S500
19 03503 0 SO I0 20 03305 0 50
Total 1 5 6 0 0
O8M Cost Analysis 1 Fuel Cost Analysis Annual Pres Worth1 Annual Pres Wortf
$60 $60 1 $662 $662
Total Cost Analysis Annual Pres Wortt
$1.322 $1.322 $1.113 $1,050 $1.113 %990 $1.113 $934 $1.113 $881 S1.113 $832 $1.113 $784 $1.113 $740 $1.113 $698 $1,113 8 5 9 S1,113 $621
S722 $380 5722 $359 S722 $339 $722 $319 S722 $301 $722 $284 $722 $268 $722 $253
- ? a % h % $1.040
- I Loan Terms Down % 20 0% D~scount Rate 6 0% ~mclency (00.0% Term 10 Purchase GJ 100 00 Rate 10 0% PnceIGJ S3 75
0 8 M Percent 2 0% Escalal~on 0 OX
3 08900 4 0 8396 5 07921 6 0 7473 7 07050 8 06651 9 0 6274
10 05919 11 0 5584 12 0 5268 13 04970 14 0 4688 15 0 4423 16 04173 17 0 3936 18 03714 19 03503 20 03305
Total Pnnual~zed
Total Cost Analys~s Annual Pres Wortl
$1.034 S1.034 $920 M6E
PWF -_ Per1.Y 1 1 OOOO 2 0 9434
0 $1222 $122 $212 $1 132 $189 51.467 8335 0 $1 132 5113 $212 $1 033 $178 $1 413 S379 0 91033 $103 $212 $924 S168 Sl 358 $434 0 $924 S92 $212 fB04 $159 $1.304 5500 0 5804 s80 $212 5673 S150 $1.250 S577 0 8 7 3 $67 $212 9528 $141 $1.195 $668 0 5528 $53 S212 S368 5133 $1.141 5773 0 S363 S37 $212 $193 $126 $1.087 S894 0 $193 119 $212 SO $119 S1.032 $1 032 0 SO So SO SO SO $978 $978 0 SO So $0 SO $0 $924 $924 0 $0 SO SU SO $0 $869 $869 0 $0 $0 $0 $0 $0 $815 $815 0 $0 SO $0 $0 SO $761 $761 0 $0 $0 $0 SO $0 $706 $706 0 $0 SO $0 $0 SO $652 $652 0 $0 $0 SO $0 SO $598 $598 o so m $0 m $0 $543 $543 ($543) ($180)
$326 $818 $2 122 $1.888 ($543) ($180) $165 ($161
O8M Cost Analysis Annual Pres Worth
$33 $33 S33 $31
Investment Cost Analysls Dov.n Eaace- jnterest Payment EOY_@lance Pres Worth Rern Val Net Value End Cred~t Pres Worth
$326 0 $5- - SO $1 304 S326 51.576 $272 0 $1 304 $130 5212 S1 222 S200 Sl 521 5299
tuel Cost Analys~s Annual Pres Worth
$675 $675 $675 $637
$33 $29 $33 $27 s33 $26 $33 $24 $33 $23 $33 $22 $33 ~ 2 0 $33 $19 $33 $18 533 $17 $33 816 $33 $15 $33 $14 $33 $14 $33 $13 $33 $12 $33 $11 $33 S l l
$652 $396 $35
S675 $601 $675 5567 S675 $535 6675 S504 $675 $476 $675 $449 $675 $424 $675 $400 $675 $377 $675 $356 $675 $335 $675 $316 $675 $299 $675 $282 $675 $266 $675 $251 $675 $236 S675 5223
113 500 $8.207 $716
$920 $815 $920 $772 $920 $72E S920 $687 $920 $646 $920 8612 $920 $577 $920 $544 $920 $514 $708 $373 $708 $352 $708 $332 $708 $313 S708 $295 $708 $279 $708 $263 $708 $248 $164 $54
$16,057 $10.311 $899

Section I!!.' The Existing Economic Analysis PRIDE
2. Gas prices are a key factor in the economic justification of the project yet remain quite unclear in the PIR. Gas prices cited in the PIR are:
Reference Variable $/GJ $/SCM (000)
Table 12 Gas from utility - 1994 6.81 228.1 Gas from utility - 1995 8.17 273.7
Table 13/14 Peaking Plant Gas 5.25 176.0 Table 17 Base Plant Gas 3.70 124.0 Page 60 Residential Gas 5.10 171 .O
Both the price structure for the gas utility serving this area and the economic value of natural gas in Podhale should be analyzed. If real escalation is anticipated, it would substantially improve the competitiveness of the geothermal system relative to individual gas heating.
3. The two projects now being considered depend centrally on detailed economic comparisons of gas distribution networks versus district heating systems in Zakopane and Nowy Targ. The data available in the studies reviewed here are insufficient for these analyses. Absent these two areas, the projects would have to be scaled back to remain economic. The analysis will require layouts of the gas distribution systems in sufficient detail to provide a preliminary design level of cost estimate.
4. Separate cost comparisons will be required for households, non-residential buildings, boiler houses, and district heating systems, with the geothermal district heating system costs separated as appropriate for these classes of customers. Available data are not sufficiently detailed to complete this analysis. The analysis illustrated here, however, provides the appropriate framework for the analysis.
5. The issue of different heat demand for controlled individual systems and uncontrolled district heat systems is important and should be carefully considered in project evaluation.
6. The potential use of fuels other than gas for individual heating systems should be addressed and cost comparisons prepared for other fuels that could be used.
7. Although they are outside the scope of this study, environmental benefits may be important in comparisons across different fuel types. Inclusion of environmental taxes in the cost analysis in the existing studies does not appear sufficient to reflect the differences in economic damage attributable to use of various fuels.
D. Existing Market Penetration Analyses (Quadrant III)
The PIR indicates that expected market penetrations will be:

Podhale Geothermale Economic Review Report PRIDE
Small Villages Villages Towns Block Centrals
No basis is provided for these estimates, nor is any distinction made between standard residential buildings and the individual large buildings that have been identified in Appendix I11 of the 1993 Report. No explanation is given of the source of heating that is assumed for buildings that do not convert to the proposed system. Table 9 of the PIR shows the penetrations assumed for each town. The composite penetrations are:
Nine Small Towns 73.6% Zakopane
TatrY 90.0% Houses 60.0%
SUBTOTAL 68.3% Nowy Targ 60.0 TOTAL 64.6
The general economic model bases penetrations on comparisons of life-cycle costs (FOMs) and a logistic curve calibrated to market survey responses to forecast penetrations. Without the needed market survey data, we cannot identify the logistic curve for Podhale. To continue our illustrative analysis, however, we have selected a representative curve based on our Slovenian experience and the following assumptions:
1. At an FOM = 1.0, the market will be split equally between competing technologies.
2. At an FOM = 1.5, 90 percent of the market would be served by the geothermal system.
3. The logistic curve is symmetric. Thus, at FOM = 0.5, 10 percent of the market would be geothermal.
The equation for the logistic curve is then:
ln ( - 1) = 4.3946 - 4.3946 X FOM S
where S equals the market share. The market shares can then be estimated as:
FOM Share
Without Nowy Targ 1.02 52.2% With Nowy Targ 1.16 66.9%
On this basis, it would appear that the penetrations that have been estimated in the PIR are quite high for the smaller project (68.3 vs. 52.2%) and slightly low for the larger project (64.6 vs 66.9%)

Section 1!1: The Existing Economic Analysis PRlD E
Our Slovenian experience revealed several key considerations in using survey data to calibrate the market penetration curves, including:
It is essential that the sample design and sample selection process be carefully controlled to avoid biased responses. If sample selection is not random and those conducting the survey are project proponents, the favorable responses are likely to be exaggerated.
Survey questions should be carefully designed to provide several corroborating responses regarding willingness and ability to convert within the desired time frame.
Surveys should be pre-tested to evaluate the uses of responses to locate the market penetration curve.
Different surveys may be needed for houses, boiler houses, and non-residential buildings.
Disposable household income is likely to be the best indicator of willingness and ability to pay for the proposed heating systems. The studies reviewed do not provide data on incomes, willingness to pay, or current costs for home and water heating. Data on these items should be obtained from market surveys.
E. Existing Market Potential Analysis (Quadrant Iv)
The analysis of market potential in the PIR is very simple and includes the following steps:
Estimate the population of the areas to be served by the proposed geothermal district heating system.
Estimate the number of buildings that would be served by the proposed systems.
Estimate the heat demand of the Tatry district heating system in Zakopane.
Estimate heat demand in Nowy Targ for central boiler houses and for individual buildings.
-. Convert the building estimates to volume estimates generally based on an assumed 700 cubic meters per building.
Convert the volume estimates to heating demand based on assumed consumption of 205.2 MJ per cubic meter per year.
Results of the market potential analyses are presented in Table 7. The towns in Table 7 have been ordered, based on distance from the proposed geothermal plant at Bialy Dunajec, to show the potential for alternative project scales or phasing. It should be noted,
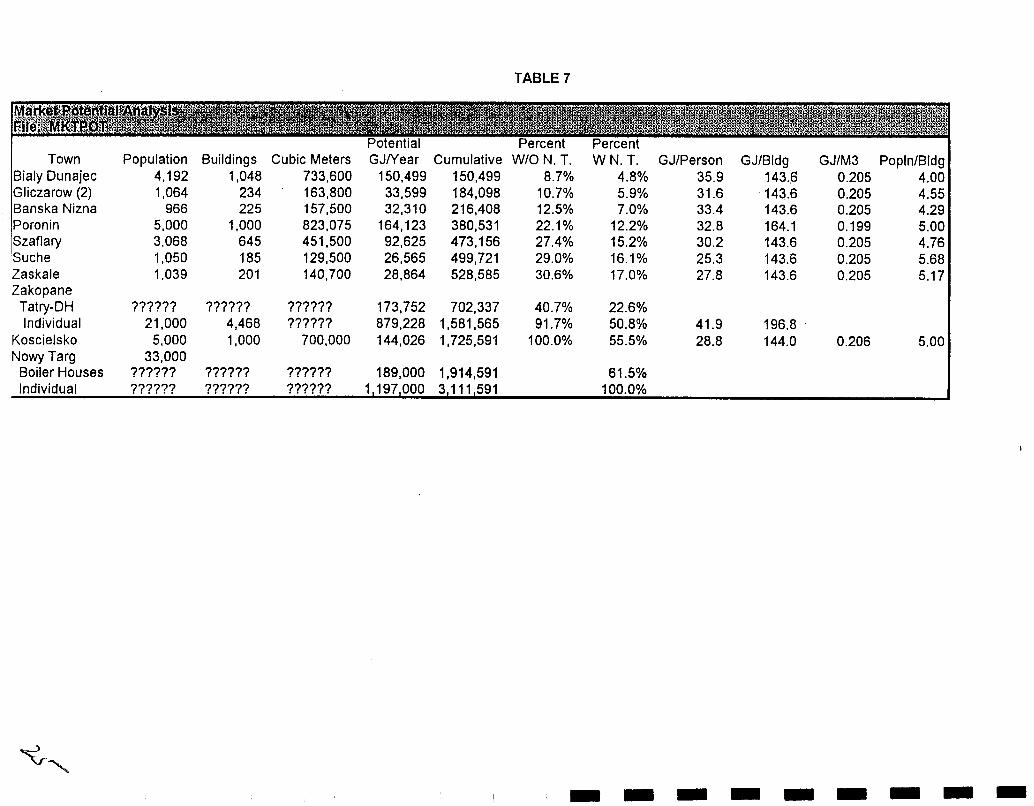
TABLE 7
Town Population Buildings Cubic Meters GJNear Cumulative WIO N. T. W N. T. GJIPerson GJlBldg GJlM3 PoplnIBldg Bialy Dunajec 4,192 1,048 733,600 150,499 150,499 8.7% 4.8% 35.9 143.6 0.205 4.00 Gliczarow (2) 1,064 234 163,800 33,599 184,098 10.7% 5.9% 31.6 143.6 0.205 4.55 Banska Nizna 966 225 157,500 32,310 216,408 12.5% 7.0% 33.4 143.6 0.205 4.29 Poronin 5,000 1,000 823,075 164,123 380,531 22.1 % 12.2% 32.8 164.1 0.199 5.00 Szaflary 3,068 645 451,500 92,625 473,156 27.4% 15.2% 30.2 143.6 0.205 4.76 Suche 1,050 185 129,500 26,565 499,721 29.0% 16.1% 25.3 143.6 0.205 5.68 Zaskale 1.039 20 1 140,700 28,864 528,585 30.6% 17.0% 27.8 143.6 0.205 5.17 Zakopane Tatry-DH ?????? ?????? ?????? 173,752 702,337 40.7% 22.6% Individual 21,000 4,468 ?????? 879,228 1,581,565 91.7% 50.8% 41.9 196.8 '
Koscielsko 5,000 1,000 700,000 144,026 1,725,591 100.0% 55.5% 28.8 144.0 0.206 5.00 Nowy Targ 33,000 Boiler Houses ?????? ?????? 777777 189,000 1,914,591 61 5 % Individual ?????? ?????? ?????? 1,197,000 3,111,591 100.0%

Section /I/: The Existing Economic Analysis PRlD E
however, that the pealang plant is tied to some existing facilities in Zakopane so that existing project plans are tied to a market that includes Zakopane.
The key findings of the existing market potential analyses are:
The cubic meters per building and GJ per cubic meter are roughly constant in all of the small towns except Poronin. In Poronin, buildings are larger (823 cubic meters) but use somewhat less heat per cubic meter (199.4 GJ).
Less than one-third of the potential market for the smaller project lies outside Zakopane. This excludes Koscielsko, which lies beyond Zakopane.
Almost 45 percent of the potential market for the larger project is in Nowy Targ.
Remaining questions regarding the market analyses include:
The heat demands per building appear to be theoretic calculations. Actual consumption data for a sample of buildings would be extremely useful in evaluating the theoretic estimates. Can data be obtained from local coal suppliers, the gas company, boiler-house operators and district-heating companies?
The methods and sources used to establish market potential in Zakopane and Nowy Targ are not clear. What data were used and how were areas chosen?
How were the data provided in the 1993 study on individual large facilities used in the market potential analysis?
How would heat requirements per building vary with weather?
How would heat requirements per building vary for individual heating systems with metering and thermostatic control versus an uncontrolled district heating system?
F. Existing Economic Analysis Summary
F1. General
The sections above discuss each of the major elements of project economics as they have been analyzed in the PIR and as we believe they should be amended based on currently available data. This section integrates those results to provide illustrative base case feasibility results. Differences from the PIR analyses are also indicated.
F2. Cost Analysis
Since we have not provided any independent estimates of costs for the proposed project, our analysis parallels the PIR. It is not clear how the PIR amortized the distribution pipeline cost estimates. We have simply assumed that they would be financed on the same terms as the geothermal plant and transmission grid (17 years and 7.5 percent for the smaller project). The net result is a cost to the final consumer of $7.64 per GJ or $6.75 per GJ for
Podhale Geothermale Economic Review Report PRIDE
the two projects, based on assumed net demands of 1,185 TJ and 2,017 TJ per year for the two projects.
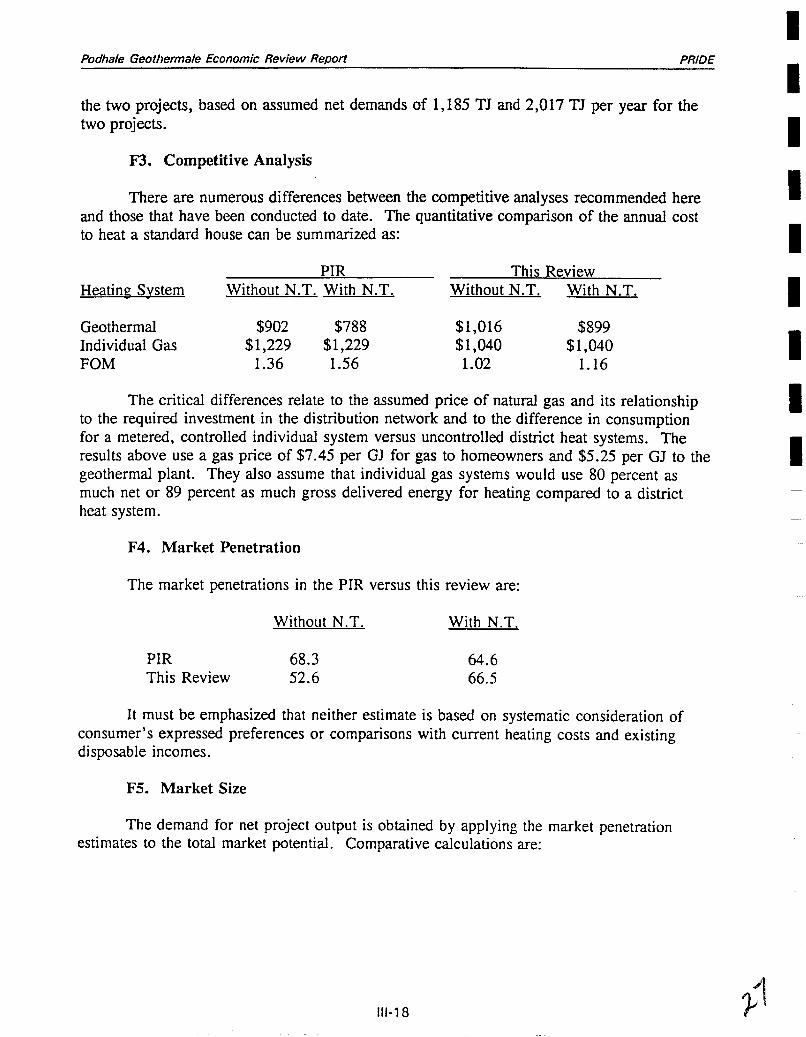
F3. Competitive Analysis
There are numerous differences between the competitive analyses recommended here and those that have been conducted to date. The quantitative comparison of the annual cost to heat a standard house can be summarized as:
PIR This Review Heating Svstem Without N.T. With N.T. Without N.T. With N.T.
Geothermal $902 $788 $1,016 $899 Individual Gas $1,229 $1,229 $1,040 $1,040 FOM 1.36 1.56 1.02 1.16
The critical differences relate to the assumed price of natural gas and its relationship to the required investment in the distribution network and to the difference in consumption for a metered, controlled individual system versus uncontrolled district heat systems. The results above use a gas price of $7.45 per GJ for gas to homeowners and $5.25 per GJ to the geothermal plant. They also assume that individual gas systems would use 80 percent as much net or 89 percent as much gross delivered energy for heating compared to a district heat system.
F4. Market Penetration
The market penetrations in the PIR versus this review are:
Without N.T. With N.T.
PIR 68.3 This Review 52.6
It must be emphasized that neither estimate is based on systematic consideration of consumer's expressed preferences or comparisons with current heating costs and existing disposable incomes.
F5. Market Size
The demand for net project output is obtained by applying the market penetration estimates to the total market potential. Comparative calculations are:

Section /I!: The Existing Economic Analysis PRIDE
PIR This Review Without N.T. With N.T. Without N.T. With N.T.
Market Potential (TJ) 1,734 3,120 1,726 3,112
Penetration (%) 68.3 64.6 52.6 66.5
Net Demand (TJ) 1,185 2,017 907 2,071 . -
Gross Demand (TJ) 1,305 2,237 998 2,296
These calculations assume that the total market potential estimates based on theoretical calculations can be verified by actual usage data.
F6. Conclusions
Given all of the assumptions documented above, we have shown that the existing demand estimates for the project are quite high if the Nowy Targ is excluded, but quite plausible if it is included. The cost implications of these findings are presented in Table 8. The required subsidies/profits can then be calculated as:
Without N.T. With N.T.
Revenue Required $/GJ Sold TJ Sold Revenue ($000)
Revenue Obtained $/GJ Sold TJ Sold Revenue ($000)
Annual (Subsidy)/Profit ($000) (1,648) 263
Present Worth (17, 7.5) ($000) ($15,544) (17, 7.325) $2,5 12
The project would thus require grant funding of about $15.5 million (23.9 percent) for the smaller project or could absorb cost increases of $2.5 million (2.7 percent) for the larger project. These conclusions rely centrally on many unsubstantiated assumptions and cannot be usefully interpreted without full consideration of those assumptions. To explore additional sensitivity evaluations, the spreadsheet model described in Section IV should be used.

Dlstr~butlon Losses Gross Heat Demand @ Plant SoM To D~stnbutor Sold To Custormer
Plant Investment/ Flxed Costs GBT Geothermal PlanVTrans
Distributor Distribution Pipes Customer Convers~onsX)onnectlons
GBT Captal Recovery Factor GBT Cepital Recovery
Dtstr~butor Capital Recovery Factor
Varlable Operating Cosls GBT Gas GJ IWlJOul L-d GJ H-0 13 125 822 GJ InlTJ Out 1-1 GJ H-0 13 309 965 GBT Pnce USWGJ H-013 [-I Pnce USDIGJ H-0 13 (-1 G8T Cost ($000) Calc $661 Cost ($000) Calc 51,628 GBT Electnc M M J Out [XJ Mwh Calc 3215.8 Calc 7192.8 M M J Out 1 3 Mwh G8T Pnce USWMm [sso.oo] Price USDlMwh -1 GBT Cost ($000) Calc $289 Cost ($000) Calc $647 GBT Operat~on $nJOui m j ($000) Calc $81 Allocated By Plant $/TJ Out -1 ($000) Calc $191 Allocated By Plant
Dtstributor Operat~on ($000) M l c $44 Allocated By Plant ($000) Calc $96 Allocated By Plant GBT Ma~ntenance f n J Out ($000) Calc f 323 Allocated By Plant $/TJ OU1 1-1 ($000) Calc $ 763 Allocated By Plant
D~stributor Ma~ntenance ($000) Calc $1 76 Allocated By Plant ($000) Calc $385 Allocated By Plant GBT Personnel 12 1 ~10,000J ($000) talc $78 Allocated By Plant 121 $10,000] ($000) Calc $80 Allocated By Plant
Dlstnbutor Personnel ($000) Calc $42 Allocated By Plant ($000) Calc 940 Allocated By Plant GBT Pollut~on Taw USDllJ Out -1 ($000) Calc $1 USDrrJ Out (-1 ($000) Calc $3 GBT Total ($000) M l c $1,433 ($000) Calc $3.313
D~str~butor Total ($000) Calc $262 ($000) Calc $521 Total T o t a l - - - - ($000) Calc $1,695 ($000) Calc $3,834
Cost Summary GBT Fixed CosWear ($000) $4.454 ($000) $6,569 GBT Variable CosWear ($000) 51,433 ($000) $3.313 GBT TotallCosWear ($000) $5.887 ($000) $9,882
Price To Distributor SffiJ $6.13 SIG J $4.50 Dlstrlbutor Purchase Costs ($000) $5,887 ($000) $9,882 Dtstributor F~xed CosWear ($000) $2,427 ($000) $3.310 D~stnbutor Variable CosWear ($000) $262 ($000) $521 Distributor TotallCosWear ($000) $8,577 ($000) $13,713
Price To Consumer SlGJ $9.46 $/G J $6 62
Total F~xed CosWear ($000) $6.882 ($000) $9.879 SlGJ $7 59 802% $lGJ $4.77 72.0%
Vanable CosWear ($000) $1.695 ($000) $3.834 SlG J $1 87 198% $/G J $1.85 28.0%

SECTION W
THE SPREADSHEET MODEL
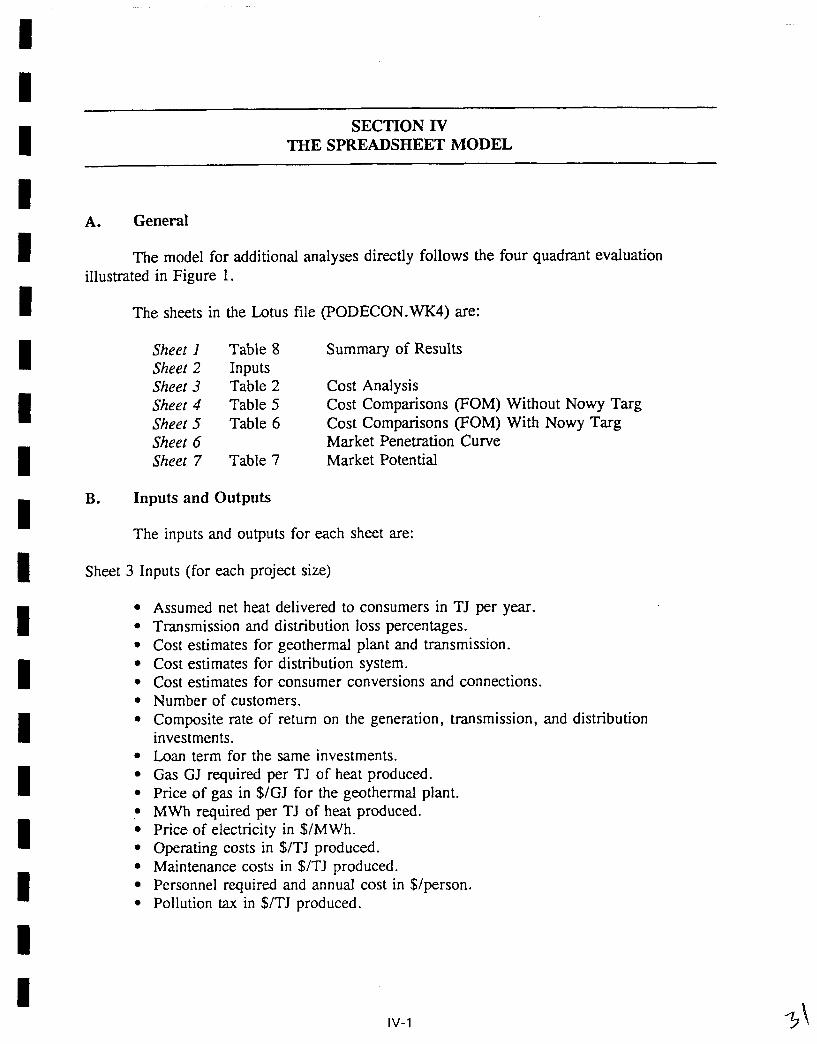
A. General
The model for additional analyses directly follows the four quadrant evaluation illustrated in Figure 1.
The sheets in the Lotus file (PODECON.WK4) are:
Sheer 1 Table 8 Summary of Results Sheer 2 Inputs Sheer 3 Table 2 Cost Analysis Sheer 4 Table 5 Cost Comparisons (FOM) Without Nowy Targ Sheet 5 Table 6 Cost Comparisons (FOM) With Nowy Targ Sheer 6 Market Penetration Curve Sheet 7 Table 7 Market Potential
B. Inputs and Outputs
The inputs and outputs for each sheet are:
Sheet 3 Inputs (for each project size)
Assumed net heat delivered to consumers in TJ per year. Transmission and distribution loss percentages. Cost estimates for geothermal plant and transmission. Cost estimates for distribution system. Cost estimates for consumer conversions and connections. Number of customers. Composite rate of return on the generation, transmission, and distribution investments. Loan term for the same investments. Gas GJ required per TJ of heat produced. Price of gas in $/GJ for the geothermal plant. MWh required per TJ of heat produced. Price of electricity in $/MWh. Operating costs in $/TJ produced. Maintenance costs in $/TJ produced. Personnel required and annual cost in $/person. Pollution tax in $/TJ produced.
SECTION N THE SPREADSHEET MODEL
Podhale Geothermale Economic Review Report PRIDE
Sheet 3 Outputs
$/GJ to the customer. $/GJ to the distributor. $ and $/GJ of fixed costs and variable costs.
Sheet 4 Inputs for project without Nowy Targ
Conversion cost for an individual gas heating system. Loan terms for consumer to finance the conversion. These include percent down, term, and rate. Maintenance costs as a percent of investment by the consumer. Life of the system. Consumer discount rate. Net GJ required for individual gas system to heat standard house. Efficiency of gas system. Gas purchase price for home heating. Escalation in gas price. Repeat the above items for the geothermal system except for fuel price, which comes from Sheet 3.
Sheet 4 Outputs for project without Nowy Targ
Life-cycle costs per household total and annualized for the alternative systems. FOM.
Sheet 5 Inputs and Outputs for project with Nowy Targ
Same as Sheet 4.
Sheet 6 Inputs for Market Penetration Curve
FOM for 90 percent market penetration. FOMs from Sheets 4 and 5.
Sheet 6 Outputs for Market Penetration Curve
Market share.
Sheet 7 Inputs
General cubic meters per building. Buildings by town. Poronin cubic meters per building. General UT per cubic meter. MJ per cubic meter for Poronin and Koscielsko. Annual demand in GJ for Tatry.

Section IV: The Spreadsheet Model PRIDE
Annual demand in GJ for other portions of Zakopane served. Annual demand in GJ for Nowy Targ boiler houses. Annual demand in GJ for other portions of Nowy Targ.
Sheet 7 Outputs
Potential demand in TJ per year with and without Nowy Targ.. Actual demand in TJ per year with and wtthout Nowy Targ.
Sheet 1 Inputs
Parameters from Sheet 3 except net demand. Net demand from Sheet 7.
Sheet 1 Outputs
Subsidies required or profits available on an annual and present-worth basis.
-
CONCLUSIONS AND RECOMMENDATIONS
SECTION V

SECTION V CONCLUSIONS AND RECOMMENDATIONS
A. General
As noted throughout this report, our analyses are contingent upon unverified assumptions, where necessary data are not available from existing sources. Nevertheless, the illustrative analyses do highlight several issues that will be critical in establishing the economic viability of this project. This section lists the specific conclusions we can reach based on the analyses shown and provides specific recommendations regarding the continuing development of the project.
B. Conclusions
B1. Large Project Viability
With Nowy Targ included and a gas price of $7.45 per GJ to customers, the proposed project appears commercially viable if all other fuels are excluded from consideration. This analysis assumes no real escalation in future gas prices.
B2. Small Project Viability
The project excluding Nowy Targ would require approximately $15 million in grant funding to be commercially viable using the same assumptions as in B1.
B3. Relation To Economic Analysis
The analysis in this report is a pre-requisite to, but not a substitute for, a full economic evaluation, which would be required for World Bank funding of the project. The World Bank analysis will require explicit time-phasing of the conversions and the investments, plus more detailed estimates of the avoided costs for alternate heating systems. The Bank will also be likely to include environmental benefits of geothermal versus gas or oil-based systems. The deciding criterion will be the project's internal rate-of-return. We have not explicitly calculated IRRs, but our analysis indicates that the IRR for the project with Nowy Targ would probably be in the 7.0 to 8.0 percent range excluding gas escalation and environmental benefits.
B4. Time Phasing
Our analysis assumes instantaneous conversion. The balancing of investment timing versus revenue from new consumers will be critical in making the project economic.
B5. Project Design Issues
The primary questions regarding project design include:

Podhale Geothermale Economic Review Report PRIDE
Does the peaking gas unit provide adequate backup to cover temporary reductions in yield from the wells?
What would happen to geothermal costs if loads are higher than assumed? Can the system handle load growth?
What heating systems will be used by those not served by the geothermal system?
B6. Project Risks
An assessment of project risks should be a central part of the justification of this project. The major risks of the geothermal project are:
Market Risk Geologic Risk Financial Risk
The project can usefully be viewed as a capital intensive investment that can provide affordable heating if:
Loads are sufficient to lower the per-unit fixed costs to a competitive level.
The system produces as expected without excessive reliance on expensive gas backup.
Market risk can be reduced by obtaining binding commitments to use project output or by thorough marketing studies that explore the range of options available and develop reasonable forecasts of the choices likely to be made by individuals. The former rather than the latter approach has been followed to date, but the level of commitment obtained is not clear. Yield risk can only be reduced through additional geologic studies that are likely to be expensive. Financial risk has not been addressed in this review. We have assumed the geothermal company must cover only the debt service and operating costs. Typically, financing provisions will include requirements for TIER ratios or debt service coverage greater than 1.0. In addition, funds would have to be accumulated to cover a warm year when sales are below average but debt service payment requirements remain fixed. These financial risks would tend to raise prices above those in our evaluation.
B7. Gas Feasibility Studies
Our analysis reveals the critical importance of serious feasibility studies for individual gas systems in the areas of Zakopane that are not served by Tatry and in Nowy Targ. Such studies can only be avoided if the cities make binding commitments to district heat. The cities should not do that without the feasibility studies.
B8. Additional Areas Of Concern
Several key areas of analysis have not as yet been considered. The major areas include:

Section V: Conclusions and Recommendations PRIDE
Consideration of fuels such as gas oil or LP gas in low density areas.
Consideration of life-cycle cost comparisons for boiler houses, district heating systems, and non-residential buildings.
Development of actual consumption data for district heating systems and individual heating systems using coal or gas now.
. - - Development of income data and current heating costs.
B9. Fuel Pricing
The pricing of fuels (especially gas) is the single most important variable in establishing economic feasibility. For example, the PODECON model shows that use of $5.10 per GJ for gas as in the PIR rather than $7.45 per GJ used in this review changes the large project from slightly profitable to having a $36 million deficit.
C. Recommendations
C1. General
Based on the conclusions above, we recommend the following focus for future project formulation efforts.
C2. Need For Market Studies
Unless firm commitments are obtained, market studies should be prepared that increase the certainty that desired conversions can be obtained.
C3. Market Study Components
The market studies should include:
Layouts and cost estimates for gas distribution systems in Zakopane and Nowy Targ .
A forecast of future price and availability of gas, LP gas, and gas oil in the Podhale region. The gas price should be specifically related to the needed investments in the local distribution systems within a financial forecast for the local gas company.
Random market surveys that test consumer opinions of both gas and geothermal systems and their willingness to pay for the new systems.
The surveys should also obtain data on incomes; costs for current heating systems; and expected returns on investments.
Actual usage data for present fuels used for space heating.

Podhale Geothermale Economic Review Report PRIDE
Separate life-cycle cost comparisons for all of the major consumer groups.
C4. Review Of This Study
This study should be provided to the Danish consultants to determine how much additional data are already available and to ensure that survey efforts are consistent with the needs identified here. World Bank economists should also review this study to ensure that their needs are recognized.
C5. Geologic Studies
Additional geologic studies should be completed to fully assess yield risks and to ensure proper sizing of backup capability.
C6. Project Design Studies
Project design studies should focus on project segmentation and phasing to match investments and revenue as closely as possible and on optimization of back-up systems.
C7. Economic Analysis
As the necessary inputs become available, the analysis here should be extended to provide an economic analysis for World Bank justification. The model should yield an internal rate-of-return both with and without environmental benefits.