Economic Models to Value Spectrum Rohit Prasad Associate Professor, MDI Gurgaon International...
50
Economic Models to Value Spectrum Rohit Prasad Associate Professor, MDI Gurgaon International Workshop on Spectrum Management National Institute of Communication Finance April 29, 2013
-
Upload
kathryn-rhoda-curtis -
Category
Documents
-
view
217 -
download
0
Transcript of Economic Models to Value Spectrum Rohit Prasad Associate Professor, MDI Gurgaon International...

Economic Models to Value Spectrum
Rohit PrasadAssociate Professor,
MDI Gurgaon
International Workshop on Spectrum ManagementNational Institute of Communication Finance
April 29, 2013

Agenda
• Tragedy of the Commons• Pricing Practices• Difference between market and administered
prices• Economic Models• Reflections on the 2013 auction

Thermometer TestUnderstanding Low High
Interest
Low HELP! I PREFER IPL
High I PREFER KAMAL LOVE IT!

Tragedy of the Commons

What is being valued?
• The right to exclusively transmit signals for a specified
• Service• Technology• Frequency range• Geographical areaWith rules on power levels etc.
Why is it being valued?
• Why are exclusive rights given?• Why are these rights valuable?

Tragedy of the commons
• If operators are given free access to a scarce resource there will be congestion/overuse and reduction of social welfare– Toll is recommended
• In the absence of spectrum sensing technology, even without scarcity, there could be congestion (unlike roads)
Hence exclusive rights

Why rights valuable?
• Those given rights earn supernormal profits, and these supernormal profits represent the value of the rights

Example
Consider a common pasture of a village where the five people can potentially graze their cattle. Each head of cattle costs Rs. 100 which can be raised at 13% interest. Thus Rs. 13 is the marginal cost of putting another cattle to pasture. As the number increases the value reduces due to the lower availability of pasture per cattle.

No. of cattle
Price per cattle at the end of 1 year
Average Revenue per cattle
Total revenue from grazing
Marginal revenue
Excess over interest due to bank
1 126 26 26 26 132 119 19 38 12 -13 114 14 42 4 -94 111 11 44 2 -115 109 9 45 1 -12
Exercise 1: How many cattle will graze?
Exercise 2: How many cattle should graze?
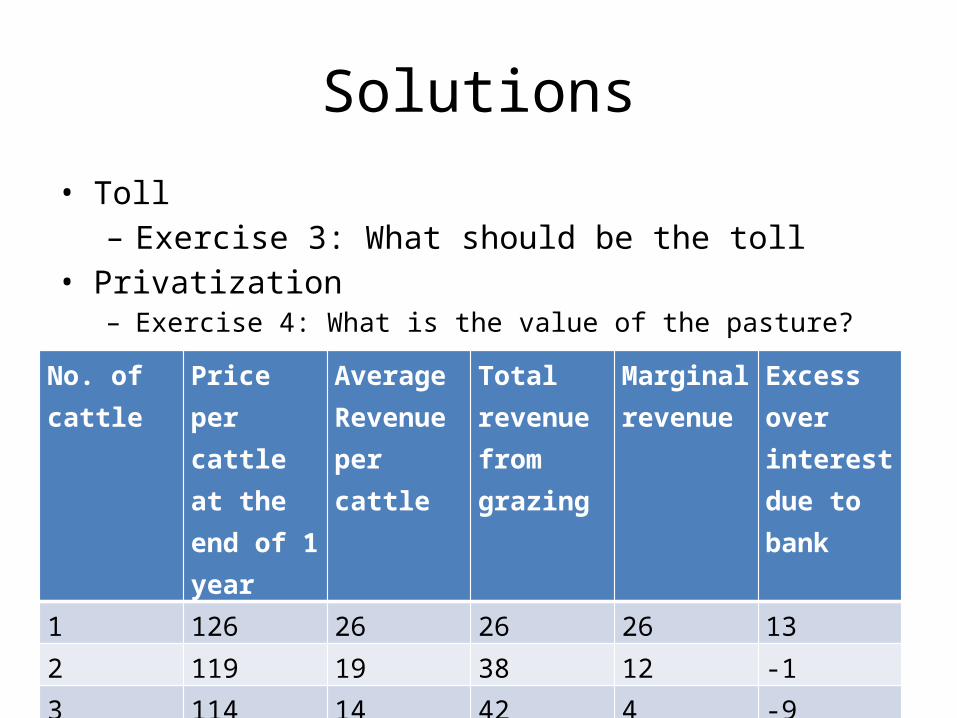
Solutions
• Toll – Exercise 3: What should be the toll
• Privatization– Exercise 4: What is the value of the pasture?
No. of cattle
Price per cattle at the end of 1 year
Average Revenue per cattle
Total revenue from grazing
Marginal revenue
Excess over interest due to bank
1 126 26 26 26 132 119 19 38 12 -13 114 14 42 4 -94 111 11 44 2 -115 109 9 45 1 -12

Thermometer TestUnderstanding Low High
Interest
Low HELP! I PREFER IPL
High I PREFER KAMAL LOVE IT!

Mechanisms to discover value

Mechanisms to discover value
• Market mechanism– Operators gather data and build models, based on
which they place bids in an auction• Bureaucratic mechanism– Bureaucrats gather data and build models, based
on which they decide on an administered price – May use a discount– Administered price may be different from value

Pricing Practice
• Captive users use radio frequencies for their communication network• not in the business of providing telecom service
• Commercial users in the business of providing telecom services using radio frequencies
• Most spectrum in control of government agencies – captive users

Pricing Practice
• Auctions – License (2G spectrum) in 1995– Migrated to revenue share in 1999– License (2G spectrum) in 2001, 2012-2013– 3G, BWA spectrum in 2010
• 2001 to 2012: 2G ‘spectrum price’ benchmarked to value discovered in 2001 auction – administered price progressively diverges from
market value

Pricing PracticeAuction Administered Price
Commercial spectrum
1995, 2001, 2010, 2012-13
1999, 2001-2008
Captive spectrum NA Since 1980s

Sample Calculation for Captive Spectrum
• A. Royalty charges for single carrier radio spectrum (Usually below 1 GHz). – Annual Royalty per Carrier (in Rs.) = MxW, where, M is distance factor and W
is bandwidth factor– Values of M are:
Distance Category Max. Distance
(Km)
Royalty(in Rs.)
I <= 2 1500
II <= 5 3000
III >5 <= 25 6000
IV >25 <= 60 12000
V >60 <= 120 22500
VI >120 <= 500 37500
VII >500 50000

Limitations
• Band neutral• Demand neutral• Geography neutral• Technology neutral

Administered Price for UAS License


Subscriber Linked Criteria
• Additional spectrum beyond startup amount allocated on the basis on subscriber milestones and attracts additional usage charges

Sample Subscriber Linked Criteria

Difference between market and administered price

Difference between market and administered price
Market Price Administered Price
Based on bidding Based on administrative decision
Based on market information Based on administrative information
Does not take social impact into account ( externalities)
Takes social impact into account ( externalities)
Susceptible to market collusion Susceptible to misuse of discretionary power
Administrative pricing in India has tended to be• focused on capabilities rather than demand• unchanging over long periods (static) rather than responsive to changing conditions ( dynamic)• driven by engineers rather than economists• Non-transparent

EXTERNALITIES AND MARKET INEFFICIENCY
An externality refers to the uncompensated impact of one person’s actions on the well-being of a bystander.
• Externalities cause markets to be inefficient, and thus fail to maximize total surplus.
• Two types of externalities1. Negative : Adverse Impact on the bystander.2. Positive: Beneficial Impact on the bystander.

Externalities: Examples
Negative Externalities:– Automobile exhaust– Cigarette smoking– Carbon emissions of telecom towers
Positive Externalities:– Research into new technologies– Diffusion of mobile telephony and data services• Provision of basic services• Productivity increase

EXTERNALITIES AND MARKET INEFFICIENCY
• Negative externalities lead markets to produce a larger quantity than is socially desirable at lower price– Tax needed
• Positive externalities lead markets to produce a smaller quantity than is socially desirable at higher price– Subsidy needed

Economic Models of Valuation

Economic Models of Valuation
• “Nothing is more useful than water; but it will purchase scarce anything. A diamond on the contrary, has scarce any value in use, but a great quantity of other goods may …be had in exchange of it.” Adam Smith

Economic Models of Valuation
• Focuses on demand as well as supply• Values something in terms of the additional
surplus earned by its possession ( opportunity cost)
• Explicitly factors externalities

Economic Models
• Cash Flow • Production Function• Benchmarking with closest market value

Thermometer TestUnderstanding Low High
Interest
Low HELP! I PREFER IPL
High I PREFER KAMAL LOVE IT!

Cash Flow Method
• Imagine you get access to a park• Using some playground equipment I am able to
earn Rs. 100 of revenue• My costs are Rs. 40• What is my profit? • If I had put the investment I made in the park in
the next best alternative I would have made Rs. 35• What is my ‘supernormal profit’? • Exercise 5: What is the value of the park to me?

Cash Flow Method
• 25/(1+r) + 25/(1+r)^2 + …• Problem: the earning in the alternative investment
cannot be determined without knowing the value of the park
• So we are going to have to solve an equation!• Assume park was being given for a year• Let the rate of interest be 10%• Denote value by v• Earning in alternative investment = v.10%• Then v = (60 – v. 10%)/(1+ 10%)
Profit

• Suppose park being given in perpetuity• V = (60 – v. 10%)/(1+ 10%) + (60 – v. 10%)/(1+
10%)2 + (60 – v. 10%)/(1+ 10%)3 + … • Using formula on sum of geometric series,• V = (60 – v. 10%)/ 10%• V = 60/(2. 10%)
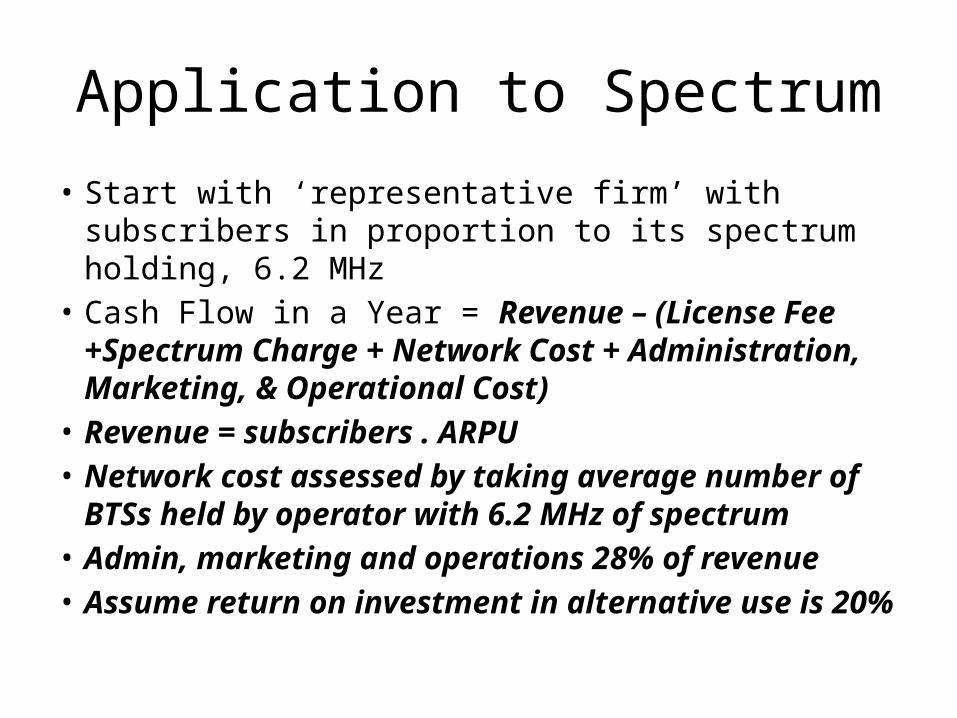
Application to Spectrum• Start with ‘representative firm’ with subscribers in proportion to its
spectrum holding, 6.2 MHz• Cash Flow in a Year = Revenue – (License Fee +Spectrum
Charge + Network Cost + Administration, Marketing, & Operational Cost)
• Revenue = subscribers . ARPU• Network cost assessed by taking average number
of BTSs held by operator with 6.2 MHz of spectrum• Admin, marketing and operations 28% of revenue• Assume return on investment in alternative use is
20%

Extracting Value of 1800 MHz
• Let the percentage of 900 MHz spectrum be 60%• Then 60%. Value of 900 MHz + 40%. Value of 1800 MHz =
value of blended spectrum• Let ‘k’ represent the additional productivity of 900
MHz spectrum– This is different in different markets
60%. K. Value of 1800 MHz + 40%. Value of 1800 MHz = value of blended spectrum
Solve equation for value of 1800 MHz

Service AreaPrice of contracted spectrum
Metro% of 900 MHz spectrum
Price of 1800 Mhz spectrum
Delhi 57.1 109.81Mumbai 54.8 74.71Kolkata 49.3 37.25Category A 0.00Maharashtra 57.9 82.53Gujarat 63.1 107.41Andhra Pradesh 57.9 110.12Karnataka 57.9 98.14Tamil Nadu 56.6 136.26Category B 0.00Kerala 60.78 55.03Punjab 71.56 53.64Haryana 66.67 9.46Uttar Pradesh (West) 60.78 43.40Uttar Pradesh (East) 57.41 116.45Rajasthan 60.19 79.77Madhya Pradesh 55.86 66.24West Bengal, Andaman & Nicobar 57.39 32.31Category CHimachal Pradesh 58.49 6.97Bihar 57.41 38.07Orissa 66.67 18.15Assam 66.67 7.76North East 78.57 7.91Jammu & Kashmir 100.00 5.67
Table 7: Price of contracted spectrum 1800 MHzRs. Crore per MHz 2010 (20 year license)

Thermometer TestUnderstanding Low High
Interest
Low HELP! I PREFER IPL
High I PREFER KAMAL LOVE IT!

Production Function Method
• Production function gives the total number of subscribers that can be serviced, for any given combination of spectrum and BTSs– Derived by statistical estimation using data on
subscribers, spectrum and BTSs of operators in relevant circles over relevant years
• Allows estimation of the number of BTSs saved by possessing an additional unit of spectrum
• Cost of BTSs saved represents value of spectrum

Method of estimation
• We estimate a Cobb Douglas production function
• Very general specification that encompasses diminishing returns, economies of scale
• Used widely in the literature
zyAX lnlnlnln
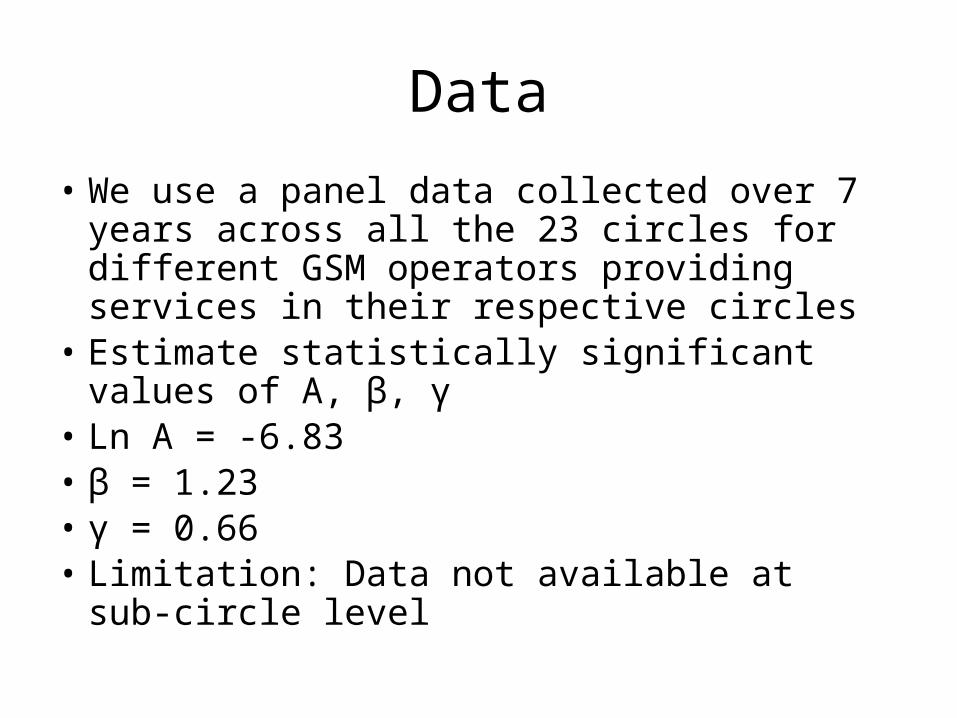
Data
• We use a panel data collected over 7 years across all the 23 circles for different GSM operators providing services in their respective circles
• Estimate statistically significant values of A, β, γ• Ln A = -6.83• β = 1.23• γ = 0.66• Limitation: Data not available at sub-circle level

Seminar @ NUS 49Feb 12, 2009
Model for Allocative Efficiency
First Order Condition
Price RatioQuantity Ratio Productivity Ratio

Benchmarking with Auction Values
• Many methods – Sector -specific– General
• Sector-specific– Value in 2001 . Percentage increase in revenue per
MHz/Percentage increase in BTSs– Adaptive expectations
• Such methods are relevant at proximate times

Limitations of Economic Models
• Sensitive to assumptions• Difficult to factor externalities

Auctions
• Need to guard against collusion ( reserve price)
• Possibility of winner’s curse

Failure of 1800 MHz auction
• Divergence between value of 1800 MHz and 2100 MHz– 1800 MHz 40-50 % in value– More valuable in cat B and cat C circles
• That is why benchmarking reserve price to 2100 MHz resulted in poor bidding in Metros but OK results in cat B and cat C
Concluding Thoughts
• Economists and engineers both invaluable for valuation
• Academics and practitioners need to provide inputs
• Auctions cannot be discarded without understanding reasons for failure
• New technological possibilities
Can NICF lead the way?

Thank you